Bangladeshi vs Immigrants from Africa Disability Age 5 to 17

COMPARE

Bangladeshi
Race
Ancestry
AfghanAfricanAlaska NativeAlaskan AthabascanAlbanianAleutAlsatianAmericanApacheArabArapahoArgentineanArmenianAssyrian/Chaldean/SyriacAustralianAustrianBahamianBangladeshiBarbadianBasqueBelgianBelizeanBermudanBhutaneseBlackfeetBolivianBrazilianBritishBritish West IndianBulgarianBurmeseCajunCambodianCanadianCape VerdeanCarpatho RusynCelticCentral AmericanCentral American IndianCherokeeCheyenneChickasawChileanChineseChippewaChoctawColombianColvilleComancheCosta RicanCreeCreekCroatianCrowCubanCypriotCzechCzechoslovakianDanishDelawareDominicanDutchDutch West IndianEastern EuropeanEcuadorianEgyptianEnglishEstonianEthiopianEuropeanFijianFilipinoFinnishFrenchFrench American IndianFrench CanadianGermanGerman RussianGhanaianGreekGuamanian/ChamorroGuatemalanGuyaneseHaitianHmongHonduranHopiHoumaHungarianIcelanderIndian (Asian)IndonesianInupiatIranianIraqiIrishIroquoisIsraeliItalianJamaicanJapaneseJordanianKenyanKiowaKoreanLaotianLatvianLebaneseLiberianLithuanianLumbeeLuxembourgerMacedonianMalaysianMalteseMarshalleseMenomineeMexicanMexican American IndianMongolianMoroccanNative HawaiianNavajoNepaleseNew ZealanderNicaraguanNigerianNorthern EuropeanNorwegianOkinawanOsageOttawaPaiutePakistaniPalestinianPanamanianParaguayanPennsylvania GermanPeruvianPimaPolishPortuguesePotawatomiPuebloPuerto RicanPuget Sound SalishRomanianRussianSalvadoranSamoanScandinavianScotch-IrishScottishSeminoleSenegaleseSerbianShoshoneSierra LeoneanSiouxSlavicSlovakSloveneSomaliSouth AfricanSouth AmericanSouth American IndianSoviet UnionSpaniardSpanishSpanish AmericanSpanish American IndianSri LankanSubsaharan AfricanSudaneseSwedishSwissSyrianTaiwaneseThaiTlingit-HaidaTohono O'OdhamTonganTrinidadian and TobagonianTsimshianTurkishU.S. Virgin IslanderUgandanUkrainianUruguayanUteVenezuelanVietnameseWelshWest IndianYakamaYaquiYugoslavianYumanYup'ikZimbabwean
Immigration
NonimmigrantsImmigrantsAfghanistanAlbaniaArgentinaArmeniaAsiaAustraliaAustriaBahamasBangladeshBarbadosBelarusBelgiumBelizeBoliviaBosnia and HerzegovinaBrazilBulgariaBurma/MyanmarCabo VerdeCambodiaCameroonCanadaCaribbeanCentral AmericaChileChinaColombiaCongoCosta RicaCroatiaCubaCzechoslovakiaDenmarkDominicaDominican RepublicEastern AfricaEastern AsiaEastern EuropeEcuadorEgyptEl SalvadorEnglandEritreaEthiopiaEuropeFijiFranceGermanyGhanaGreeceGrenadaGuatemalaGuyanaHaitiHondurasHong KongHungaryIndiaIndonesiaIranIraqIrelandIsraelItalyJamaicaJapanJordanKazakhstanKenyaKoreaKuwaitLaosLatin AmericaLatviaLebanonLiberiaLithuaniaMalaysiaMexicoMicronesiaMiddle AfricaMoldovaMoroccoNepalNetherlandsNicaraguaNigeriaNorth AmericaNorth MacedoniaNorthern AfricaNorthern EuropeNorwayOceaniaPakistanPanamaPeruPhilippinesPolandPortugalRomaniaRussiaSaudi ArabiaScotlandSenegalSerbiaSierra LeoneSingaporeSomaliaSouth AfricaSouth AmericaSouth Central AsiaSouth Eastern AsiaSouthern EuropeSpainSri LankaSt. Vincent and the GrenadinesSudanSwedenSwitzerlandSyriaTaiwanThailandTrinidad and TobagoTurkeyUgandaUkraineUruguayUzbekistanVenezuelaVietnamWest IndiesWestern AfricaWestern AsiaWestern EuropeYemenZaireZimbabweAzores
Immigrants from Africa
Race
Ancestry
AfghanAfricanAlaska NativeAlaskan AthabascanAlbanianAleutAlsatianAmericanApacheArabArapahoArgentineanArmenianAssyrian/Chaldean/SyriacAustralianAustrianBahamianBarbadianBasqueBelgianBelizeanBermudanBhutaneseBlackfeetBolivianBrazilianBritishBritish West IndianBulgarianBurmeseCajunCambodianCanadianCape VerdeanCarpatho RusynCelticCentral AmericanCentral American IndianCherokeeCheyenneChickasawChileanChineseChippewaChoctawColombianColvilleComancheCosta RicanCreeCreekCroatianCrowCubanCypriotCzechCzechoslovakianDanishDelawareDominicanDutchDutch West IndianEastern EuropeanEcuadorianEgyptianEnglishEstonianEthiopianEuropeanFijianFilipinoFinnishFrenchFrench American IndianFrench CanadianGermanGerman RussianGhanaianGreekGuamanian/ChamorroGuatemalanGuyaneseHaitianHmongHonduranHopiHoumaHungarianIcelanderIndian (Asian)IndonesianInupiatIranianIraqiIrishIroquoisIsraeliItalianJamaicanJapaneseJordanianKenyanKiowaKoreanLaotianLatvianLebaneseLiberianLithuanianLumbeeLuxembourgerMacedonianMalaysianMalteseMarshalleseMenomineeMexicanMexican American IndianMongolianMoroccanNative HawaiianNavajoNepaleseNew ZealanderNicaraguanNigerianNorthern EuropeanNorwegianOkinawanOsageOttawaPaiutePakistaniPalestinianPanamanianParaguayanPennsylvania GermanPeruvianPimaPolishPortuguesePotawatomiPuebloPuerto RicanPuget Sound SalishRomanianRussianSalvadoranSamoanScandinavianScotch-IrishScottishSeminoleSenegaleseSerbianShoshoneSierra LeoneanSiouxSlavicSlovakSloveneSomaliSouth AfricanSouth AmericanSouth American IndianSoviet UnionSpaniardSpanishSpanish AmericanSpanish American IndianSri LankanSubsaharan AfricanSudaneseSwedishSwissSyrianTaiwaneseThaiTlingit-HaidaTohono O'OdhamTonganTrinidadian and TobagonianTsimshianTurkishU.S. Virgin IslanderUgandanUkrainianUruguayanUteVenezuelanVietnameseWelshWest IndianYakamaYaquiYugoslavianYumanYup'ikZimbabwean
Immigration
NonimmigrantsImmigrantsAfghanistanAfricaAlbaniaArgentinaArmeniaAsiaAustraliaAustriaBahamasBangladeshBarbadosBelarusBelgiumBelizeBoliviaBosnia and HerzegovinaBrazilBulgariaBurma/MyanmarCabo VerdeCambodiaCameroonCanadaCaribbeanCentral AmericaChileChinaColombiaCongoCosta RicaCroatiaCubaCzechoslovakiaDenmarkDominicaDominican RepublicEastern AfricaEastern AsiaEastern EuropeEcuadorEgyptEl SalvadorEnglandEritreaEthiopiaEuropeFijiFranceGermanyGhanaGreeceGrenadaGuatemalaGuyanaHaitiHondurasHong KongHungaryIndiaIndonesiaIranIraqIrelandIsraelItalyJamaicaJapanJordanKazakhstanKenyaKoreaKuwaitLaosLatin AmericaLatviaLebanonLiberiaLithuaniaMalaysiaMexicoMicronesiaMiddle AfricaMoldovaMoroccoNepalNetherlandsNicaraguaNigeriaNorth AmericaNorth MacedoniaNorthern AfricaNorthern EuropeNorwayOceaniaPakistanPanamaPeruPhilippinesPolandPortugalRomaniaRussiaSaudi ArabiaScotlandSenegalSerbiaSierra LeoneSingaporeSomaliaSouth AfricaSouth AmericaSouth Central AsiaSouth Eastern AsiaSouthern EuropeSpainSri LankaSt. Vincent and the GrenadinesSudanSwedenSwitzerlandSyriaTaiwanThailandTrinidad and TobagoTurkeyUgandaUkraineUruguayUzbekistanVenezuelaVietnamWest IndiesWestern AfricaWestern AsiaWestern EuropeYemenZaireZimbabweAzores
Disability Age 5 to 17
Income
Poverty
Unemployment
Labor Participation
Family Structure
Vehicle Availability
Education Level
Disability

Disability Age 5 to 17 Comparison

Bangladeshis

Immigrants from Africa

Tragic
Poor
5.8%
DISABILITY AGE 5 TO 17
4.8/ 100
METRIC RATING
229th/ 347
METRIC RANK
5.7%
DISABILITY AGE 5 TO 17
10.8/ 100
METRIC RATING
206th/ 347
METRIC RANK

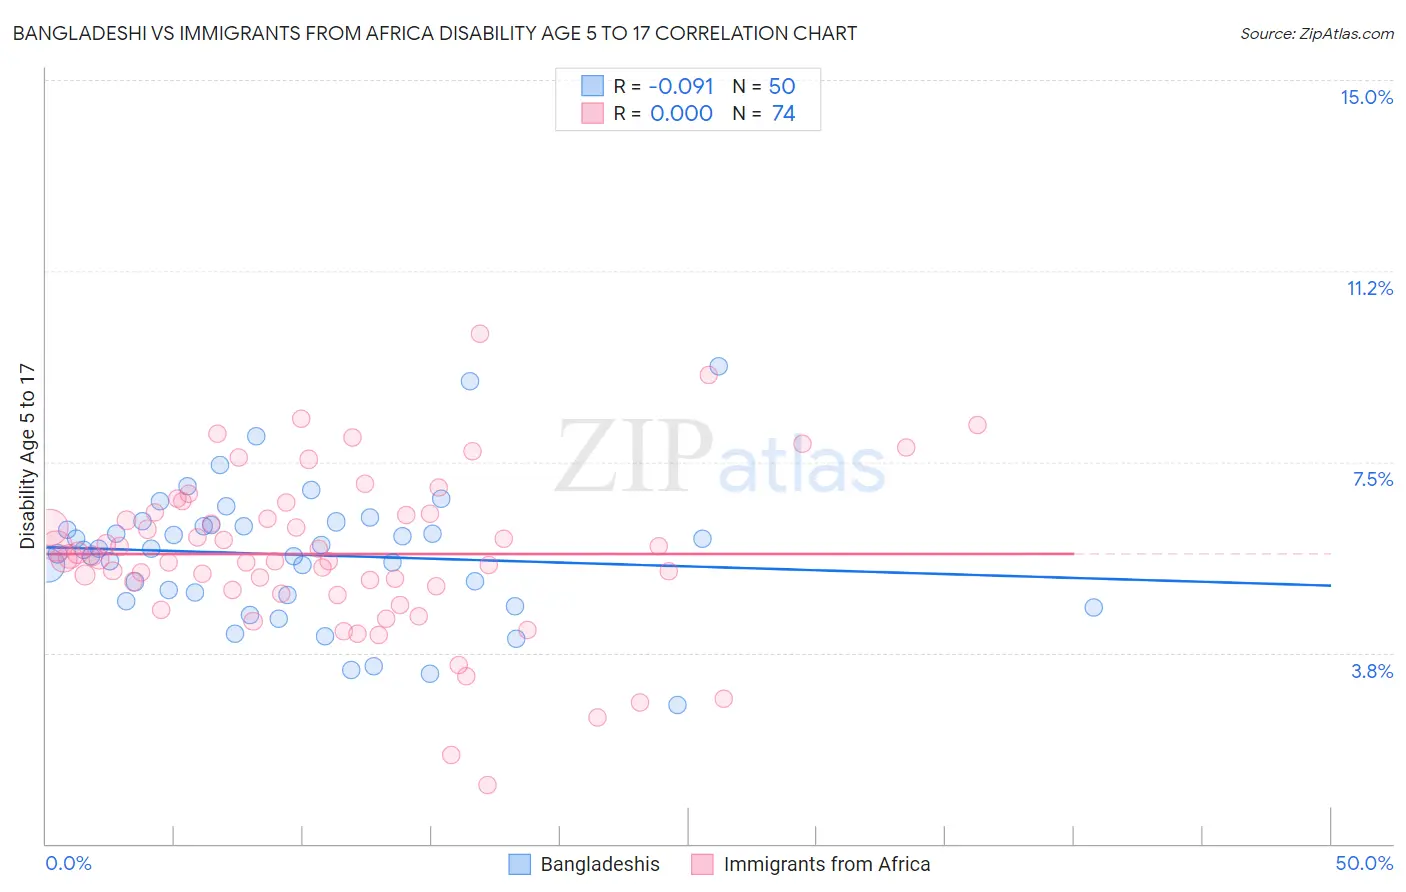
Bangladeshi vs Immigrants from Africa Disability Age 5 to 17 Correlation Chart

The statistical analysis conducted on geographies consisting of 140,952,749 people shows a slight negative correlation between the proportion of Bangladeshis and percentage of population with a disability between the ages 5 and 17 in the United States with a correlation coefficient (R) of -0.091 and weighted average of 5.8%. Similarly, the statistical analysis conducted on geographies consisting of 464,573,115 people shows no correlation between the proportion of Immigrants from Africa and percentage of population with a disability between the ages 5 and 17 in the United States with a correlation coefficient (R) of 0.000 and weighted average of 5.7%, a difference of 1.1%.
Bangladeshi vs Immigrants from Africa Disability Age 5 to 17

Disability Age 5 to 17 Correlation Summary

MeasurementBangladeshiImmigrants from Africa
Minimum2.7%1.2%
Maximum9.4%10.0%
Range6.7%8.9%
Mean5.7%5.7%
Median5.8%5.6%
Interquartile 25% (IQ1)4.9%5.0%
Interquartile 75% (IQ3)6.3%6.5%
Interquartile Range (IQR)1.4%1.5%
Standard Deviation (Sample)1.3%1.6%
Standard Deviation (Population)1.3%1.6%

Similar Demographics by Disability Age 5 to 17

Demographics Similar to Bangladeshis by Disability Age 5 to 17

In terms of disability age 5 to 17, the demographic groups most similar to Bangladeshis are Haitian (5.8%, a difference of 0.010%), Ghanaian (5.8%, a difference of 0.010%), European (5.8%, a difference of 0.080%), Swiss (5.8%, a difference of 0.090%), and British West Indian (5.8%, a difference of 0.17%).
DemographicsRating | RankDisability Age 5 to 17
Immigrants | Sudan
6.7
/100
|
#222
Tragic
5.8%
Alsatians
6.0
/100
|
#223
Tragic
5.8%
Mexicans
5.7
/100
|
#224
Tragic
5.8%
Guamanians/Chamorros
5.6
/100
|
#225
Tragic
5.8%
British West Indians
5.4
/100
|
#226
Tragic
5.8%
Swiss
5.1
/100
|
#227
Tragic
5.8%
Haitians
4.8
/100
|
#228
Tragic
5.8%
Bangladeshis
4.8
/100
|
#229
Tragic
5.8%
Ghanaians
4.7
/100
|
#230
Tragic
5.8%
Europeans
4.5
/100
|
#231
Tragic
5.8%
Immigrants | Laos
3.8
/100
|
#232
Tragic
5.8%
Immigrants | West Indies
3.5
/100
|
#233
Tragic
5.8%
Immigrants | Kenya
3.4
/100
|
#234
Tragic
5.8%
Malaysians
3.4
/100
|
#235
Tragic
5.8%
Immigrants | Brazil
3.2
/100
|
#236
Tragic
5.8%

Demographics Similar to Immigrants from Africa by Disability Age 5 to 17

In terms of disability age 5 to 17, the demographic groups most similar to Immigrants from Africa are Trinidadian and Tobagonian (5.7%, a difference of 0.0%), Moroccan (5.7%, a difference of 0.050%), Paiute (5.7%, a difference of 0.060%), Kenyan (5.8%, a difference of 0.10%), and Immigrants from Uganda (5.8%, a difference of 0.14%).
DemographicsRating | RankDisability Age 5 to 17
Northern Europeans
15.2
/100
|
#199
Poor
5.7%
Icelanders
14.6
/100
|
#200
Poor
5.7%
Basques
13.7
/100
|
#201
Poor
5.7%
Austrians
13.2
/100
|
#202
Poor
5.7%
Spanish American Indians
12.8
/100
|
#203
Poor
5.7%
Paiute
11.2
/100
|
#204
Poor
5.7%
Trinidadians and Tobagonians
10.8
/100
|
#205
Poor
5.7%
Immigrants | Africa
10.8
/100
|
#206
Poor
5.7%
Moroccans
10.4
/100
|
#207
Poor
5.7%
Kenyans
10.0
/100
|
#208
Poor
5.8%
Immigrants | Uganda
9.7
/100
|
#209
Tragic
5.8%
Immigrants | Haiti
9.5
/100
|
#210
Tragic
5.8%
Yugoslavians
9.1
/100
|
#211
Tragic
5.8%
Immigrants | Panama
8.7
/100
|
#212
Tragic
5.8%
Immigrants | Cameroon
8.3
/100
|
#213
Tragic
5.8%