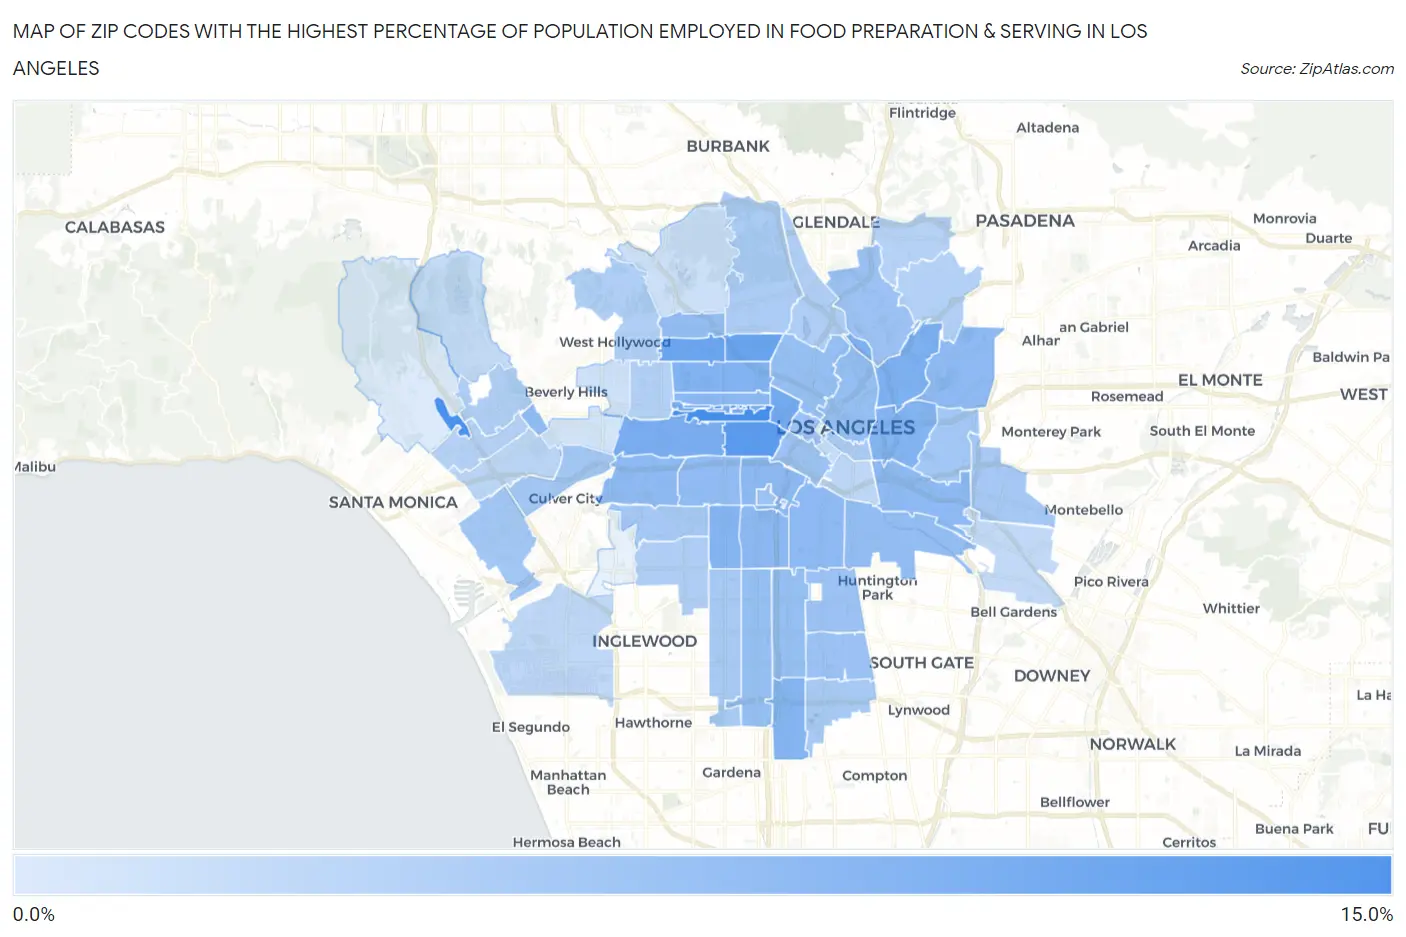
Zip Codes with the Highest Percentage of Population Employed in Food Preparation & Serving in Los Angeles, CA
RELATED REPORTS & OPTIONS
Food Preparation & Serving
Los Angeles
Compare Zip Codes
Map of Zip Codes with the Highest Percentage of Population Employed in Food Preparation & Serving in Los Angeles
0.0%
15.0%
Zip Codes with the Highest Percentage of Population Employed in Food Preparation & Serving in Los Angeles, CA
| Zip Code | % Employed | vs State | vs National | |
| 1. | 90005 | 14.8% | 5.4%(+9.43)#55 | 5.3%(+9.52)#1,006 |
| 2. | 90073 | 14.3% | 5.4%(+8.90)#58 | 5.3%(+9.00)#1,096 |
| 3. | 90006 | 13.1% | 5.4%(+7.72)#70 | 5.3%(+7.81)#1,369 |
| 4. | 90029 | 11.4% | 5.4%(+6.05)#91 | 5.3%(+6.15)#1,862 |
| 5. | 90038 | 11.1% | 5.4%(+5.75)#101 | 5.3%(+5.84)#1,990 |
| 6. | 90057 | 10.6% | 5.4%(+5.25)#112 | 5.3%(+5.35)#2,242 |
| 7. | 90010 | 10.2% | 5.4%(+4.78)#132 | 5.3%(+4.88)#2,511 |
| 8. | 90019 | 9.8% | 5.4%(+4.46)#146 | 5.3%(+4.56)#2,756 |
| 9. | 90031 | 9.5% | 5.4%(+4.09)#165 | 5.3%(+4.18)#3,084 |
| 10. | 90004 | 9.2% | 5.4%(+3.80)#172 | 5.3%(+3.90)#3,339 |
| 11. | 90033 | 9.0% | 5.4%(+3.65)#178 | 5.3%(+3.75)#3,493 |
| 12. | 90061 | 8.9% | 5.4%(+3.50)#183 | 5.3%(+3.59)#3,637 |
| 13. | 90062 | 8.7% | 5.4%(+3.35)#190 | 5.3%(+3.45)#3,806 |
| 14. | 90007 | 8.2% | 5.4%(+2.85)#207 | 5.3%(+2.95)#4,395 |
| 15. | 90020 | 8.2% | 5.4%(+2.84)#208 | 5.3%(+2.94)#4,403 |
| 16. | 90037 | 8.1% | 5.4%(+2.76)#212 | 5.3%(+2.86)#4,517 |
| 17. | 90023 | 8.0% | 5.4%(+2.67)#221 | 5.3%(+2.76)#4,655 |
| 18. | 90016 | 8.0% | 5.4%(+2.62)#226 | 5.3%(+2.72)#4,719 |
| 19. | 90011 | 8.0% | 5.4%(+2.61)#227 | 5.3%(+2.71)#4,735 |
| 20. | 90032 | 8.0% | 5.4%(+2.58)#232 | 5.3%(+2.67)#4,789 |
| 21. | 90018 | 7.8% | 5.4%(+2.44)#249 | 5.3%(+2.53)#5,012 |
| 22. | 90067 | 7.7% | 5.4%(+2.28)#259 | 5.3%(+2.37)#5,279 |
| 23. | 90028 | 7.6% | 5.4%(+2.18)#271 | 5.3%(+2.27)#5,452 |
| 24. | 90058 | 7.6% | 5.4%(+2.17)#273 | 5.3%(+2.26)#5,467 |
| 25. | 90026 | 7.4% | 5.4%(+2.05)#284 | 5.3%(+2.14)#5,687 |
| 26. | 90012 | 7.4% | 5.4%(+2.03)#286 | 5.3%(+2.12)#5,726 |
| 27. | 90044 | 7.4% | 5.4%(+1.99)#292 | 5.3%(+2.09)#5,798 |
| 28. | 90003 | 7.3% | 5.4%(+1.94)#297 | 5.3%(+2.04)#5,883 |
| 29. | 90065 | 7.0% | 5.4%(+1.62)#338 | 5.3%(+1.72)#6,543 |
| 30. | 90015 | 6.9% | 5.4%(+1.56)#350 | 5.3%(+1.66)#6,694 |
| 31. | 90002 | 6.9% | 5.4%(+1.56)#351 | 5.3%(+1.66)#6,696 |
| 32. | 90017 | 6.7% | 5.4%(+1.37)#392 | 5.3%(+1.46)#7,205 |
| 33. | 90001 | 6.7% | 5.4%(+1.28)#415 | 5.3%(+1.37)#7,458 |
| 34. | 90089 | 6.5% | 5.4%(+1.15)#436 | 5.3%(+1.25)#7,786 |
| 35. | 90063 | 6.1% | 5.4%(+0.737)#514 | 5.3%(+0.834)#8,964 |
| 36. | 90034 | 6.0% | 5.4%(+0.663)#531 | 5.3%(+0.759)#9,188 |
| 37. | 90066 | 6.0% | 5.4%(+0.639)#541 | 5.3%(+0.736)#9,274 |
| 38. | 90022 | 5.9% | 5.4%(+0.529)#558 | 5.3%(+0.626)#9,635 |
| 39. | 90008 | 5.8% | 5.4%(+0.383)#592 | 5.3%(+0.479)#10,135 |
| 40. | 90059 | 5.7% | 5.4%(+0.278)#616 | 5.3%(+0.374)#10,482 |
| 41. | 90047 | 5.7% | 5.4%(+0.269)#619 | 5.3%(+0.366)#10,513 |
| 42. | 90013 | 5.3% | 5.4%(-0.042)#700 | 5.3%(+0.055)#11,617 |
| 43. | 90027 | 5.1% | 5.4%(-0.245)#744 | 5.3%(-0.149)#12,406 |
| 44. | 90039 | 4.9% | 5.4%(-0.435)#798 | 5.3%(-0.338)#13,155 |
| 45. | 90043 | 4.9% | 5.4%(-0.459)#805 | 5.3%(-0.362)#13,251 |
| 46. | 90046 | 4.9% | 5.4%(-0.477)#813 | 5.3%(-0.380)#13,318 |
| 47. | 90024 | 4.8% | 5.4%(-0.606)#839 | 5.3%(-0.510)#13,836 |
| 48. | 90036 | 4.7% | 5.4%(-0.682)#856 | 5.3%(-0.585)#14,155 |
| 49. | 90042 | 4.7% | 5.4%(-0.703)#865 | 5.3%(-0.607)#14,245 |
| 50. | 90041 | 4.4% | 5.4%(-0.987)#937 | 5.3%(-0.890)#15,437 |
| 51. | 90025 | 4.3% | 5.4%(-1.04)#951 | 5.3%(-0.940)#15,671 |
| 52. | 90064 | 3.9% | 5.4%(-1.51)#1,046 | 5.3%(-1.41)#17,648 |
| 53. | 90021 | 3.8% | 5.4%(-1.62)#1,066 | 5.3%(-1.52)#18,062 |
| 54. | 90045 | 3.6% | 5.4%(-1.78)#1,098 | 5.3%(-1.68)#18,743 |
| 55. | 90040 | 3.4% | 5.4%(-1.98)#1,141 | 5.3%(-1.89)#19,624 |
| 56. | 90077 | 3.0% | 5.4%(-2.35)#1,216 | 5.3%(-2.25)#21,112 |
| 57. | 90014 | 3.0% | 5.4%(-2.40)#1,229 | 5.3%(-2.30)#21,318 |
| 58. | 90068 | 2.4% | 5.4%(-2.95)#1,322 | 5.3%(-2.85)#23,363 |
| 59. | 90048 | 2.2% | 5.4%(-3.14)#1,354 | 5.3%(-3.05)#23,981 |
| 60. | 90035 | 1.7% | 5.4%(-3.72)#1,426 | 5.3%(-3.62)#25,624 |
| 61. | 90049 | 0.95% | 5.4%(-4.43)#1,469 | 5.3%(-4.33)#27,052 |
1
Common Questions
What are the Top 10 Zip Codes with the Highest Percentage of Population Employed in Food Preparation & Serving in Los Angeles, CA?
Top 10 Zip Codes with the Highest Percentage of Population Employed in Food Preparation & Serving in Los Angeles, CA are:
What zip code has the Highest Percentage of Population Employed in Food Preparation & Serving in Los Angeles, CA?
90005 has the Highest Percentage of Population Employed in Food Preparation & Serving in Los Angeles, CA with 14.8%.
What is the Percentage of Population Employed in Food Preparation & Serving in Los Angeles, CA?
Percentage of Population Employed in Food Preparation & Serving in Los Angeles is 6.2%.
What is the Percentage of Population Employed in Food Preparation & Serving in California?
Percentage of Population Employed in Food Preparation & Serving in California is 5.4%.
What is the Percentage of Population Employed in Food Preparation & Serving in the United States?
Percentage of Population Employed in Food Preparation & Serving in the United States is 5.3%.