Zip Codes with the Highest Percentage of Population Employed in Education Instruction & Library in Los Angeles, CA
RELATED REPORTS & OPTIONS
Education Instruction & Library
Los Angeles
Compare Zip Codes
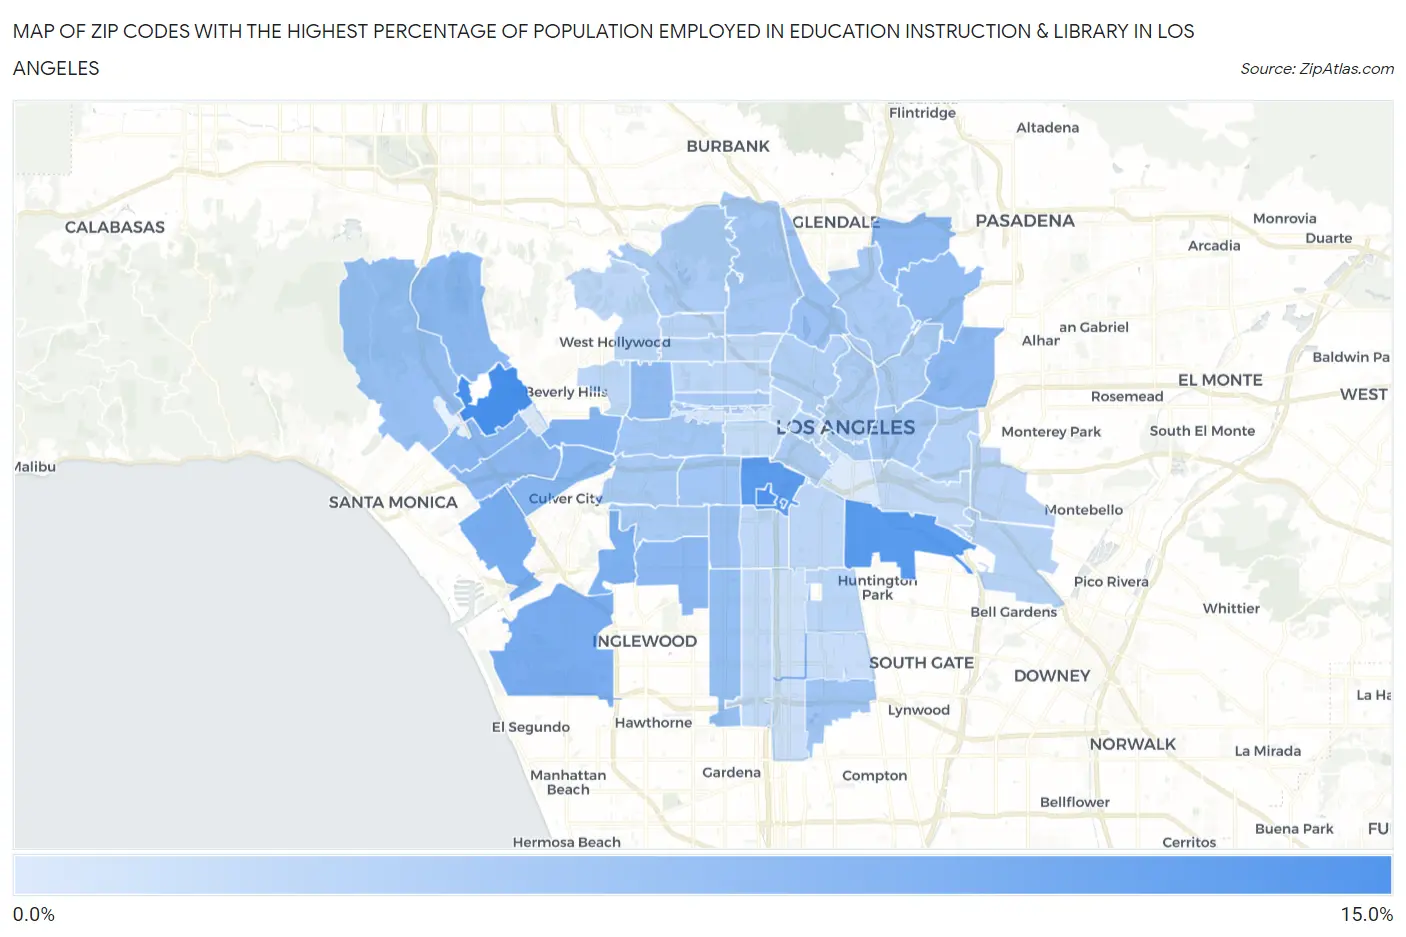
Map of Zip Codes with the Highest Percentage of Population Employed in Education Instruction & Library in Los Angeles
0.0%
15.0%
Zip Codes with the Highest Percentage of Population Employed in Education Instruction & Library in Los Angeles, CA
| Zip Code | % Employed | vs State | vs National | |
| 1. | 90024 | 11.5% | 5.5%(+5.96)#124 | 6.2%(+5.32)#2,695 |
| 2. | 90089 | 11.0% | 5.5%(+5.45)#142 | 6.2%(+4.82)#3,056 |
| 3. | 90058 | 10.3% | 5.5%(+4.76)#162 | 6.2%(+4.13)#3,636 |
| 4. | 90007 | 10.2% | 5.5%(+4.68)#166 | 6.2%(+4.05)#3,704 |
| 5. | 90066 | 8.1% | 5.5%(+2.55)#289 | 6.2%(+1.91)#6,936 |
| 6. | 90045 | 8.0% | 5.5%(+2.45)#296 | 6.2%(+1.82)#7,145 |
| 7. | 90056 | 7.6% | 5.5%(+2.09)#341 | 6.2%(+1.46)#8,078 |
| 8. | 90035 | 7.2% | 5.5%(+1.65)#404 | 6.2%(+1.01)#9,314 |
| 9. | 90034 | 6.9% | 5.5%(+1.39)#450 | 6.2%(+0.755)#10,112 |
| 10. | 90025 | 6.9% | 5.5%(+1.31)#461 | 6.2%(+0.678)#10,346 |
| 11. | 90041 | 6.7% | 5.5%(+1.18)#491 | 6.2%(+0.545)#10,808 |
| 12. | 90064 | 6.7% | 5.5%(+1.18)#493 | 6.2%(+0.540)#10,827 |
| 13. | 90043 | 6.6% | 5.5%(+1.09)#508 | 6.2%(+0.459)#11,096 |
| 14. | 90032 | 6.6% | 5.5%(+1.08)#514 | 6.2%(+0.442)#11,156 |
| 15. | 90077 | 6.6% | 5.5%(+1.00)#535 | 6.2%(+0.368)#11,434 |
| 16. | 90036 | 6.4% | 5.5%(+0.876)#561 | 6.2%(+0.240)#11,886 |
| 17. | 90042 | 6.2% | 5.5%(+0.642)#611 | 6.2%(+0.006)#12,802 |
| 18. | 90047 | 6.0% | 5.5%(+0.451)#644 | 6.2%(-0.184)#13,503 |
| 19. | 90049 | 6.0% | 5.5%(+0.403)#662 | 6.2%(-0.233)#13,699 |
| 20. | 90039 | 5.7% | 5.5%(+0.184)#726 | 6.2%(-0.451)#14,605 |
| 21. | 90062 | 5.5% | 5.5%(-0.015)#780 | 6.2%(-0.651)#15,421 |
| 22. | 90059 | 5.3% | 5.5%(-0.236)#843 | 6.2%(-0.872)#16,340 |
| 23. | 90018 | 5.2% | 5.5%(-0.376)#877 | 6.2%(-1.01)#16,892 |
| 24. | 90019 | 5.1% | 5.5%(-0.442)#891 | 6.2%(-1.08)#17,172 |
| 25. | 90027 | 5.0% | 5.5%(-0.517)#915 | 6.2%(-1.15)#17,511 |
| 26. | 90033 | 5.0% | 5.5%(-0.559)#927 | 6.2%(-1.19)#17,701 |
| 27. | 90016 | 4.8% | 5.5%(-0.751)#972 | 6.2%(-1.39)#18,508 |
| 28. | 90008 | 4.8% | 5.5%(-0.788)#981 | 6.2%(-1.42)#18,678 |
| 29. | 90020 | 4.7% | 5.5%(-0.855)#996 | 6.2%(-1.49)#18,946 |
| 30. | 90013 | 4.7% | 5.5%(-0.863)#999 | 6.2%(-1.50)#18,982 |
| 31. | 90065 | 4.7% | 5.5%(-0.863)#1,000 | 6.2%(-1.50)#18,984 |
| 32. | 90010 | 4.6% | 5.5%(-0.969)#1,038 | 6.2%(-1.60)#19,415 |
| 33. | 90068 | 4.5% | 5.5%(-1.03)#1,053 | 6.2%(-1.67)#19,663 |
| 34. | 90031 | 4.5% | 5.5%(-1.09)#1,077 | 6.2%(-1.73)#19,928 |
| 35. | 90015 | 4.4% | 5.5%(-1.10)#1,082 | 6.2%(-1.74)#19,960 |
| 36. | 90012 | 4.4% | 5.5%(-1.15)#1,093 | 6.2%(-1.79)#20,154 |
| 37. | 90026 | 4.3% | 5.5%(-1.28)#1,121 | 6.2%(-1.91)#20,623 |
| 38. | 90063 | 4.1% | 5.5%(-1.43)#1,142 | 6.2%(-2.06)#21,222 |
| 39. | 90040 | 4.0% | 5.5%(-1.58)#1,176 | 6.2%(-2.21)#21,763 |
| 40. | 90038 | 3.9% | 5.5%(-1.67)#1,204 | 6.2%(-2.31)#22,111 |
| 41. | 90017 | 3.9% | 5.5%(-1.68)#1,207 | 6.2%(-2.31)#22,143 |
| 42. | 90028 | 3.8% | 5.5%(-1.77)#1,225 | 6.2%(-2.41)#22,473 |
| 43. | 90022 | 3.7% | 5.5%(-1.84)#1,243 | 6.2%(-2.48)#22,719 |
| 44. | 90001 | 3.6% | 5.5%(-1.91)#1,254 | 6.2%(-2.55)#22,903 |
| 45. | 90048 | 3.5% | 5.5%(-2.05)#1,282 | 6.2%(-2.69)#23,375 |
| 46. | 90004 | 3.5% | 5.5%(-2.06)#1,283 | 6.2%(-2.70)#23,410 |
| 47. | 90029 | 3.5% | 5.5%(-2.08)#1,287 | 6.2%(-2.72)#23,463 |
| 48. | 90046 | 3.4% | 5.5%(-2.10)#1,293 | 6.2%(-2.74)#23,535 |
| 49. | 90011 | 3.4% | 5.5%(-2.17)#1,311 | 6.2%(-2.81)#23,753 |
| 50. | 90037 | 3.3% | 5.5%(-2.29)#1,330 | 6.2%(-2.92)#24,167 |
| 51. | 90014 | 3.2% | 5.5%(-2.35)#1,340 | 6.2%(-2.99)#24,364 |
| 52. | 90023 | 3.2% | 5.5%(-2.39)#1,343 | 6.2%(-3.03)#24,454 |
| 53. | 90057 | 3.1% | 5.5%(-2.41)#1,347 | 6.2%(-3.05)#24,507 |
| 54. | 90044 | 3.1% | 5.5%(-2.43)#1,354 | 6.2%(-3.07)#24,565 |
| 55. | 90006 | 3.0% | 5.5%(-2.51)#1,367 | 6.2%(-3.14)#24,743 |
| 56. | 90002 | 2.7% | 5.5%(-2.83)#1,414 | 6.2%(-3.46)#25,491 |
| 57. | 90061 | 2.6% | 5.5%(-2.96)#1,431 | 6.2%(-3.59)#25,809 |
| 58. | 90003 | 2.4% | 5.5%(-3.20)#1,452 | 6.2%(-3.83)#26,310 |
| 59. | 90005 | 1.8% | 5.5%(-3.77)#1,486 | 6.2%(-4.41)#27,284 |
| 60. | 90067 | 1.5% | 5.5%(-4.08)#1,503 | 6.2%(-4.72)#27,724 |
| 61. | 90021 | 1.3% | 5.5%(-4.22)#1,507 | 6.2%(-4.85)#27,914 |
1
Common Questions
What are the Top 10 Zip Codes with the Highest Percentage of Population Employed in Education Instruction & Library in Los Angeles, CA?
Top 10 Zip Codes with the Highest Percentage of Population Employed in Education Instruction & Library in Los Angeles, CA are:
What zip code has the Highest Percentage of Population Employed in Education Instruction & Library in Los Angeles, CA?
90024 has the Highest Percentage of Population Employed in Education Instruction & Library in Los Angeles, CA with 11.5%.
What is the Percentage of Population Employed in Education Instruction & Library in Los Angeles, CA?
Percentage of Population Employed in Education Instruction & Library in Los Angeles is 5.0%.
What is the Percentage of Population Employed in Education Instruction & Library in California?
Percentage of Population Employed in Education Instruction & Library in California is 5.5%.
What is the Percentage of Population Employed in Education Instruction & Library in the United States?
Percentage of Population Employed in Education Instruction & Library in the United States is 6.2%.