Zip Codes with the Highest Percentage of Population with a Degree in Social Sciences in Los Angeles, CA
RELATED REPORTS & OPTIONS
Social Sciences
Los Angeles
Compare Zip Codes
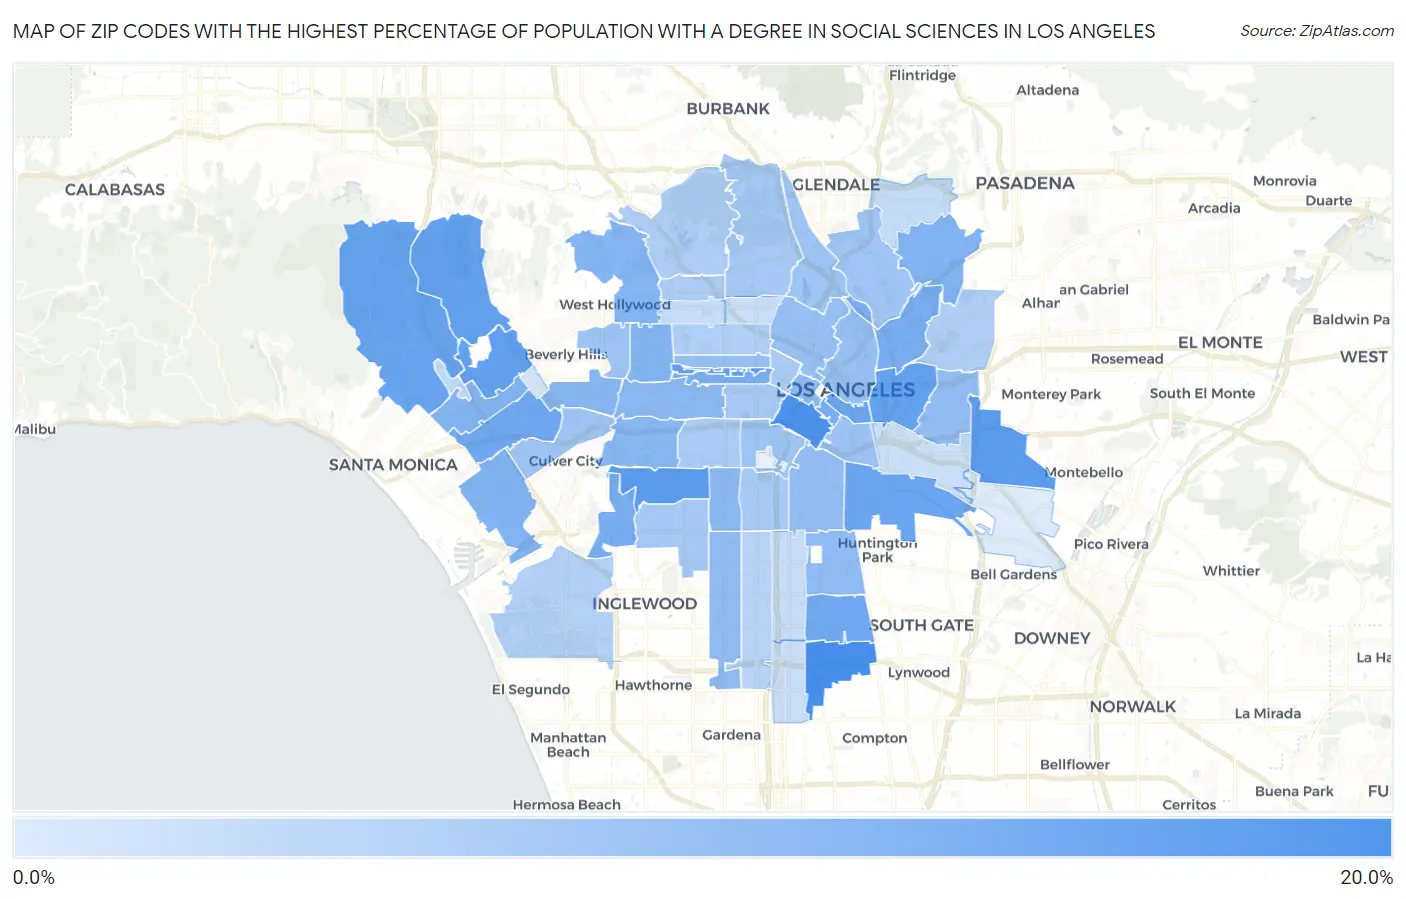
Map of Zip Codes with the Highest Percentage of Population with a Degree in Social Sciences in Los Angeles
0.0%
20.0%
Zip Codes with the Highest Percentage of Population with a Degree in Social Sciences in Los Angeles, CA
| Zip Code | % Graduates | vs State | vs National | |
| 1. | 90059 | 18.4% | 10.4%(+8.07)#112 | 8.1%(+10.4)#1,162 |
| 2. | 90015 | 18.1% | 10.4%(+7.77)#114 | 8.1%(+10.1)#1,214 |
| 3. | 90008 | 16.9% | 10.4%(+6.49)#145 | 8.1%(+8.79)#1,426 |
| 4. | 90022 | 16.8% | 10.4%(+6.47)#147 | 8.1%(+8.76)#1,433 |
| 5. | 90024 | 16.3% | 10.4%(+5.90)#174 | 8.1%(+8.19)#1,569 |
| 6. | 90010 | 16.2% | 10.4%(+5.86)#177 | 8.1%(+8.15)#1,577 |
| 7. | 90033 | 16.1% | 10.4%(+5.75)#183 | 8.1%(+8.05)#1,601 |
| 8. | 90077 | 16.0% | 10.4%(+5.66)#190 | 8.1%(+7.96)#1,627 |
| 9. | 90049 | 15.6% | 10.4%(+5.24)#213 | 8.1%(+7.53)#1,760 |
| 10. | 90058 | 15.6% | 10.4%(+5.23)#214 | 8.1%(+7.52)#1,763 |
| 11. | 90013 | 15.5% | 10.4%(+5.16)#221 | 8.1%(+7.45)#1,793 |
| 12. | 90002 | 15.1% | 10.4%(+4.78)#235 | 8.1%(+7.07)#1,902 |
| 13. | 90064 | 15.1% | 10.4%(+4.76)#237 | 8.1%(+7.06)#1,909 |
| 14. | 90056 | 14.7% | 10.4%(+4.31)#255 | 8.1%(+6.60)#2,069 |
| 15. | 90014 | 14.5% | 10.4%(+4.17)#267 | 8.1%(+6.47)#2,127 |
| 16. | 90005 | 14.5% | 10.4%(+4.15)#270 | 8.1%(+6.44)#2,136 |
| 17. | 90031 | 14.5% | 10.4%(+4.15)#271 | 8.1%(+6.44)#2,137 |
| 18. | 90066 | 13.9% | 10.4%(+3.56)#297 | 8.1%(+5.86)#2,375 |
| 19. | 90042 | 13.9% | 10.4%(+3.50)#299 | 8.1%(+5.79)#2,401 |
| 20. | 90036 | 13.7% | 10.4%(+3.33)#304 | 8.1%(+5.62)#2,484 |
| 21. | 90025 | 13.6% | 10.4%(+3.27)#306 | 8.1%(+5.57)#2,510 |
| 22. | 90046 | 13.6% | 10.4%(+3.22)#312 | 8.1%(+5.51)#2,551 |
| 23. | 90016 | 13.4% | 10.4%(+3.02)#325 | 8.1%(+5.32)#2,641 |
| 24. | 90035 | 13.3% | 10.4%(+2.95)#331 | 8.1%(+5.25)#2,669 |
| 25. | 90019 | 13.2% | 10.4%(+2.85)#337 | 8.1%(+5.14)#2,724 |
| 26. | 90062 | 13.1% | 10.4%(+2.76)#340 | 8.1%(+5.06)#2,762 |
| 27. | 90017 | 12.9% | 10.4%(+2.56)#354 | 8.1%(+4.86)#2,867 |
| 28. | 90047 | 12.7% | 10.4%(+2.36)#369 | 8.1%(+4.66)#2,983 |
| 29. | 90001 | 12.6% | 10.4%(+2.25)#376 | 8.1%(+4.55)#3,050 |
| 30. | 90011 | 12.5% | 10.4%(+2.13)#389 | 8.1%(+4.43)#3,115 |
| 31. | 90063 | 12.4% | 10.4%(+2.07)#399 | 8.1%(+4.36)#3,191 |
| 32. | 90020 | 12.3% | 10.4%(+1.97)#413 | 8.1%(+4.26)#3,257 |
| 33. | 90012 | 12.2% | 10.4%(+1.85)#427 | 8.1%(+4.14)#3,342 |
| 34. | 90026 | 12.1% | 10.4%(+1.73)#439 | 8.1%(+4.02)#3,427 |
| 35. | 90021 | 12.0% | 10.4%(+1.65)#452 | 8.1%(+3.94)#3,490 |
| 36. | 90048 | 11.7% | 10.4%(+1.31)#479 | 8.1%(+3.61)#3,760 |
| 37. | 90007 | 11.6% | 10.4%(+1.27)#483 | 8.1%(+3.56)#3,790 |
| 38. | 90039 | 11.5% | 10.4%(+1.18)#504 | 8.1%(+3.47)#3,883 |
| 39. | 90034 | 11.5% | 10.4%(+1.09)#512 | 8.1%(+3.39)#3,942 |
| 40. | 90065 | 11.4% | 10.4%(+1.00)#526 | 8.1%(+3.30)#4,024 |
| 41. | 90006 | 11.1% | 10.4%(+0.749)#555 | 8.1%(+3.05)#4,254 |
| 42. | 90043 | 11.1% | 10.4%(+0.700)#561 | 8.1%(+3.00)#4,318 |
| 43. | 90027 | 11.0% | 10.4%(+0.638)#571 | 8.1%(+2.93)#4,370 |
| 44. | 90037 | 10.9% | 10.4%(+0.483)#589 | 8.1%(+2.78)#4,527 |
| 45. | 90018 | 10.8% | 10.4%(+0.423)#600 | 8.1%(+2.72)#4,593 |
| 46. | 90057 | 10.8% | 10.4%(+0.404)#604 | 8.1%(+2.70)#4,617 |
| 47. | 90028 | 10.5% | 10.4%(+0.137)#656 | 8.1%(+2.43)#4,933 |
| 48. | 90032 | 10.4% | 10.4%(+0.063)#677 | 8.1%(+2.36)#5,036 |
| 49. | 90068 | 10.4% | 10.4%(+0.058)#681 | 8.1%(+2.35)#5,048 |
| 50. | 90004 | 10.3% | 10.4%(-0.093)#698 | 8.1%(+2.20)#5,208 |
| 51. | 90045 | 10.1% | 10.4%(-0.271)#729 | 8.1%(+2.03)#5,439 |
| 52. | 90044 | 9.8% | 10.4%(-0.607)#791 | 8.1%(+1.69)#5,860 |
| 53. | 90073 | 9.2% | 10.4%(-1.14)#871 | 8.1%(+1.16)#6,574 |
| 54. | 90041 | 8.7% | 10.4%(-1.62)#958 | 8.1%(+0.672)#7,357 |
| 55. | 90003 | 8.5% | 10.4%(-1.88)#1,011 | 8.1%(+0.420)#7,826 |
| 56. | 90038 | 8.5% | 10.4%(-1.89)#1,014 | 8.1%(+0.408)#7,845 |
| 57. | 90061 | 8.4% | 10.4%(-2.00)#1,038 | 8.1%(+0.292)#8,064 |
| 58. | 90029 | 8.3% | 10.4%(-2.11)#1,054 | 8.1%(+0.185)#8,254 |
| 59. | 90023 | 8.2% | 10.4%(-2.16)#1,060 | 8.1%(+0.136)#8,346 |
| 60. | 90067 | 7.6% | 10.4%(-2.74)#1,140 | 8.1%(-0.439)#9,499 |
| 61. | 90040 | 7.0% | 10.4%(-3.37)#1,224 | 8.1%(-1.08)#10,919 |
1
Common Questions
What are the Top 10 Zip Codes with the Highest Percentage of Population with a Degree in Social Sciences in Los Angeles, CA?
Top 10 Zip Codes with the Highest Percentage of Population with a Degree in Social Sciences in Los Angeles, CA are:
What zip code has the Highest Percentage of Population with a Degree in Social Sciences in Los Angeles, CA?
90059 has the Highest Percentage of Population with a Degree in Social Sciences in Los Angeles, CA with 18.4%.
What is the Percentage of Population with a Degree in Social Sciences in Los Angeles, CA?
Percentage of Population with a Degree in Social Sciences in Los Angeles is 11.9%.
What is the Percentage of Population with a Degree in Social Sciences in California?
Percentage of Population with a Degree in Social Sciences in California is 10.4%.
What is the Percentage of Population with a Degree in Social Sciences in the United States?
Percentage of Population with a Degree in Social Sciences in the United States is 8.1%.