Zip Codes with the Highest Percentage of Guamanian / Chamorro Population in Los Angeles, CA
RELATED REPORTS & OPTIONS
Guamanian / Chamorro
Los Angeles
Compare Zip Codes
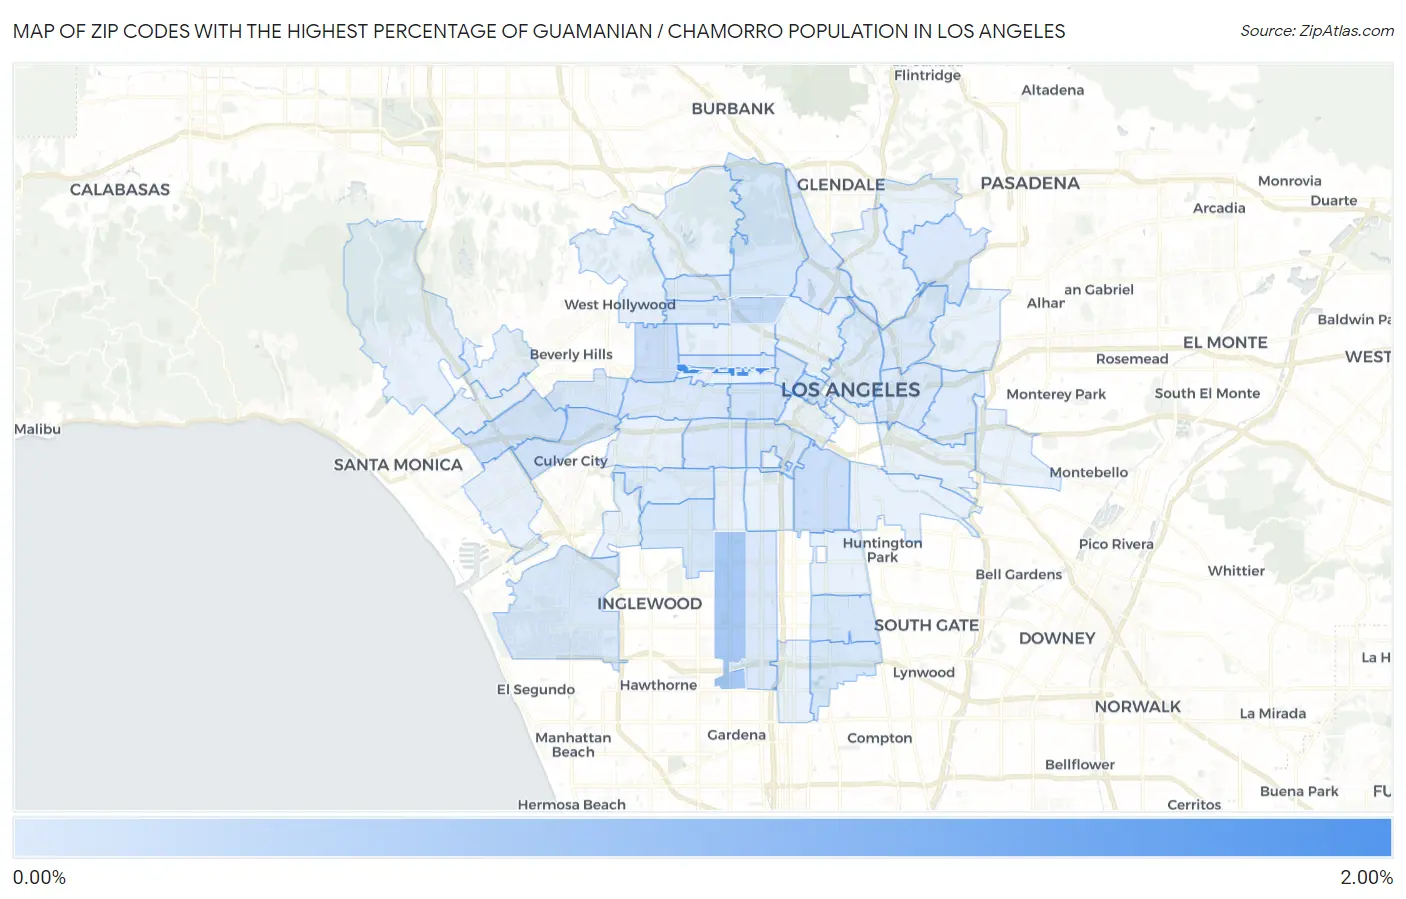
Map of Zip Codes with the Highest Percentage of Guamanian / Chamorro Population in Los Angeles
0.00%
2.00%
Zip Codes with the Highest Percentage of Guamanian / Chamorro Population in Los Angeles, CA
| Zip Code | Guamanian / Chamorro | vs State | vs National | |
| 1. | 90010 | 1.65% | 0.12%(+1.53)#9 | 0.047%(+1.60)#71 |
| 2. | 90047 | 0.62% | 0.12%(+0.506)#54 | 0.047%(+0.576)#316 |
| 3. | 90029 | 0.31% | 0.12%(+0.198)#132 | 0.047%(+0.268)#668 |
| 4. | 90036 | 0.22% | 0.12%(+0.104)#198 | 0.047%(+0.174)#956 |
| 5. | 90011 | 0.20% | 0.12%(+0.084)#216 | 0.047%(+0.154)#1,030 |
| 6. | 90006 | 0.13% | 0.12%(+0.018)#301 | 0.047%(+0.088)#1,391 |
| 7. | 90017 | 0.13% | 0.12%(+0.016)#306 | 0.047%(+0.086)#1,405 |
| 8. | 90064 | 0.13% | 0.12%(+0.014)#308 | 0.047%(+0.084)#1,414 |
| 9. | 90034 | 0.13% | 0.12%(+0.014)#310 | 0.047%(+0.084)#1,417 |
| 10. | 90043 | 0.094% | 0.12%(-0.022)#379 | 0.047%(+0.048)#1,735 |
| 11. | 90027 | 0.090% | 0.12%(-0.027)#392 | 0.047%(+0.043)#1,786 |
| 12. | 90002 | 0.079% | 0.12%(-0.037)#413 | 0.047%(+0.033)#1,886 |
| 13. | 90059 | 0.079% | 0.12%(-0.038)#415 | 0.047%(+0.032)#1,896 |
| 14. | 90038 | 0.071% | 0.12%(-0.045)#434 | 0.047%(+0.025)#1,968 |
| 15. | 90035 | 0.071% | 0.12%(-0.045)#435 | 0.047%(+0.025)#1,969 |
| 16. | 90045 | 0.066% | 0.12%(-0.051)#453 | 0.047%(+0.019)#2,046 |
| 17. | 90057 | 0.059% | 0.12%(-0.057)#471 | 0.047%(+0.013)#2,128 |
| 18. | 90007 | 0.054% | 0.12%(-0.063)#484 | 0.047%(+0.007)#2,189 |
| 19. | 90031 | 0.045% | 0.12%(-0.071)#513 | 0.047%(-0.001)#2,323 |
| 20. | 90020 | 0.042% | 0.12%(-0.075)#528 | 0.047%(-0.005)#2,387 |
| 21. | 90044 | 0.039% | 0.12%(-0.077)#536 | 0.047%(-0.007)#2,430 |
| 22. | 90042 | 0.037% | 0.12%(-0.079)#541 | 0.047%(-0.009)#2,472 |
| 23. | 90019 | 0.034% | 0.12%(-0.083)#553 | 0.047%(-0.013)#2,548 |
| 24. | 90033 | 0.031% | 0.12%(-0.085)#560 | 0.047%(-0.015)#2,591 |
| 25. | 90039 | 0.025% | 0.12%(-0.092)#586 | 0.047%(-0.022)#2,733 |
| 26. | 90028 | 0.023% | 0.12%(-0.094)#598 | 0.047%(-0.024)#2,783 |
| 27. | 90018 | 0.022% | 0.12%(-0.094)#601 | 0.047%(-0.024)#2,795 |
| 28. | 90012 | 0.013% | 0.12%(-0.104)#641 | 0.047%(-0.034)#2,973 |
| 29. | 90063 | 0.012% | 0.12%(-0.105)#645 | 0.047%(-0.035)#2,999 |
| 30. | 90008 | 0.0091% | 0.12%(-0.107)#652 | 0.047%(-0.037)#3,047 |
1
Common Questions
What are the Top 10 Zip Codes with the Highest Percentage of Guamanian / Chamorro Population in Los Angeles, CA?
Top 10 Zip Codes with the Highest Percentage of Guamanian / Chamorro Population in Los Angeles, CA are:
What zip code has the Highest Percentage of Guamanian / Chamorro Population in Los Angeles, CA?
90010 has the Highest Percentage of Guamanian / Chamorro Population in Los Angeles, CA with 1.65%.
What is the Percentage of Guamanian / Chamorro Population in Los Angeles, CA?
Percentage of Guamanian / Chamorro Population in Los Angeles is 0.054%.
What is the Percentage of Guamanian / Chamorro Population in California?
Percentage of Guamanian / Chamorro Population in California is 0.12%.
What is the Percentage of Guamanian / Chamorro Population in the United States?
Percentage of Guamanian / Chamorro Population in the United States is 0.047%.