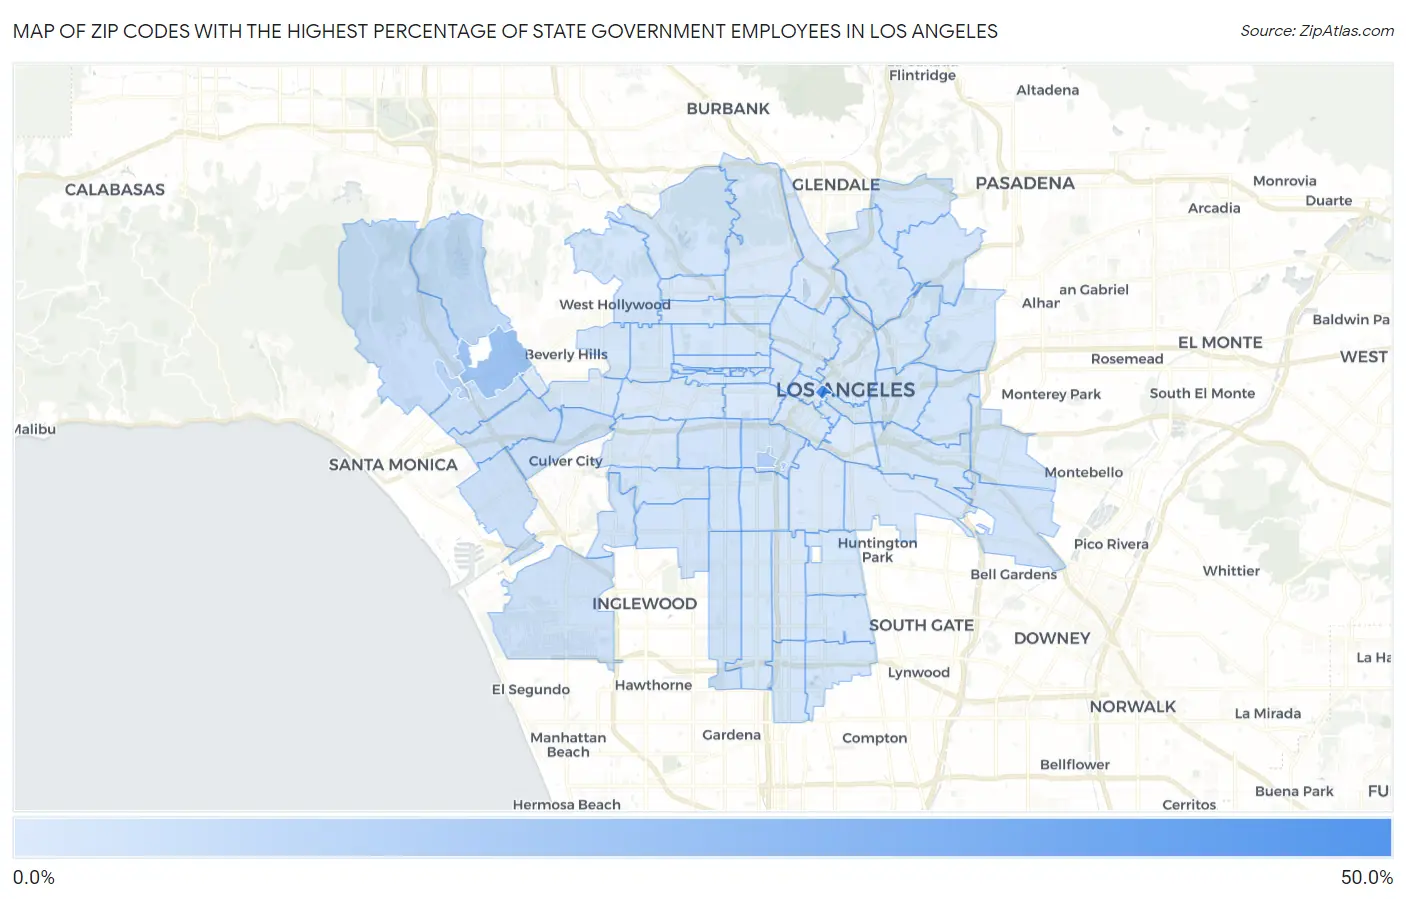
Zip Codes with the Highest Percentage of State Government Employees in Los Angeles, CA
RELATED REPORTS & OPTIONS
State Government Employees
Los Angeles
Compare Zip Codes
Map of Zip Codes with the Highest Percentage of State Government Employees in Los Angeles
0.0%
50.0%
Zip Codes with the Highest Percentage of State Government Employees in Los Angeles, CA
| Zip Code | % State Government Employees | vs State | vs National | |
| 1. | 90071 | 49.4% | 4.1%(+45.3)#4 | 4.2%(+45.2)#115 |
| 2. | 90024 | 18.3% | 4.1%(+14.2)#42 | 4.2%(+14.0)#1,115 |
| 3. | 90089 | 13.1% | 4.1%(+9.06)#94 | 4.2%(+8.89)#2,256 |
| 4. | 90073 | 11.3% | 4.1%(+7.26)#125 | 4.2%(+7.10)#3,031 |
| 5. | 90077 | 6.8% | 4.1%(+2.69)#310 | 4.2%(+2.53)#7,394 |
| 6. | 90049 | 6.1% | 4.1%(+2.00)#353 | 4.2%(+1.83)#8,610 |
| 7. | 90025 | 4.9% | 4.1%(+0.857)#484 | 4.2%(+0.691)#11,094 |
| 8. | 90066 | 4.9% | 4.1%(+0.819)#487 | 4.2%(+0.654)#11,203 |
| 9. | 90034 | 4.9% | 4.1%(+0.799)#490 | 4.2%(+0.634)#11,263 |
| 10. | 90064 | 4.3% | 4.1%(+0.219)#585 | 4.2%(+0.053)#12,908 |
| 11. | 90007 | 4.1% | 4.1%(-0.024)#642 | 4.2%(-0.189)#13,710 |
| 12. | 90047 | 3.9% | 4.1%(-0.130)#681 | 4.2%(-0.296)#14,125 |
| 13. | 90045 | 3.9% | 4.1%(-0.167)#688 | 4.2%(-0.332)#14,254 |
| 14. | 90040 | 3.6% | 4.1%(-0.442)#760 | 4.2%(-0.607)#15,291 |
| 15. | 90018 | 3.5% | 4.1%(-0.600)#814 | 4.2%(-0.766)#15,951 |
| 16. | 90056 | 3.3% | 4.1%(-0.760)#853 | 4.2%(-0.926)#16,548 |
| 17. | 90043 | 3.3% | 4.1%(-0.806)#866 | 4.2%(-0.972)#16,731 |
| 18. | 90046 | 3.2% | 4.1%(-0.876)#887 | 4.2%(-1.04)#17,045 |
| 19. | 90022 | 3.2% | 4.1%(-0.895)#890 | 4.2%(-1.06)#17,123 |
| 20. | 90032 | 3.2% | 4.1%(-0.900)#892 | 4.2%(-1.07)#17,137 |
| 21. | 90061 | 3.0% | 4.1%(-1.12)#974 | 4.2%(-1.29)#18,159 |
| 22. | 90068 | 2.9% | 4.1%(-1.15)#979 | 4.2%(-1.31)#18,238 |
| 23. | 90062 | 2.9% | 4.1%(-1.18)#988 | 4.2%(-1.35)#18,424 |
| 24. | 90008 | 2.9% | 4.1%(-1.21)#997 | 4.2%(-1.37)#18,544 |
| 25. | 90013 | 2.8% | 4.1%(-1.23)#1,006 | 4.2%(-1.39)#18,619 |
| 26. | 90042 | 2.8% | 4.1%(-1.27)#1,018 | 4.2%(-1.44)#18,817 |
| 27. | 90002 | 2.8% | 4.1%(-1.27)#1,019 | 4.2%(-1.44)#18,819 |
| 28. | 90041 | 2.8% | 4.1%(-1.29)#1,025 | 4.2%(-1.46)#18,919 |
| 29. | 90059 | 2.8% | 4.1%(-1.30)#1,028 | 4.2%(-1.46)#18,941 |
| 30. | 90065 | 2.7% | 4.1%(-1.34)#1,049 | 4.2%(-1.51)#19,166 |
| 31. | 90033 | 2.7% | 4.1%(-1.41)#1,070 | 4.2%(-1.57)#19,463 |
| 32. | 90063 | 2.7% | 4.1%(-1.41)#1,073 | 4.2%(-1.58)#19,503 |
| 33. | 90005 | 2.6% | 4.1%(-1.51)#1,105 | 4.2%(-1.68)#19,944 |
| 34. | 90044 | 2.5% | 4.1%(-1.58)#1,131 | 4.2%(-1.74)#20,288 |
| 35. | 90031 | 2.3% | 4.1%(-1.74)#1,175 | 4.2%(-1.91)#21,020 |
| 36. | 90048 | 2.3% | 4.1%(-1.75)#1,179 | 4.2%(-1.92)#21,065 |
| 37. | 90026 | 2.2% | 4.1%(-1.85)#1,208 | 4.2%(-2.02)#21,517 |
| 38. | 90029 | 2.2% | 4.1%(-1.86)#1,210 | 4.2%(-2.02)#21,537 |
| 39. | 90014 | 2.2% | 4.1%(-1.88)#1,220 | 4.2%(-2.04)#21,632 |
| 40. | 90037 | 2.2% | 4.1%(-1.89)#1,224 | 4.2%(-2.06)#21,717 |
| 41. | 90004 | 2.1% | 4.1%(-1.97)#1,241 | 4.2%(-2.14)#22,059 |
| 42. | 90023 | 2.1% | 4.1%(-2.01)#1,256 | 4.2%(-2.17)#22,242 |
| 43. | 90036 | 2.1% | 4.1%(-2.01)#1,258 | 4.2%(-2.18)#22,268 |
| 44. | 90010 | 2.0% | 4.1%(-2.06)#1,271 | 4.2%(-2.22)#22,501 |
| 45. | 90001 | 2.0% | 4.1%(-2.06)#1,272 | 4.2%(-2.23)#22,505 |
| 46. | 90012 | 2.0% | 4.1%(-2.09)#1,278 | 4.2%(-2.25)#22,634 |
| 47. | 90003 | 2.0% | 4.1%(-2.10)#1,284 | 4.2%(-2.26)#22,686 |
| 48. | 90020 | 1.9% | 4.1%(-2.16)#1,306 | 4.2%(-2.32)#22,948 |
| 49. | 90006 | 1.9% | 4.1%(-2.17)#1,312 | 4.2%(-2.34)#23,004 |
| 50. | 90035 | 1.8% | 4.1%(-2.29)#1,345 | 4.2%(-2.46)#23,518 |
| 51. | 90027 | 1.7% | 4.1%(-2.34)#1,358 | 4.2%(-2.51)#23,763 |
| 52. | 90057 | 1.7% | 4.1%(-2.34)#1,359 | 4.2%(-2.51)#23,764 |
| 53. | 90011 | 1.7% | 4.1%(-2.36)#1,366 | 4.2%(-2.53)#23,866 |
| 54. | 90039 | 1.7% | 4.1%(-2.38)#1,371 | 4.2%(-2.55)#23,955 |
| 55. | 90038 | 1.7% | 4.1%(-2.42)#1,375 | 4.2%(-2.58)#24,121 |
| 56. | 90058 | 1.7% | 4.1%(-2.42)#1,376 | 4.2%(-2.58)#24,125 |
| 57. | 90015 | 1.6% | 4.1%(-2.51)#1,398 | 4.2%(-2.68)#24,546 |
| 58. | 90019 | 1.5% | 4.1%(-2.59)#1,409 | 4.2%(-2.76)#24,870 |
| 59. | 90016 | 1.5% | 4.1%(-2.59)#1,410 | 4.2%(-2.76)#24,873 |
| 60. | 90028 | 1.4% | 4.1%(-2.68)#1,424 | 4.2%(-2.85)#25,239 |
| 61. | 90017 | 1.3% | 4.1%(-2.73)#1,432 | 4.2%(-2.89)#25,398 |
| 62. | 90067 | 0.71% | 4.1%(-3.36)#1,481 | 4.2%(-3.53)#27,317 |
| 63. | 90021 | 0.46% | 4.1%(-3.62)#1,495 | 4.2%(-3.78)#27,803 |
1
Common Questions
What are the Top 10 Zip Codes with the Highest Percentage of State Government Employees in Los Angeles, CA?
Top 10 Zip Codes with the Highest Percentage of State Government Employees in Los Angeles, CA are:
What zip code has the Highest Percentage of State Government Employees in Los Angeles, CA?
90071 has the Highest Percentage of State Government Employees in Los Angeles, CA with 49.4%.
What is the Percentage of State Government Employees in Los Angeles, CA?
Percentage of State Government Employees in Los Angeles is 2.9%.
What is the Percentage of State Government Employees in California?
Percentage of State Government Employees in California is 4.1%.
What is the Percentage of State Government Employees in the United States?
Percentage of State Government Employees in the United States is 4.2%.