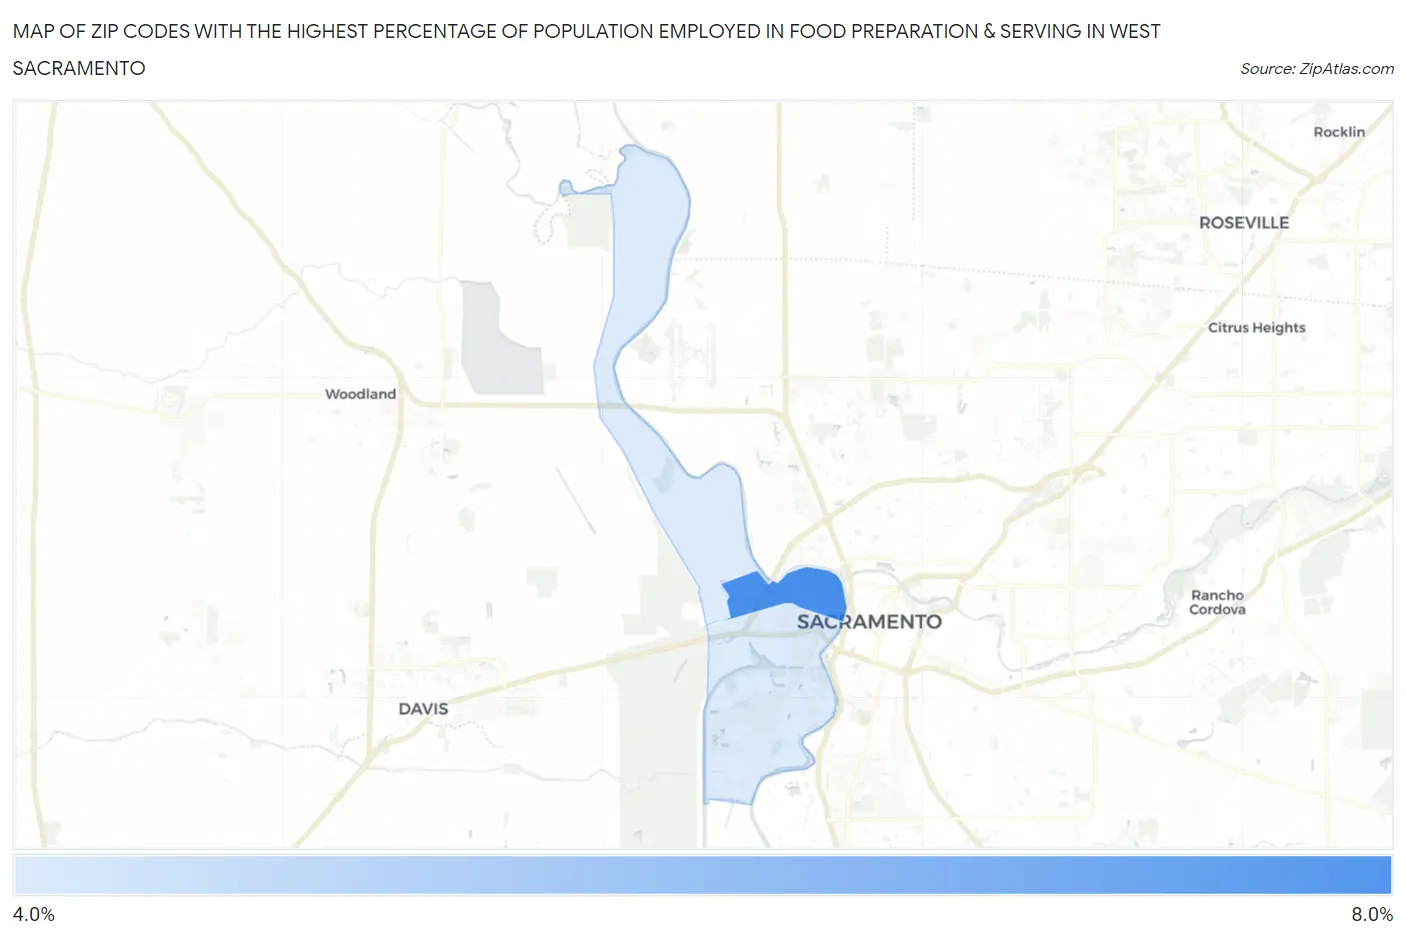
Zip Codes with the Highest Percentage of Population Employed in Food Preparation & Serving in West Sacramento, CA
RELATED REPORTS & OPTIONS
Food Preparation & Serving
West Sacramento
Compare Zip Codes
Map of Zip Codes with the Highest Percentage of Population Employed in Food Preparation & Serving in West Sacramento
0.0%
8.0%
Zip Codes with the Highest Percentage of Population Employed in Food Preparation & Serving in West Sacramento, CA
| Zip Code | % Employed | vs State | vs National | |
| 1. | 95605 | 6.7% | 5.4%(+1.30)#408 | 5.3%(+1.39)#7,391 |
| 2. | 95691 | 5.0% | 5.4%(-0.421)#796 | 5.3%(-0.325)#13,102 |
1
Common Questions
What are the Top Zip Codes with the Highest Percentage of Population Employed in Food Preparation & Serving in West Sacramento, CA?
Top Zip Codes with the Highest Percentage of Population Employed in Food Preparation & Serving in West Sacramento, CA are:
What zip code has the Highest Percentage of Population Employed in Food Preparation & Serving in West Sacramento, CA?
95605 has the Highest Percentage of Population Employed in Food Preparation & Serving in West Sacramento, CA with 6.7%.
What is the Percentage of Population Employed in Food Preparation & Serving in West Sacramento, CA?
Percentage of Population Employed in Food Preparation & Serving in West Sacramento is 5.4%.
What is the Percentage of Population Employed in Food Preparation & Serving in California?
Percentage of Population Employed in Food Preparation & Serving in California is 5.4%.
What is the Percentage of Population Employed in Food Preparation & Serving in the United States?
Percentage of Population Employed in Food Preparation & Serving in the United States is 5.3%.