Zip Codes with the Highest Percentage of Population Employed in Agriculture, Fishing & Hunting in Los Angeles, CA
RELATED REPORTS & OPTIONS
Agriculture, Fishing & Hunting
Los Angeles
Compare Zip Codes
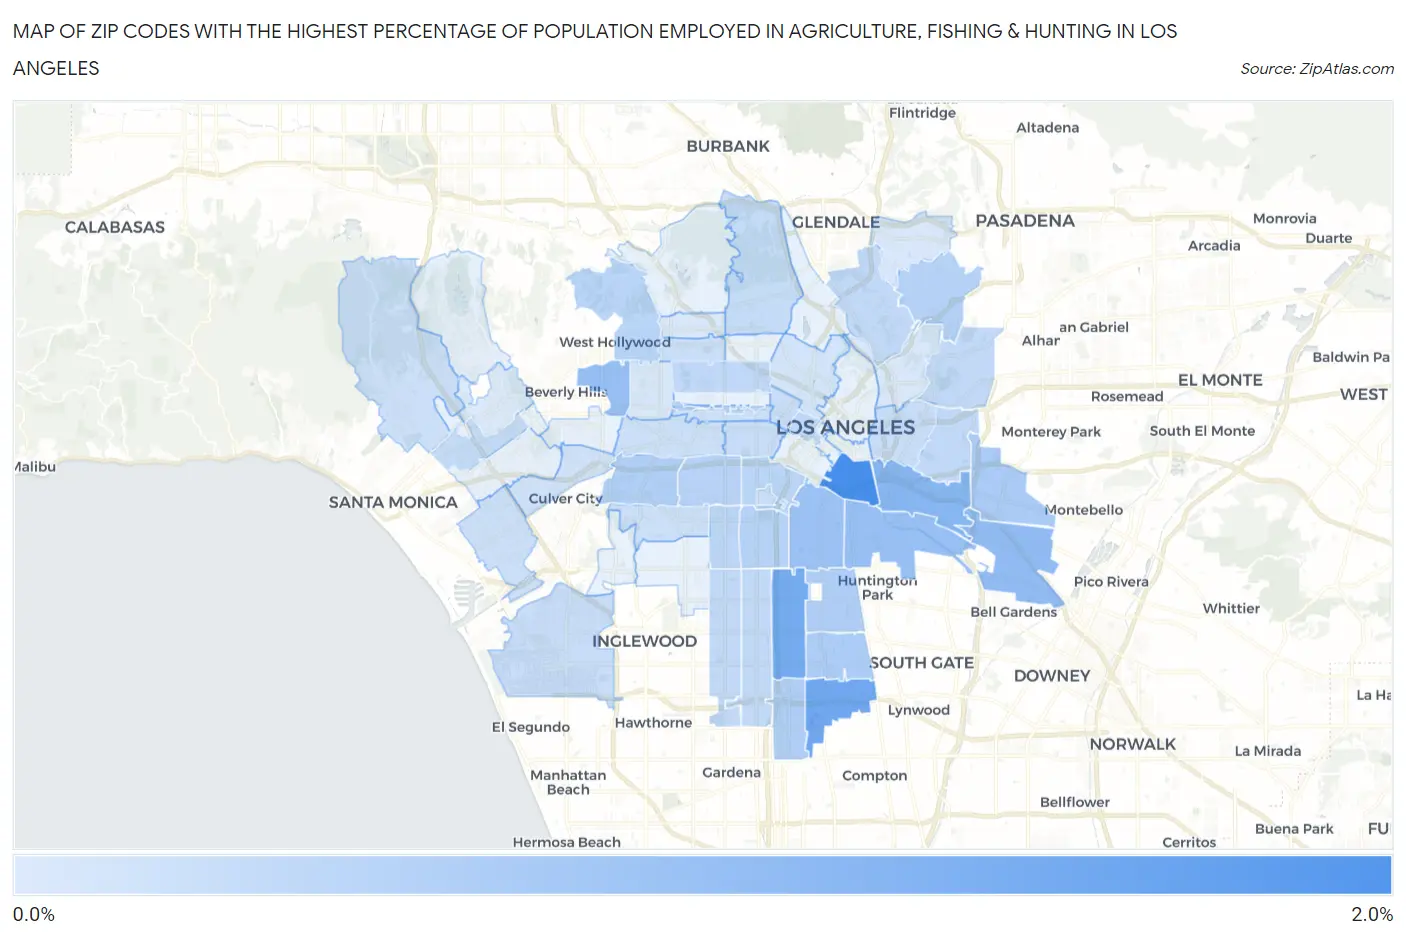
Map of Zip Codes with the Highest Percentage of Population Employed in Agriculture, Fishing & Hunting in Los Angeles
0.0%
2.0%
Zip Codes with the Highest Percentage of Population Employed in Agriculture, Fishing & Hunting in Los Angeles, CA
| Zip Code | % Employed | vs State | vs National | |
| 1. | 90021 | 1.8% | 2.0%(-0.139)#575 | 1.2%(+0.647)#13,174 |
| 2. | 90059 | 1.3% | 2.0%(-0.651)#658 | 1.2%(+0.135)#14,891 |
| 3. | 90003 | 1.3% | 2.0%(-0.702)#665 | 1.2%(+0.084)#15,088 |
| 4. | 90023 | 1.0% | 2.0%(-0.941)#717 | 1.2%(-0.155)#16,030 |
| 5. | 90040 | 0.94% | 2.0%(-1.05)#745 | 1.2%(-0.264)#16,527 |
| 6. | 90058 | 0.85% | 2.0%(-1.13)#767 | 1.2%(-0.346)#16,960 |
| 7. | 90048 | 0.85% | 2.0%(-1.14)#769 | 1.2%(-0.353)#16,987 |
| 8. | 90011 | 0.80% | 2.0%(-1.19)#789 | 1.2%(-0.400)#17,242 |
| 9. | 90022 | 0.62% | 2.0%(-1.36)#884 | 1.2%(-0.577)#18,333 |
| 10. | 90002 | 0.58% | 2.0%(-1.40)#906 | 1.2%(-0.616)#18,600 |
| 11. | 90001 | 0.57% | 2.0%(-1.41)#912 | 1.2%(-0.626)#18,678 |
| 12. | 90061 | 0.56% | 2.0%(-1.43)#922 | 1.2%(-0.641)#18,786 |
| 13. | 90016 | 0.54% | 2.0%(-1.44)#930 | 1.2%(-0.657)#18,916 |
| 14. | 90010 | 0.48% | 2.0%(-1.50)#974 | 1.2%(-0.715)#19,413 |
| 15. | 90037 | 0.48% | 2.0%(-1.51)#978 | 1.2%(-0.721)#19,462 |
| 16. | 90042 | 0.48% | 2.0%(-1.51)#981 | 1.2%(-0.723)#19,480 |
| 17. | 90018 | 0.46% | 2.0%(-1.53)#996 | 1.2%(-0.742)#19,632 |
| 18. | 90007 | 0.43% | 2.0%(-1.55)#1,019 | 1.2%(-0.769)#19,892 |
| 19. | 90046 | 0.43% | 2.0%(-1.56)#1,020 | 1.2%(-0.771)#19,911 |
| 20. | 90062 | 0.39% | 2.0%(-1.59)#1,045 | 1.2%(-0.809)#20,237 |
| 21. | 90004 | 0.36% | 2.0%(-1.63)#1,066 | 1.2%(-0.839)#20,544 |
| 22. | 90044 | 0.35% | 2.0%(-1.63)#1,073 | 1.2%(-0.846)#20,616 |
| 23. | 90032 | 0.35% | 2.0%(-1.63)#1,076 | 1.2%(-0.848)#20,632 |
| 24. | 90065 | 0.35% | 2.0%(-1.64)#1,077 | 1.2%(-0.849)#20,647 |
| 25. | 90017 | 0.35% | 2.0%(-1.64)#1,078 | 1.2%(-0.849)#20,650 |
| 26. | 90047 | 0.34% | 2.0%(-1.64)#1,086 | 1.2%(-0.857)#20,720 |
| 27. | 90063 | 0.33% | 2.0%(-1.66)#1,099 | 1.2%(-0.869)#20,846 |
| 28. | 90025 | 0.32% | 2.0%(-1.66)#1,106 | 1.2%(-0.877)#20,922 |
| 29. | 90027 | 0.28% | 2.0%(-1.71)#1,138 | 1.2%(-0.921)#21,437 |
| 30. | 90045 | 0.27% | 2.0%(-1.72)#1,151 | 1.2%(-0.930)#21,546 |
| 31. | 90089 | 0.27% | 2.0%(-1.72)#1,153 | 1.2%(-0.933)#21,578 |
| 32. | 90057 | 0.26% | 2.0%(-1.72)#1,155 | 1.2%(-0.934)#21,590 |
| 33. | 90006 | 0.26% | 2.0%(-1.73)#1,168 | 1.2%(-0.944)#21,708 |
| 34. | 90033 | 0.25% | 2.0%(-1.74)#1,178 | 1.2%(-0.951)#21,779 |
| 35. | 90038 | 0.22% | 2.0%(-1.76)#1,201 | 1.2%(-0.977)#22,079 |
| 36. | 90019 | 0.21% | 2.0%(-1.77)#1,209 | 1.2%(-0.987)#22,204 |
| 37. | 90066 | 0.20% | 2.0%(-1.78)#1,222 | 1.2%(-0.997)#22,329 |
| 38. | 90008 | 0.20% | 2.0%(-1.79)#1,225 | 1.2%(-1.00)#22,382 |
| 39. | 90049 | 0.20% | 2.0%(-1.79)#1,226 | 1.2%(-1.00)#22,403 |
| 40. | 90005 | 0.20% | 2.0%(-1.79)#1,227 | 1.2%(-1.00)#22,405 |
| 41. | 90034 | 0.13% | 2.0%(-1.85)#1,291 | 1.2%(-1.07)#23,247 |
| 42. | 90026 | 0.11% | 2.0%(-1.87)#1,315 | 1.2%(-1.09)#23,502 |
| 43. | 90036 | 0.069% | 2.0%(-1.92)#1,371 | 1.2%(-1.13)#24,109 |
| 44. | 90028 | 0.069% | 2.0%(-1.92)#1,372 | 1.2%(-1.13)#24,115 |
| 45. | 90031 | 0.059% | 2.0%(-1.93)#1,379 | 1.2%(-1.14)#24,239 |
| 46. | 90041 | 0.054% | 2.0%(-1.93)#1,385 | 1.2%(-1.15)#24,300 |
| 47. | 90024 | 0.0046% | 2.0%(-1.98)#1,408 | 1.2%(-1.19)#24,640 |
1
Common Questions
What are the Top 10 Zip Codes with the Highest Percentage of Population Employed in Agriculture, Fishing & Hunting in Los Angeles, CA?
Top 10 Zip Codes with the Highest Percentage of Population Employed in Agriculture, Fishing & Hunting in Los Angeles, CA are:
What zip code has the Highest Percentage of Population Employed in Agriculture, Fishing & Hunting in Los Angeles, CA?
90021 has the Highest Percentage of Population Employed in Agriculture, Fishing & Hunting in Los Angeles, CA with 1.8%.
What is the Percentage of Population Employed in Agriculture, Fishing & Hunting in Los Angeles, CA?
Percentage of Population Employed in Agriculture, Fishing & Hunting in Los Angeles is 0.37%.
What is the Percentage of Population Employed in Agriculture, Fishing & Hunting in California?
Percentage of Population Employed in Agriculture, Fishing & Hunting in California is 2.0%.
What is the Percentage of Population Employed in Agriculture, Fishing & Hunting in the United States?
Percentage of Population Employed in Agriculture, Fishing & Hunting in the United States is 1.2%.