Zip Codes with the Highest Percentage of Population Employed in Food Preparation & Serving in Lompoc, CA
RELATED REPORTS & OPTIONS
Food Preparation & Serving
Lompoc
Compare Zip Codes
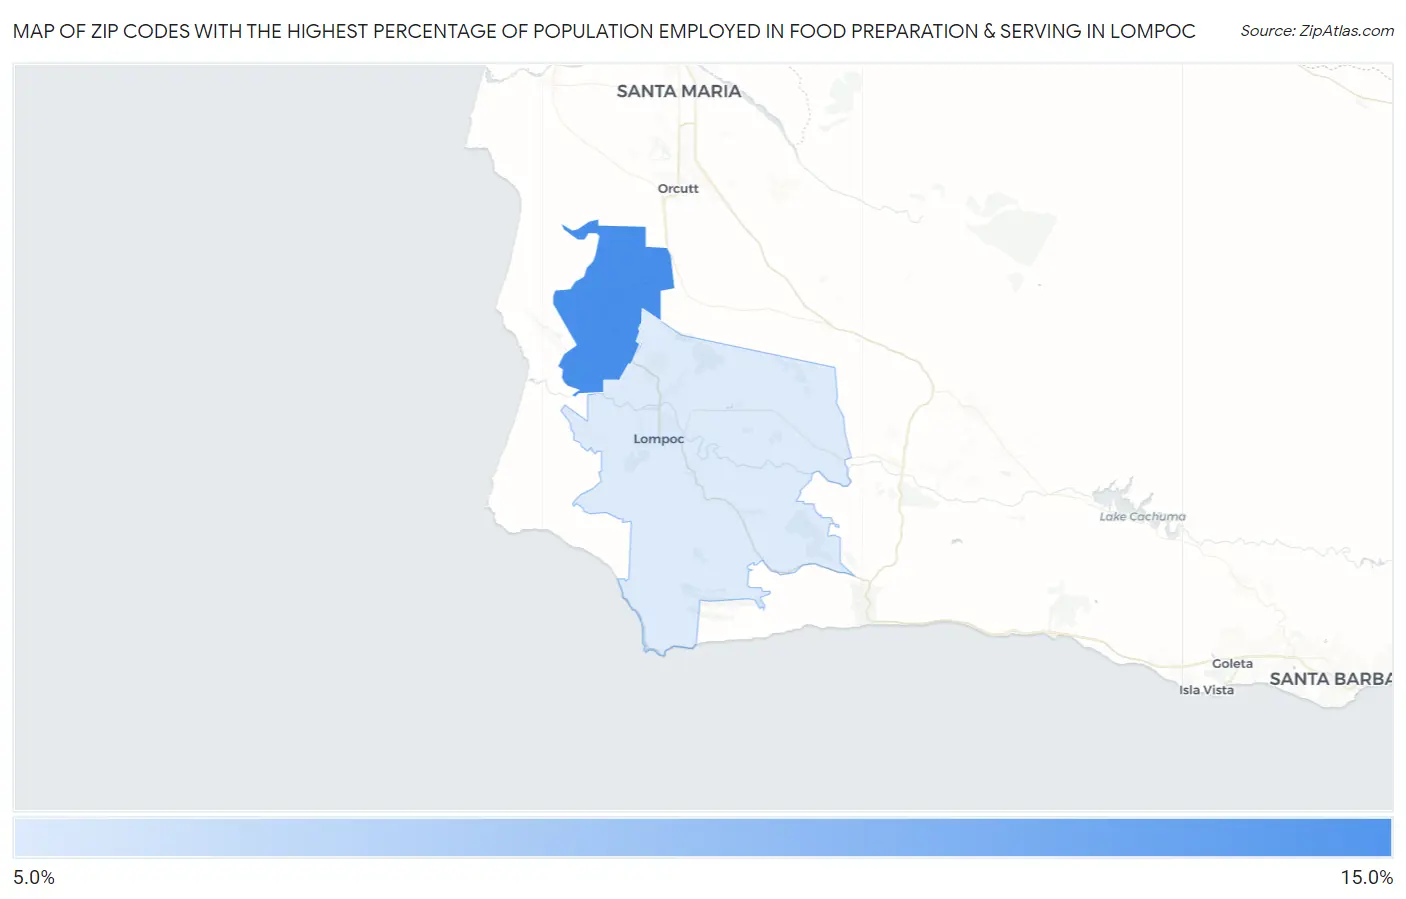
Map of Zip Codes with the Highest Percentage of Population Employed in Food Preparation & Serving in Lompoc
0.0%
15.0%
Zip Codes with the Highest Percentage of Population Employed in Food Preparation & Serving in Lompoc, CA
| Zip Code | % Employed | vs State | vs National | |
| 1. | 93437 | 14.5% | 5.4%(+9.10)#57 | 5.3%(+9.19)#1,063 |
| 2. | 93436 | 6.9% | 5.4%(+1.51)#360 | 5.3%(+1.61)#6,850 |
1
Common Questions
What are the Top Zip Codes with the Highest Percentage of Population Employed in Food Preparation & Serving in Lompoc, CA?
Top Zip Codes with the Highest Percentage of Population Employed in Food Preparation & Serving in Lompoc, CA are:
What zip code has the Highest Percentage of Population Employed in Food Preparation & Serving in Lompoc, CA?
93437 has the Highest Percentage of Population Employed in Food Preparation & Serving in Lompoc, CA with 14.5%.
What is the Percentage of Population Employed in Food Preparation & Serving in Lompoc, CA?
Percentage of Population Employed in Food Preparation & Serving in Lompoc is 7.5%.
What is the Percentage of Population Employed in Food Preparation & Serving in California?
Percentage of Population Employed in Food Preparation & Serving in California is 5.4%.
What is the Percentage of Population Employed in Food Preparation & Serving in the United States?
Percentage of Population Employed in Food Preparation & Serving in the United States is 5.3%.