Zip Codes with the Highest Percentage of Population Employed in Food Preparation & Serving in Rialto, CA
RELATED REPORTS & OPTIONS
Food Preparation & Serving
Rialto
Compare Zip Codes
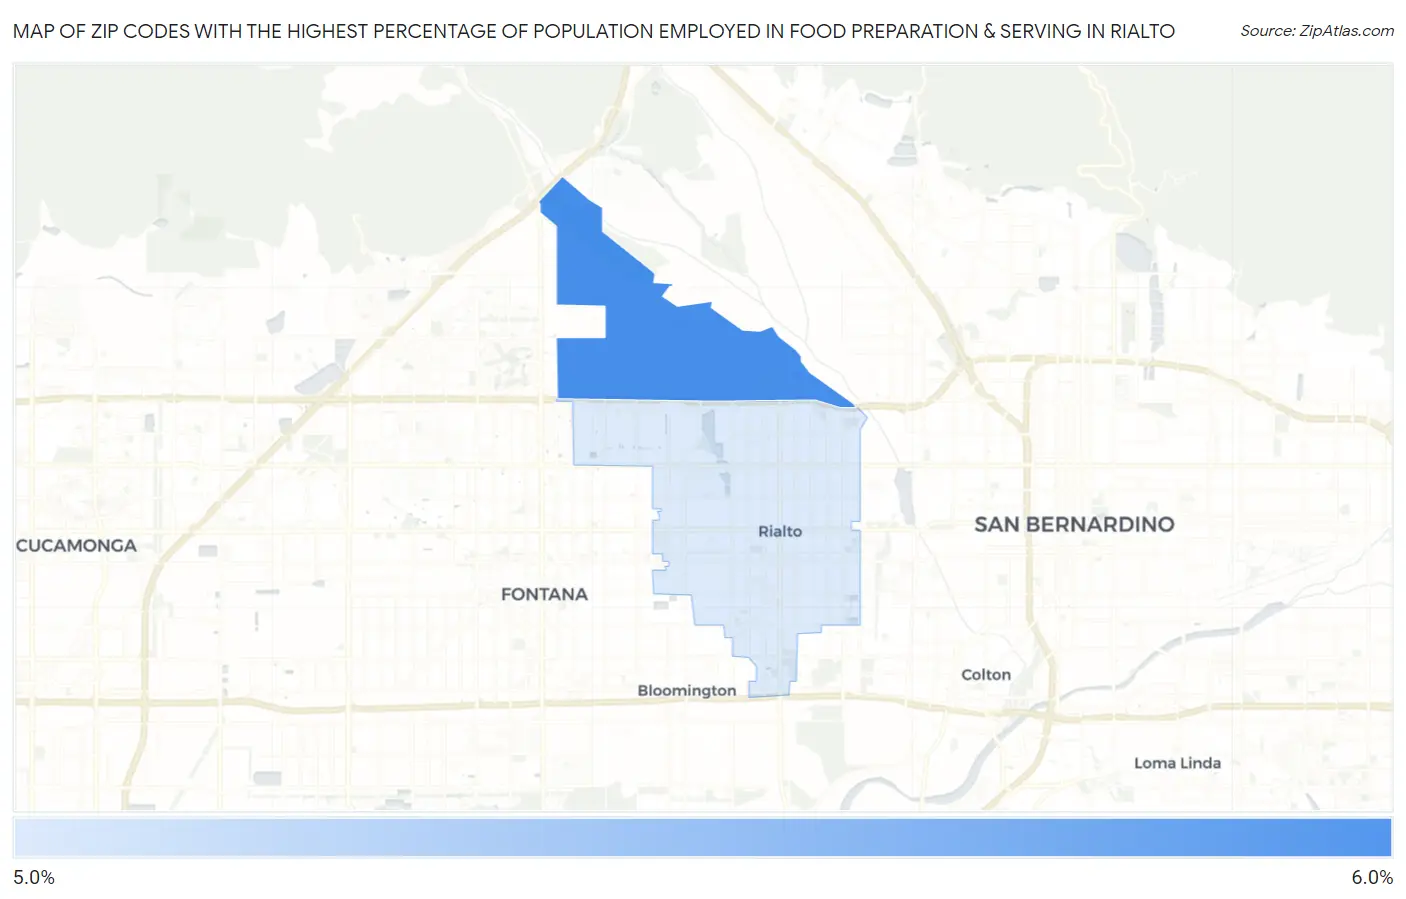
Map of Zip Codes with the Highest Percentage of Population Employed in Food Preparation & Serving in Rialto
0.0%
6.0%
Zip Codes with the Highest Percentage of Population Employed in Food Preparation & Serving in Rialto, CA
| Zip Code | % Employed | vs State | vs National | |
| 1. | 92377 | 5.4% | 5.4%(+0.035)#682 | 5.3%(+0.132)#11,352 |
| 2. | 92376 | 5.0% | 5.4%(-0.382)#785 | 5.3%(-0.285)#12,937 |
1
Common Questions
What are the Top Zip Codes with the Highest Percentage of Population Employed in Food Preparation & Serving in Rialto, CA?
Top Zip Codes with the Highest Percentage of Population Employed in Food Preparation & Serving in Rialto, CA are:
What zip code has the Highest Percentage of Population Employed in Food Preparation & Serving in Rialto, CA?
92377 has the Highest Percentage of Population Employed in Food Preparation & Serving in Rialto, CA with 5.4%.
What is the Percentage of Population Employed in Food Preparation & Serving in Rialto, CA?
Percentage of Population Employed in Food Preparation & Serving in Rialto is 5.3%.
What is the Percentage of Population Employed in Food Preparation & Serving in California?
Percentage of Population Employed in Food Preparation & Serving in California is 5.4%.
What is the Percentage of Population Employed in Food Preparation & Serving in the United States?
Percentage of Population Employed in Food Preparation & Serving in the United States is 5.3%.