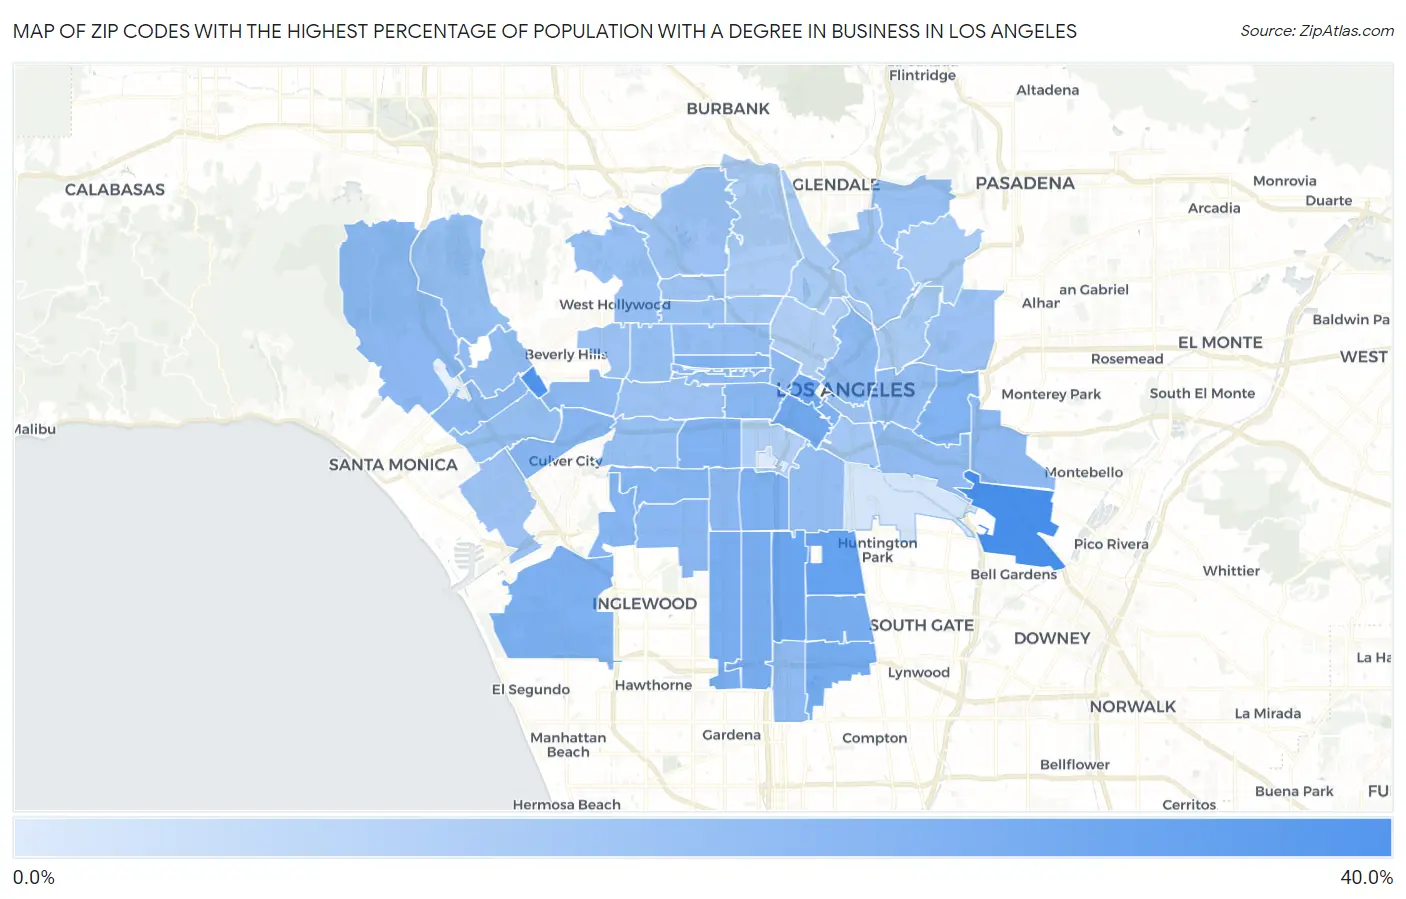
Zip Codes with the Highest Percentage of Population with a Degree in Business in Los Angeles, CA
RELATED REPORTS & OPTIONS
Business
Los Angeles
Compare Zip Codes
Map of Zip Codes with the Highest Percentage of Population with a Degree in Business in Los Angeles
0.0%
40.0%
Zip Codes with the Highest Percentage of Population with a Degree in Business in Los Angeles, CA
| Zip Code | % Graduates | vs State | vs National | |
| 1. | 90040 | 32.5% | 17.3%(+15.2)#59 | 19.5%(+13.0)#2,166 |
| 2. | 90067 | 30.1% | 17.3%(+12.8)#74 | 19.5%(+10.6)#2,794 |
| 3. | 90001 | 25.4% | 17.3%(+8.13)#139 | 19.5%(+5.94)#5,302 |
| 4. | 90003 | 23.6% | 17.3%(+6.30)#207 | 19.5%(+4.11)#7,003 |
| 5. | 90017 | 23.5% | 17.3%(+6.21)#213 | 19.5%(+4.02)#7,109 |
| 6. | 90015 | 22.9% | 17.3%(+5.59)#243 | 19.5%(+3.40)#7,758 |
| 7. | 90059 | 22.0% | 17.3%(+4.64)#301 | 19.5%(+2.45)#8,881 |
| 8. | 90002 | 21.3% | 17.3%(+4.03)#348 | 19.5%(+1.84)#9,686 |
| 9. | 90044 | 21.2% | 17.3%(+3.90)#355 | 19.5%(+1.71)#9,855 |
| 10. | 90047 | 20.6% | 17.3%(+3.25)#411 | 19.5%(+1.05)#10,806 |
| 11. | 90014 | 20.0% | 17.3%(+2.66)#466 | 19.5%(+0.466)#11,697 |
| 12. | 90037 | 19.7% | 17.3%(+2.36)#500 | 19.5%(+0.171)#12,103 |
| 13. | 90045 | 19.6% | 17.3%(+2.26)#510 | 19.5%(+0.070)#12,260 |
| 14. | 90063 | 19.5% | 17.3%(+2.15)#525 | 19.5%(-0.045)#12,443 |
| 15. | 90018 | 19.4% | 17.3%(+2.09)#530 | 19.5%(-0.097)#12,512 |
| 16. | 90020 | 19.1% | 17.3%(+1.79)#561 | 19.5%(-0.399)#12,987 |
| 17. | 90056 | 18.5% | 17.3%(+1.18)#613 | 19.5%(-1.01)#13,881 |
| 18. | 90008 | 18.1% | 17.3%(+0.798)#646 | 19.5%(-1.39)#14,422 |
| 19. | 90006 | 17.9% | 17.3%(+0.552)#679 | 19.5%(-1.64)#14,783 |
| 20. | 90034 | 17.7% | 17.3%(+0.417)#699 | 19.5%(-1.77)#15,000 |
| 21. | 90043 | 17.5% | 17.3%(+0.174)#729 | 19.5%(-2.02)#15,370 |
| 22. | 90062 | 17.3% | 17.3%(-0.006)#753 | 19.5%(-2.20)#15,658 |
| 23. | 90025 | 16.9% | 17.3%(-0.366)#799 | 19.5%(-2.56)#16,233 |
| 24. | 90022 | 16.9% | 17.3%(-0.385)#803 | 19.5%(-2.58)#16,268 |
| 25. | 90057 | 16.8% | 17.3%(-0.543)#820 | 19.5%(-2.73)#16,490 |
| 26. | 90010 | 16.7% | 17.3%(-0.601)#824 | 19.5%(-2.79)#16,570 |
| 27. | 90049 | 16.5% | 17.3%(-0.760)#840 | 19.5%(-2.95)#16,824 |
| 28. | 90061 | 16.5% | 17.3%(-0.805)#845 | 19.5%(-3.00)#16,897 |
| 29. | 90012 | 16.5% | 17.3%(-0.850)#852 | 19.5%(-3.04)#16,958 |
| 30. | 90005 | 16.2% | 17.3%(-1.14)#887 | 19.5%(-3.33)#17,365 |
| 31. | 90035 | 16.1% | 17.3%(-1.18)#890 | 19.5%(-3.37)#17,418 |
| 32. | 90023 | 16.0% | 17.3%(-1.32)#902 | 19.5%(-3.51)#17,613 |
| 33. | 90011 | 15.5% | 17.3%(-1.77)#961 | 19.5%(-3.96)#18,215 |
| 34. | 90033 | 15.4% | 17.3%(-1.86)#969 | 19.5%(-4.05)#18,339 |
| 35. | 90024 | 15.3% | 17.3%(-2.00)#986 | 19.5%(-4.19)#18,546 |
| 36. | 90004 | 15.2% | 17.3%(-2.15)#1,001 | 19.5%(-4.34)#18,750 |
| 37. | 90064 | 15.1% | 17.3%(-2.24)#1,006 | 19.5%(-4.44)#18,880 |
| 38. | 90036 | 15.0% | 17.3%(-2.33)#1,012 | 19.5%(-4.52)#19,002 |
| 39. | 90077 | 14.9% | 17.3%(-2.40)#1,022 | 19.5%(-4.59)#19,087 |
| 40. | 90016 | 14.6% | 17.3%(-2.70)#1,047 | 19.5%(-4.89)#19,459 |
| 41. | 90046 | 14.5% | 17.3%(-2.84)#1,058 | 19.5%(-5.03)#19,631 |
| 42. | 90041 | 14.4% | 17.3%(-2.95)#1,072 | 19.5%(-5.14)#19,762 |
| 43. | 90038 | 14.2% | 17.3%(-3.16)#1,101 | 19.5%(-5.35)#20,040 |
| 44. | 90028 | 14.0% | 17.3%(-3.26)#1,113 | 19.5%(-5.45)#20,177 |
| 45. | 90032 | 13.8% | 17.3%(-3.47)#1,129 | 19.5%(-5.66)#20,435 |
| 46. | 90066 | 13.7% | 17.3%(-3.62)#1,144 | 19.5%(-5.81)#20,636 |
| 47. | 90013 | 13.6% | 17.3%(-3.72)#1,152 | 19.5%(-5.91)#20,744 |
| 48. | 90068 | 13.5% | 17.3%(-3.81)#1,163 | 19.5%(-6.00)#20,860 |
| 49. | 90048 | 13.4% | 17.3%(-3.88)#1,171 | 19.5%(-6.07)#20,945 |
| 50. | 90019 | 13.3% | 17.3%(-4.02)#1,187 | 19.5%(-6.21)#21,112 |
| 51. | 90029 | 12.3% | 17.3%(-4.96)#1,244 | 19.5%(-7.15)#22,131 |
| 52. | 90065 | 12.3% | 17.3%(-4.98)#1,250 | 19.5%(-7.17)#22,161 |
| 53. | 90021 | 12.0% | 17.3%(-5.29)#1,268 | 19.5%(-7.48)#22,471 |
| 54. | 90042 | 11.2% | 17.3%(-6.07)#1,306 | 19.5%(-8.26)#23,223 |
| 55. | 90039 | 11.1% | 17.3%(-6.19)#1,316 | 19.5%(-8.38)#23,328 |
| 56. | 90031 | 11.0% | 17.3%(-6.29)#1,320 | 19.5%(-8.48)#23,448 |
| 57. | 90027 | 10.5% | 17.3%(-6.78)#1,347 | 19.5%(-8.97)#23,925 |
| 58. | 90026 | 9.8% | 17.3%(-7.50)#1,373 | 19.5%(-9.69)#24,503 |
| 59. | 90007 | 9.0% | 17.3%(-8.29)#1,406 | 19.5%(-10.5)#25,142 |
| 60. | 90058 | 2.5% | 17.3%(-14.8)#1,536 | 19.5%(-17.0)#28,260 |
| 61. | 90089 | 0.83% | 17.3%(-16.5)#1,547 | 19.5%(-18.7)#28,539 |
1
Common Questions
What are the Top 10 Zip Codes with the Highest Percentage of Population with a Degree in Business in Los Angeles, CA?
Top 10 Zip Codes with the Highest Percentage of Population with a Degree in Business in Los Angeles, CA are:
What zip code has the Highest Percentage of Population with a Degree in Business in Los Angeles, CA?
90040 has the Highest Percentage of Population with a Degree in Business in Los Angeles, CA with 32.5%.
What is the Percentage of Population with a Degree in Business in Los Angeles, CA?
Percentage of Population with a Degree in Business in Los Angeles is 16.2%.
What is the Percentage of Population with a Degree in Business in California?
Percentage of Population with a Degree in Business in California is 17.3%.
What is the Percentage of Population with a Degree in Business in the United States?
Percentage of Population with a Degree in Business in the United States is 19.5%.