Zip Codes with the Highest Percentage of Population with a Degree in Liberal Arts and History in Los Angeles, CA
RELATED REPORTS & OPTIONS
Liberal Arts and History
Los Angeles
Compare Zip Codes
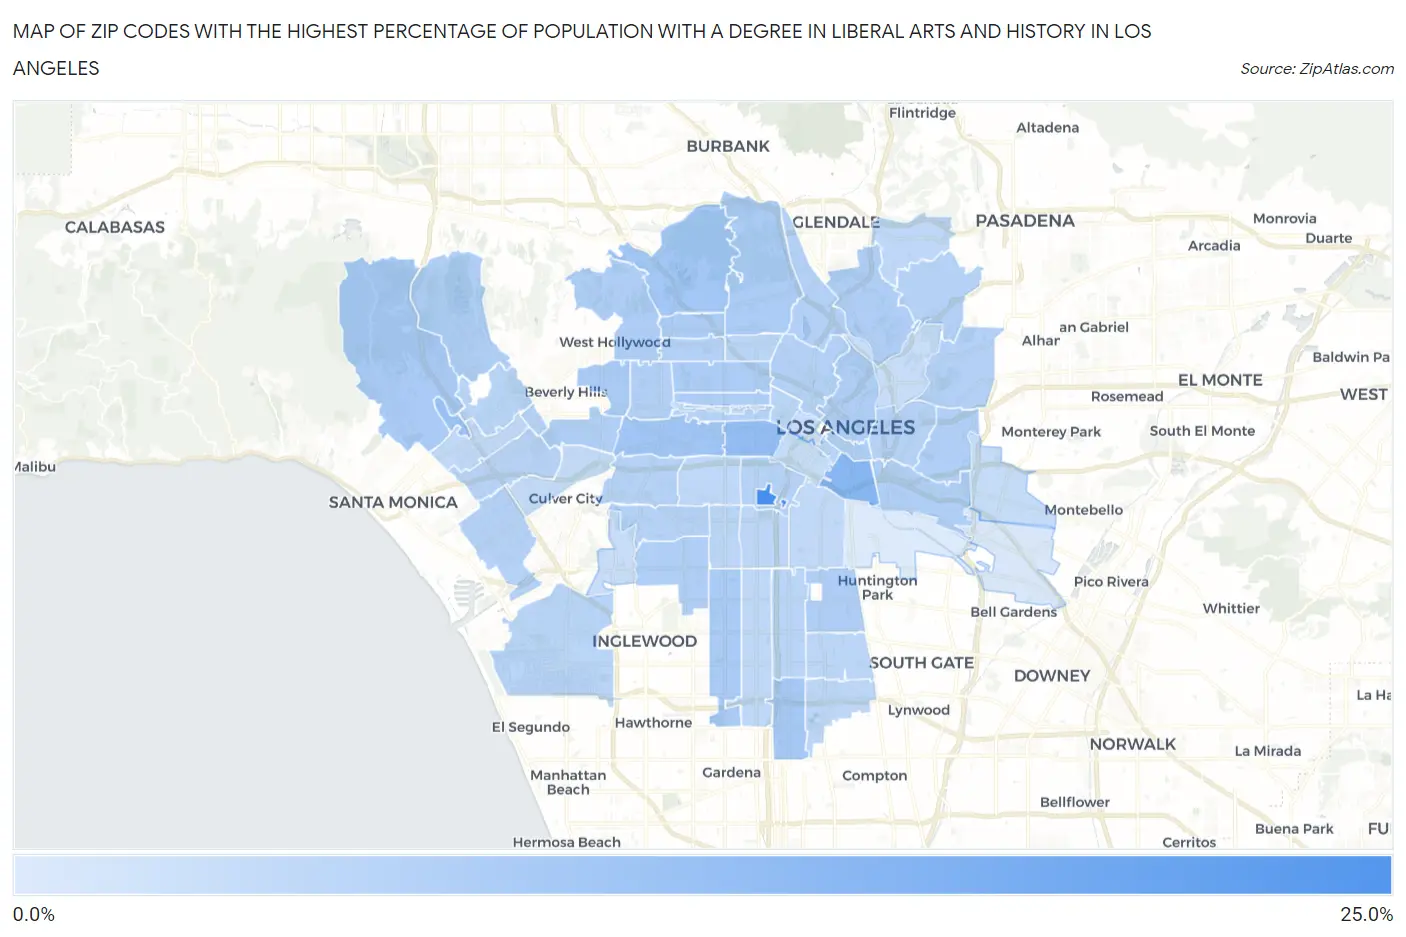
Map of Zip Codes with the Highest Percentage of Population with a Degree in Liberal Arts and History in Los Angeles
0.0%
25.0%
Zip Codes with the Highest Percentage of Population with a Degree in Liberal Arts and History in Los Angeles, CA
| Zip Code | % Graduates | vs State | vs National | |
| 1. | 90089 | 22.3% | 5.5%(+16.8)#47 | 4.9%(+17.4)#714 |
| 2. | 90021 | 12.4% | 5.5%(+6.89)#149 | 4.9%(+7.51)#2,084 |
| 3. | 90006 | 10.7% | 5.5%(+5.21)#195 | 4.9%(+5.83)#2,698 |
| 4. | 90073 | 9.2% | 5.5%(+3.73)#269 | 4.9%(+4.36)#3,660 |
| 5. | 90019 | 8.7% | 5.5%(+3.16)#307 | 4.9%(+3.79)#4,162 |
| 6. | 90068 | 8.3% | 5.5%(+2.84)#348 | 4.9%(+3.47)#4,499 |
| 7. | 90061 | 8.1% | 5.5%(+2.64)#378 | 4.9%(+3.27)#4,736 |
| 8. | 90049 | 7.5% | 5.5%(+1.98)#465 | 4.9%(+2.61)#5,618 |
| 9. | 90047 | 7.3% | 5.5%(+1.81)#492 | 4.9%(+2.43)#5,882 |
| 10. | 90048 | 7.2% | 5.5%(+1.75)#499 | 4.9%(+2.37)#5,976 |
| 11. | 90004 | 7.1% | 5.5%(+1.60)#527 | 4.9%(+2.22)#6,247 |
| 12. | 90027 | 6.9% | 5.5%(+1.40)#552 | 4.9%(+2.03)#6,549 |
| 13. | 90028 | 6.9% | 5.5%(+1.37)#558 | 4.9%(+2.00)#6,604 |
| 14. | 90012 | 6.6% | 5.5%(+1.13)#600 | 4.9%(+1.75)#7,101 |
| 15. | 90013 | 6.6% | 5.5%(+1.11)#603 | 4.9%(+1.74)#7,128 |
| 16. | 90046 | 6.6% | 5.5%(+1.10)#607 | 4.9%(+1.72)#7,152 |
| 17. | 90001 | 6.6% | 5.5%(+1.10)#608 | 4.9%(+1.72)#7,154 |
| 18. | 90065 | 6.5% | 5.5%(+1.05)#614 | 4.9%(+1.67)#7,256 |
| 19. | 90077 | 6.5% | 5.5%(+1.02)#615 | 4.9%(+1.64)#7,313 |
| 20. | 90020 | 6.4% | 5.5%(+0.915)#639 | 4.9%(+1.54)#7,537 |
| 21. | 90063 | 6.3% | 5.5%(+0.823)#657 | 4.9%(+1.45)#7,743 |
| 22. | 90043 | 6.3% | 5.5%(+0.784)#664 | 4.9%(+1.41)#7,840 |
| 23. | 90035 | 6.3% | 5.5%(+0.776)#668 | 4.9%(+1.40)#7,856 |
| 24. | 90023 | 6.3% | 5.5%(+0.766)#671 | 4.9%(+1.39)#7,868 |
| 25. | 90038 | 6.2% | 5.5%(+0.659)#700 | 4.9%(+1.28)#8,131 |
| 26. | 90026 | 6.1% | 5.5%(+0.633)#709 | 4.9%(+1.26)#8,183 |
| 27. | 90039 | 6.1% | 5.5%(+0.587)#725 | 4.9%(+1.21)#8,309 |
| 28. | 90032 | 6.0% | 5.5%(+0.490)#742 | 4.9%(+1.11)#8,560 |
| 29. | 90036 | 5.9% | 5.5%(+0.436)#758 | 4.9%(+1.06)#8,696 |
| 30. | 90007 | 5.8% | 5.5%(+0.330)#790 | 4.9%(+0.954)#8,974 |
| 31. | 90066 | 5.7% | 5.5%(+0.239)#807 | 4.9%(+0.863)#9,204 |
| 32. | 90033 | 5.7% | 5.5%(+0.225)#811 | 4.9%(+0.849)#9,243 |
| 33. | 90005 | 5.7% | 5.5%(+0.218)#812 | 4.9%(+0.842)#9,272 |
| 34. | 90008 | 5.7% | 5.5%(+0.214)#813 | 4.9%(+0.838)#9,281 |
| 35. | 90067 | 5.7% | 5.5%(+0.210)#814 | 4.9%(+0.834)#9,291 |
| 36. | 90016 | 5.6% | 5.5%(+0.143)#826 | 4.9%(+0.767)#9,462 |
| 37. | 90042 | 5.6% | 5.5%(+0.136)#827 | 4.9%(+0.760)#9,483 |
| 38. | 90064 | 5.5% | 5.5%(-0.023)#866 | 4.9%(+0.601)#9,938 |
| 39. | 90014 | 5.4% | 5.5%(-0.120)#889 | 4.9%(+0.504)#10,192 |
| 40. | 90003 | 5.2% | 5.5%(-0.318)#945 | 4.9%(+0.306)#10,789 |
| 41. | 90057 | 5.1% | 5.5%(-0.410)#962 | 4.9%(+0.213)#11,079 |
| 42. | 90029 | 5.1% | 5.5%(-0.418)#964 | 4.9%(+0.206)#11,109 |
| 43. | 90024 | 5.0% | 5.5%(-0.451)#970 | 4.9%(+0.173)#11,216 |
| 44. | 90045 | 4.9% | 5.5%(-0.561)#987 | 4.9%(+0.063)#11,542 |
| 45. | 90062 | 4.9% | 5.5%(-0.630)#1,002 | 4.9%(-0.006)#11,767 |
| 46. | 90037 | 4.8% | 5.5%(-0.668)#1,018 | 4.9%(-0.044)#11,888 |
| 47. | 90002 | 4.8% | 5.5%(-0.723)#1,023 | 4.9%(-0.099)#12,053 |
| 48. | 90059 | 4.7% | 5.5%(-0.754)#1,027 | 4.9%(-0.130)#12,182 |
| 49. | 90018 | 4.6% | 5.5%(-0.938)#1,064 | 4.9%(-0.314)#12,772 |
| 50. | 90044 | 4.5% | 5.5%(-0.983)#1,079 | 4.9%(-0.359)#12,937 |
| 51. | 90041 | 4.3% | 5.5%(-1.16)#1,112 | 4.9%(-0.536)#13,518 |
| 52. | 90025 | 4.3% | 5.5%(-1.24)#1,133 | 4.9%(-0.613)#13,779 |
| 53. | 90011 | 4.2% | 5.5%(-1.31)#1,149 | 4.9%(-0.684)#14,059 |
| 54. | 90034 | 3.9% | 5.5%(-1.56)#1,198 | 4.9%(-0.933)#15,021 |
| 55. | 90022 | 3.5% | 5.5%(-2.00)#1,274 | 4.9%(-1.38)#16,611 |
| 56. | 90015 | 3.5% | 5.5%(-2.00)#1,275 | 4.9%(-1.38)#16,616 |
| 57. | 90010 | 3.5% | 5.5%(-2.03)#1,282 | 4.9%(-1.41)#16,730 |
| 58. | 90031 | 3.3% | 5.5%(-2.23)#1,318 | 4.9%(-1.61)#17,438 |
| 59. | 90056 | 3.1% | 5.5%(-2.38)#1,334 | 4.9%(-1.76)#17,958 |
| 60. | 90017 | 2.8% | 5.5%(-2.70)#1,368 | 4.9%(-2.07)#19,017 |
| 61. | 90040 | 1.0% | 5.5%(-4.45)#1,462 | 4.9%(-3.83)#23,313 |
| 62. | 90058 | 0.42% | 5.5%(-5.08)#1,470 | 4.9%(-4.46)#24,079 |
1
Common Questions
What are the Top 10 Zip Codes with the Highest Percentage of Population with a Degree in Liberal Arts and History in Los Angeles, CA?
Top 10 Zip Codes with the Highest Percentage of Population with a Degree in Liberal Arts and History in Los Angeles, CA are:
What zip code has the Highest Percentage of Population with a Degree in Liberal Arts and History in Los Angeles, CA?
90089 has the Highest Percentage of Population with a Degree in Liberal Arts and History in Los Angeles, CA with 22.3%.
What is the Percentage of Population with a Degree in Liberal Arts and History in Los Angeles, CA?
Percentage of Population with a Degree in Liberal Arts and History in Los Angeles is 5.7%.
What is the Percentage of Population with a Degree in Liberal Arts and History in California?
Percentage of Population with a Degree in Liberal Arts and History in California is 5.5%.
What is the Percentage of Population with a Degree in Liberal Arts and History in the United States?
Percentage of Population with a Degree in Liberal Arts and History in the United States is 4.9%.