Zip Codes with the Highest Percentage of Population Employed in Education, Arts & Media in Los Angeles, CA
RELATED REPORTS & OPTIONS
Education, Arts & Media
Los Angeles
Compare Zip Codes
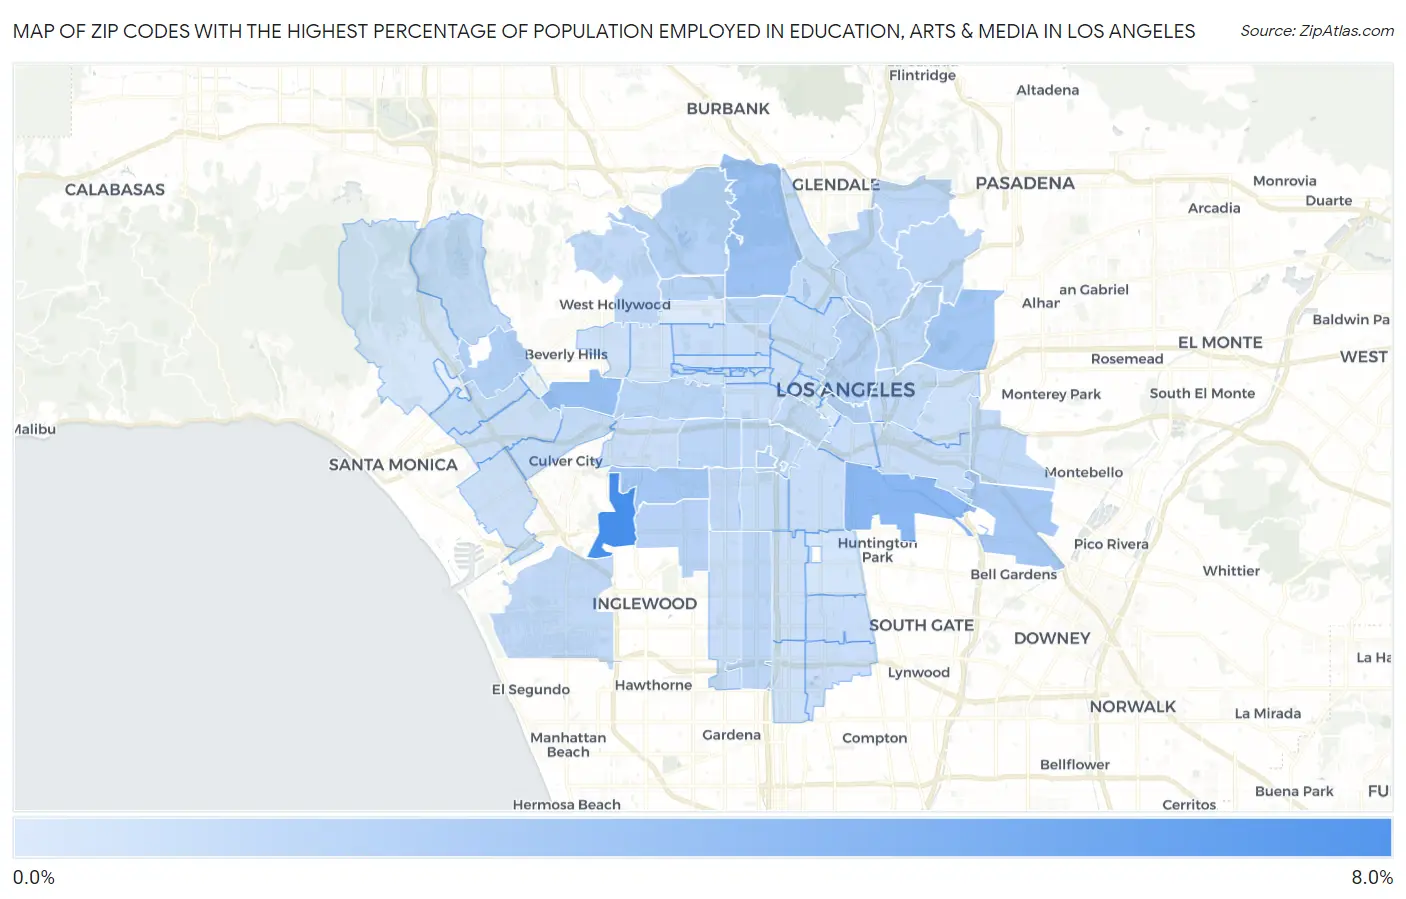
Map of Zip Codes with the Highest Percentage of Population Employed in Education, Arts & Media in Los Angeles
0.0%
8.0%
Zip Codes with the Highest Percentage of Population Employed in Education, Arts & Media in Los Angeles, CA
| Zip Code | % Employed | vs State | vs National | |
| 1. | 90056 | 7.6% | 1.7%(+5.93)#21 | 1.8%(+5.85)#681 |
| 2. | 90058 | 4.3% | 1.7%(+2.56)#68 | 1.8%(+2.48)#2,143 |
| 3. | 90035 | 3.7% | 1.7%(+1.95)#96 | 1.8%(+1.87)#2,991 |
| 4. | 90027 | 3.4% | 1.7%(+1.68)#114 | 1.8%(+1.61)#3,480 |
| 5. | 90032 | 3.1% | 1.7%(+1.36)#146 | 1.8%(+1.29)#4,250 |
| 6. | 90008 | 2.9% | 1.7%(+1.17)#176 | 1.8%(+1.10)#4,873 |
| 7. | 90040 | 2.9% | 1.7%(+1.17)#177 | 1.8%(+1.10)#4,881 |
| 8. | 90013 | 2.3% | 1.7%(+0.606)#329 | 1.8%(+0.532)#7,506 |
| 9. | 90024 | 2.2% | 1.7%(+0.507)#359 | 1.8%(+0.434)#8,080 |
| 10. | 90068 | 2.1% | 1.7%(+0.423)#394 | 1.8%(+0.350)#8,612 |
| 11. | 90089 | 2.1% | 1.7%(+0.421)#395 | 1.8%(+0.347)#8,620 |
| 12. | 90012 | 2.1% | 1.7%(+0.362)#430 | 1.8%(+0.289)#9,043 |
| 13. | 90043 | 2.0% | 1.7%(+0.293)#465 | 1.8%(+0.220)#9,514 |
| 14. | 90028 | 2.0% | 1.7%(+0.292)#467 | 1.8%(+0.219)#9,523 |
| 15. | 90019 | 1.9% | 1.7%(+0.209)#512 | 1.8%(+0.136)#10,166 |
| 16. | 90029 | 1.9% | 1.7%(+0.204)#515 | 1.8%(+0.131)#10,204 |
| 17. | 90065 | 1.8% | 1.7%(+0.124)#563 | 1.8%(+0.051)#10,857 |
| 18. | 90041 | 1.8% | 1.7%(+0.120)#568 | 1.8%(+0.047)#10,896 |
| 19. | 90042 | 1.8% | 1.7%(+0.108)#572 | 1.8%(+0.035)#10,981 |
| 20. | 90018 | 1.8% | 1.7%(+0.092)#577 | 1.8%(+0.019)#11,119 |
| 21. | 90031 | 1.8% | 1.7%(+0.091)#578 | 1.8%(+0.018)#11,128 |
| 22. | 90044 | 1.8% | 1.7%(+0.056)#598 | 1.8%(-0.017)#11,412 |
| 23. | 90022 | 1.6% | 1.7%(-0.090)#698 | 1.8%(-0.163)#12,642 |
| 24. | 90015 | 1.6% | 1.7%(-0.094)#699 | 1.8%(-0.167)#12,670 |
| 25. | 90045 | 1.6% | 1.7%(-0.094)#700 | 1.8%(-0.168)#12,677 |
| 26. | 90046 | 1.6% | 1.7%(-0.121)#722 | 1.8%(-0.194)#12,910 |
| 27. | 90007 | 1.6% | 1.7%(-0.121)#723 | 1.8%(-0.194)#12,912 |
| 28. | 90062 | 1.5% | 1.7%(-0.169)#749 | 1.8%(-0.242)#13,361 |
| 29. | 90033 | 1.5% | 1.7%(-0.192)#767 | 1.8%(-0.266)#13,595 |
| 30. | 90037 | 1.4% | 1.7%(-0.294)#831 | 1.8%(-0.368)#14,615 |
| 31. | 90026 | 1.4% | 1.7%(-0.351)#862 | 1.8%(-0.425)#15,123 |
| 32. | 90077 | 1.4% | 1.7%(-0.352)#863 | 1.8%(-0.425)#15,125 |
| 33. | 90025 | 1.4% | 1.7%(-0.353)#864 | 1.8%(-0.426)#15,135 |
| 34. | 90039 | 1.4% | 1.7%(-0.362)#874 | 1.8%(-0.435)#15,222 |
| 35. | 90034 | 1.3% | 1.7%(-0.396)#894 | 1.8%(-0.469)#15,512 |
| 36. | 90006 | 1.3% | 1.7%(-0.454)#933 | 1.8%(-0.528)#16,095 |
| 37. | 90021 | 1.3% | 1.7%(-0.457)#935 | 1.8%(-0.531)#16,124 |
| 38. | 90004 | 1.2% | 1.7%(-0.466)#942 | 1.8%(-0.540)#16,219 |
| 39. | 90011 | 1.2% | 1.7%(-0.472)#949 | 1.8%(-0.545)#16,277 |
| 40. | 90002 | 1.2% | 1.7%(-0.482)#955 | 1.8%(-0.555)#16,351 |
| 41. | 90047 | 1.2% | 1.7%(-0.498)#970 | 1.8%(-0.572)#16,514 |
| 42. | 90023 | 1.2% | 1.7%(-0.503)#974 | 1.8%(-0.576)#16,556 |
| 43. | 90016 | 1.2% | 1.7%(-0.560)#1,002 | 1.8%(-0.633)#17,105 |
| 44. | 90010 | 1.1% | 1.7%(-0.596)#1,024 | 1.8%(-0.669)#17,428 |
| 45. | 90059 | 1.1% | 1.7%(-0.597)#1,026 | 1.8%(-0.670)#17,440 |
| 46. | 90003 | 1.1% | 1.7%(-0.620)#1,040 | 1.8%(-0.694)#17,668 |
| 47. | 90066 | 1.1% | 1.7%(-0.659)#1,061 | 1.8%(-0.732)#18,007 |
| 48. | 90064 | 1.0% | 1.7%(-0.666)#1,068 | 1.8%(-0.740)#18,071 |
| 49. | 90063 | 1.00% | 1.7%(-0.714)#1,102 | 1.8%(-0.787)#18,536 |
| 50. | 90005 | 0.95% | 1.7%(-0.759)#1,124 | 1.8%(-0.832)#18,942 |
| 51. | 90061 | 0.92% | 1.7%(-0.788)#1,137 | 1.8%(-0.862)#19,193 |
| 52. | 90048 | 0.90% | 1.7%(-0.811)#1,154 | 1.8%(-0.884)#19,391 |
| 53. | 90057 | 0.89% | 1.7%(-0.819)#1,158 | 1.8%(-0.892)#19,455 |
| 54. | 90020 | 0.84% | 1.7%(-0.868)#1,180 | 1.8%(-0.941)#19,871 |
| 55. | 90036 | 0.79% | 1.7%(-0.925)#1,198 | 1.8%(-0.998)#20,338 |
| 56. | 90017 | 0.77% | 1.7%(-0.947)#1,205 | 1.8%(-1.02)#20,501 |
| 57. | 90001 | 0.70% | 1.7%(-1.02)#1,227 | 1.8%(-1.09)#20,999 |
| 58. | 90049 | 0.55% | 1.7%(-1.16)#1,265 | 1.8%(-1.23)#21,974 |
| 59. | 90014 | 0.53% | 1.7%(-1.18)#1,274 | 1.8%(-1.25)#22,132 |
| 60. | 90038 | 0.27% | 1.7%(-1.44)#1,323 | 1.8%(-1.52)#23,582 |
1
Common Questions
What are the Top 10 Zip Codes with the Highest Percentage of Population Employed in Education, Arts & Media in Los Angeles, CA?
Top 10 Zip Codes with the Highest Percentage of Population Employed in Education, Arts & Media in Los Angeles, CA are:
What zip code has the Highest Percentage of Population Employed in Education, Arts & Media in Los Angeles, CA?
90056 has the Highest Percentage of Population Employed in Education, Arts & Media in Los Angeles, CA with 7.6%.
What is the Percentage of Population Employed in Education, Arts & Media in Los Angeles, CA?
Percentage of Population Employed in Education, Arts & Media in Los Angeles is 1.6%.
What is the Percentage of Population Employed in Education, Arts & Media in California?
Percentage of Population Employed in Education, Arts & Media in California is 1.7%.
What is the Percentage of Population Employed in Education, Arts & Media in the United States?
Percentage of Population Employed in Education, Arts & Media in the United States is 1.8%.