Zip Codes with the Highest Percentage of Population Employed in Finance & Insurance in Los Angeles, CA
RELATED REPORTS & OPTIONS
Finance & Insurance
Los Angeles
Compare Zip Codes
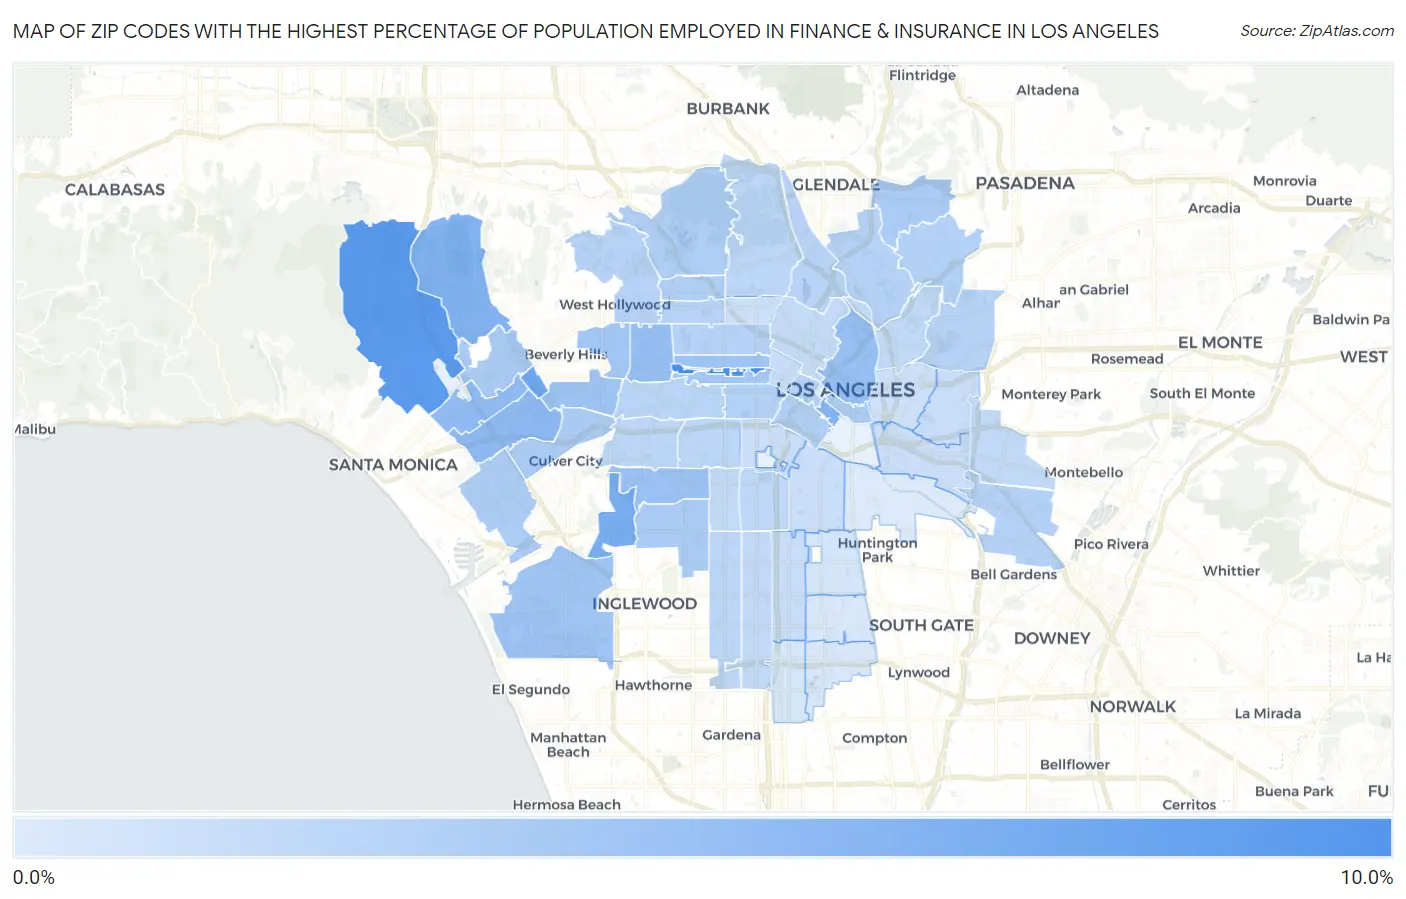
Map of Zip Codes with the Highest Percentage of Population Employed in Finance & Insurance in Los Angeles
0.0%
10.0%
Zip Codes with the Highest Percentage of Population Employed in Finance & Insurance in Los Angeles, CA
| Zip Code | % Employed | vs State | vs National | |
| 1. | 90010 | 9.7% | 3.7%(+6.02)#45 | 4.8%(+4.95)#1,864 |
| 2. | 90049 | 8.5% | 3.7%(+4.75)#82 | 4.8%(+3.68)#2,672 |
| 3. | 90067 | 7.1% | 3.7%(+3.44)#140 | 4.8%(+2.38)#4,041 |
| 4. | 90056 | 6.6% | 3.7%(+2.87)#174 | 4.8%(+1.80)#4,861 |
| 5. | 90077 | 6.0% | 3.7%(+2.26)#225 | 4.8%(+1.19)#5,955 |
| 6. | 90014 | 5.8% | 3.7%(+2.14)#241 | 4.8%(+1.07)#6,208 |
| 7. | 90064 | 5.2% | 3.7%(+1.46)#313 | 4.8%(+0.394)#7,820 |
| 8. | 90025 | 5.1% | 3.7%(+1.37)#325 | 4.8%(+0.305)#8,071 |
| 9. | 90036 | 4.8% | 3.7%(+1.05)#374 | 4.8%(-0.015)#9,045 |
| 10. | 90012 | 4.6% | 3.7%(+0.899)#405 | 4.8%(-0.168)#9,530 |
| 11. | 90008 | 4.3% | 3.7%(+0.576)#457 | 4.8%(-0.491)#10,629 |
| 12. | 90035 | 4.2% | 3.7%(+0.475)#479 | 4.8%(-0.592)#10,934 |
| 13. | 90020 | 4.0% | 3.7%(+0.300)#511 | 4.8%(-0.767)#11,579 |
| 14. | 90045 | 4.0% | 3.7%(+0.260)#524 | 4.8%(-0.808)#11,762 |
| 15. | 90005 | 3.9% | 3.7%(+0.175)#541 | 4.8%(-0.893)#12,092 |
| 16. | 90048 | 3.9% | 3.7%(+0.170)#542 | 4.8%(-0.898)#12,119 |
| 17. | 90043 | 3.5% | 3.7%(-0.174)#617 | 4.8%(-1.24)#13,493 |
| 18. | 90041 | 3.5% | 3.7%(-0.217)#625 | 4.8%(-1.28)#13,662 |
| 19. | 90024 | 3.4% | 3.7%(-0.266)#643 | 4.8%(-1.33)#13,899 |
| 20. | 90034 | 3.3% | 3.7%(-0.382)#674 | 4.8%(-1.45)#14,389 |
| 21. | 90013 | 3.3% | 3.7%(-0.406)#679 | 4.8%(-1.47)#14,475 |
| 22. | 90066 | 3.3% | 3.7%(-0.419)#681 | 4.8%(-1.49)#14,533 |
| 23. | 90068 | 3.2% | 3.7%(-0.507)#708 | 4.8%(-1.57)#14,951 |
| 24. | 90015 | 3.1% | 3.7%(-0.607)#737 | 4.8%(-1.67)#15,409 |
| 25. | 90028 | 3.1% | 3.7%(-0.629)#744 | 4.8%(-1.70)#15,510 |
| 26. | 90042 | 2.9% | 3.7%(-0.776)#792 | 4.8%(-1.84)#16,168 |
| 27. | 90040 | 2.9% | 3.7%(-0.778)#793 | 4.8%(-1.85)#16,182 |
| 28. | 90006 | 2.9% | 3.7%(-0.781)#795 | 4.8%(-1.85)#16,191 |
| 29. | 90017 | 2.8% | 3.7%(-0.854)#808 | 4.8%(-1.92)#16,519 |
| 30. | 90065 | 2.8% | 3.7%(-0.881)#815 | 4.8%(-1.95)#16,639 |
| 31. | 90032 | 2.7% | 3.7%(-0.983)#846 | 4.8%(-2.05)#17,156 |
| 32. | 90004 | 2.7% | 3.7%(-1.01)#856 | 4.8%(-2.08)#17,283 |
| 33. | 90046 | 2.7% | 3.7%(-1.03)#861 | 4.8%(-2.09)#17,359 |
| 34. | 90039 | 2.6% | 3.7%(-1.06)#868 | 4.8%(-2.13)#17,512 |
| 35. | 90038 | 2.6% | 3.7%(-1.09)#877 | 4.8%(-2.16)#17,643 |
| 36. | 90019 | 2.5% | 3.7%(-1.20)#914 | 4.8%(-2.27)#18,195 |
| 37. | 90018 | 2.4% | 3.7%(-1.31)#952 | 4.8%(-2.38)#18,716 |
| 38. | 90047 | 2.4% | 3.7%(-1.34)#959 | 4.8%(-2.40)#18,832 |
| 39. | 90016 | 2.3% | 3.7%(-1.35)#961 | 4.8%(-2.42)#18,898 |
| 40. | 90027 | 2.3% | 3.7%(-1.41)#975 | 4.8%(-2.47)#19,131 |
| 41. | 90037 | 2.2% | 3.7%(-1.54)#1,011 | 4.8%(-2.61)#19,770 |
| 42. | 90022 | 2.1% | 3.7%(-1.62)#1,037 | 4.8%(-2.69)#20,137 |
| 43. | 90031 | 2.0% | 3.7%(-1.69)#1,055 | 4.8%(-2.75)#20,417 |
| 44. | 90044 | 2.0% | 3.7%(-1.69)#1,060 | 4.8%(-2.76)#20,452 |
| 45. | 90026 | 1.9% | 3.7%(-1.76)#1,073 | 4.8%(-2.83)#20,722 |
| 46. | 90062 | 1.9% | 3.7%(-1.84)#1,094 | 4.8%(-2.91)#21,078 |
| 47. | 90063 | 1.7% | 3.7%(-2.03)#1,142 | 4.8%(-3.10)#21,862 |
| 48. | 90003 | 1.7% | 3.7%(-2.04)#1,148 | 4.8%(-3.11)#21,929 |
| 49. | 90057 | 1.6% | 3.7%(-2.10)#1,161 | 4.8%(-3.17)#22,149 |
| 50. | 90023 | 1.5% | 3.7%(-2.15)#1,175 | 4.8%(-3.22)#22,360 |
| 51. | 90011 | 1.5% | 3.7%(-2.23)#1,187 | 4.8%(-3.30)#22,663 |
| 52. | 90007 | 1.5% | 3.7%(-2.25)#1,192 | 4.8%(-3.32)#22,764 |
| 53. | 90029 | 1.4% | 3.7%(-2.28)#1,201 | 4.8%(-3.34)#22,854 |
| 54. | 90033 | 1.3% | 3.7%(-2.45)#1,228 | 4.8%(-3.52)#23,480 |
| 55. | 90001 | 1.0% | 3.7%(-2.69)#1,273 | 4.8%(-3.76)#24,278 |
| 56. | 90061 | 0.74% | 3.7%(-2.96)#1,308 | 4.8%(-4.03)#24,993 |
| 57. | 90002 | 0.73% | 3.7%(-2.97)#1,309 | 4.8%(-4.04)#25,041 |
| 58. | 90059 | 0.71% | 3.7%(-2.99)#1,313 | 4.8%(-4.06)#25,078 |
| 59. | 90058 | 0.39% | 3.7%(-3.31)#1,347 | 4.8%(-4.37)#25,754 |
1
Common Questions
What are the Top 10 Zip Codes with the Highest Percentage of Population Employed in Finance & Insurance in Los Angeles, CA?
Top 10 Zip Codes with the Highest Percentage of Population Employed in Finance & Insurance in Los Angeles, CA are:
What zip code has the Highest Percentage of Population Employed in Finance & Insurance in Los Angeles, CA?
90010 has the Highest Percentage of Population Employed in Finance & Insurance in Los Angeles, CA with 9.7%.
What is the Percentage of Population Employed in Finance & Insurance in Los Angeles, CA?
Percentage of Population Employed in Finance & Insurance in Los Angeles is 3.5%.
What is the Percentage of Population Employed in Finance & Insurance in California?
Percentage of Population Employed in Finance & Insurance in California is 3.7%.
What is the Percentage of Population Employed in Finance & Insurance in the United States?
Percentage of Population Employed in Finance & Insurance in the United States is 4.8%.