Zip Codes with the Highest Percentage of Population Employed in Life, Physical & Social Science in Los Angeles, CA
RELATED REPORTS & OPTIONS
Life, Physical & Social Science
Los Angeles
Compare Zip Codes
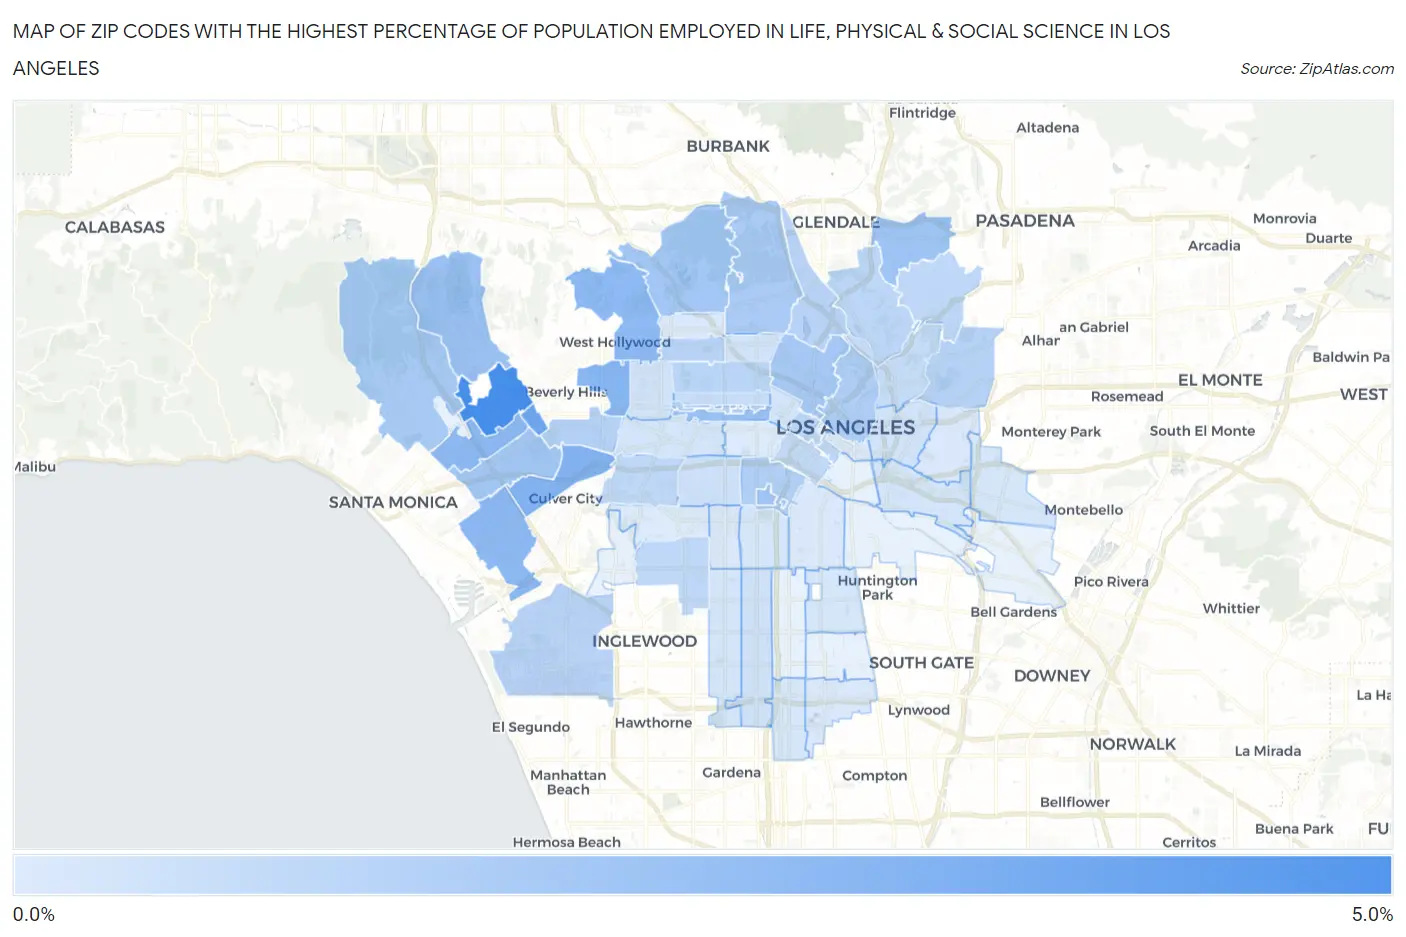
Map of Zip Codes with the Highest Percentage of Population Employed in Life, Physical & Social Science in Los Angeles
0.0%
5.0%
Zip Codes with the Highest Percentage of Population Employed in Life, Physical & Social Science in Los Angeles, CA
| Zip Code | % Employed | vs State | vs National | |
| 1. | 90024 | 4.2% | 1.3%(+2.87)#112 | 1.1%(+3.09)#1,061 |
| 2. | 90067 | 3.1% | 1.3%(+1.79)#179 | 1.1%(+2.01)#1,764 |
| 3. | 90034 | 2.5% | 1.3%(+1.23)#235 | 1.1%(+1.45)#2,502 |
| 4. | 90048 | 2.4% | 1.3%(+1.11)#249 | 1.1%(+1.32)#2,732 |
| 5. | 90066 | 2.3% | 1.3%(+0.993)#267 | 1.1%(+1.21)#2,959 |
| 6. | 90025 | 2.3% | 1.3%(+0.973)#271 | 1.1%(+1.19)#2,996 |
| 7. | 90046 | 2.2% | 1.3%(+0.934)#278 | 1.1%(+1.15)#3,079 |
| 8. | 90005 | 2.0% | 1.3%(+0.677)#335 | 1.1%(+0.894)#3,726 |
| 9. | 90077 | 2.0% | 1.3%(+0.649)#345 | 1.1%(+0.866)#3,805 |
| 10. | 90089 | 1.8% | 1.3%(+0.492)#381 | 1.1%(+0.709)#4,323 |
| 11. | 90041 | 1.8% | 1.3%(+0.477)#383 | 1.1%(+0.694)#4,381 |
| 12. | 90064 | 1.7% | 1.3%(+0.382)#413 | 1.1%(+0.599)#4,780 |
| 13. | 90068 | 1.7% | 1.3%(+0.377)#417 | 1.1%(+0.594)#4,799 |
| 14. | 90026 | 1.6% | 1.3%(+0.302)#448 | 1.1%(+0.519)#5,110 |
| 15. | 90049 | 1.5% | 1.3%(+0.235)#476 | 1.1%(+0.452)#5,421 |
| 16. | 90027 | 1.5% | 1.3%(+0.217)#486 | 1.1%(+0.434)#5,522 |
| 17. | 90012 | 1.4% | 1.3%(+0.062)#540 | 1.1%(+0.279)#6,357 |
| 18. | 90007 | 1.3% | 1.3%(+0.006)#565 | 1.1%(+0.223)#6,716 |
| 19. | 90035 | 1.2% | 1.3%(-0.099)#617 | 1.1%(+0.118)#7,428 |
| 20. | 90010 | 1.2% | 1.3%(-0.117)#629 | 1.1%(+0.100)#7,556 |
| 21. | 90032 | 1.2% | 1.3%(-0.135)#640 | 1.1%(+0.082)#7,703 |
| 22. | 90045 | 1.1% | 1.3%(-0.183)#668 | 1.1%(+0.034)#8,038 |
| 23. | 90039 | 1.1% | 1.3%(-0.194)#676 | 1.1%(+0.023)#8,117 |
| 24. | 90038 | 1.1% | 1.3%(-0.197)#682 | 1.1%(+0.020)#8,139 |
| 25. | 90004 | 1.1% | 1.3%(-0.218)#694 | 1.1%(-0.001)#8,302 |
| 26. | 90065 | 1.0% | 1.3%(-0.289)#730 | 1.1%(-0.072)#8,899 |
| 27. | 90017 | 1.0% | 1.3%(-0.304)#738 | 1.1%(-0.087)#9,019 |
| 28. | 90014 | 1.0% | 1.3%(-0.307)#742 | 1.1%(-0.090)#9,037 |
| 29. | 90043 | 0.95% | 1.3%(-0.355)#769 | 1.1%(-0.138)#9,469 |
| 30. | 90016 | 0.95% | 1.3%(-0.361)#773 | 1.1%(-0.144)#9,522 |
| 31. | 90042 | 0.92% | 1.3%(-0.386)#790 | 1.1%(-0.169)#9,744 |
| 32. | 90015 | 0.87% | 1.3%(-0.436)#819 | 1.1%(-0.219)#10,229 |
| 33. | 90031 | 0.80% | 1.3%(-0.510)#883 | 1.1%(-0.293)#11,020 |
| 34. | 90020 | 0.69% | 1.3%(-0.620)#951 | 1.1%(-0.403)#12,185 |
| 35. | 90018 | 0.56% | 1.3%(-0.747)#1,035 | 1.1%(-0.530)#13,757 |
| 36. | 90044 | 0.52% | 1.3%(-0.792)#1,066 | 1.1%(-0.575)#14,308 |
| 37. | 90029 | 0.49% | 1.3%(-0.815)#1,082 | 1.1%(-0.598)#14,595 |
| 38. | 90036 | 0.49% | 1.3%(-0.819)#1,088 | 1.1%(-0.602)#14,643 |
| 39. | 90033 | 0.46% | 1.3%(-0.846)#1,103 | 1.1%(-0.629)#14,998 |
| 40. | 90057 | 0.43% | 1.3%(-0.881)#1,124 | 1.1%(-0.664)#15,410 |
| 41. | 90019 | 0.42% | 1.3%(-0.884)#1,126 | 1.1%(-0.667)#15,453 |
| 42. | 90047 | 0.39% | 1.3%(-0.922)#1,144 | 1.1%(-0.705)#15,936 |
| 43. | 90023 | 0.38% | 1.3%(-0.929)#1,148 | 1.1%(-0.712)#16,017 |
| 44. | 90061 | 0.37% | 1.3%(-0.941)#1,161 | 1.1%(-0.724)#16,183 |
| 45. | 90022 | 0.33% | 1.3%(-0.982)#1,182 | 1.1%(-0.765)#16,721 |
| 46. | 90001 | 0.32% | 1.3%(-0.984)#1,184 | 1.1%(-0.767)#16,744 |
| 47. | 90037 | 0.32% | 1.3%(-0.986)#1,186 | 1.1%(-0.769)#16,774 |
| 48. | 90011 | 0.24% | 1.3%(-1.07)#1,226 | 1.1%(-0.852)#17,768 |
| 49. | 90059 | 0.21% | 1.3%(-1.10)#1,232 | 1.1%(-0.879)#18,056 |
| 50. | 90062 | 0.21% | 1.3%(-1.10)#1,236 | 1.1%(-0.883)#18,109 |
| 51. | 90013 | 0.21% | 1.3%(-1.10)#1,238 | 1.1%(-0.883)#18,111 |
| 52. | 90028 | 0.21% | 1.3%(-1.10)#1,239 | 1.1%(-0.884)#18,125 |
| 53. | 90063 | 0.20% | 1.3%(-1.11)#1,241 | 1.1%(-0.889)#18,170 |
| 54. | 90006 | 0.18% | 1.3%(-1.13)#1,248 | 1.1%(-0.909)#18,381 |
| 55. | 90008 | 0.16% | 1.3%(-1.15)#1,257 | 1.1%(-0.930)#18,578 |
1
Common Questions
What are the Top 10 Zip Codes with the Highest Percentage of Population Employed in Life, Physical & Social Science in Los Angeles, CA?
Top 10 Zip Codes with the Highest Percentage of Population Employed in Life, Physical & Social Science in Los Angeles, CA are:
What zip code has the Highest Percentage of Population Employed in Life, Physical & Social Science in Los Angeles, CA?
90024 has the Highest Percentage of Population Employed in Life, Physical & Social Science in Los Angeles, CA with 4.2%.
What is the Percentage of Population Employed in Life, Physical & Social Science in Los Angeles, CA?
Percentage of Population Employed in Life, Physical & Social Science in Los Angeles is 0.93%.
What is the Percentage of Population Employed in Life, Physical & Social Science in California?
Percentage of Population Employed in Life, Physical & Social Science in California is 1.3%.
What is the Percentage of Population Employed in Life, Physical & Social Science in the United States?
Percentage of Population Employed in Life, Physical & Social Science in the United States is 1.1%.