Zip Codes with the Highest Percentage of Population with a Degree in Bio, Nature & Agricultural in Los Angeles, CA
RELATED REPORTS & OPTIONS
Bio, Nature & Agricultural
Los Angeles
Compare Zip Codes
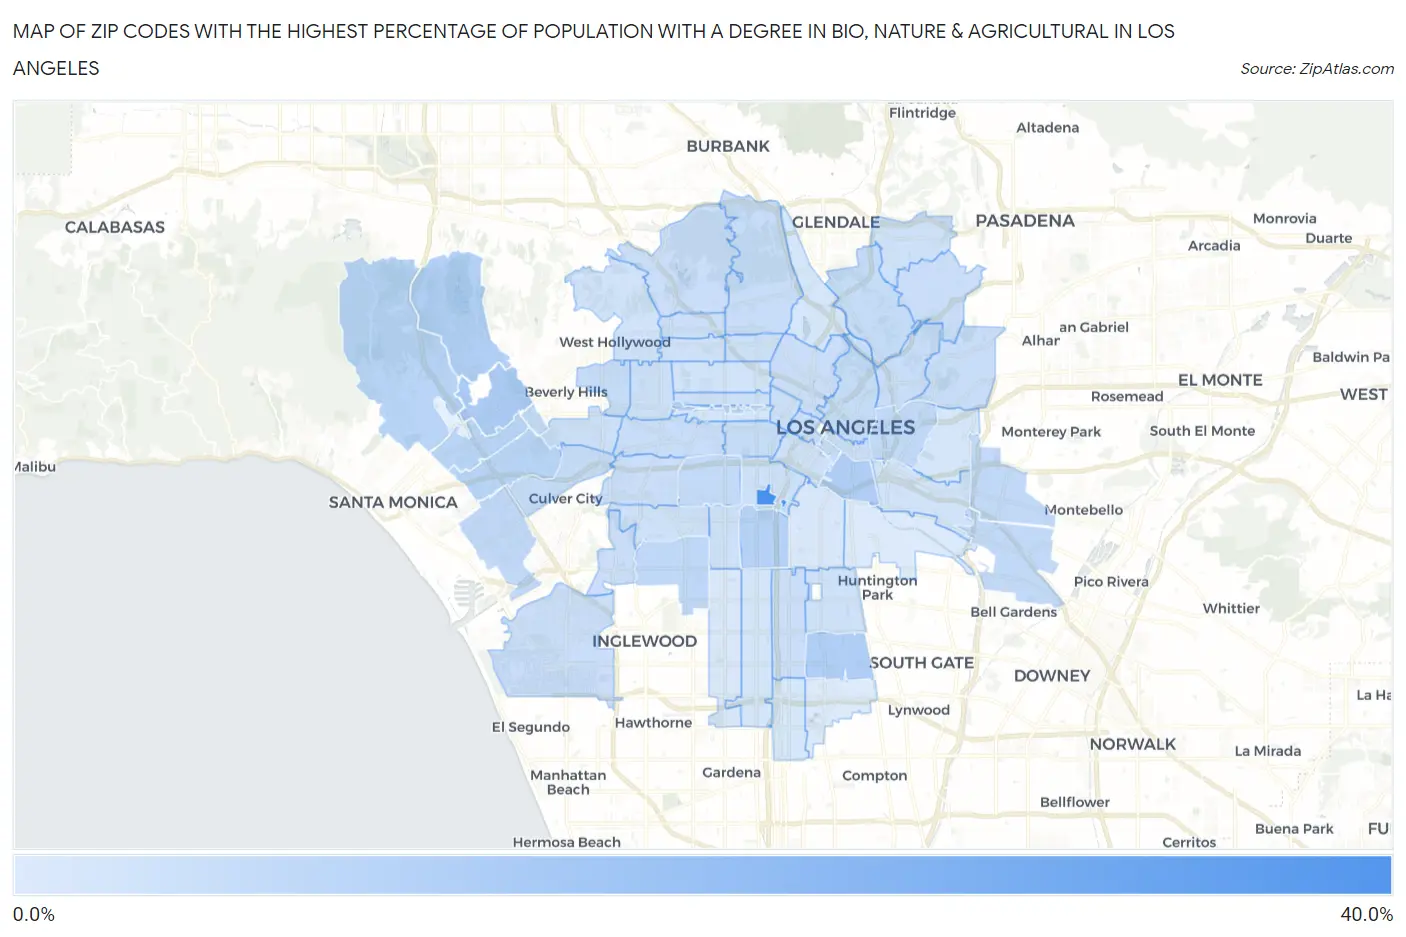
Map of Zip Codes with the Highest Percentage of Population with a Degree in Bio, Nature & Agricultural in Los Angeles
0.0%
40.0%
Zip Codes with the Highest Percentage of Population with a Degree in Bio, Nature & Agricultural in Los Angeles, CA
| Zip Code | % Graduates | vs State | vs National | |
| 1. | 90089 | 30.6% | 6.8%(+23.8)#44 | 6.4%(+24.2)#1,045 |
| 2. | 90024 | 9.7% | 6.8%(+2.95)#414 | 6.4%(+3.37)#8,471 |
| 3. | 90021 | 9.4% | 6.8%(+2.65)#443 | 6.4%(+3.07)#8,865 |
| 4. | 90002 | 8.9% | 6.8%(+2.18)#484 | 6.4%(+2.60)#9,620 |
| 5. | 90077 | 8.6% | 6.8%(+1.80)#520 | 6.4%(+2.22)#10,197 |
| 6. | 90037 | 8.1% | 6.8%(+1.35)#575 | 6.4%(+1.77)#10,964 |
| 7. | 90010 | 7.4% | 6.8%(+0.643)#671 | 6.4%(+1.06)#12,368 |
| 8. | 90049 | 7.4% | 6.8%(+0.622)#674 | 6.4%(+1.04)#12,423 |
| 9. | 90025 | 7.3% | 6.8%(+0.538)#690 | 6.4%(+0.956)#12,633 |
| 10. | 90064 | 7.0% | 6.8%(+0.278)#723 | 6.4%(+0.696)#13,209 |
| 11. | 90043 | 6.3% | 6.8%(-0.472)#880 | 6.4%(-0.054)#15,126 |
| 12. | 90033 | 6.0% | 6.8%(-0.761)#949 | 6.4%(-0.343)#15,886 |
| 13. | 90067 | 6.0% | 6.8%(-0.781)#953 | 6.4%(-0.362)#15,938 |
| 14. | 90022 | 5.8% | 6.8%(-0.938)#981 | 6.4%(-0.520)#16,406 |
| 15. | 90066 | 5.7% | 6.8%(-1.02)#998 | 6.4%(-0.604)#16,614 |
| 16. | 90040 | 5.7% | 6.8%(-1.03)#1,002 | 6.4%(-0.612)#16,638 |
| 17. | 90014 | 5.7% | 6.8%(-1.04)#1,007 | 6.4%(-0.624)#16,667 |
| 18. | 90018 | 5.7% | 6.8%(-1.09)#1,014 | 6.4%(-0.671)#16,791 |
| 19. | 90006 | 5.3% | 6.8%(-1.50)#1,092 | 6.4%(-1.08)#17,980 |
| 20. | 90012 | 5.2% | 6.8%(-1.61)#1,112 | 6.4%(-1.19)#18,328 |
| 21. | 90034 | 5.1% | 6.8%(-1.67)#1,127 | 6.4%(-1.25)#18,487 |
| 22. | 90065 | 5.1% | 6.8%(-1.69)#1,132 | 6.4%(-1.27)#18,564 |
| 23. | 90048 | 5.0% | 6.8%(-1.76)#1,139 | 6.4%(-1.34)#18,745 |
| 24. | 90032 | 4.9% | 6.8%(-1.89)#1,151 | 6.4%(-1.47)#19,135 |
| 25. | 90031 | 4.8% | 6.8%(-2.02)#1,184 | 6.4%(-1.60)#19,556 |
| 26. | 90027 | 4.7% | 6.8%(-2.06)#1,191 | 6.4%(-1.64)#19,660 |
| 27. | 90019 | 4.7% | 6.8%(-2.08)#1,198 | 6.4%(-1.66)#19,732 |
| 28. | 90013 | 4.4% | 6.8%(-2.35)#1,250 | 6.4%(-1.93)#20,492 |
| 29. | 90056 | 4.4% | 6.8%(-2.36)#1,251 | 6.4%(-1.94)#20,503 |
| 30. | 90028 | 4.4% | 6.8%(-2.37)#1,252 | 6.4%(-1.95)#20,529 |
| 31. | 90026 | 4.4% | 6.8%(-2.40)#1,261 | 6.4%(-1.98)#20,633 |
| 32. | 90042 | 4.3% | 6.8%(-2.52)#1,280 | 6.4%(-2.10)#20,996 |
| 33. | 90003 | 4.2% | 6.8%(-2.56)#1,286 | 6.4%(-2.14)#21,121 |
| 34. | 90017 | 4.2% | 6.8%(-2.58)#1,290 | 6.4%(-2.17)#21,188 |
| 35. | 90016 | 4.2% | 6.8%(-2.59)#1,292 | 6.4%(-2.17)#21,209 |
| 36. | 90045 | 4.2% | 6.8%(-2.60)#1,297 | 6.4%(-2.19)#21,242 |
| 37. | 90068 | 4.2% | 6.8%(-2.62)#1,299 | 6.4%(-2.20)#21,281 |
| 38. | 90035 | 4.0% | 6.8%(-2.73)#1,319 | 6.4%(-2.32)#21,562 |
| 39. | 90020 | 3.9% | 6.8%(-2.87)#1,341 | 6.4%(-2.45)#21,893 |
| 40. | 90007 | 3.9% | 6.8%(-2.89)#1,345 | 6.4%(-2.47)#21,944 |
| 41. | 90029 | 3.9% | 6.8%(-2.92)#1,349 | 6.4%(-2.50)#22,015 |
| 42. | 90057 | 3.8% | 6.8%(-2.95)#1,355 | 6.4%(-2.53)#22,111 |
| 43. | 90036 | 3.7% | 6.8%(-3.08)#1,368 | 6.4%(-2.66)#22,385 |
| 44. | 90041 | 3.6% | 6.8%(-3.17)#1,377 | 6.4%(-2.75)#22,591 |
| 45. | 90038 | 3.5% | 6.8%(-3.27)#1,393 | 6.4%(-2.86)#22,830 |
| 46. | 90008 | 3.5% | 6.8%(-3.28)#1,394 | 6.4%(-2.86)#22,847 |
| 47. | 90001 | 3.5% | 6.8%(-3.31)#1,397 | 6.4%(-2.89)#22,901 |
| 48. | 90015 | 3.4% | 6.8%(-3.36)#1,406 | 6.4%(-2.95)#23,018 |
| 49. | 90062 | 3.3% | 6.8%(-3.42)#1,412 | 6.4%(-3.01)#23,152 |
| 50. | 90004 | 3.2% | 6.8%(-3.59)#1,423 | 6.4%(-3.17)#23,503 |
| 51. | 90046 | 3.1% | 6.8%(-3.71)#1,431 | 6.4%(-3.29)#23,761 |
| 52. | 90023 | 3.0% | 6.8%(-3.74)#1,433 | 6.4%(-3.32)#23,824 |
| 53. | 90005 | 2.8% | 6.8%(-4.00)#1,449 | 6.4%(-3.59)#24,293 |
| 54. | 90044 | 2.7% | 6.8%(-4.06)#1,452 | 6.4%(-3.64)#24,376 |
| 55. | 90063 | 2.4% | 6.8%(-4.38)#1,477 | 6.4%(-3.96)#24,863 |
| 56. | 90039 | 2.3% | 6.8%(-4.49)#1,481 | 6.4%(-4.07)#25,018 |
| 57. | 90061 | 2.3% | 6.8%(-4.49)#1,482 | 6.4%(-4.07)#25,022 |
| 58. | 90011 | 1.8% | 6.8%(-4.94)#1,495 | 6.4%(-4.53)#25,535 |
| 59. | 90047 | 1.8% | 6.8%(-4.96)#1,496 | 6.4%(-4.54)#25,554 |
| 60. | 90059 | 1.1% | 6.8%(-5.72)#1,510 | 6.4%(-5.30)#26,179 |
| 61. | 90058 | 1.0% | 6.8%(-5.73)#1,511 | 6.4%(-5.31)#26,188 |
1
Common Questions
What are the Top 10 Zip Codes with the Highest Percentage of Population with a Degree in Bio, Nature & Agricultural in Los Angeles, CA?
Top 10 Zip Codes with the Highest Percentage of Population with a Degree in Bio, Nature & Agricultural in Los Angeles, CA are:
What zip code has the Highest Percentage of Population with a Degree in Bio, Nature & Agricultural in Los Angeles, CA?
90089 has the Highest Percentage of Population with a Degree in Bio, Nature & Agricultural in Los Angeles, CA with 30.6%.
What is the Percentage of Population with a Degree in Bio, Nature & Agricultural in Los Angeles, CA?
Percentage of Population with a Degree in Bio, Nature & Agricultural in Los Angeles is 4.8%.
What is the Percentage of Population with a Degree in Bio, Nature & Agricultural in California?
Percentage of Population with a Degree in Bio, Nature & Agricultural in California is 6.8%.
What is the Percentage of Population with a Degree in Bio, Nature & Agricultural in the United States?
Percentage of Population with a Degree in Bio, Nature & Agricultural in the United States is 6.4%.