Zip Codes with the Highest Percentage of Population with a Degree in Psychology in Los Angeles, CA
RELATED REPORTS & OPTIONS
Psychology
Los Angeles
Compare Zip Codes
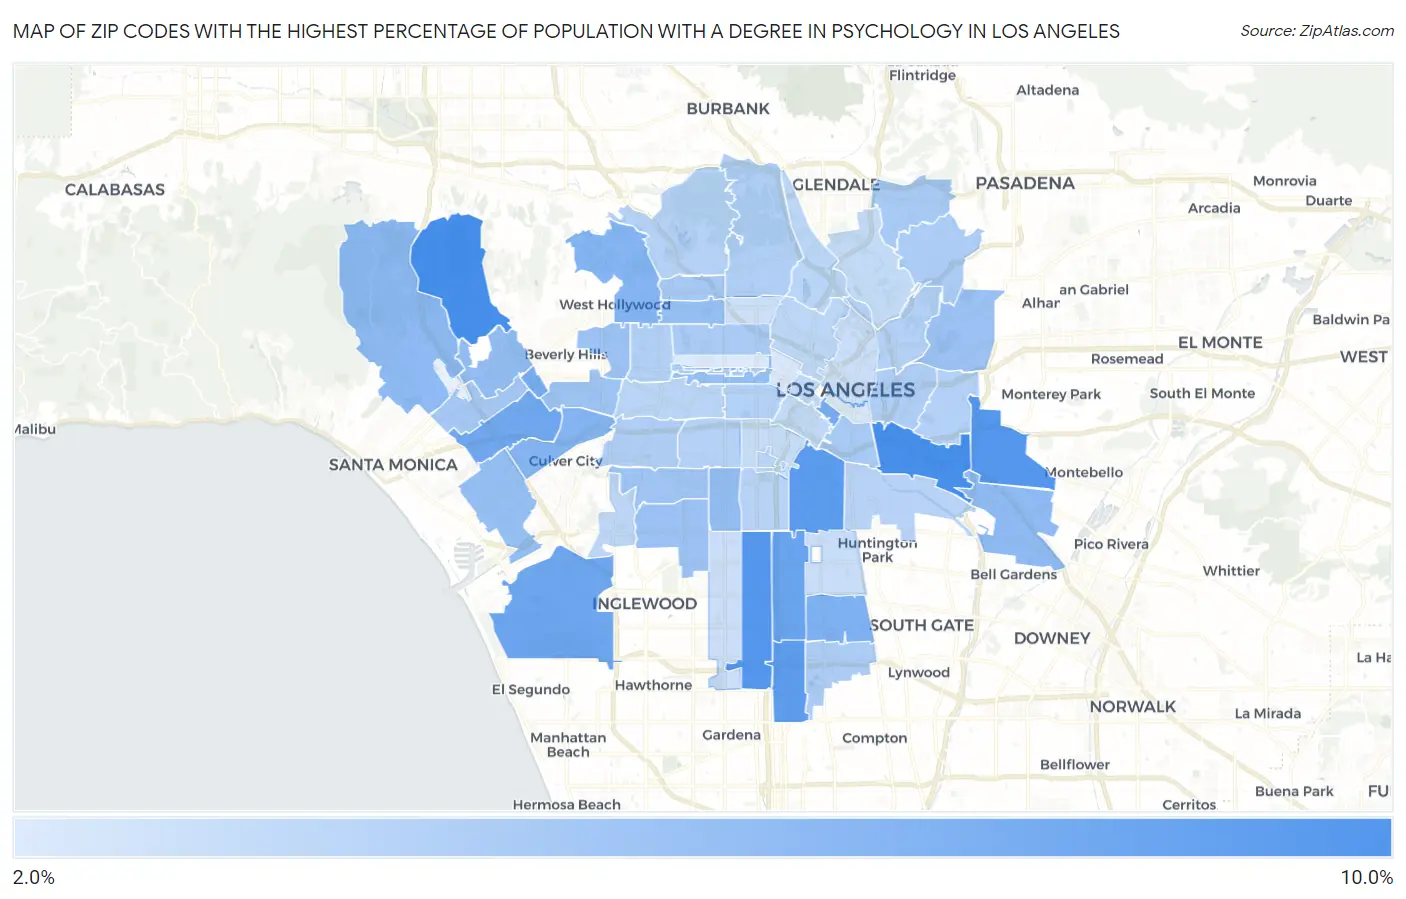
Map of Zip Codes with the Highest Percentage of Population with a Degree in Psychology in Los Angeles
0.0%
10.0%
Zip Codes with the Highest Percentage of Population with a Degree in Psychology in Los Angeles, CA
| Zip Code | % Graduates | vs State | vs National | |
| 1. | 90077 | 9.2% | 5.3%(+3.90)#160 | 5.1%(+4.18)#2,960 |
| 2. | 90023 | 9.2% | 5.3%(+3.88)#161 | 5.1%(+4.17)#2,978 |
| 3. | 90022 | 8.6% | 5.3%(+3.26)#205 | 5.1%(+3.54)#3,514 |
| 4. | 90044 | 8.6% | 5.3%(+3.23)#208 | 5.1%(+3.51)#3,548 |
| 5. | 90011 | 8.2% | 5.3%(+2.89)#232 | 5.1%(+3.18)#3,882 |
| 6. | 90061 | 8.2% | 5.3%(+2.85)#238 | 5.1%(+3.13)#3,919 |
| 7. | 90003 | 7.7% | 5.3%(+2.33)#287 | 5.1%(+2.61)#4,557 |
| 8. | 90045 | 7.4% | 5.3%(+2.11)#307 | 5.1%(+2.40)#4,918 |
| 9. | 90064 | 7.3% | 5.3%(+1.97)#328 | 5.1%(+2.26)#5,113 |
| 10. | 90014 | 7.1% | 5.3%(+1.81)#348 | 5.1%(+2.09)#5,371 |
| 11. | 90067 | 7.0% | 5.3%(+1.65)#366 | 5.1%(+1.94)#5,646 |
| 12. | 90002 | 6.7% | 5.3%(+1.37)#413 | 5.1%(+1.65)#6,222 |
| 13. | 90046 | 6.4% | 5.3%(+1.08)#485 | 5.1%(+1.36)#6,858 |
| 14. | 90034 | 6.4% | 5.3%(+1.04)#491 | 5.1%(+1.32)#6,950 |
| 15. | 90040 | 5.9% | 5.3%(+0.615)#596 | 5.1%(+0.899)#8,099 |
| 16. | 90049 | 5.9% | 5.3%(+0.589)#602 | 5.1%(+0.873)#8,182 |
| 17. | 90024 | 5.8% | 5.3%(+0.458)#639 | 5.1%(+0.742)#8,596 |
| 18. | 90062 | 5.7% | 5.3%(+0.381)#666 | 5.1%(+0.665)#8,835 |
| 19. | 90038 | 5.6% | 5.3%(+0.314)#682 | 5.1%(+0.598)#9,033 |
| 20. | 90066 | 5.6% | 5.3%(+0.289)#690 | 5.1%(+0.573)#9,111 |
| 21. | 90005 | 5.6% | 5.3%(+0.266)#698 | 5.1%(+0.550)#9,189 |
| 22. | 90032 | 5.4% | 5.3%(+0.107)#738 | 5.1%(+0.391)#9,708 |
| 23. | 90043 | 5.3% | 5.3%(-0.012)#786 | 5.1%(+0.272)#10,086 |
| 24. | 90048 | 5.3% | 5.3%(-0.023)#791 | 5.1%(+0.261)#10,122 |
| 25. | 90035 | 5.2% | 5.3%(-0.126)#819 | 5.1%(+0.158)#10,499 |
| 26. | 90008 | 5.1% | 5.3%(-0.212)#835 | 5.1%(+0.072)#10,829 |
| 27. | 90028 | 4.9% | 5.3%(-0.406)#881 | 5.1%(-0.122)#11,529 |
| 28. | 90025 | 4.9% | 5.3%(-0.414)#883 | 5.1%(-0.130)#11,553 |
| 29. | 90041 | 4.9% | 5.3%(-0.480)#897 | 5.1%(-0.196)#11,762 |
| 30. | 90021 | 4.8% | 5.3%(-0.529)#907 | 5.1%(-0.245)#11,936 |
| 31. | 90004 | 4.7% | 5.3%(-0.618)#934 | 5.1%(-0.334)#12,255 |
| 32. | 90042 | 4.6% | 5.3%(-0.730)#971 | 5.1%(-0.446)#12,700 |
| 33. | 90059 | 4.6% | 5.3%(-0.734)#972 | 5.1%(-0.450)#12,713 |
| 34. | 90033 | 4.5% | 5.3%(-0.816)#992 | 5.1%(-0.532)#13,044 |
| 35. | 90016 | 4.5% | 5.3%(-0.853)#1,004 | 5.1%(-0.569)#13,174 |
| 36. | 90010 | 4.4% | 5.3%(-0.954)#1,034 | 5.1%(-0.670)#13,557 |
| 37. | 90027 | 4.4% | 5.3%(-0.956)#1,036 | 5.1%(-0.672)#13,565 |
| 38. | 90031 | 4.3% | 5.3%(-0.995)#1,041 | 5.1%(-0.711)#13,709 |
| 39. | 90006 | 4.3% | 5.3%(-0.997)#1,042 | 5.1%(-0.713)#13,717 |
| 40. | 90036 | 4.3% | 5.3%(-1.00)#1,044 | 5.1%(-0.716)#13,728 |
| 41. | 90063 | 4.3% | 5.3%(-1.00)#1,045 | 5.1%(-0.718)#13,735 |
| 42. | 90068 | 4.2% | 5.3%(-1.09)#1,063 | 5.1%(-0.805)#14,053 |
| 43. | 90018 | 4.2% | 5.3%(-1.15)#1,075 | 5.1%(-0.868)#14,288 |
| 44. | 90058 | 4.2% | 5.3%(-1.18)#1,080 | 5.1%(-0.893)#14,382 |
| 45. | 90089 | 4.1% | 5.3%(-1.20)#1,084 | 5.1%(-0.919)#14,460 |
| 46. | 90037 | 4.1% | 5.3%(-1.27)#1,100 | 5.1%(-0.988)#14,701 |
| 47. | 90039 | 4.0% | 5.3%(-1.35)#1,128 | 5.1%(-1.07)#14,995 |
| 48. | 90019 | 4.0% | 5.3%(-1.38)#1,133 | 5.1%(-1.09)#15,077 |
| 49. | 90056 | 3.9% | 5.3%(-1.44)#1,144 | 5.1%(-1.15)#15,287 |
| 50. | 90026 | 3.9% | 5.3%(-1.47)#1,150 | 5.1%(-1.19)#15,404 |
| 51. | 90017 | 3.7% | 5.3%(-1.61)#1,167 | 5.1%(-1.33)#15,883 |
| 52. | 90015 | 3.7% | 5.3%(-1.62)#1,169 | 5.1%(-1.34)#15,917 |
| 53. | 90065 | 3.6% | 5.3%(-1.72)#1,194 | 5.1%(-1.44)#16,291 |
| 54. | 90007 | 3.5% | 5.3%(-1.88)#1,224 | 5.1%(-1.59)#16,825 |
| 55. | 90001 | 3.4% | 5.3%(-1.92)#1,227 | 5.1%(-1.63)#16,949 |
| 56. | 90012 | 3.3% | 5.3%(-1.99)#1,232 | 5.1%(-1.71)#17,170 |
| 57. | 90047 | 3.3% | 5.3%(-2.00)#1,234 | 5.1%(-1.71)#17,185 |
| 58. | 90029 | 3.2% | 5.3%(-2.18)#1,265 | 5.1%(-1.89)#17,776 |
| 59. | 90013 | 2.7% | 5.3%(-2.61)#1,313 | 5.1%(-2.33)#19,010 |
| 60. | 90057 | 2.6% | 5.3%(-2.72)#1,327 | 5.1%(-2.43)#19,300 |
| 61. | 90020 | 2.5% | 5.3%(-2.84)#1,336 | 5.1%(-2.56)#19,621 |
1
Common Questions
What are the Top 10 Zip Codes with the Highest Percentage of Population with a Degree in Psychology in Los Angeles, CA?
Top 10 Zip Codes with the Highest Percentage of Population with a Degree in Psychology in Los Angeles, CA are:
What zip code has the Highest Percentage of Population with a Degree in Psychology in Los Angeles, CA?
90077 has the Highest Percentage of Population with a Degree in Psychology in Los Angeles, CA with 9.2%.
What is the Percentage of Population with a Degree in Psychology in Los Angeles, CA?
Percentage of Population with a Degree in Psychology in Los Angeles is 5.5%.
What is the Percentage of Population with a Degree in Psychology in California?
Percentage of Population with a Degree in Psychology in California is 5.3%.
What is the Percentage of Population with a Degree in Psychology in the United States?
Percentage of Population with a Degree in Psychology in the United States is 5.1%.