Zip Codes with the Highest Percentage of Population Employed in Food Preparation & Serving in Fresno, CA
RELATED REPORTS & OPTIONS
Food Preparation & Serving
Fresno
Compare Zip Codes
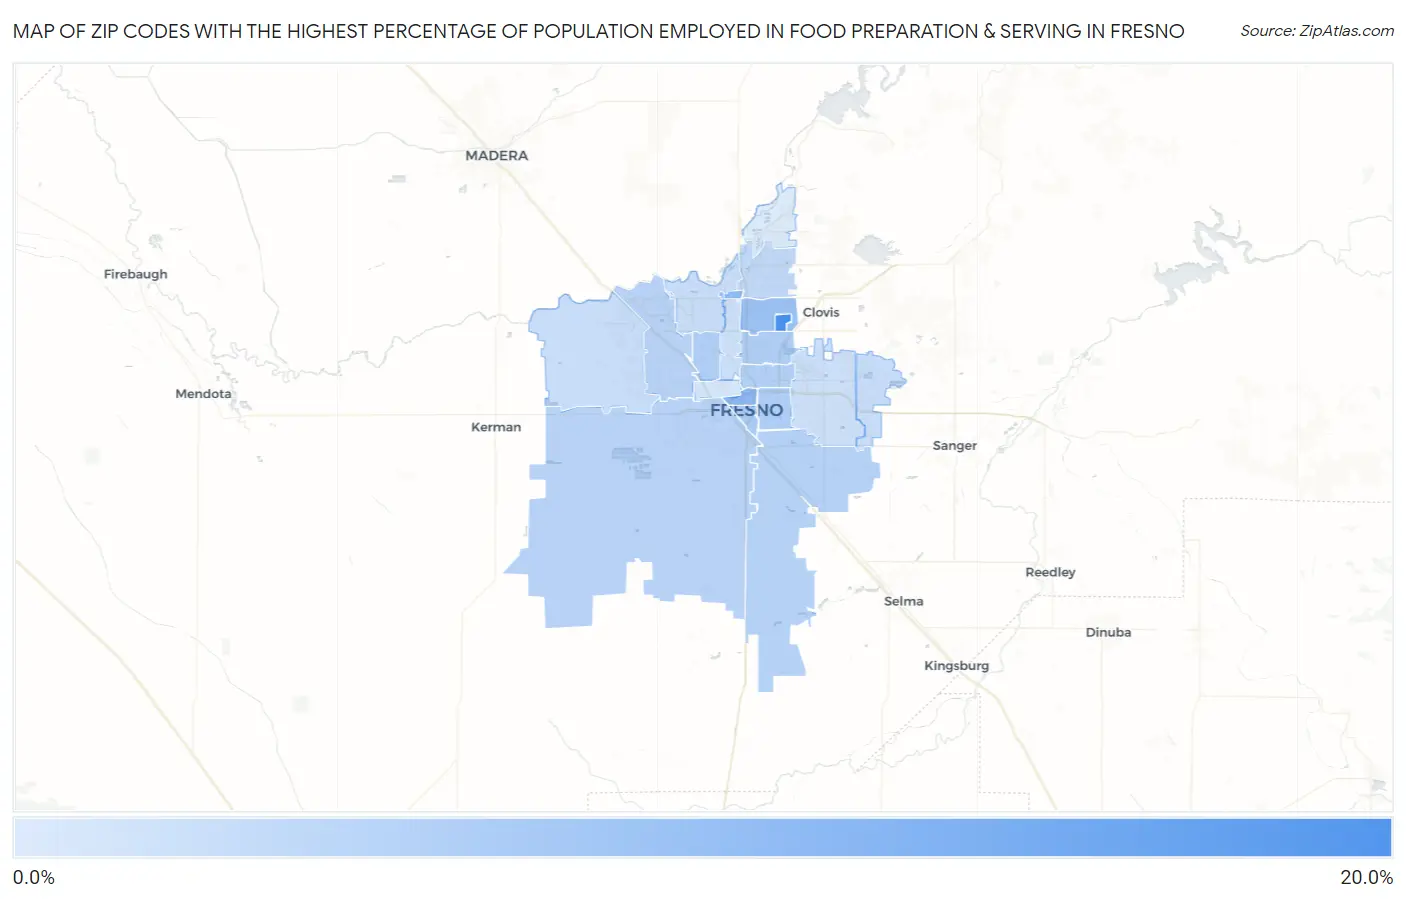
Map of Zip Codes with the Highest Percentage of Population Employed in Food Preparation & Serving in Fresno
0.0%
20.0%
Zip Codes with the Highest Percentage of Population Employed in Food Preparation & Serving in Fresno, CA
| Zip Code | % Employed | vs State | vs National | |
| 1. | 93740 | 18.2% | 5.4%(+12.8)#39 | 5.3%(+12.9)#636 |
| 2. | 93701 | 10.4% | 5.4%(+5.05)#120 | 5.3%(+5.15)#2,354 |
| 3. | 93650 | 10.0% | 5.4%(+4.57)#142 | 5.3%(+4.67)#2,669 |
| 4. | 93710 | 9.0% | 5.4%(+3.59)#181 | 5.3%(+3.69)#3,550 |
| 5. | 93721 | 7.3% | 5.4%(+1.89)#302 | 5.3%(+1.99)#5,972 |
| 6. | 93726 | 6.9% | 5.4%(+1.49)#368 | 5.3%(+1.58)#6,887 |
| 7. | 93702 | 6.8% | 5.4%(+1.39)#381 | 5.3%(+1.49)#7,136 |
| 8. | 93705 | 6.7% | 5.4%(+1.28)#414 | 5.3%(+1.37)#7,457 |
| 9. | 93703 | 6.5% | 5.4%(+1.13)#437 | 5.3%(+1.23)#7,839 |
| 10. | 93725 | 6.3% | 5.4%(+0.872)#496 | 5.3%(+0.968)#8,565 |
| 11. | 93722 | 6.0% | 5.4%(+0.589)#550 | 5.3%(+0.685)#9,438 |
| 12. | 93706 | 5.9% | 5.4%(+0.499)#566 | 5.3%(+0.596)#9,752 |
| 13. | 93720 | 4.9% | 5.4%(-0.447)#802 | 5.3%(-0.350)#13,203 |
| 14. | 93737 | 4.4% | 5.4%(-0.997)#939 | 5.3%(-0.901)#15,486 |
| 15. | 93711 | 4.4% | 5.4%(-1.02)#946 | 5.3%(-0.921)#15,581 |
| 16. | 93723 | 4.3% | 5.4%(-1.05)#953 | 5.3%(-0.950)#15,719 |
| 17. | 93704 | 3.9% | 5.4%(-1.45)#1,036 | 5.3%(-1.35)#17,394 |
| 18. | 93727 | 3.9% | 5.4%(-1.45)#1,037 | 5.3%(-1.35)#17,399 |
| 19. | 93728 | 2.9% | 5.4%(-2.47)#1,242 | 5.3%(-2.38)#21,605 |
| 20. | 93730 | 2.2% | 5.4%(-3.17)#1,360 | 5.3%(-3.08)#24,063 |
1
Common Questions
What are the Top 10 Zip Codes with the Highest Percentage of Population Employed in Food Preparation & Serving in Fresno, CA?
Top 10 Zip Codes with the Highest Percentage of Population Employed in Food Preparation & Serving in Fresno, CA are:
What zip code has the Highest Percentage of Population Employed in Food Preparation & Serving in Fresno, CA?
93740 has the Highest Percentage of Population Employed in Food Preparation & Serving in Fresno, CA with 18.2%.
What is the Percentage of Population Employed in Food Preparation & Serving in Fresno, CA?
Percentage of Population Employed in Food Preparation & Serving in Fresno is 5.7%.
What is the Percentage of Population Employed in Food Preparation & Serving in California?
Percentage of Population Employed in Food Preparation & Serving in California is 5.4%.
What is the Percentage of Population Employed in Food Preparation & Serving in the United States?
Percentage of Population Employed in Food Preparation & Serving in the United States is 5.3%.