Rochester, VT
Rochester Map
Rochester Overview
296
TOTAL POPULATION
116
MALE POPULATION
180
FEMALE POPULATION
64.44
MALES / 100 FEMALES
155.17
FEMALES / 100 MALES
64.6
MEDIAN AGE
2.9
AVG FAMILY SIZE
1.8
AVG HOUSEHOLD SIZE
$32,995
PER CAPITA INCOME
$120,125
AVG FAMILY INCOME
$41,250
AVG HOUSEHOLD INCOME
26.7%
WAGE / INCOME GAP [ % ]
73.3¢/ $1
WAGE / INCOME GAP [ $ ]
0.41
INEQUALITY / GINI INDEX
106
LABOR FORCE [ PEOPLE ]
38.7%
PERCENT IN LABOR FORCE
2.8%
UNEMPLOYMENT RATE
Rochester Zip Codes
Rochester Area Codes
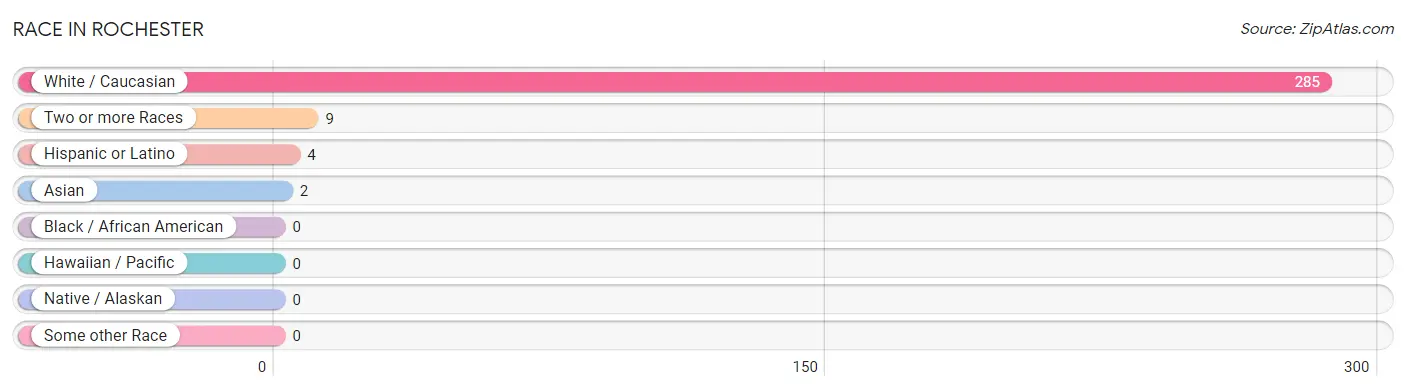
Race in Rochester
The most populous races in Rochester are White / Caucasian (285 | 96.3%), Two or more Races (9 | 3.0%), and Hispanic or Latino (4 | 1.3%).
| Race | # Population | % Population |
| Asian | 2 | 0.7% |
| Black / African American | 0 | 0.0% |
| Hawaiian / Pacific | 0 | 0.0% |
| Hispanic or Latino | 4 | 1.3% |
| Native / Alaskan | 0 | 0.0% |
| White / Caucasian | 285 | 96.3% |
| Two or more Races | 9 | 3.0% |
| Some other Race | 0 | 0.0% |
| Total | 296 | 100.0% |
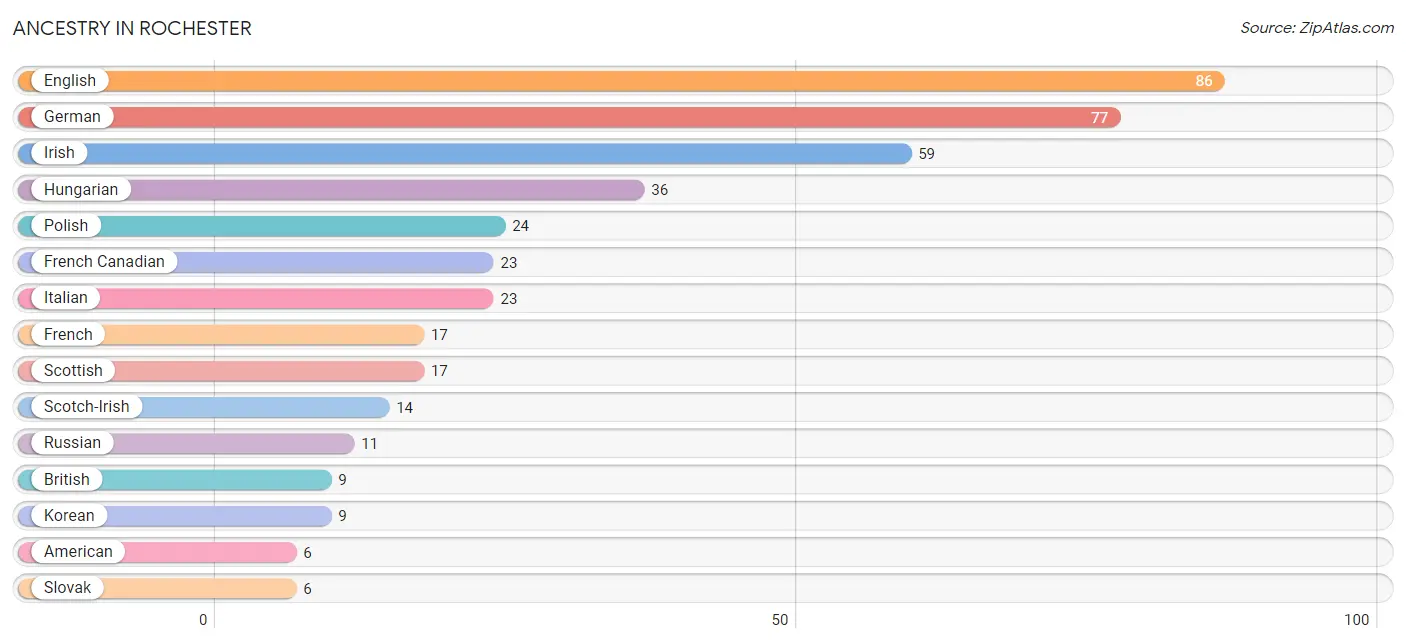
Ancestry in Rochester
The most populous ancestries reported in Rochester are English (86 | 29.0%), German (77 | 26.0%), Irish (59 | 19.9%), Hungarian (36 | 12.2%), and Polish (24 | 8.1%), together accounting for 95.3% of all Rochester residents.
| Ancestry | # Population | % Population |
| American | 6 | 2.0% |
| British | 9 | 3.0% |
| Dutch | 3 | 1.0% |
| English | 86 | 29.0% |
| French | 17 | 5.7% |
| French Canadian | 23 | 7.8% |
| German | 77 | 26.0% |
| Hungarian | 36 | 12.2% |
| Irish | 59 | 19.9% |
| Italian | 23 | 7.8% |
| Korean | 9 | 3.0% |
| Mexican | 4 | 1.3% |
| Norwegian | 4 | 1.3% |
| Polish | 24 | 8.1% |
| Russian | 11 | 3.7% |
| Scotch-Irish | 14 | 4.7% |
| Scottish | 17 | 5.7% |
| Slovak | 6 | 2.0% |
| Swedish | 3 | 1.0% | View All 19 Rows |
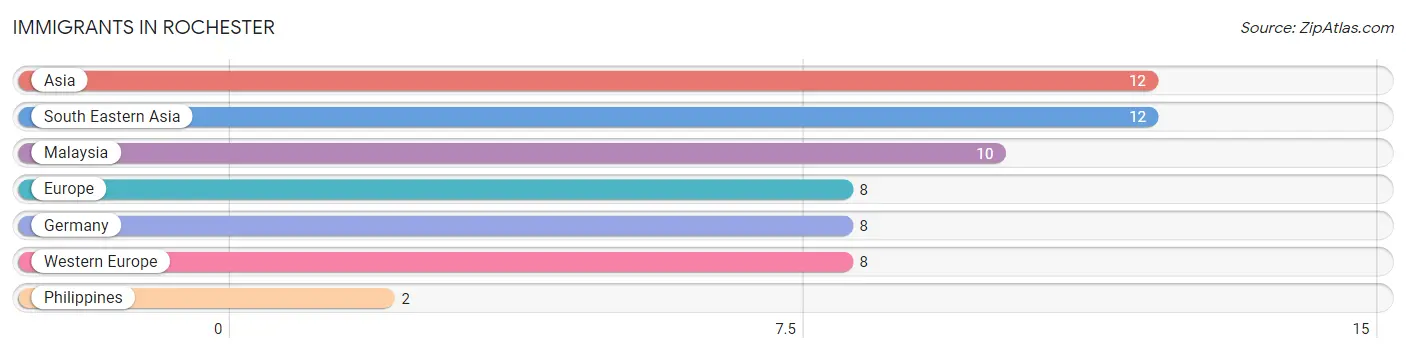
Immigrants in Rochester
The most numerous immigrant groups reported in Rochester came from Asia (12 | 4.1%), South Eastern Asia (12 | 4.1%), Malaysia (10 | 3.4%), Europe (8 | 2.7%), and Germany (8 | 2.7%), together accounting for 16.9% of all Rochester residents.
| Immigration Origin | # Population | % Population |
| Asia | 12 | 4.1% |
| Europe | 8 | 2.7% |
| Germany | 8 | 2.7% |
| Malaysia | 10 | 3.4% |
| Philippines | 2 | 0.7% |
| South Eastern Asia | 12 | 4.1% |
| Western Europe | 8 | 2.7% | View All 7 Rows |
Sex and Age in Rochester
Sex and Age in Rochester
The most populous age groups in Rochester are 55 to 59 Years (22 | 19.0%) for men and 85 Years and over (35 | 19.4%) for women.
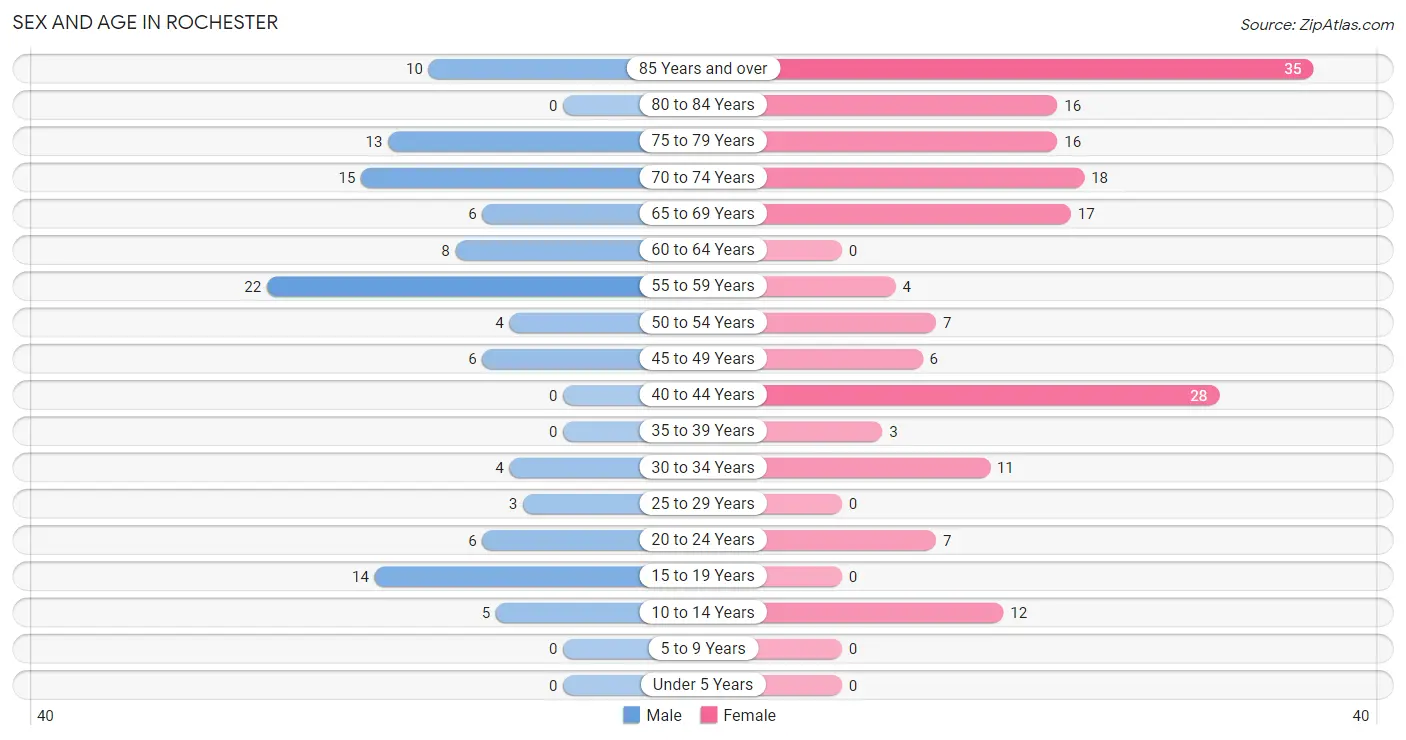
| Age Bracket | Male | Female |
| Under 5 Years | 0 (0.0%) | 0 (0.0%) |
| 5 to 9 Years | 0 (0.0%) | 0 (0.0%) |
| 10 to 14 Years | 5 (4.3%) | 12 (6.7%) |
| 15 to 19 Years | 14 (12.1%) | 0 (0.0%) |
| 20 to 24 Years | 6 (5.2%) | 7 (3.9%) |
| 25 to 29 Years | 3 (2.6%) | 0 (0.0%) |
| 30 to 34 Years | 4 (3.5%) | 11 (6.1%) |
| 35 to 39 Years | 0 (0.0%) | 3 (1.7%) |
| 40 to 44 Years | 0 (0.0%) | 28 (15.6%) |
| 45 to 49 Years | 6 (5.2%) | 6 (3.3%) |
| 50 to 54 Years | 4 (3.5%) | 7 (3.9%) |
| 55 to 59 Years | 22 (19.0%) | 4 (2.2%) |
| 60 to 64 Years | 8 (6.9%) | 0 (0.0%) |
| 65 to 69 Years | 6 (5.2%) | 17 (9.4%) |
| 70 to 74 Years | 15 (12.9%) | 18 (10.0%) |
| 75 to 79 Years | 13 (11.2%) | 16 (8.9%) |
| 80 to 84 Years | 0 (0.0%) | 16 (8.9%) |
| 85 Years and over | 10 (8.6%) | 35 (19.4%) |
| Total | 116 (100.0%) | 180 (100.0%) |
Families and Households in Rochester
Median Family Size in Rochester
The median family size in Rochester is 2.85 persons per family, with single male/father families (7 | 11.9%) accounting for the largest median family size of 3.43 persons per family. On the other hand, married-couple families (45 | 76.3%) represent the smallest median family size with 2.69 persons per family.
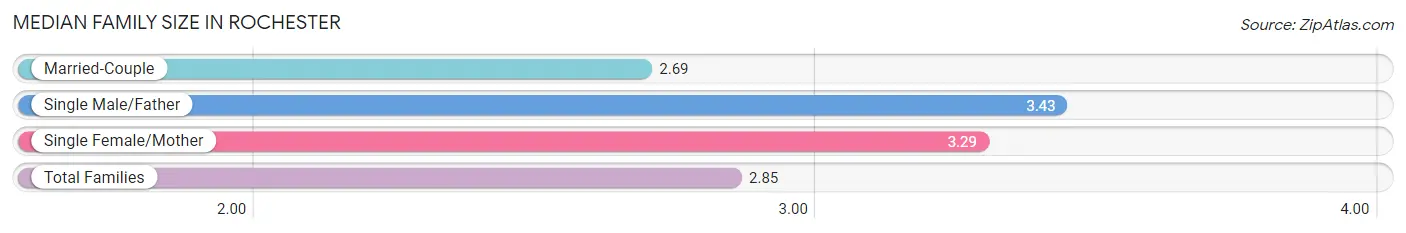
| Family Type | # Families | Family Size |
| Married-Couple | 45 (76.3%) | 2.69 |
| Single Male/Father | 7 (11.9%) | 3.43 |
| Single Female/Mother | 7 (11.9%) | 3.29 |
| Total Families | 59 (100.0%) | 2.85 |
Median Household Size in Rochester
The median household size in Rochester is 1.77 persons per household, with single male/father households (7 | 4.4%) accounting for the largest median household size of 3.43 persons per household. non-family households (101 | 63.1%) represent the smallest median household size with 1.14 persons per household.
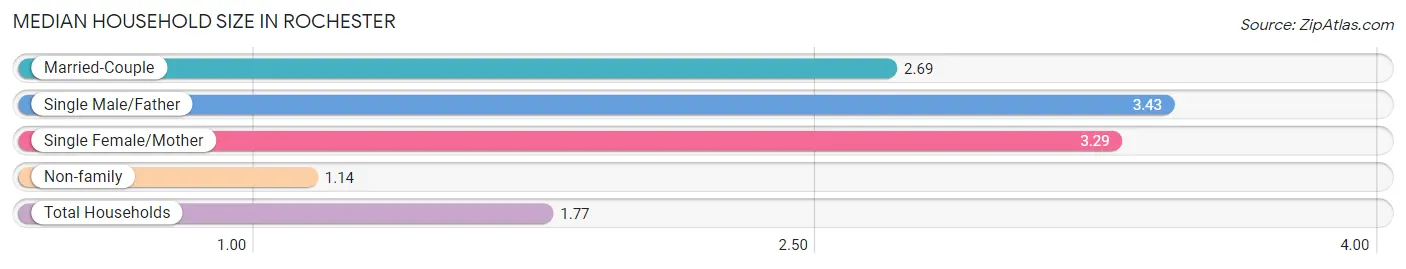
| Household Type | # Households | Household Size |
| Married-Couple | 45 (28.1%) | 2.69 |
| Single Male/Father | 7 (4.4%) | 3.43 |
| Single Female/Mother | 7 (4.4%) | 3.29 |
| Non-family | 101 (63.1%) | 1.14 |
| Total Households | 160 (100.0%) | 1.77 |
Household Size by Marriage Status in Rochester
Out of a total of 160 households in Rochester, 59 (36.9%) are family households, while 101 (63.1%) are nonfamily households. The most numerous type of family households are 2-person households, comprising 43, and the most common type of nonfamily households are 1-person households, comprising 91.
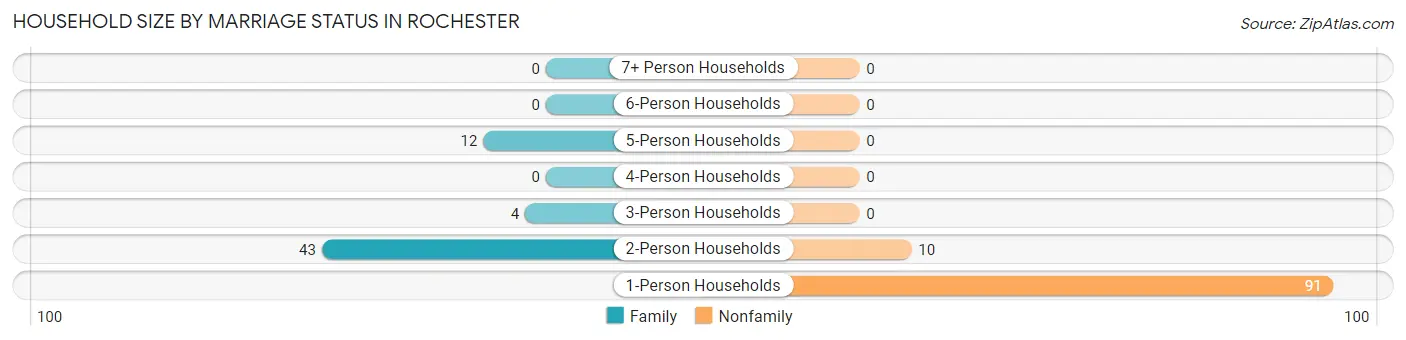
| Household Size | Family Households | Nonfamily Households |
| 1-Person Households | - | 91 (56.9%) |
| 2-Person Households | 43 (26.9%) | 10 (6.2%) |
| 3-Person Households | 4 (2.5%) | 0 (0.0%) |
| 4-Person Households | 0 (0.0%) | 0 (0.0%) |
| 5-Person Households | 12 (7.5%) | 0 (0.0%) |
| 6-Person Households | 0 (0.0%) | 0 (0.0%) |
| 7+ Person Households | 0 (0.0%) | 0 (0.0%) |
| Total | 59 (36.9%) | 101 (63.1%) |
Female Fertility in Rochester
Fertility by Age in Rochester
| Age Bracket | Women with Births | Births / 1,000 Women |
| 15 to 19 years | 0 (0.0%) | 0.0 |
| 20 to 34 years | 0 (0.0%) | 0.0 |
| 35 to 50 years | 0 (0.0%) | 0.0 |
| Total | 0 (0.0%) | 0.0 |
Fertility by Age by Marriage Status in Rochester
| Age Bracket | Married | Unmarried |
| 15 to 19 years | 0 (0.0%) | 0 (0.0%) |
| 20 to 34 years | 0 (0.0%) | 0 (0.0%) |
| 35 to 50 years | 0 (0.0%) | 0 (0.0%) |
| Total | 0 (0.0%) | 0 (0.0%) |
Fertility by Education in Rochester
| Educational Attainment | Women with Births | Births / 1,000 Women |
| Less than High School | 0 (0.0%) | 0.0 |
| High School Diploma | 0 (0.0%) | 0.0 |
| College or Associate's Degree | 0 (0.0%) | 0.0 |
| Bachelor's Degree | 0 (0.0%) | 0.0 |
| Graduate Degree | 0 (0.0%) | 0.0 |
| Total | 0 (0.0%) | 0.0 |
Fertility by Education by Marriage Status in Rochester
| Educational Attainment | Married | Unmarried |
| Less than High School | 0 (0.0%) | 0 (0.0%) |
| High School Diploma | 0 (0.0%) | 0 (0.0%) |
| College or Associate's Degree | 0 (0.0%) | 0 (0.0%) |
| Bachelor's Degree | 0 (0.0%) | 0 (0.0%) |
| Graduate Degree | 0 (0.0%) | 0 (0.0%) |
| Total | 0 (0.0%) | 0 (0.0%) |
Income in Rochester
Income Overview in Rochester
Per Capita Income in Rochester is $32,995, while median incomes of families and households are $120,125 and $41,250 respectively.
| Characteristic | Number | Measure |
| Per Capita Income | 296 | $32,995 |
| Median Family Income | 59 | $120,125 |
| Mean Family Income | 59 | $98,247 |
| Median Household Income | 160 | $41,250 |
| Mean Household Income | 160 | $56,919 |
| Income Deficit | 59 | $0 |
| Wage / Income Gap (%) | 296 | 26.67% |
| Wage / Income Gap ($) | 296 | 73.33¢ per $1 |
| Gini / Inequality Index | 296 | 0.41 |
Earnings by Sex in Rochester
Average Earnings in Rochester are $43,125, $32,083 for men and $43,750 for women, a difference of 26.7%.
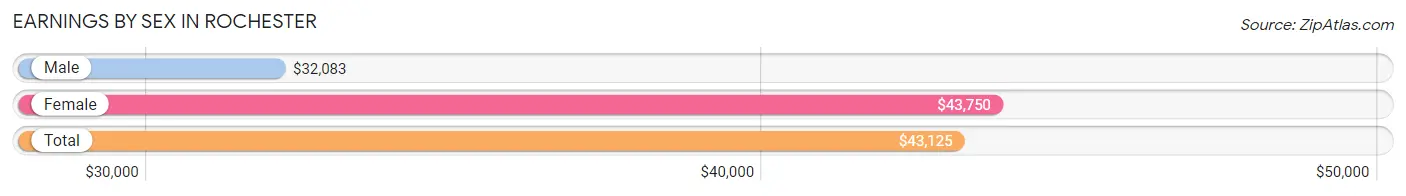
| Sex | Number | Average Earnings |
| Male | 47 (44.3%) | $32,083 |
| Female | 59 (55.7%) | $43,750 |
| Total | 106 (100.0%) | $43,125 |
Earnings by Sex by Income Bracket in Rochester
The most common earnings brackets in Rochester are $2,499 or less for men (9 | 19.2%) and $45,000 to $49,999 for women (21 | 35.6%).
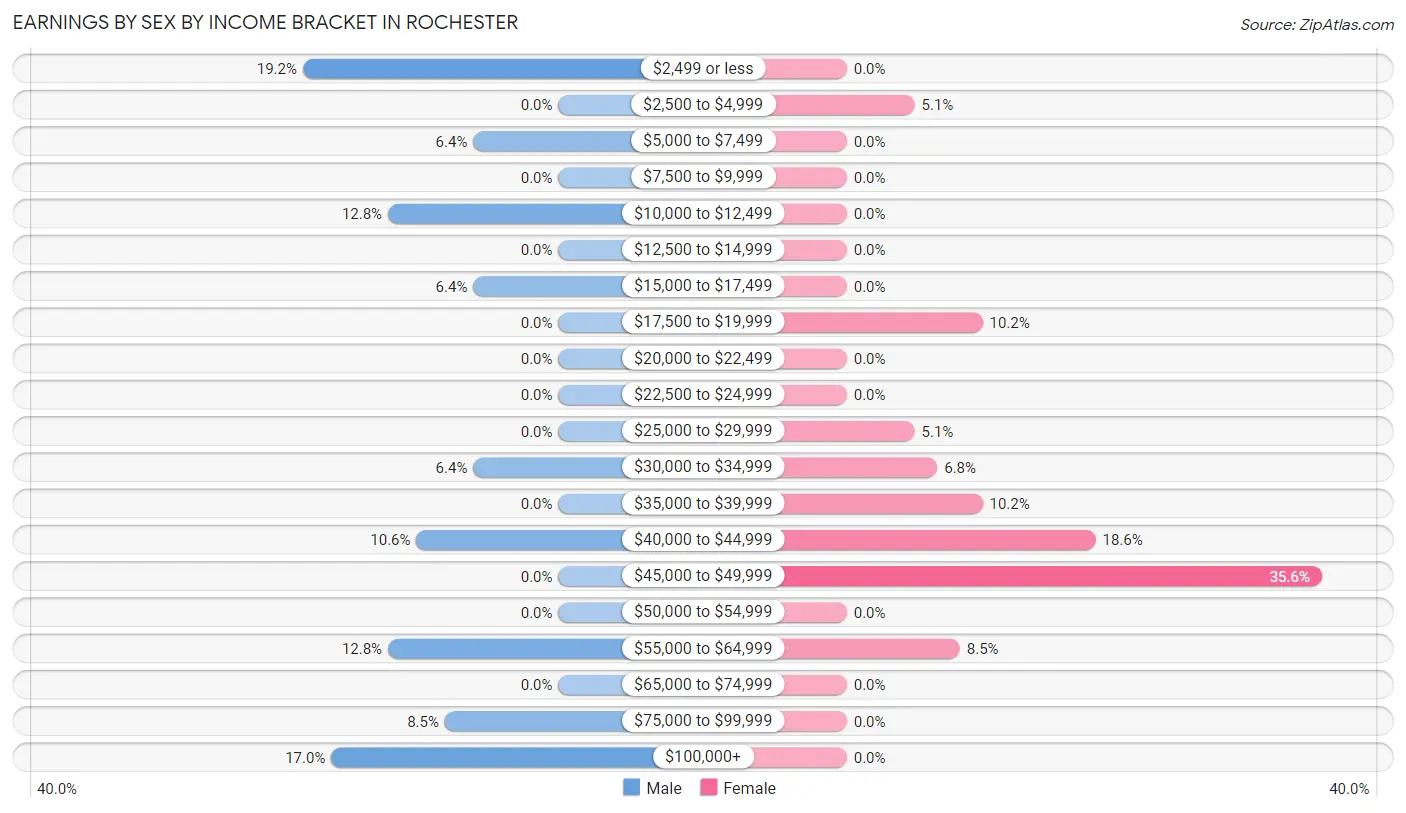
| Income | Male | Female |
| $2,499 or less | 9 (19.2%) | 0 (0.0%) |
| $2,500 to $4,999 | 0 (0.0%) | 3 (5.1%) |
| $5,000 to $7,499 | 3 (6.4%) | 0 (0.0%) |
| $7,500 to $9,999 | 0 (0.0%) | 0 (0.0%) |
| $10,000 to $12,499 | 6 (12.8%) | 0 (0.0%) |
| $12,500 to $14,999 | 0 (0.0%) | 0 (0.0%) |
| $15,000 to $17,499 | 3 (6.4%) | 0 (0.0%) |
| $17,500 to $19,999 | 0 (0.0%) | 6 (10.2%) |
| $20,000 to $22,499 | 0 (0.0%) | 0 (0.0%) |
| $22,500 to $24,999 | 0 (0.0%) | 0 (0.0%) |
| $25,000 to $29,999 | 0 (0.0%) | 3 (5.1%) |
| $30,000 to $34,999 | 3 (6.4%) | 4 (6.8%) |
| $35,000 to $39,999 | 0 (0.0%) | 6 (10.2%) |
| $40,000 to $44,999 | 5 (10.6%) | 11 (18.6%) |
| $45,000 to $49,999 | 0 (0.0%) | 21 (35.6%) |
| $50,000 to $54,999 | 0 (0.0%) | 0 (0.0%) |
| $55,000 to $64,999 | 6 (12.8%) | 5 (8.5%) |
| $65,000 to $74,999 | 0 (0.0%) | 0 (0.0%) |
| $75,000 to $99,999 | 4 (8.5%) | 0 (0.0%) |
| $100,000+ | 8 (17.0%) | 0 (0.0%) |
| Total | 47 (100.0%) | 59 (100.0%) |
Earnings by Sex by Educational Attainment in Rochester
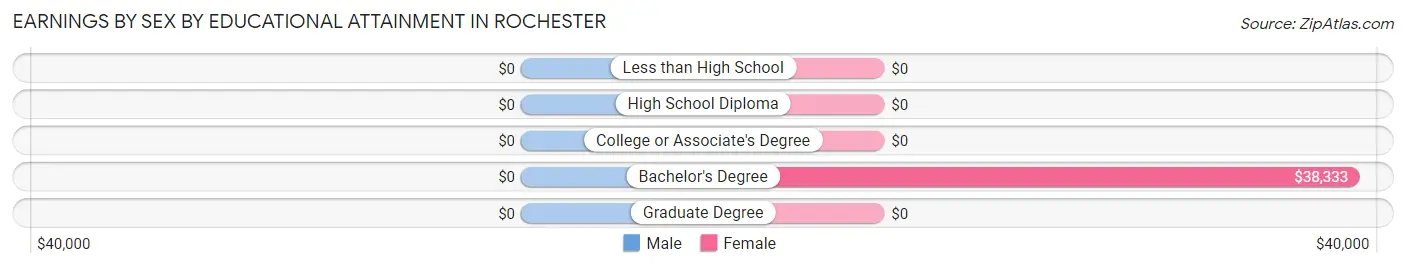
| Educational Attainment | Male Income | Female Income |
| Less than High School | - | - |
| High School Diploma | - | - |
| College or Associate's Degree | - | - |
| Bachelor's Degree | - | - |
| Graduate Degree | - | - |
| Total | $55,833 | $45,000 |
Family Income in Rochester
Family Income Brackets in Rochester
According to the Rochester family income data, there are 20 families falling into the $100,000 to $149,999 income range, which is the most common income bracket and makes up 33.9% of all families.
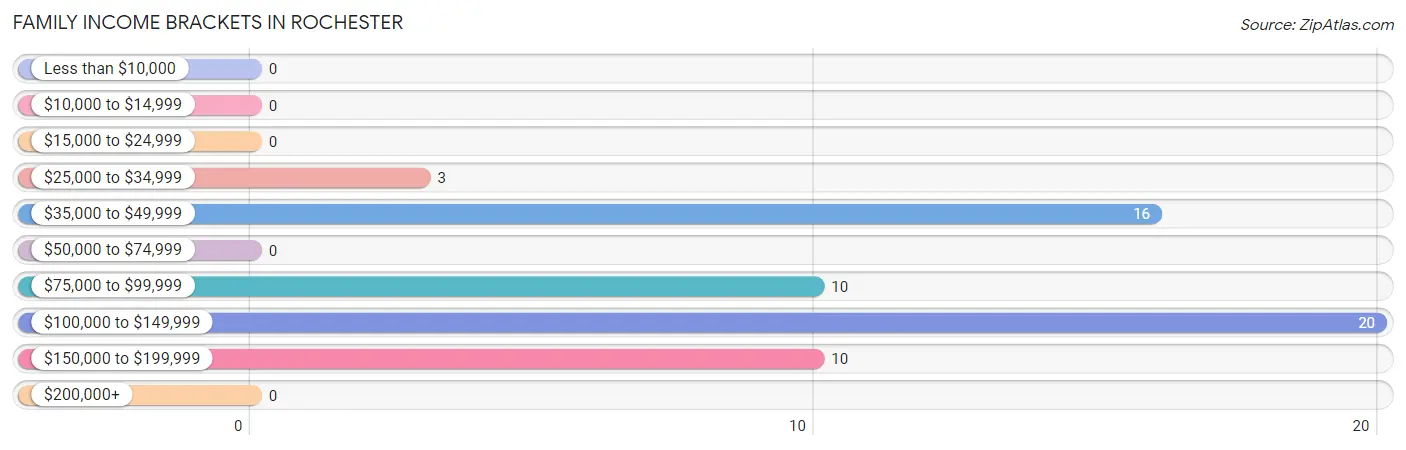
| Income Bracket | # Families | % Families |
| Less than $10,000 | 0 | 0.0% |
| $10,000 to $14,999 | 0 | 0.0% |
| $15,000 to $24,999 | 0 | 0.0% |
| $25,000 to $34,999 | 3 | 5.1% |
| $35,000 to $49,999 | 16 | 27.1% |
| $50,000 to $74,999 | 0 | 0.0% |
| $75,000 to $99,999 | 10 | 16.9% |
| $100,000 to $149,999 | 20 | 33.9% |
| $150,000 to $199,999 | 10 | 16.9% |
| $200,000+ | 0 | 0.0% |
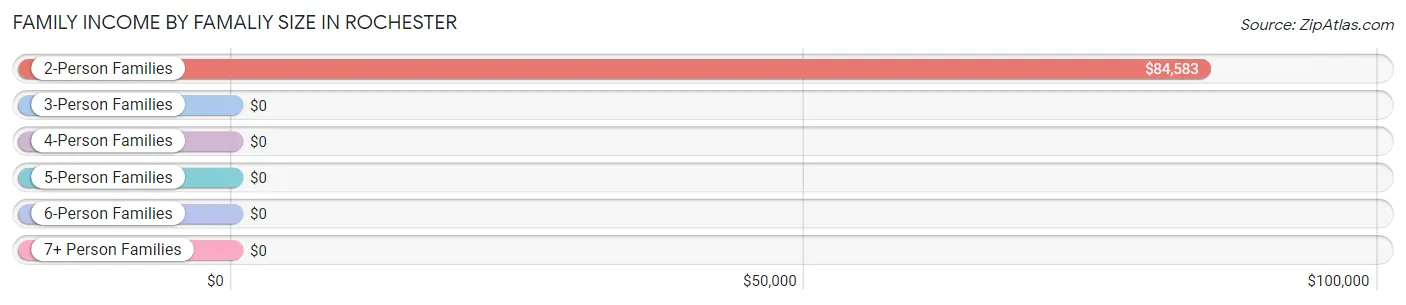
Family Income by Famaliy Size in Rochester
2-person families (43 | 72.9%) account for the highest median family income in Rochester with $84,583 per family, while 2-person families (43 | 72.9%) have the highest median income of $42,292 per family member.
| Income Bracket | # Families | Median Income |
| 2-Person Families | 43 (72.9%) | $84,583 |
| 3-Person Families | 4 (6.8%) | $0 |
| 4-Person Families | 0 (0.0%) | $0 |
| 5-Person Families | 12 (20.3%) | $0 |
| 6-Person Families | 0 (0.0%) | $0 |
| 7+ Person Families | 0 (0.0%) | $0 |
| Total | 59 (100.0%) | $120,125 |
Family Income by Number of Earners in Rochester
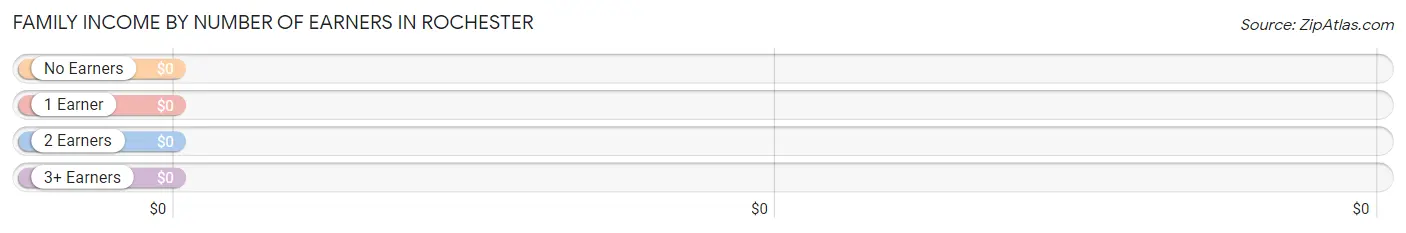
| Number of Earners | # Families | Median Income |
| No Earners | 28 (47.5%) | $0 |
| 1 Earner | 11 (18.6%) | $0 |
| 2 Earners | 8 (13.6%) | $0 |
| 3+ Earners | 12 (20.3%) | $0 |
| Total | 59 (100.0%) | $120,125 |
Household Income in Rochester
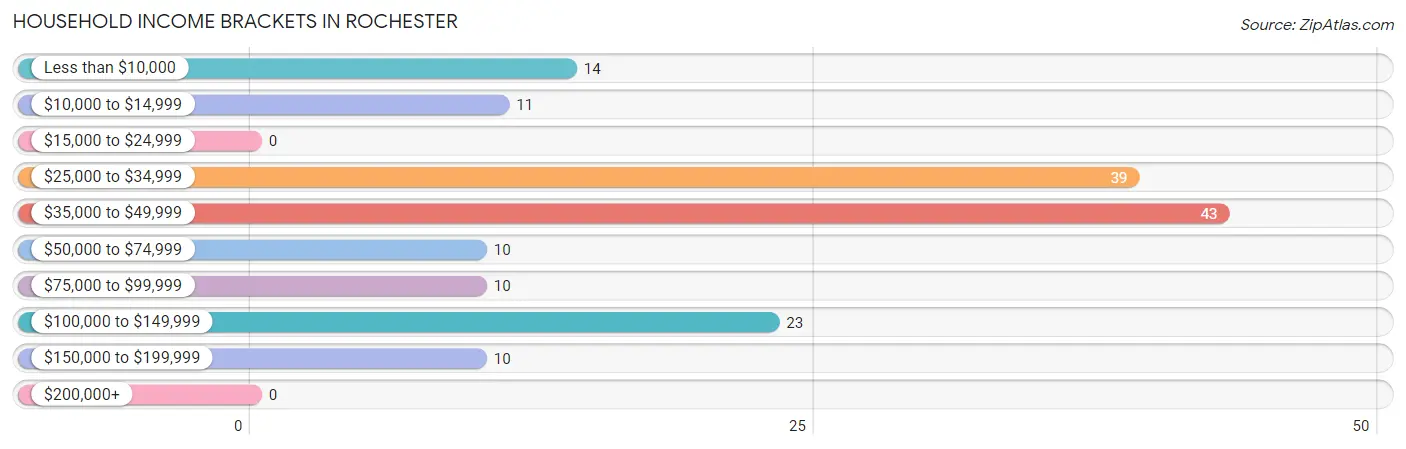
Household Income Brackets in Rochester
With 43 households falling in the category, the $35,000 to $49,999 income range is the most frequent in Rochester, accounting for 26.9% of all households.
| Income Bracket | # Households | % Households |
| Less than $10,000 | 14 | 8.8% |
| $10,000 to $14,999 | 11 | 6.9% |
| $15,000 to $24,999 | 0 | 0.0% |
| $25,000 to $34,999 | 39 | 24.4% |
| $35,000 to $49,999 | 43 | 26.9% |
| $50,000 to $74,999 | 10 | 6.3% |
| $75,000 to $99,999 | 10 | 6.3% |
| $100,000 to $149,999 | 23 | 14.4% |
| $150,000 to $199,999 | 10 | 6.3% |
| $200,000+ | 0 | 0.0% |
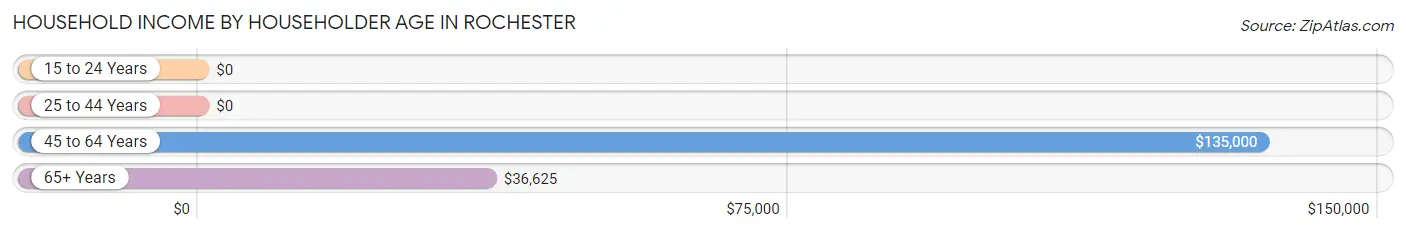
Household Income by Householder Age in Rochester
The median household income in Rochester is $41,250, with the highest median household income of $135,000 found in the 45 to 64 years age bracket for the primary householder. A total of 28 households (17.5%) fall into this category. Meanwhile, the 15 to 24 years age bracket for the primary householder has the lowest median household income of $0, with 4 households (2.5%) in this group.
| Income Bracket | # Households | Median Income |
| 15 to 24 Years | 4 (2.5%) | $0 |
| 25 to 44 Years | 15 (9.4%) | $0 |
| 45 to 64 Years | 28 (17.5%) | $135,000 |
| 65+ Years | 113 (70.6%) | $36,625 |
| Total | 160 (100.0%) | $41,250 |
Poverty in Rochester
Income Below Poverty by Sex and Age in Rochester
With 12.9% poverty level for males and 15.6% for females among the residents of Rochester, 18 to 24 year old males and 18 to 24 year old females are the most vulnerable to poverty, with 6 males (100.0%) and 3 females (42.9%) in their respective age groups living below the poverty level.
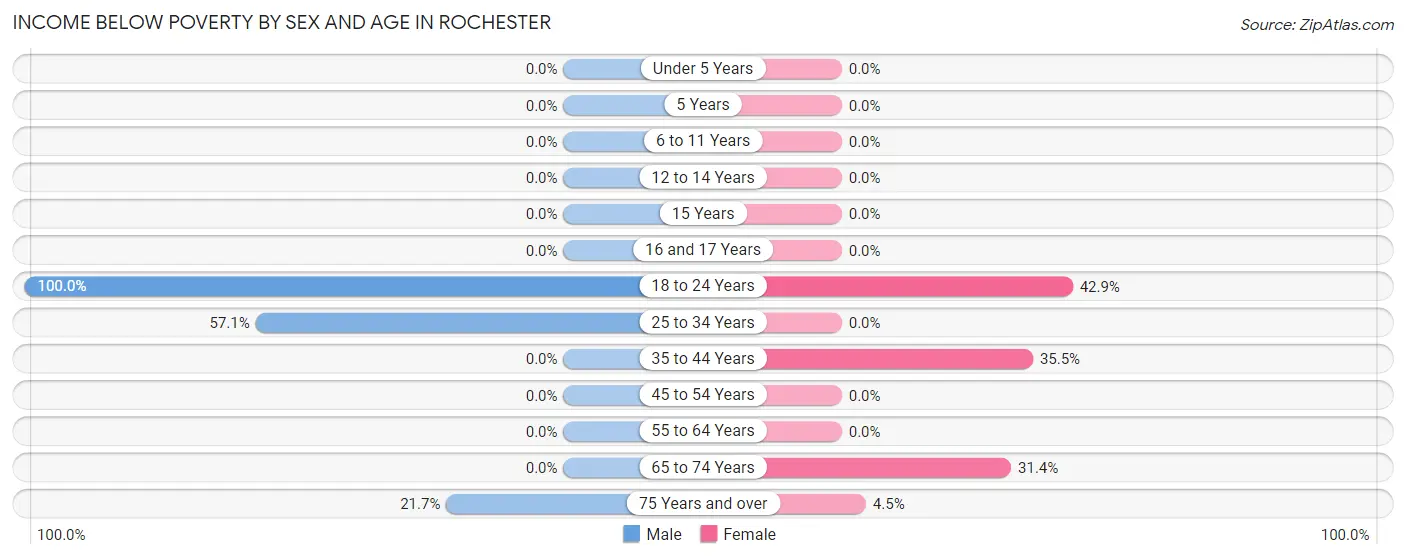
| Age Bracket | Male | Female |
| Under 5 Years | 0 (0.0%) | 0 (0.0%) |
| 5 Years | 0 (0.0%) | 0 (0.0%) |
| 6 to 11 Years | 0 (0.0%) | 0 (0.0%) |
| 12 to 14 Years | 0 (0.0%) | 0 (0.0%) |
| 15 Years | 0 (0.0%) | 0 (0.0%) |
| 16 and 17 Years | 0 (0.0%) | 0 (0.0%) |
| 18 to 24 Years | 6 (100.0%) | 3 (42.9%) |
| 25 to 34 Years | 4 (57.1%) | 0 (0.0%) |
| 35 to 44 Years | 0 (0.0%) | 11 (35.5%) |
| 45 to 54 Years | 0 (0.0%) | 0 (0.0%) |
| 55 to 64 Years | 0 (0.0%) | 0 (0.0%) |
| 65 to 74 Years | 0 (0.0%) | 11 (31.4%) |
| 75 Years and over | 5 (21.7%) | 3 (4.5%) |
| Total | 15 (12.9%) | 28 (15.6%) |
Income Above Poverty by Sex and Age in Rochester
According to the poverty statistics in Rochester, males aged 12 to 14 years and females aged 6 to 11 years are the age groups that are most secure financially, with 100.0% of males and 100.0% of females in these age groups living above the poverty line.
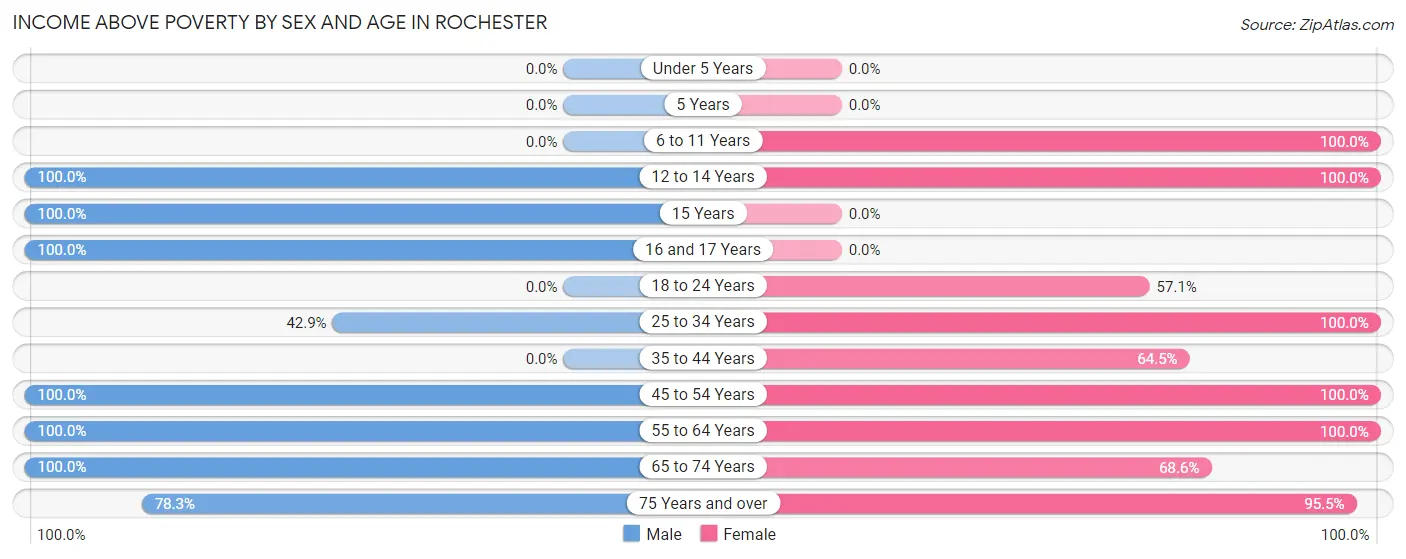
| Age Bracket | Male | Female |
| Under 5 Years | 0 (0.0%) | 0 (0.0%) |
| 5 Years | 0 (0.0%) | 0 (0.0%) |
| 6 to 11 Years | 0 (0.0%) | 6 (100.0%) |
| 12 to 14 Years | 5 (100.0%) | 6 (100.0%) |
| 15 Years | 5 (100.0%) | 0 (0.0%) |
| 16 and 17 Years | 9 (100.0%) | 0 (0.0%) |
| 18 to 24 Years | 0 (0.0%) | 4 (57.1%) |
| 25 to 34 Years | 3 (42.9%) | 11 (100.0%) |
| 35 to 44 Years | 0 (0.0%) | 20 (64.5%) |
| 45 to 54 Years | 10 (100.0%) | 13 (100.0%) |
| 55 to 64 Years | 30 (100.0%) | 4 (100.0%) |
| 65 to 74 Years | 21 (100.0%) | 24 (68.6%) |
| 75 Years and over | 18 (78.3%) | 64 (95.5%) |
| Total | 101 (87.1%) | 152 (84.4%) |
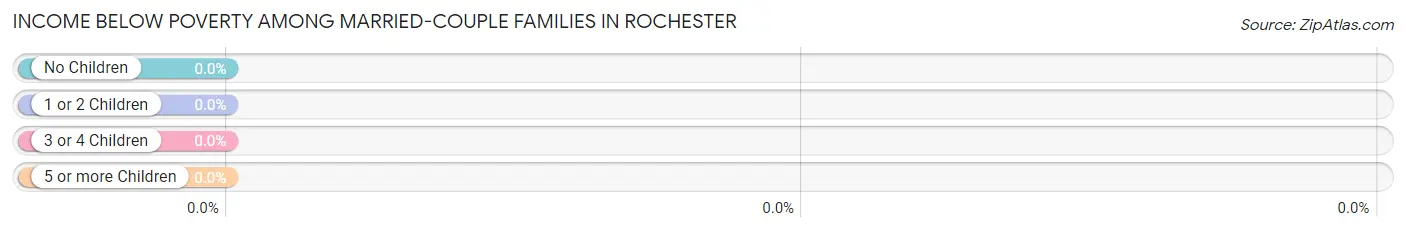
Income Below Poverty Among Married-Couple Families in Rochester
| Children | Above Poverty | Below Poverty |
| No Children | 33 (100.0%) | 0 (0.0%) |
| 1 or 2 Children | 0 (0.0%) | 0 (0.0%) |
| 3 or 4 Children | 12 (100.0%) | 0 (0.0%) |
| 5 or more Children | 0 (0.0%) | 0 (0.0%) |
| Total | 45 (100.0%) | 0 (0.0%) |
Income Below Poverty Among Single-Parent Households in Rochester
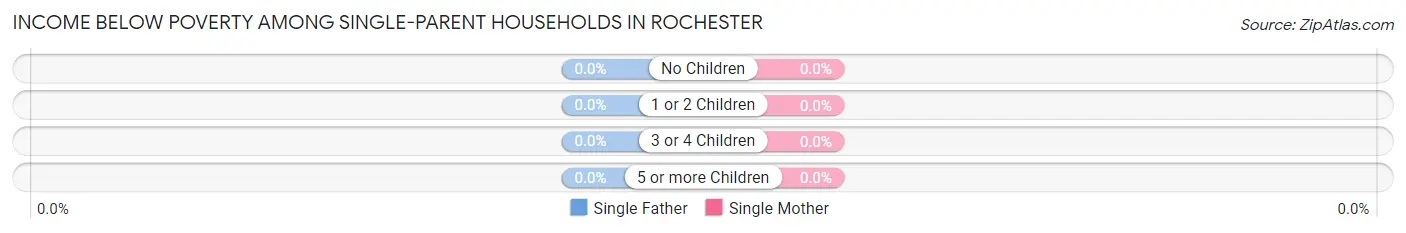
| Children | Single Father | Single Mother |
| No Children | 0 (0.0%) | 0 (0.0%) |
| 1 or 2 Children | 0 (0.0%) | 0 (0.0%) |
| 3 or 4 Children | 0 (0.0%) | 0 (0.0%) |
| 5 or more Children | 0 (0.0%) | 0 (0.0%) |
| Total | 0 (0.0%) | 0 (0.0%) |
Income Below Poverty Among Married-Couple vs Single-Parent Households in Rochester
| Children | Married-Couple Families | Single-Parent Households |
| No Children | 0 (0.0%) | 0 (0.0%) |
| 1 or 2 Children | 0 (0.0%) | 0 (0.0%) |
| 3 or 4 Children | 0 (0.0%) | 0 (0.0%) |
| 5 or more Children | 0 (0.0%) | 0 (0.0%) |
| Total | 0 (0.0%) | 0 (0.0%) |
Employment Characteristics in Rochester
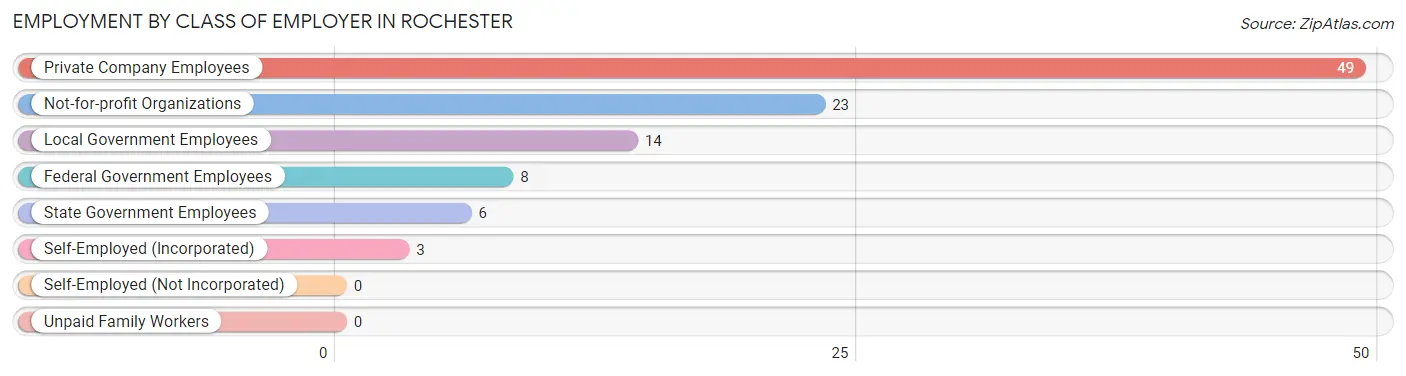
Employment by Class of Employer in Rochester
Among the 103 employed individuals in Rochester, private company employees (49 | 47.6%), not-for-profit organizations (23 | 22.3%), and local government employees (14 | 13.6%) make up the most common classes of employment.
| Employer Class | # Employees | % Employees |
| Private Company Employees | 49 | 47.6% |
| Self-Employed (Incorporated) | 3 | 2.9% |
| Self-Employed (Not Incorporated) | 0 | 0.0% |
| Not-for-profit Organizations | 23 | 22.3% |
| Local Government Employees | 14 | 13.6% |
| State Government Employees | 6 | 5.8% |
| Federal Government Employees | 8 | 7.8% |
| Unpaid Family Workers | 0 | 0.0% |
| Total | 103 | 100.0% |
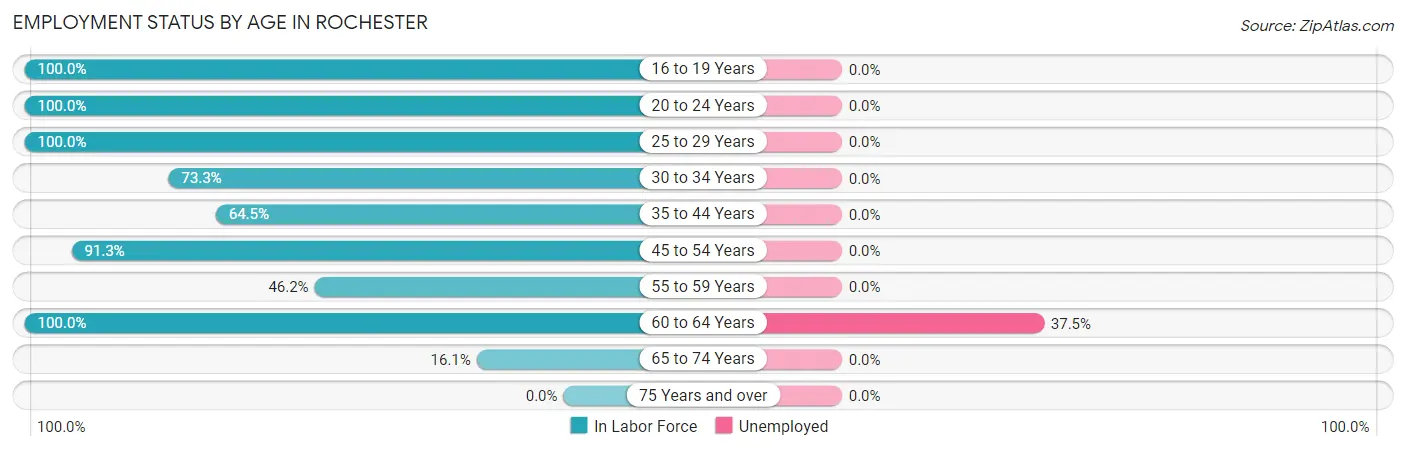
Employment Status by Age in Rochester
According to the labor force statistics for Rochester, out of the total population over 16 years of age (274), 38.7% or 106 individuals are in the labor force, with 2.8% or 3 of them unemployed. The age group with the highest labor force participation rate is 16 to 19 years, with 100.0% or 9 individuals in the labor force. Within the labor force, the 60 to 64 years age range has the highest percentage of unemployed individuals, with 37.5% or 3 of them being unemployed.
| Age Bracket | In Labor Force | Unemployed |
| 16 to 19 Years | 9 (100.0%) | 0 (0.0%) |
| 20 to 24 Years | 13 (100.0%) | 0 (0.0%) |
| 25 to 29 Years | 3 (100.0%) | 0 (0.0%) |
| 30 to 34 Years | 11 (73.3%) | 0 (0.0%) |
| 35 to 44 Years | 20 (64.5%) | 0 (0.0%) |
| 45 to 54 Years | 21 (91.3%) | 0 (0.0%) |
| 55 to 59 Years | 12 (46.2%) | 0 (0.0%) |
| 60 to 64 Years | 8 (100.0%) | 3 (37.5%) |
| 65 to 74 Years | 9 (16.1%) | 0 (0.0%) |
| 75 Years and over | 0 (0.0%) | 0 (0.0%) |
| Total | 106 (38.7%) | 3 (2.8%) |
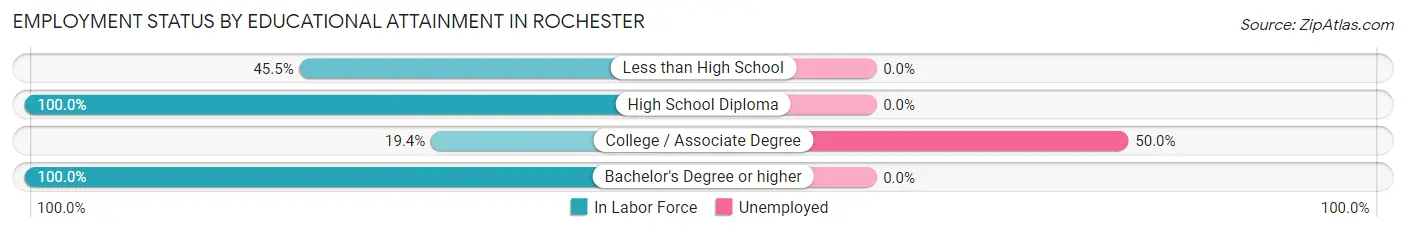
Employment Status by Educational Attainment in Rochester
According to labor force statistics for Rochester, 70.8% of individuals (75) out of the total population between 25 and 64 years of age (106) are in the labor force, with 4.0% or 3 of them being unemployed. The group with the highest labor force participation rate are those with the educational attainment of high school diploma, with 100.0% or 24 individuals in the labor force. Within the labor force, individuals with college / associate degree education have the highest percentage of unemployment, with 50.0% or 3 of them being unemployed.
| Educational Attainment | In Labor Force | Unemployed |
| Less than High School | 5 (45.5%) | 0 (0.0%) |
| High School Diploma | 24 (100.0%) | 0 (0.0%) |
| College / Associate Degree | 6 (19.4%) | 16 (50.0%) |
| Bachelor's Degree or higher | 40 (100.0%) | 0 (0.0%) |
| Total | 75 (70.8%) | 4 (4.0%) |
Employment Occupations by Sex in Rochester
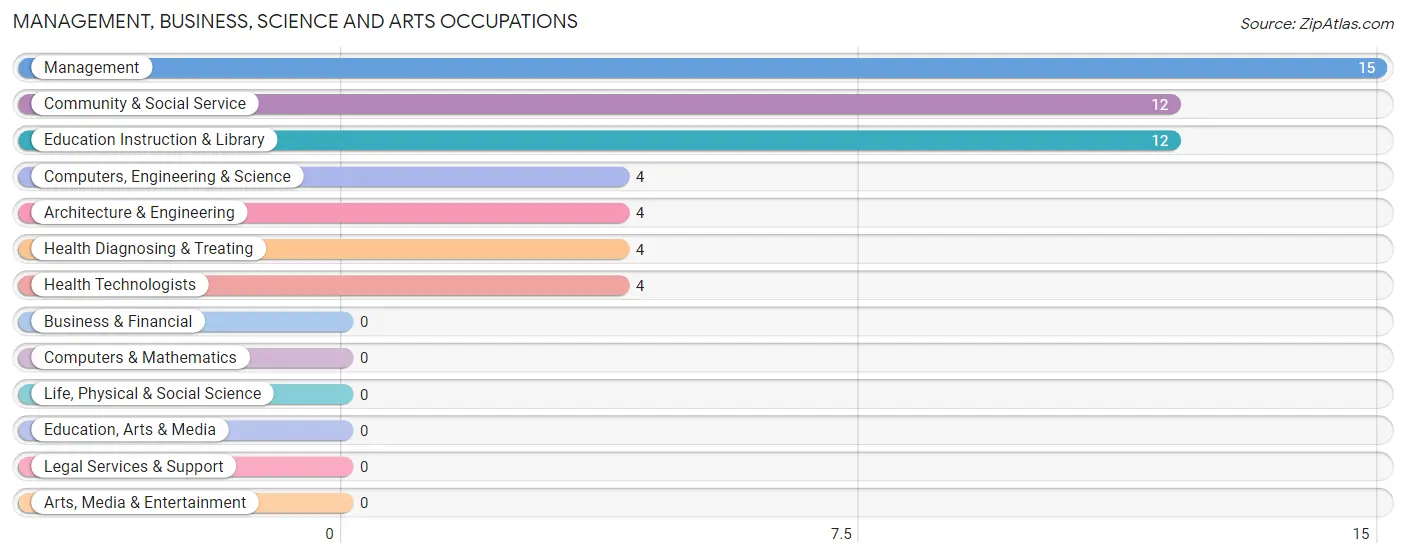
Management, Business, Science and Arts Occupations
The most common Management, Business, Science and Arts occupations in Rochester are Management (15 | 14.6%), Community & Social Service (12 | 11.7%), Education Instruction & Library (12 | 11.7%), Computers, Engineering & Science (4 | 3.9%), and Architecture & Engineering (4 | 3.9%).
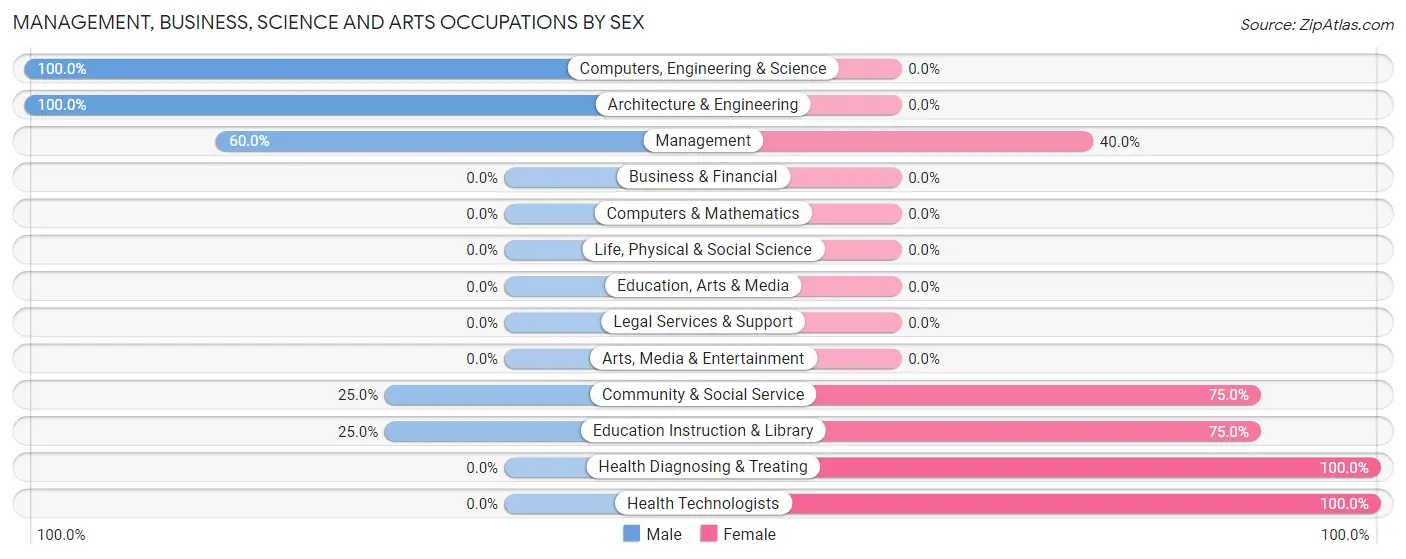
Management, Business, Science and Arts Occupations by Sex
Within the Management, Business, Science and Arts occupations in Rochester, the most male-oriented occupations are Computers, Engineering & Science (100.0%), Architecture & Engineering (100.0%), and Management (60.0%), while the most female-oriented occupations are Health Diagnosing & Treating (100.0%), Health Technologists (100.0%), and Community & Social Service (75.0%).
| Occupation | Male | Female |
| Management | 9 (60.0%) | 6 (40.0%) |
| Business & Financial | 0 (0.0%) | 0 (0.0%) |
| Computers, Engineering & Science | 4 (100.0%) | 0 (0.0%) |
| Computers & Mathematics | 0 (0.0%) | 0 (0.0%) |
| Architecture & Engineering | 4 (100.0%) | 0 (0.0%) |
| Life, Physical & Social Science | 0 (0.0%) | 0 (0.0%) |
| Community & Social Service | 3 (25.0%) | 9 (75.0%) |
| Education, Arts & Media | 0 (0.0%) | 0 (0.0%) |
| Legal Services & Support | 0 (0.0%) | 0 (0.0%) |
| Education Instruction & Library | 3 (25.0%) | 9 (75.0%) |
| Arts, Media & Entertainment | 0 (0.0%) | 0 (0.0%) |
| Health Diagnosing & Treating | 0 (0.0%) | 4 (100.0%) |
| Health Technologists | 0 (0.0%) | 4 (100.0%) |
| Total (Category) | 16 (45.7%) | 19 (54.3%) |
| Total (Overall) | 44 (42.7%) | 59 (57.3%) |
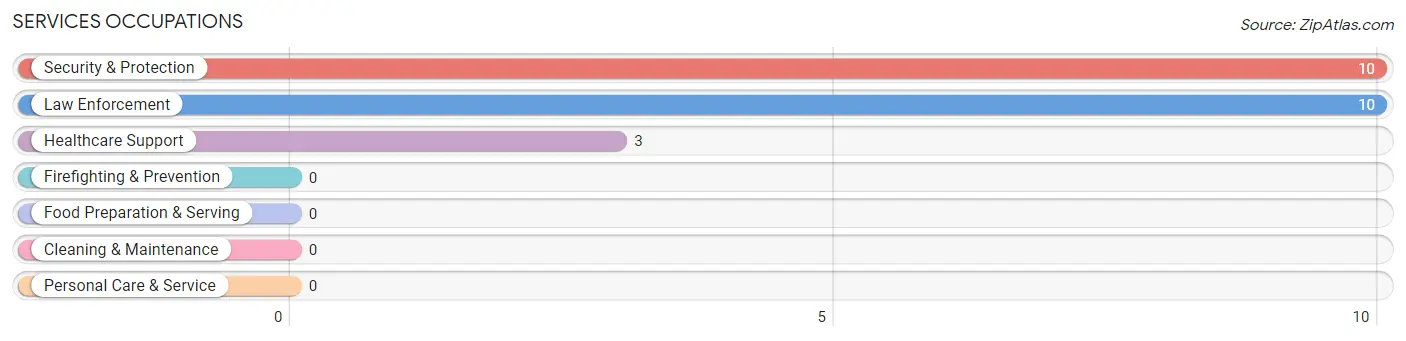
Services Occupations
The most common Services occupations in Rochester are Security & Protection (10 | 9.7%), Law Enforcement (10 | 9.7%), and Healthcare Support (3 | 2.9%).
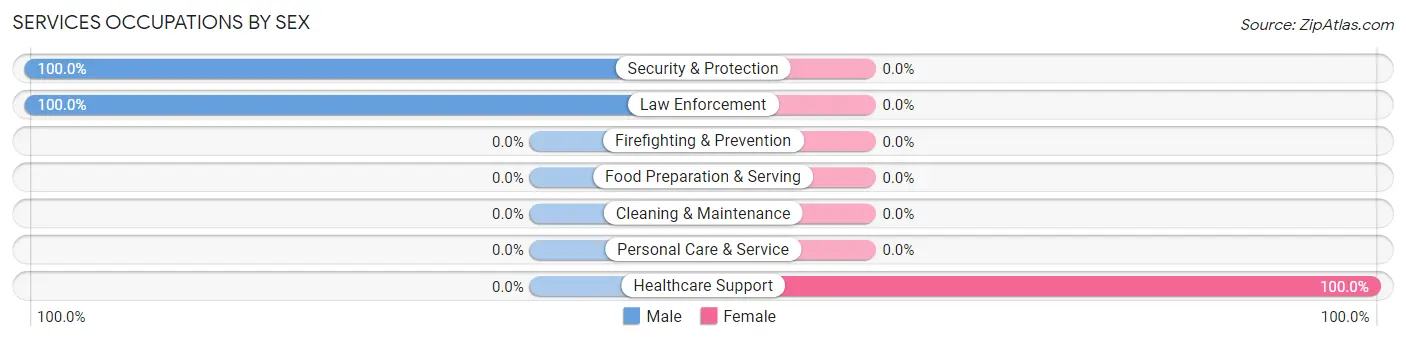
Services Occupations by Sex
| Occupation | Male | Female |
| Healthcare Support | 0 (0.0%) | 3 (100.0%) |
| Security & Protection | 10 (100.0%) | 0 (0.0%) |
| Firefighting & Prevention | 0 (0.0%) | 0 (0.0%) |
| Law Enforcement | 10 (100.0%) | 0 (0.0%) |
| Food Preparation & Serving | 0 (0.0%) | 0 (0.0%) |
| Cleaning & Maintenance | 0 (0.0%) | 0 (0.0%) |
| Personal Care & Service | 0 (0.0%) | 0 (0.0%) |
| Total (Category) | 10 (76.9%) | 3 (23.1%) |
| Total (Overall) | 44 (42.7%) | 59 (57.3%) |
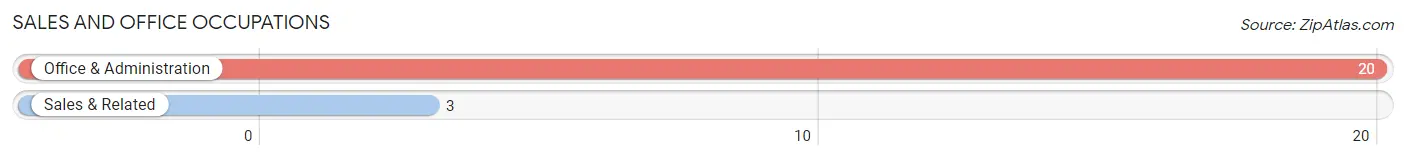
Sales and Office Occupations
The most common Sales and Office occupations in Rochester are Office & Administration (20 | 19.4%), and Sales & Related (3 | 2.9%).
Sales and Office Occupations by Sex
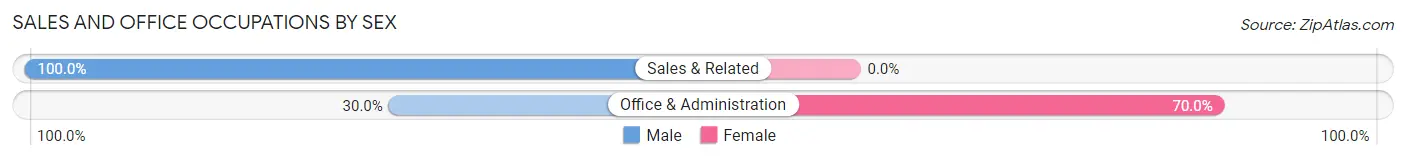
| Occupation | Male | Female |
| Sales & Related | 3 (100.0%) | 0 (0.0%) |
| Office & Administration | 6 (30.0%) | 14 (70.0%) |
| Total (Category) | 9 (39.1%) | 14 (60.9%) |
| Total (Overall) | 44 (42.7%) | 59 (57.3%) |
Natural Resources, Construction and Maintenance Occupations
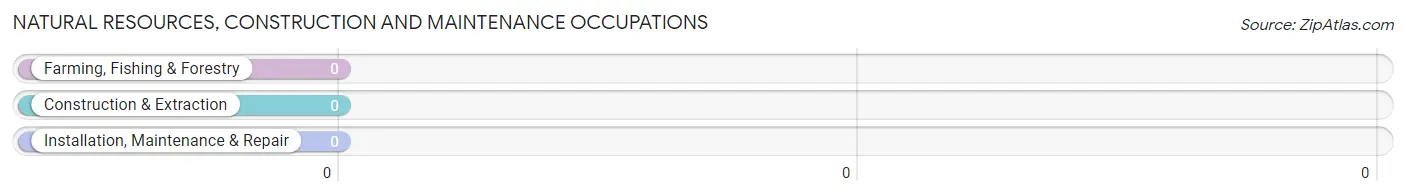
Natural Resources, Construction and Maintenance Occupations by Sex
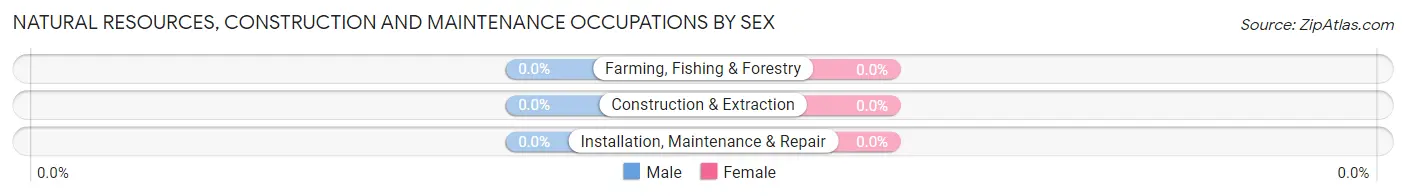
| Occupation | Male | Female |
| Farming, Fishing & Forestry | 0 (0.0%) | 0 (0.0%) |
| Construction & Extraction | 0 (0.0%) | 0 (0.0%) |
| Installation, Maintenance & Repair | 0 (0.0%) | 0 (0.0%) |
| Total (Category) | 0 (0.0%) | 0 (0.0%) |
| Total (Overall) | 44 (42.7%) | 59 (57.3%) |
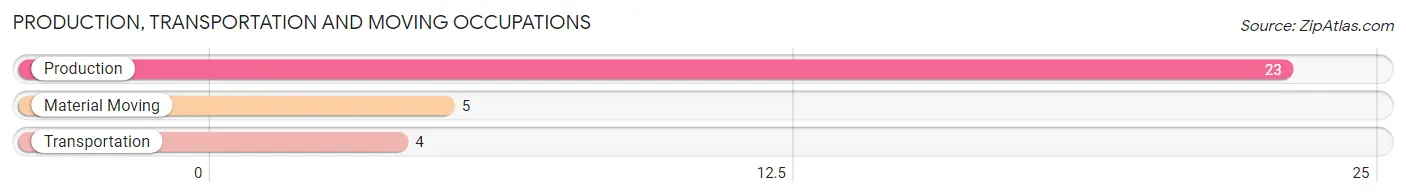
Production, Transportation and Moving Occupations
The most common Production, Transportation and Moving occupations in Rochester are Production (23 | 22.3%), Material Moving (5 | 4.9%), and Transportation (4 | 3.9%).
Production, Transportation and Moving Occupations by Sex
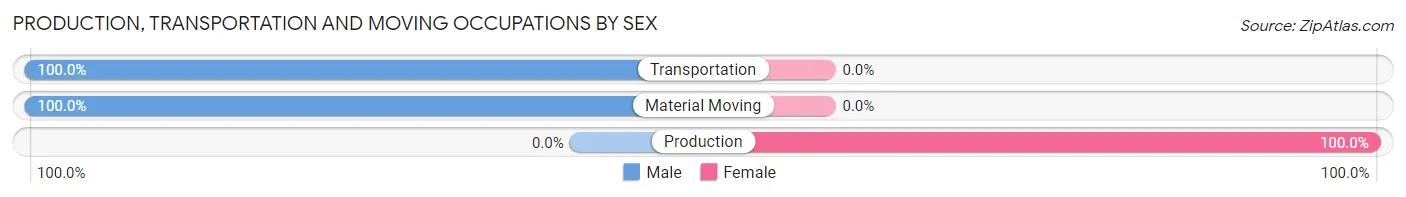
| Occupation | Male | Female |
| Production | 0 (0.0%) | 23 (100.0%) |
| Transportation | 4 (100.0%) | 0 (0.0%) |
| Material Moving | 5 (100.0%) | 0 (0.0%) |
| Total (Category) | 9 (28.1%) | 23 (71.9%) |
| Total (Overall) | 44 (42.7%) | 59 (57.3%) |
Employment Industries by Sex in Rochester
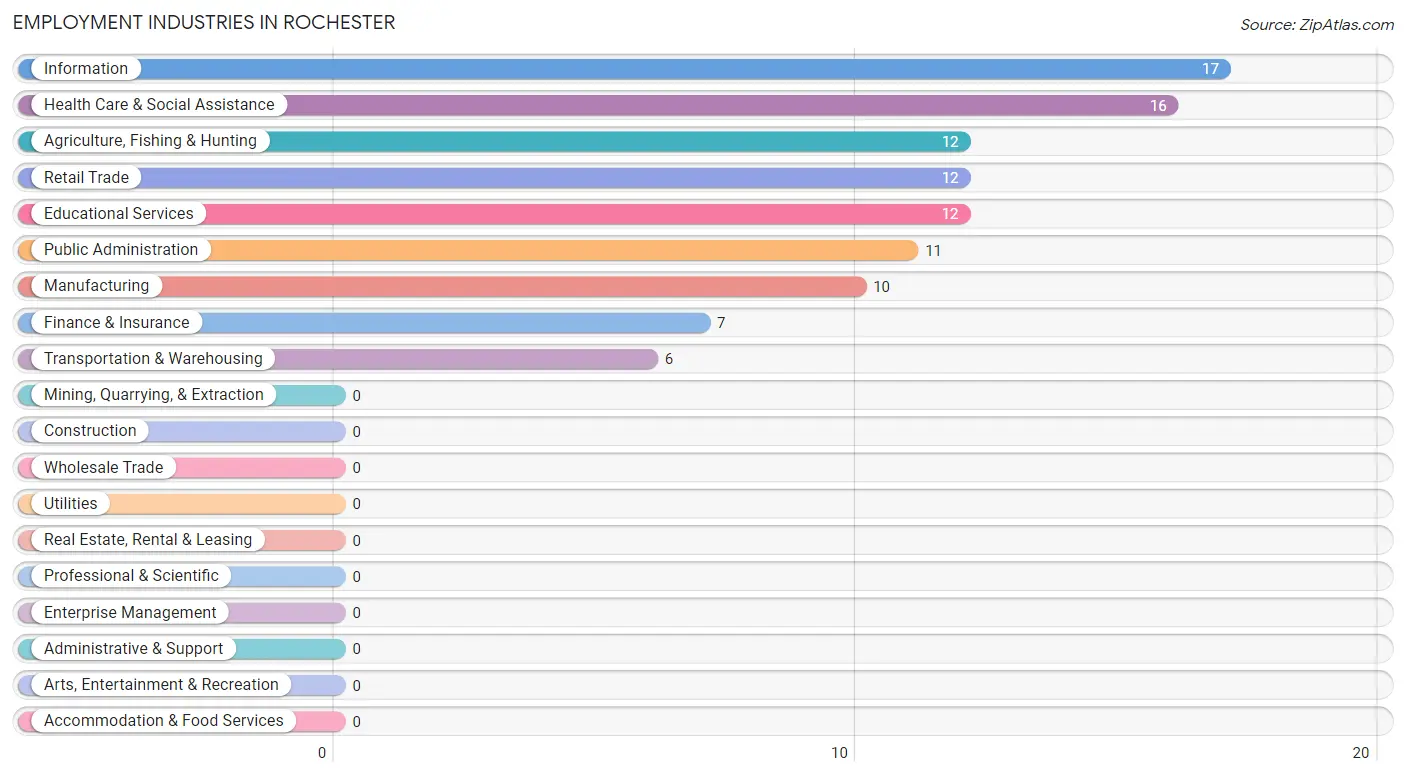
Employment Industries in Rochester
The major employment industries in Rochester include Information (17 | 16.5%), Health Care & Social Assistance (16 | 15.5%), Agriculture, Fishing & Hunting (12 | 11.7%), Retail Trade (12 | 11.7%), and Educational Services (12 | 11.7%).
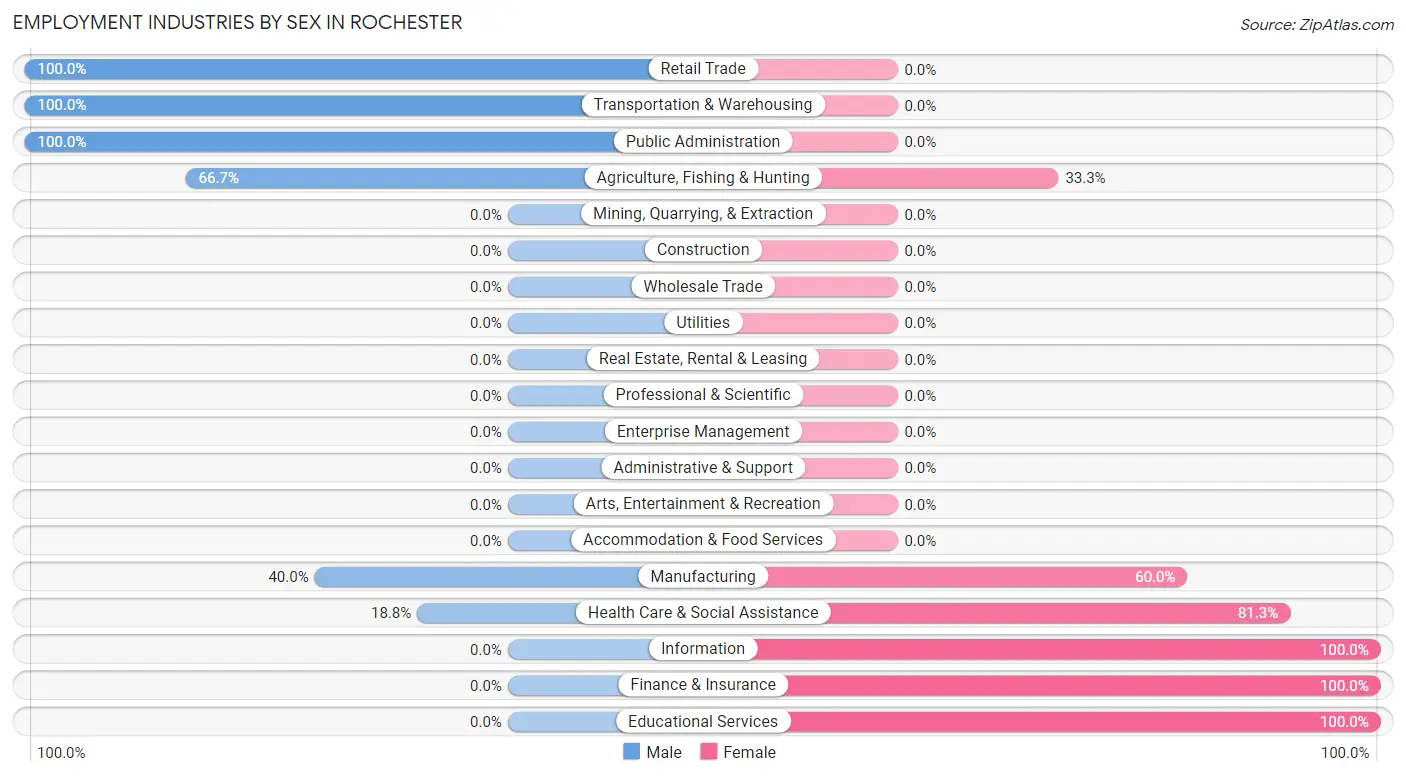
Employment Industries by Sex in Rochester
The Rochester industries that see more men than women are Retail Trade (100.0%), Transportation & Warehousing (100.0%), and Public Administration (100.0%), whereas the industries that tend to have a higher number of women are Information (100.0%), Finance & Insurance (100.0%), and Educational Services (100.0%).
| Industry | Male | Female |
| Agriculture, Fishing & Hunting | 8 (66.7%) | 4 (33.3%) |
| Mining, Quarrying, & Extraction | 0 (0.0%) | 0 (0.0%) |
| Construction | 0 (0.0%) | 0 (0.0%) |
| Manufacturing | 4 (40.0%) | 6 (60.0%) |
| Wholesale Trade | 0 (0.0%) | 0 (0.0%) |
| Retail Trade | 12 (100.0%) | 0 (0.0%) |
| Transportation & Warehousing | 6 (100.0%) | 0 (0.0%) |
| Utilities | 0 (0.0%) | 0 (0.0%) |
| Information | 0 (0.0%) | 17 (100.0%) |
| Finance & Insurance | 0 (0.0%) | 7 (100.0%) |
| Real Estate, Rental & Leasing | 0 (0.0%) | 0 (0.0%) |
| Professional & Scientific | 0 (0.0%) | 0 (0.0%) |
| Enterprise Management | 0 (0.0%) | 0 (0.0%) |
| Administrative & Support | 0 (0.0%) | 0 (0.0%) |
| Educational Services | 0 (0.0%) | 12 (100.0%) |
| Health Care & Social Assistance | 3 (18.8%) | 13 (81.2%) |
| Arts, Entertainment & Recreation | 0 (0.0%) | 0 (0.0%) |
| Accommodation & Food Services | 0 (0.0%) | 0 (0.0%) |
| Public Administration | 11 (100.0%) | 0 (0.0%) |
| Total | 44 (42.7%) | 59 (57.3%) |
Education in Rochester
School Enrollment in Rochester
The most common levels of schooling among the 34 students in Rochester are middle school (17 | 50.0%), high school (14 | 41.2%), and college / undergraduate (3 | 8.8%).
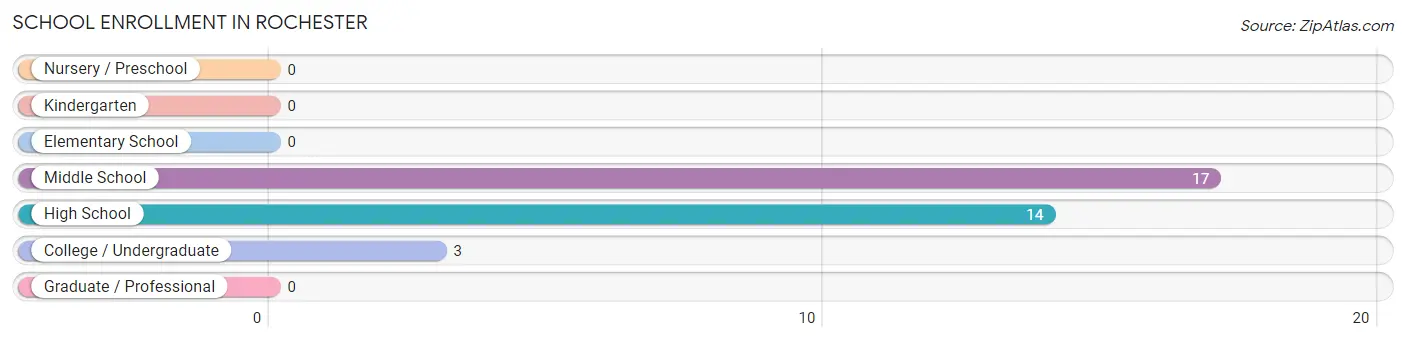
| School Level | # Students | % Students |
| Nursery / Preschool | 0 | 0.0% |
| Kindergarten | 0 | 0.0% |
| Elementary School | 0 | 0.0% |
| Middle School | 17 | 50.0% |
| High School | 14 | 41.2% |
| College / Undergraduate | 3 | 8.8% |
| Graduate / Professional | 0 | 0.0% |
| Total | 34 | 100.0% |
School Enrollment by Age by Funding Source in Rochester
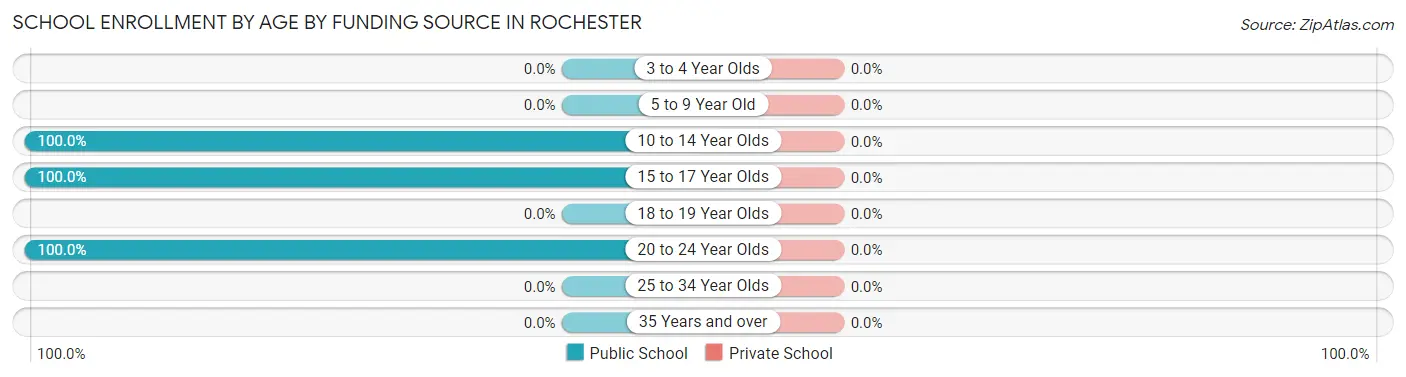
| Age Bracket | Public School | Private School |
| 3 to 4 Year Olds | 0 (0.0%) | 0 (0.0%) |
| 5 to 9 Year Old | 0 (0.0%) | 0 (0.0%) |
| 10 to 14 Year Olds | 17 (100.0%) | 0 (0.0%) |
| 15 to 17 Year Olds | 14 (100.0%) | 0 (0.0%) |
| 18 to 19 Year Olds | 0 (0.0%) | 0 (0.0%) |
| 20 to 24 Year Olds | 3 (100.0%) | 0 (0.0%) |
| 25 to 34 Year Olds | 0 (0.0%) | 0 (0.0%) |
| 35 Years and over | 0 (0.0%) | 0 (0.0%) |
| Total | 34 (100.0%) | 0 (0.0%) |
Educational Attainment by Field of Study in Rochester
Literature & languages (29 | 25.2%), psychology (21 | 18.3%), bio, nature & agricultural (12 | 10.4%), liberal arts & history (12 | 10.4%), and visual & performing arts (11 | 9.6%) are the most common fields of study among 115 individuals in Rochester who have obtained a bachelor's degree or higher.
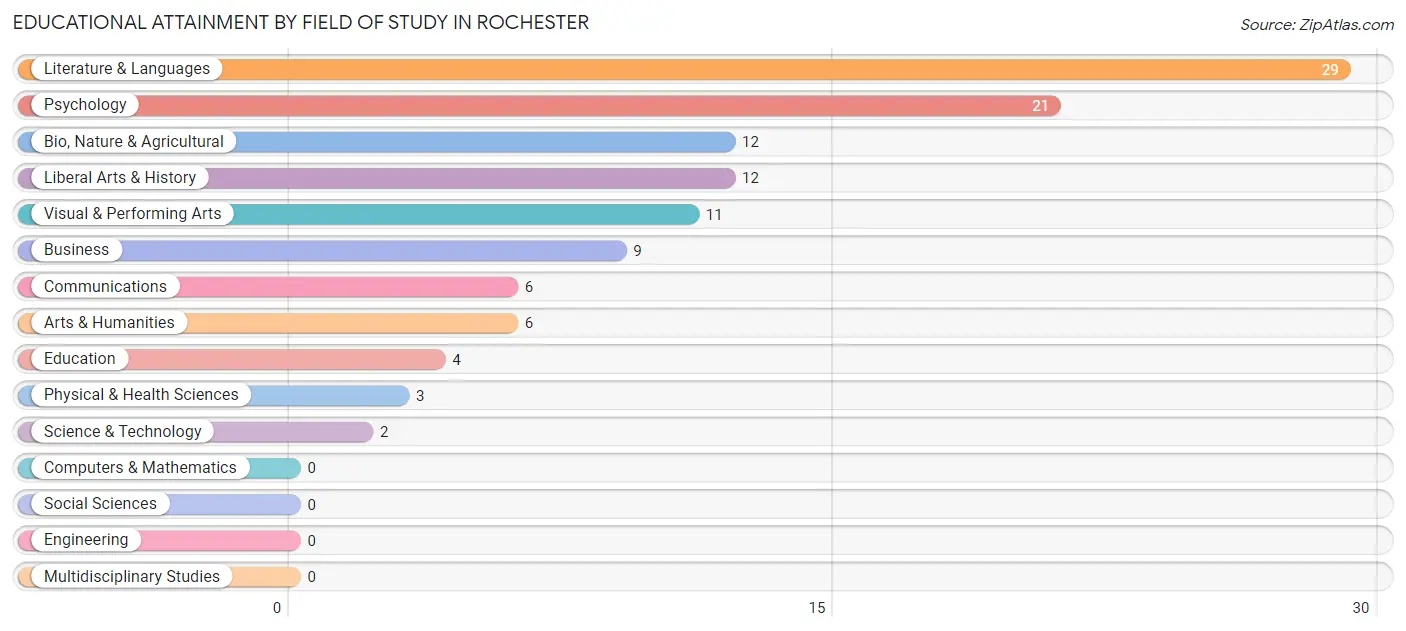
| Field of Study | # Graduates | % Graduates |
| Computers & Mathematics | 0 | 0.0% |
| Bio, Nature & Agricultural | 12 | 10.4% |
| Physical & Health Sciences | 3 | 2.6% |
| Psychology | 21 | 18.3% |
| Social Sciences | 0 | 0.0% |
| Engineering | 0 | 0.0% |
| Multidisciplinary Studies | 0 | 0.0% |
| Science & Technology | 2 | 1.7% |
| Business | 9 | 7.8% |
| Education | 4 | 3.5% |
| Literature & Languages | 29 | 25.2% |
| Liberal Arts & History | 12 | 10.4% |
| Visual & Performing Arts | 11 | 9.6% |
| Communications | 6 | 5.2% |
| Arts & Humanities | 6 | 5.2% |
| Total | 115 | 100.0% |
Transportation & Commute in Rochester
Vehicle Availability by Sex in Rochester
The most prevalent vehicle ownership categories in Rochester are males with 2 vehicles (17, accounting for 41.5%) and females with 2 vehicles (26, making up 32.1%).
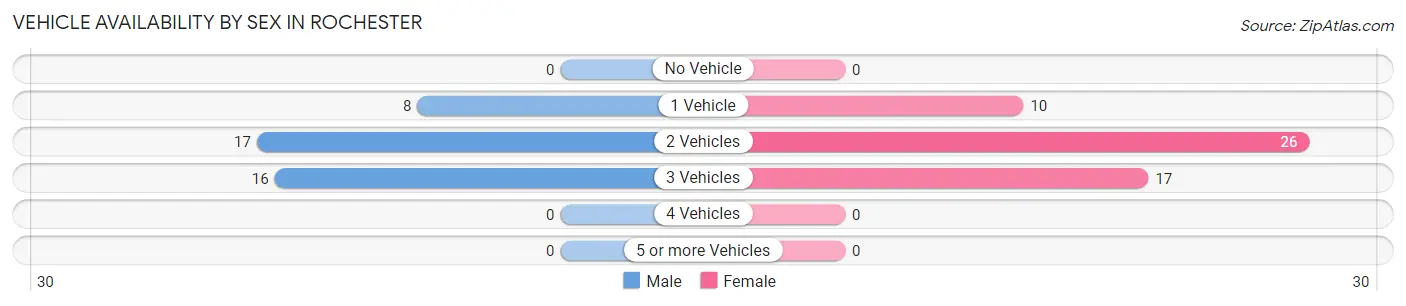
| Vehicles Available | Male | Female |
| No Vehicle | 0 (0.0%) | 0 (0.0%) |
| 1 Vehicle | 8 (19.5%) | 10 (18.9%) |
| 2 Vehicles | 17 (41.5%) | 26 (49.1%) |
| 3 Vehicles | 16 (39.0%) | 17 (32.1%) |
| 4 Vehicles | 0 (0.0%) | 0 (0.0%) |
| 5 or more Vehicles | 0 (0.0%) | 0 (0.0%) |
| Total | 41 (100.0%) | 53 (100.0%) |
Commute Time in Rochester
The most frequently occuring commute durations in Rochester are less than 5 minutes (35 commuters, 38.9%), 5 to 9 minutes (20 commuters, 22.2%), and 45 to 59 minutes (9 commuters, 10.0%).
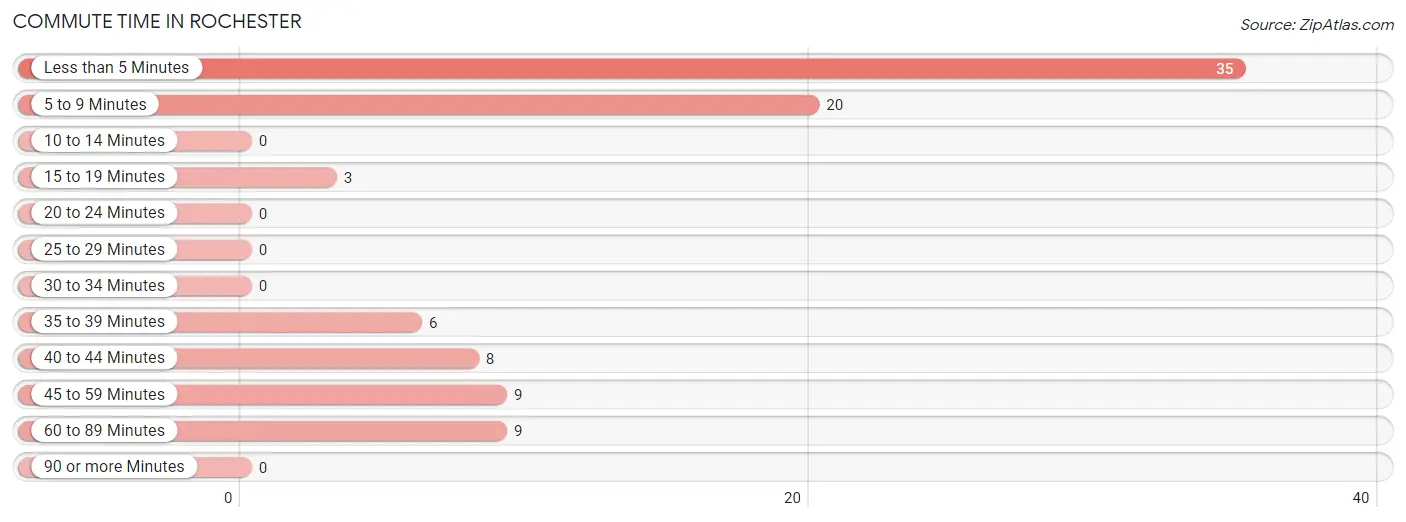
| Commute Time | # Commuters | % Commuters |
| Less than 5 Minutes | 35 | 38.9% |
| 5 to 9 Minutes | 20 | 22.2% |
| 10 to 14 Minutes | 0 | 0.0% |
| 15 to 19 Minutes | 3 | 3.3% |
| 20 to 24 Minutes | 0 | 0.0% |
| 25 to 29 Minutes | 0 | 0.0% |
| 30 to 34 Minutes | 0 | 0.0% |
| 35 to 39 Minutes | 6 | 6.7% |
| 40 to 44 Minutes | 8 | 8.9% |
| 45 to 59 Minutes | 9 | 10.0% |
| 60 to 89 Minutes | 9 | 10.0% |
| 90 or more Minutes | 0 | 0.0% |
Commute Time by Sex in Rochester
The most common commute times in Rochester are 5 to 9 minutes (9 commuters, 20.4%) for males and less than 5 minutes (31 commuters, 67.4%) for females.
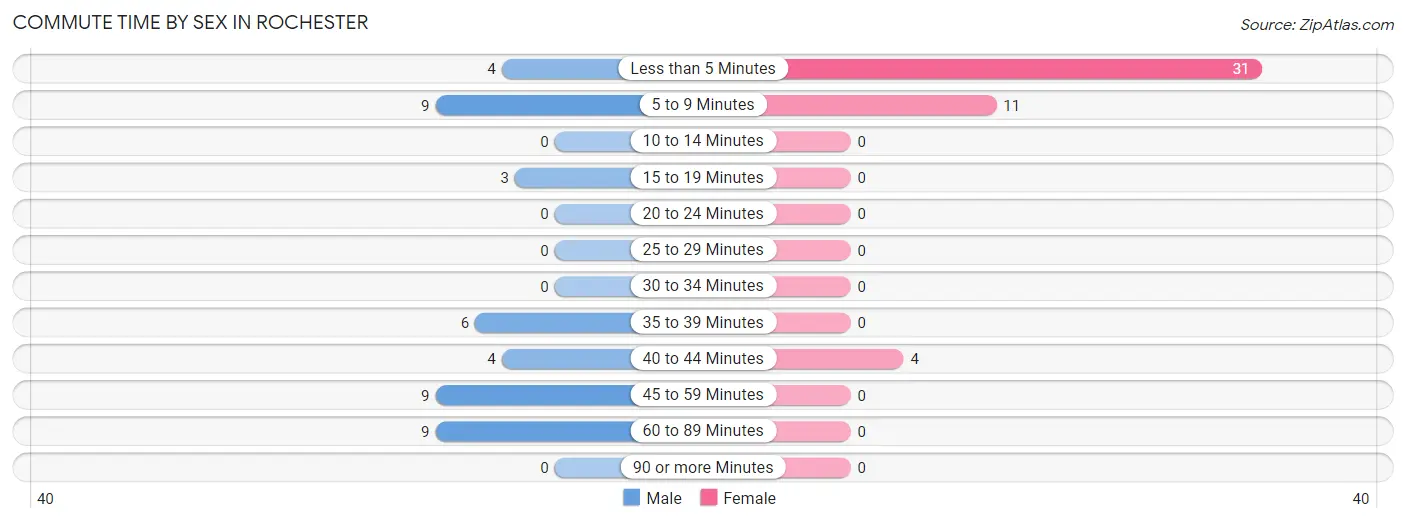
| Commute Time | Male | Female |
| Less than 5 Minutes | 4 (9.1%) | 31 (67.4%) |
| 5 to 9 Minutes | 9 (20.4%) | 11 (23.9%) |
| 10 to 14 Minutes | 0 (0.0%) | 0 (0.0%) |
| 15 to 19 Minutes | 3 (6.8%) | 0 (0.0%) |
| 20 to 24 Minutes | 0 (0.0%) | 0 (0.0%) |
| 25 to 29 Minutes | 0 (0.0%) | 0 (0.0%) |
| 30 to 34 Minutes | 0 (0.0%) | 0 (0.0%) |
| 35 to 39 Minutes | 6 (13.6%) | 0 (0.0%) |
| 40 to 44 Minutes | 4 (9.1%) | 4 (8.7%) |
| 45 to 59 Minutes | 9 (20.4%) | 0 (0.0%) |
| 60 to 89 Minutes | 9 (20.4%) | 0 (0.0%) |
| 90 or more Minutes | 0 (0.0%) | 0 (0.0%) |
Time of Departure to Work by Sex in Rochester
The most frequent times of departure to work in Rochester are 7:30 AM to 7:59 AM (26, 59.1%) for males and 9:00 AM to 9:59 AM (17, 37.0%) for females.
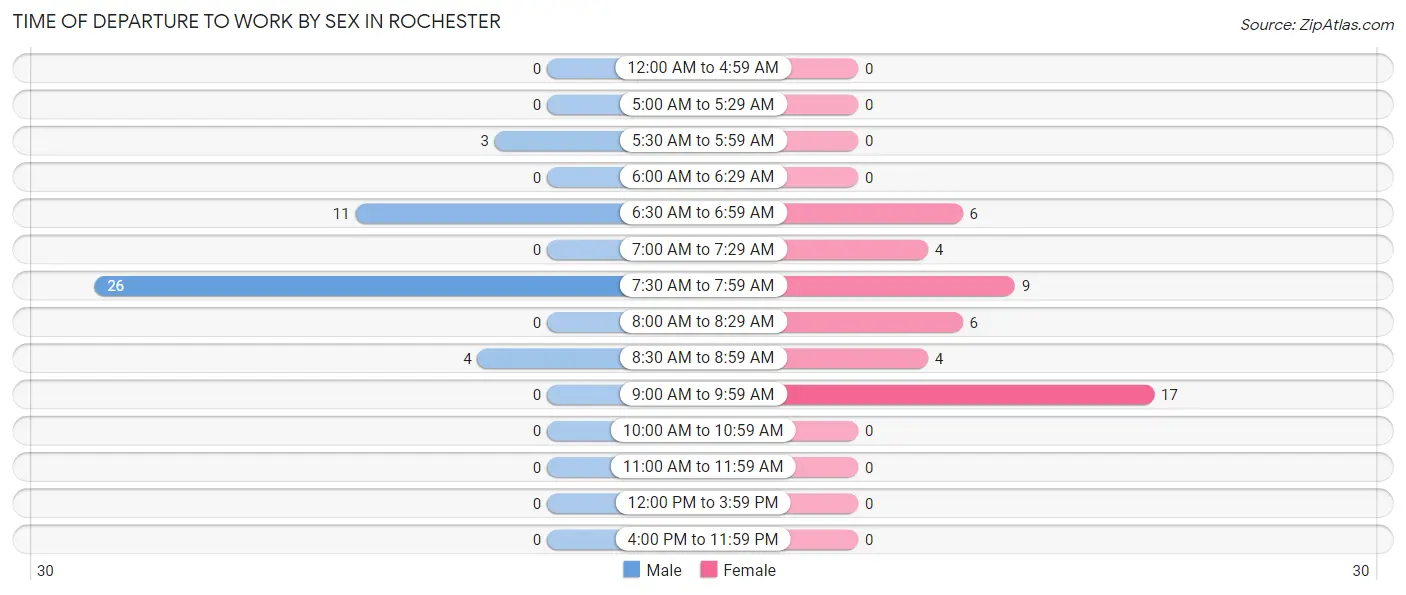
| Time of Departure | Male | Female |
| 12:00 AM to 4:59 AM | 0 (0.0%) | 0 (0.0%) |
| 5:00 AM to 5:29 AM | 0 (0.0%) | 0 (0.0%) |
| 5:30 AM to 5:59 AM | 3 (6.8%) | 0 (0.0%) |
| 6:00 AM to 6:29 AM | 0 (0.0%) | 0 (0.0%) |
| 6:30 AM to 6:59 AM | 11 (25.0%) | 6 (13.0%) |
| 7:00 AM to 7:29 AM | 0 (0.0%) | 4 (8.7%) |
| 7:30 AM to 7:59 AM | 26 (59.1%) | 9 (19.6%) |
| 8:00 AM to 8:29 AM | 0 (0.0%) | 6 (13.0%) |
| 8:30 AM to 8:59 AM | 4 (9.1%) | 4 (8.7%) |
| 9:00 AM to 9:59 AM | 0 (0.0%) | 17 (37.0%) |
| 10:00 AM to 10:59 AM | 0 (0.0%) | 0 (0.0%) |
| 11:00 AM to 11:59 AM | 0 (0.0%) | 0 (0.0%) |
| 12:00 PM to 3:59 PM | 0 (0.0%) | 0 (0.0%) |
| 4:00 PM to 11:59 PM | 0 (0.0%) | 0 (0.0%) |
| Total | 44 (100.0%) | 46 (100.0%) |
Housing Occupancy in Rochester
Occupancy by Ownership in Rochester
Of the total 160 dwellings in Rochester, owner-occupied units account for 124 (77.5%), while renter-occupied units make up 36 (22.5%).
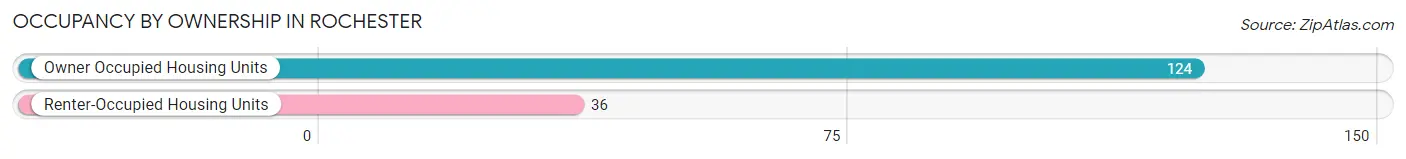
| Occupancy | # Housing Units | % Housing Units |
| Owner Occupied Housing Units | 124 | 77.5% |
| Renter-Occupied Housing Units | 36 | 22.5% |
| Total Occupied Housing Units | 160 | 100.0% |
Occupancy by Household Size in Rochester
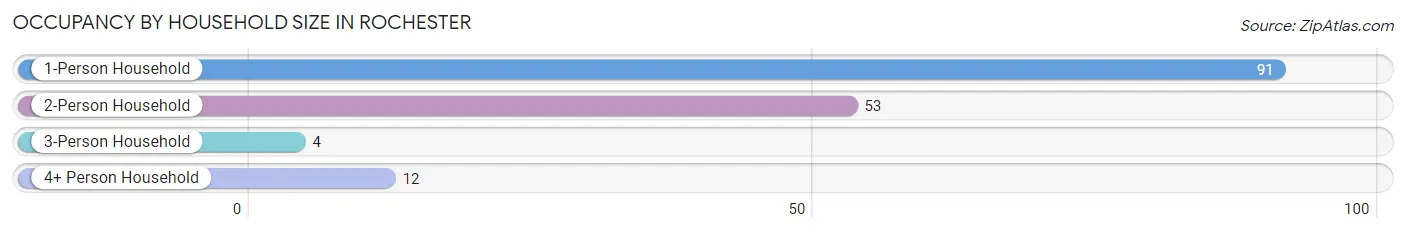
| Household Size | # Housing Units | % Housing Units |
| 1-Person Household | 91 | 56.9% |
| 2-Person Household | 53 | 33.1% |
| 3-Person Household | 4 | 2.5% |
| 4+ Person Household | 12 | 7.5% |
| Total Housing Units | 160 | 100.0% |
Occupancy by Ownership by Household Size in Rochester
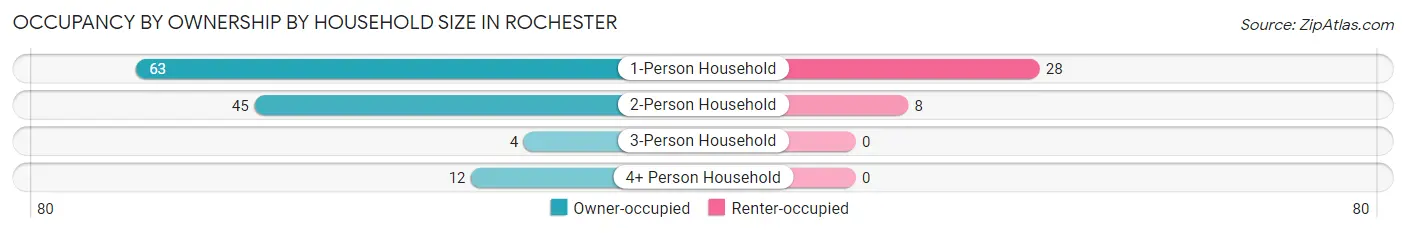
| Household Size | Owner-occupied | Renter-occupied |
| 1-Person Household | 63 (69.2%) | 28 (30.8%) |
| 2-Person Household | 45 (84.9%) | 8 (15.1%) |
| 3-Person Household | 4 (100.0%) | 0 (0.0%) |
| 4+ Person Household | 12 (100.0%) | 0 (0.0%) |
| Total Housing Units | 124 (77.5%) | 36 (22.5%) |
Occupancy by Educational Attainment in Rochester
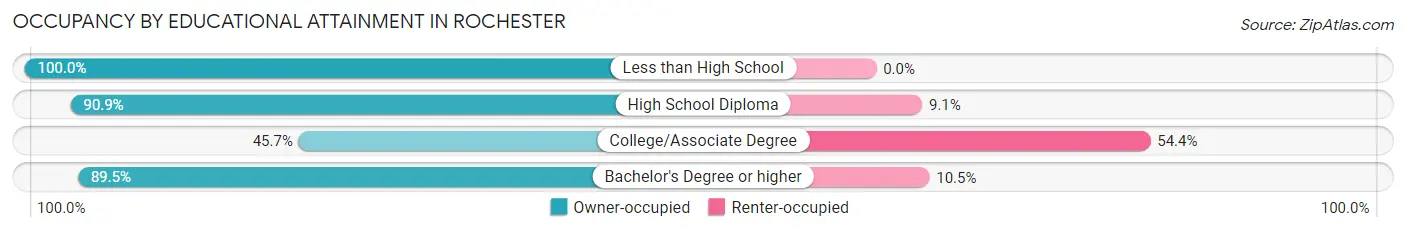
| Household Size | Owner-occupied | Renter-occupied |
| Less than High School | 5 (100.0%) | 0 (0.0%) |
| High School Diploma | 30 (90.9%) | 3 (9.1%) |
| College/Associate Degree | 21 (45.7%) | 25 (54.3%) |
| Bachelor's Degree or higher | 68 (89.5%) | 8 (10.5%) |
Occupancy by Age of Householder in Rochester
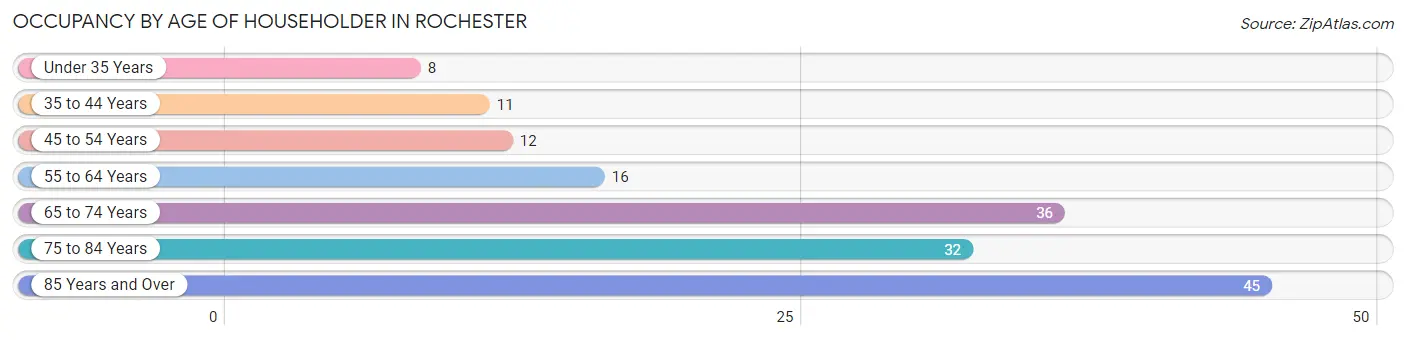
| Age Bracket | # Households | % Households |
| Under 35 Years | 8 | 5.0% |
| 35 to 44 Years | 11 | 6.9% |
| 45 to 54 Years | 12 | 7.5% |
| 55 to 64 Years | 16 | 10.0% |
| 65 to 74 Years | 36 | 22.5% |
| 75 to 84 Years | 32 | 20.0% |
| 85 Years and Over | 45 | 28.1% |
| Total | 160 | 100.0% |
Housing Finances in Rochester
Median Income by Occupancy in Rochester
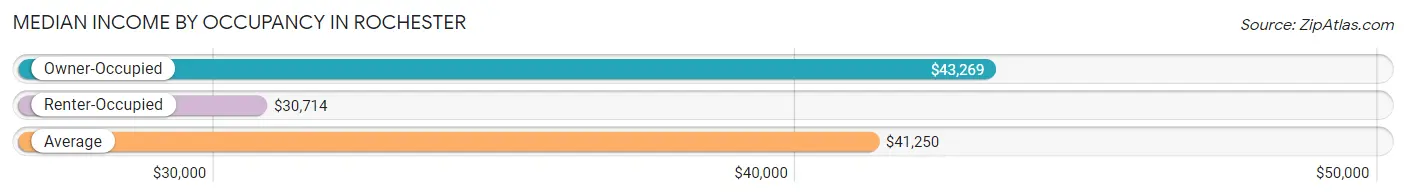
| Occupancy Type | # Households | Median Income |
| Owner-Occupied | 124 (77.5%) | $43,269 |
| Renter-Occupied | 36 (22.5%) | $30,714 |
| Average | 160 (100.0%) | $41,250 |
Occupancy by Householder Income Bracket in Rochester
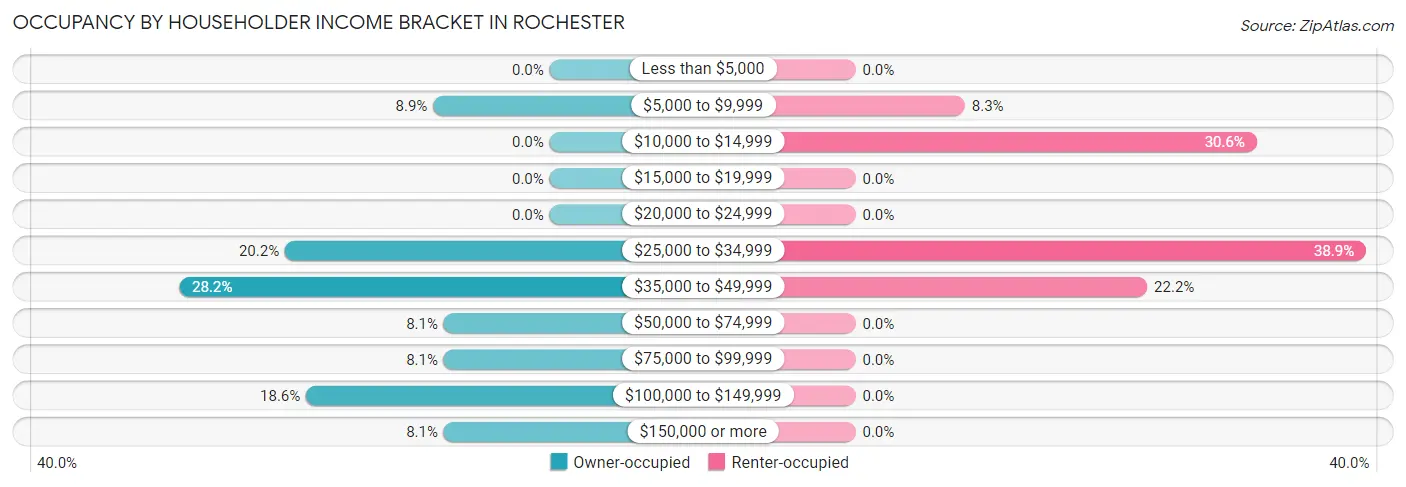
| Income Bracket | Owner-occupied | Renter-occupied |
| Less than $5,000 | 0 (0.0%) | 0 (0.0%) |
| $5,000 to $9,999 | 11 (8.9%) | 3 (8.3%) |
| $10,000 to $14,999 | 0 (0.0%) | 11 (30.6%) |
| $15,000 to $19,999 | 0 (0.0%) | 0 (0.0%) |
| $20,000 to $24,999 | 0 (0.0%) | 0 (0.0%) |
| $25,000 to $34,999 | 25 (20.2%) | 14 (38.9%) |
| $35,000 to $49,999 | 35 (28.2%) | 8 (22.2%) |
| $50,000 to $74,999 | 10 (8.1%) | 0 (0.0%) |
| $75,000 to $99,999 | 10 (8.1%) | 0 (0.0%) |
| $100,000 to $149,999 | 23 (18.5%) | 0 (0.0%) |
| $150,000 or more | 10 (8.1%) | 0 (0.0%) |
| Total | 124 (100.0%) | 36 (100.0%) |
Monthly Housing Cost Tiers in Rochester
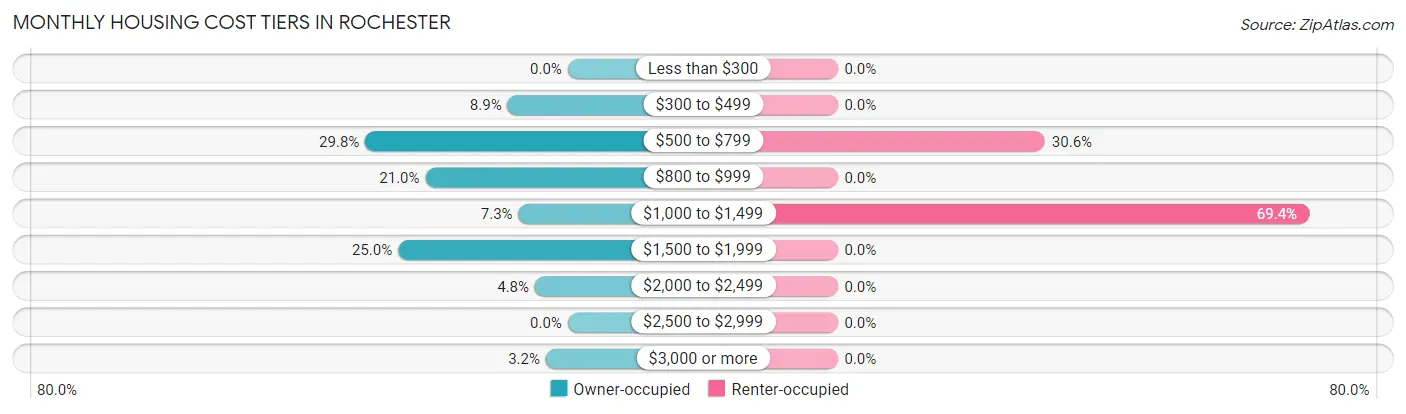
| Monthly Cost | Owner-occupied | Renter-occupied |
| Less than $300 | 0 (0.0%) | 0 (0.0%) |
| $300 to $499 | 11 (8.9%) | 0 (0.0%) |
| $500 to $799 | 37 (29.8%) | 11 (30.6%) |
| $800 to $999 | 26 (21.0%) | 0 (0.0%) |
| $1,000 to $1,499 | 9 (7.3%) | 25 (69.4%) |
| $1,500 to $1,999 | 31 (25.0%) | 0 (0.0%) |
| $2,000 to $2,499 | 6 (4.8%) | 0 (0.0%) |
| $2,500 to $2,999 | 0 (0.0%) | 0 (0.0%) |
| $3,000 or more | 4 (3.2%) | 0 (0.0%) |
| Total | 124 (100.0%) | 36 (100.0%) |
Physical Housing Characteristics in Rochester
Housing Structures in Rochester
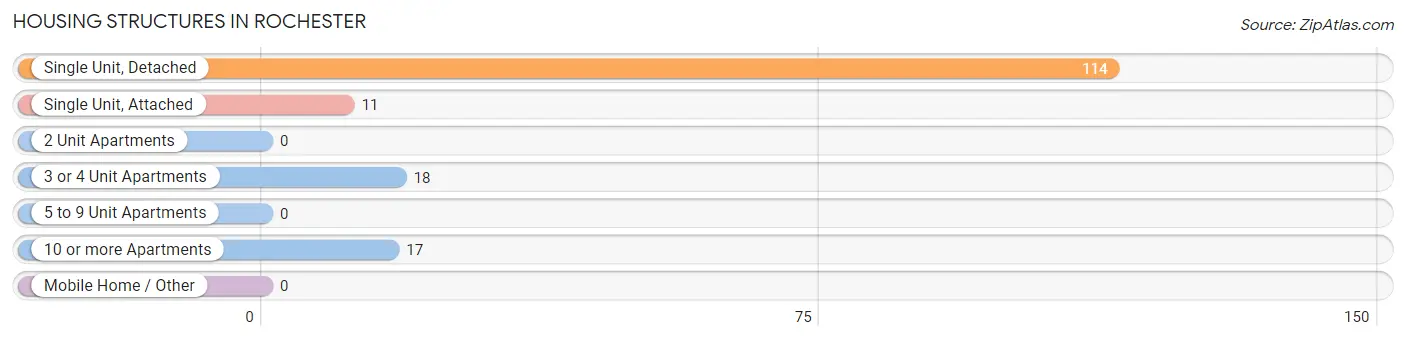
| Structure Type | # Housing Units | % Housing Units |
| Single Unit, Detached | 114 | 71.3% |
| Single Unit, Attached | 11 | 6.9% |
| 2 Unit Apartments | 0 | 0.0% |
| 3 or 4 Unit Apartments | 18 | 11.3% |
| 5 to 9 Unit Apartments | 0 | 0.0% |
| 10 or more Apartments | 17 | 10.6% |
| Mobile Home / Other | 0 | 0.0% |
| Total | 160 | 100.0% |
Housing Structures by Occupancy in Rochester
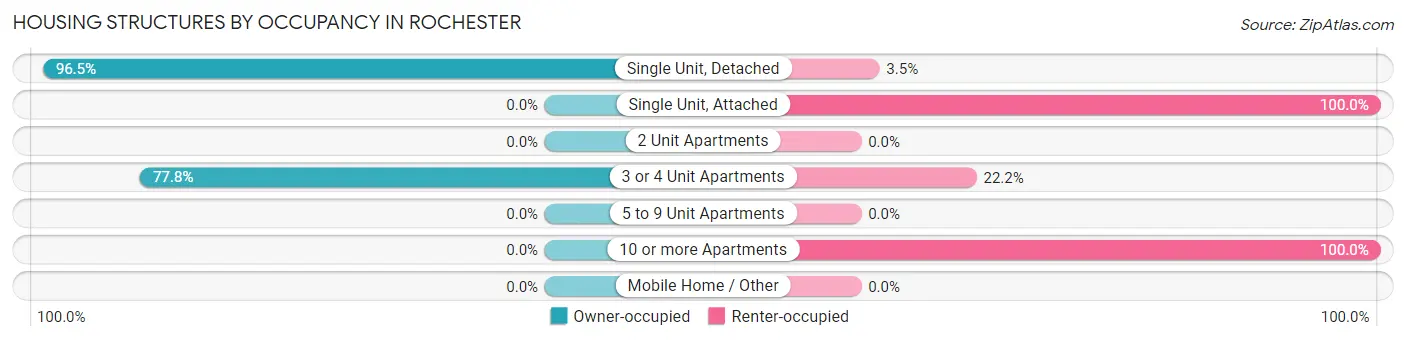
| Structure Type | Owner-occupied | Renter-occupied |
| Single Unit, Detached | 110 (96.5%) | 4 (3.5%) |
| Single Unit, Attached | 0 (0.0%) | 11 (100.0%) |
| 2 Unit Apartments | 0 (0.0%) | 0 (0.0%) |
| 3 or 4 Unit Apartments | 14 (77.8%) | 4 (22.2%) |
| 5 to 9 Unit Apartments | 0 (0.0%) | 0 (0.0%) |
| 10 or more Apartments | 0 (0.0%) | 17 (100.0%) |
| Mobile Home / Other | 0 (0.0%) | 0 (0.0%) |
| Total | 124 (77.5%) | 36 (22.5%) |
Housing Structures by Number of Rooms in Rochester
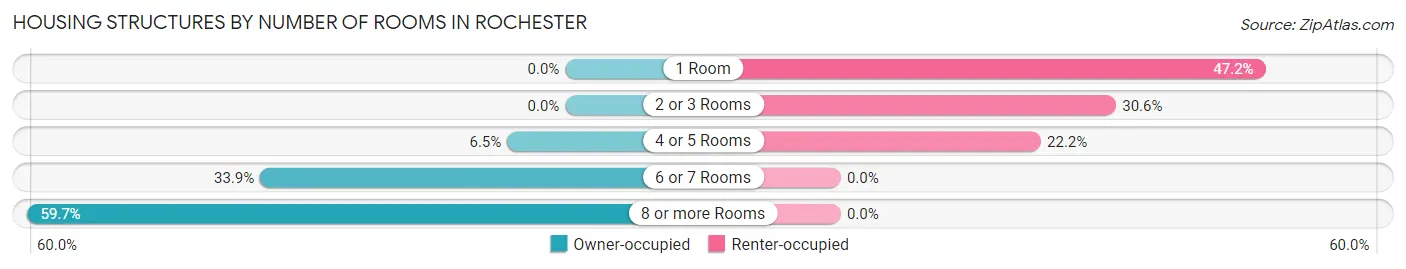
| Number of Rooms | Owner-occupied | Renter-occupied |
| 1 Room | 0 (0.0%) | 17 (47.2%) |
| 2 or 3 Rooms | 0 (0.0%) | 11 (30.6%) |
| 4 or 5 Rooms | 8 (6.5%) | 8 (22.2%) |
| 6 or 7 Rooms | 42 (33.9%) | 0 (0.0%) |
| 8 or more Rooms | 74 (59.7%) | 0 (0.0%) |
| Total | 124 (100.0%) | 36 (100.0%) |
Housing Structure by Heating Type in Rochester
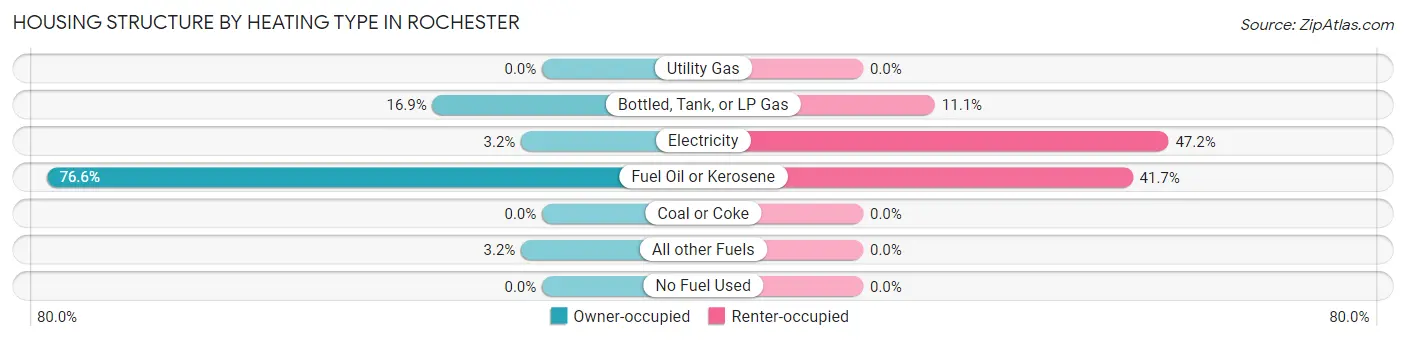
| Heating Type | Owner-occupied | Renter-occupied |
| Utility Gas | 0 (0.0%) | 0 (0.0%) |
| Bottled, Tank, or LP Gas | 21 (16.9%) | 4 (11.1%) |
| Electricity | 4 (3.2%) | 17 (47.2%) |
| Fuel Oil or Kerosene | 95 (76.6%) | 15 (41.7%) |
| Coal or Coke | 0 (0.0%) | 0 (0.0%) |
| All other Fuels | 4 (3.2%) | 0 (0.0%) |
| No Fuel Used | 0 (0.0%) | 0 (0.0%) |
| Total | 124 (100.0%) | 36 (100.0%) |
Household Vehicle Usage in Rochester
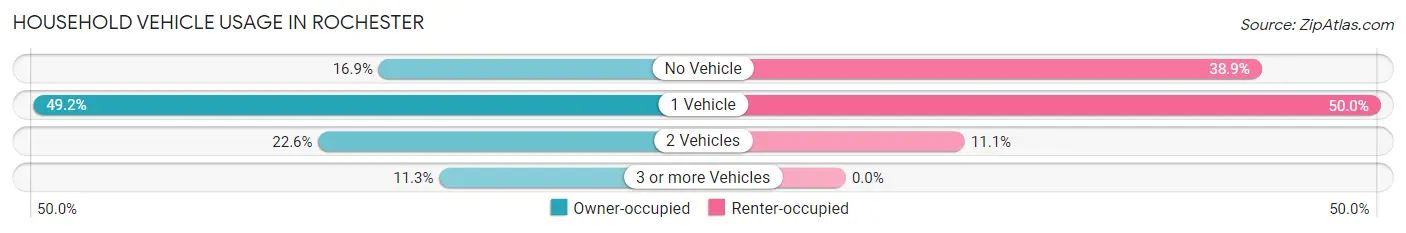
| Vehicles per Household | Owner-occupied | Renter-occupied |
| No Vehicle | 21 (16.9%) | 14 (38.9%) |
| 1 Vehicle | 61 (49.2%) | 18 (50.0%) |
| 2 Vehicles | 28 (22.6%) | 4 (11.1%) |
| 3 or more Vehicles | 14 (11.3%) | 0 (0.0%) |
| Total | 124 (100.0%) | 36 (100.0%) |
Real Estate & Mortgages in Rochester
Real Estate and Mortgage Overview in Rochester
| Characteristic | Without Mortgage | With Mortgage |
| Housing Units | 85 | 39 |
| Median Property Value | $195,200 | $227,100 |
| Median Household Income | $41,146 | $10 |
| Monthly Housing Costs | $784 | $4 |
| Real Estate Taxes | $3,738 | $0 |
Property Value by Mortgage Status in Rochester
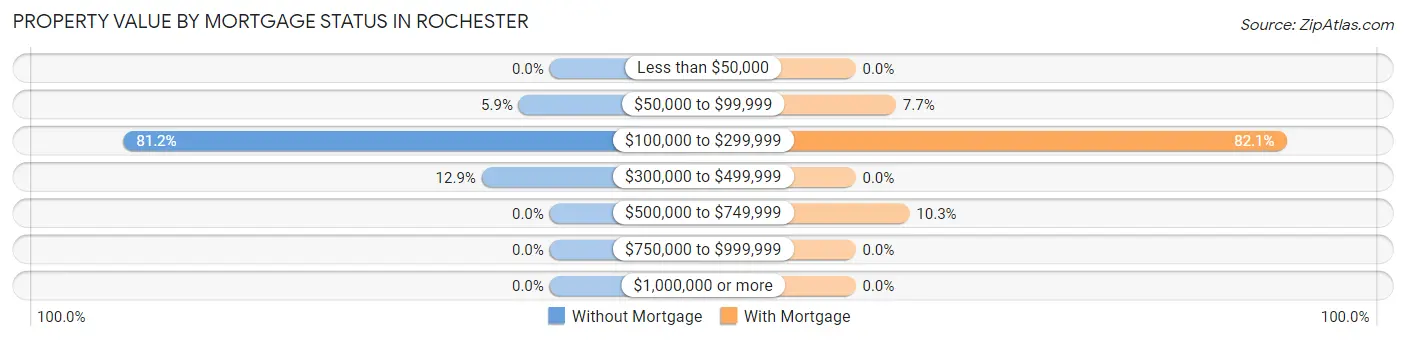
| Property Value | Without Mortgage | With Mortgage |
| Less than $50,000 | 0 (0.0%) | 0 (0.0%) |
| $50,000 to $99,999 | 5 (5.9%) | 3 (7.7%) |
| $100,000 to $299,999 | 69 (81.2%) | 32 (82.1%) |
| $300,000 to $499,999 | 11 (12.9%) | 0 (0.0%) |
| $500,000 to $749,999 | 0 (0.0%) | 4 (10.3%) |
| $750,000 to $999,999 | 0 (0.0%) | 0 (0.0%) |
| $1,000,000 or more | 0 (0.0%) | 0 (0.0%) |
| Total | 85 (100.0%) | 39 (100.0%) |
Household Income by Mortgage Status in Rochester
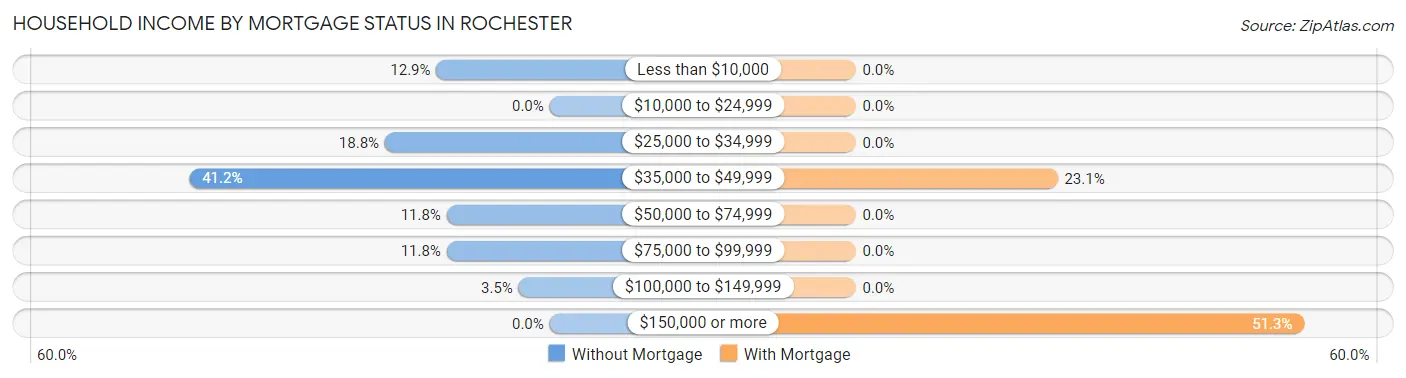
| Household Income | Without Mortgage | With Mortgage |
| Less than $10,000 | 11 (12.9%) | 0 (0.0%) |
| $10,000 to $24,999 | 0 (0.0%) | 0 (0.0%) |
| $25,000 to $34,999 | 16 (18.8%) | 0 (0.0%) |
| $35,000 to $49,999 | 35 (41.2%) | 9 (23.1%) |
| $50,000 to $74,999 | 10 (11.8%) | 0 (0.0%) |
| $75,000 to $99,999 | 10 (11.8%) | 0 (0.0%) |
| $100,000 to $149,999 | 3 (3.5%) | 0 (0.0%) |
| $150,000 or more | 0 (0.0%) | 20 (51.3%) |
| Total | 85 (100.0%) | 39 (100.0%) |
Property Value to Household Income Ratio in Rochester
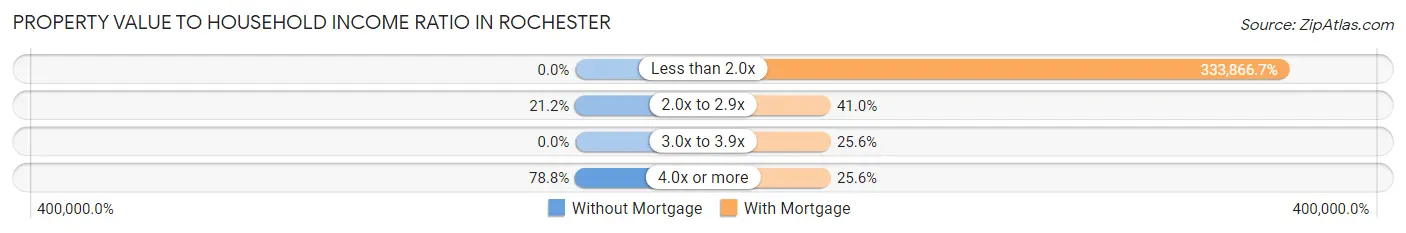
| Value-to-Income Ratio | Without Mortgage | With Mortgage |
| Less than 2.0x | 0 (0.0%) | 130,208 (333,866.7%) |
| 2.0x to 2.9x | 18 (21.2%) | 16 (41.0%) |
| 3.0x to 3.9x | 0 (0.0%) | 10 (25.6%) |
| 4.0x or more | 67 (78.8%) | 10 (25.6%) |
| Total | 85 (100.0%) | 39 (100.0%) |
Real Estate Taxes by Mortgage Status in Rochester
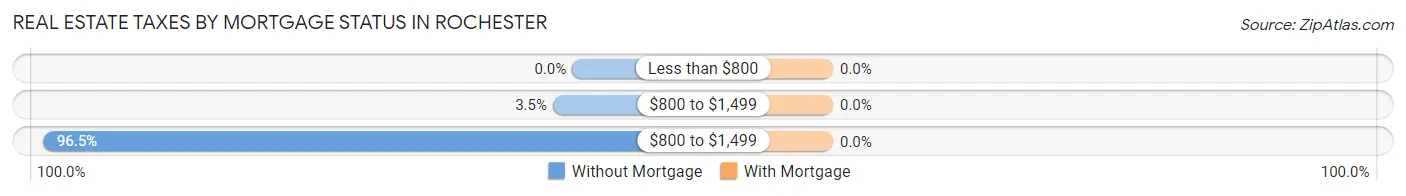
| Property Taxes | Without Mortgage | With Mortgage |
| Less than $800 | 0 (0.0%) | 0 (0.0%) |
| $800 to $1,499 | 3 (3.5%) | 0 (0.0%) |
| $800 to $1,499 | 82 (96.5%) | 0 (0.0%) |
| Total | 85 (100.0%) | 39 (100.0%) |
Health & Disability in Rochester
Health Insurance Coverage by Age in Rochester
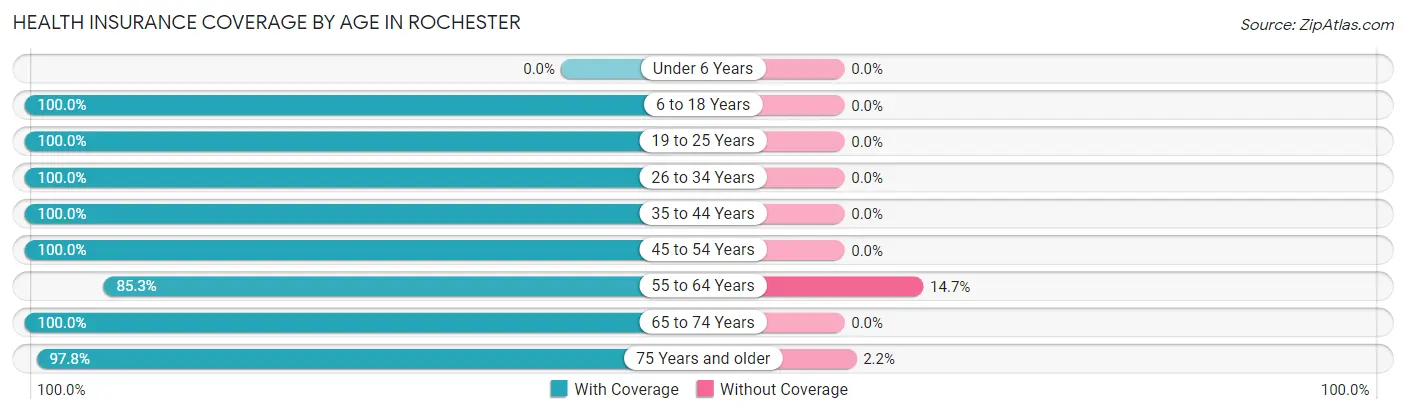
| Age Bracket | With Coverage | Without Coverage |
| Under 6 Years | 0 (0.0%) | 0 (0.0%) |
| 6 to 18 Years | 31 (100.0%) | 0 (0.0%) |
| 19 to 25 Years | 13 (100.0%) | 0 (0.0%) |
| 26 to 34 Years | 18 (100.0%) | 0 (0.0%) |
| 35 to 44 Years | 31 (100.0%) | 0 (0.0%) |
| 45 to 54 Years | 23 (100.0%) | 0 (0.0%) |
| 55 to 64 Years | 29 (85.3%) | 5 (14.7%) |
| 65 to 74 Years | 56 (100.0%) | 0 (0.0%) |
| 75 Years and older | 88 (97.8%) | 2 (2.2%) |
| Total | 289 (97.6%) | 7 (2.4%) |
Health Insurance Coverage by Citizenship Status in Rochester
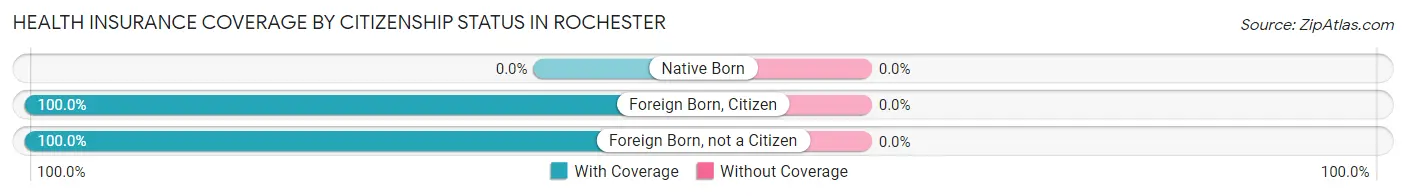
| Citizenship Status | With Coverage | Without Coverage |
| Native Born | 0 (0.0%) | 0 (0.0%) |
| Foreign Born, Citizen | 31 (100.0%) | 0 (0.0%) |
| Foreign Born, not a Citizen | 13 (100.0%) | 0 (0.0%) |
Health Insurance Coverage by Household Income in Rochester
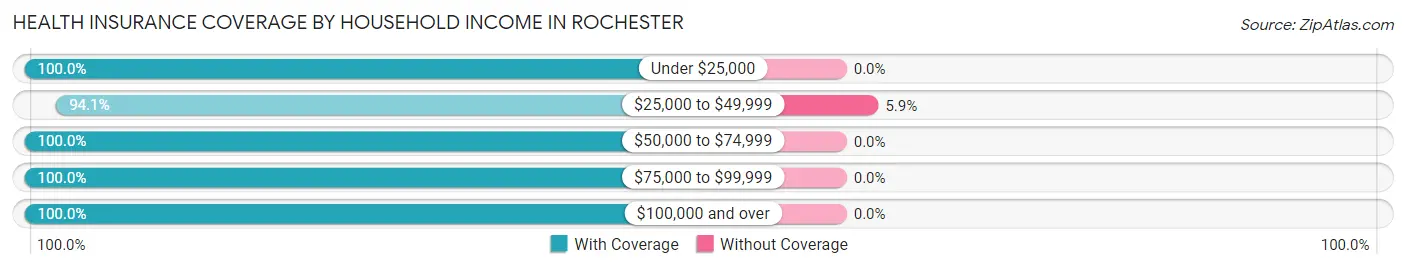
| Household Income | With Coverage | Without Coverage |
| Under $25,000 | 25 (100.0%) | 0 (0.0%) |
| $25,000 to $49,999 | 111 (94.1%) | 7 (5.9%) |
| $50,000 to $74,999 | 16 (100.0%) | 0 (0.0%) |
| $75,000 to $99,999 | 31 (100.0%) | 0 (0.0%) |
| $100,000 and over | 93 (100.0%) | 0 (0.0%) |
Public vs Private Health Insurance Coverage by Age in Rochester
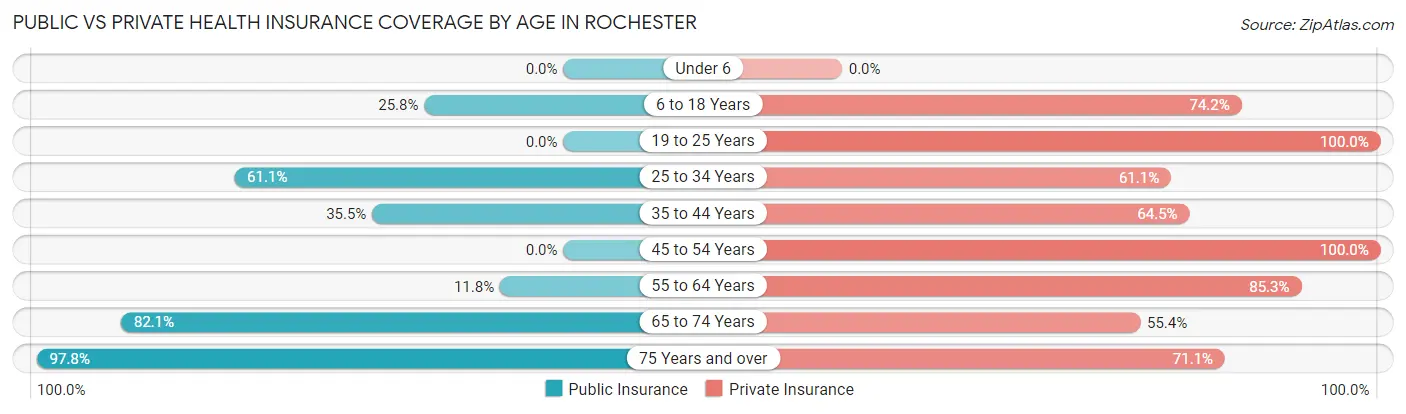
| Age Bracket | Public Insurance | Private Insurance |
| Under 6 | 0 (0.0%) | 0 (0.0%) |
| 6 to 18 Years | 8 (25.8%) | 23 (74.2%) |
| 19 to 25 Years | 0 (0.0%) | 13 (100.0%) |
| 25 to 34 Years | 11 (61.1%) | 11 (61.1%) |
| 35 to 44 Years | 11 (35.5%) | 20 (64.5%) |
| 45 to 54 Years | 0 (0.0%) | 23 (100.0%) |
| 55 to 64 Years | 4 (11.8%) | 29 (85.3%) |
| 65 to 74 Years | 46 (82.1%) | 31 (55.4%) |
| 75 Years and over | 88 (97.8%) | 64 (71.1%) |
| Total | 168 (56.8%) | 214 (72.3%) |
Disability Status by Sex by Age in Rochester
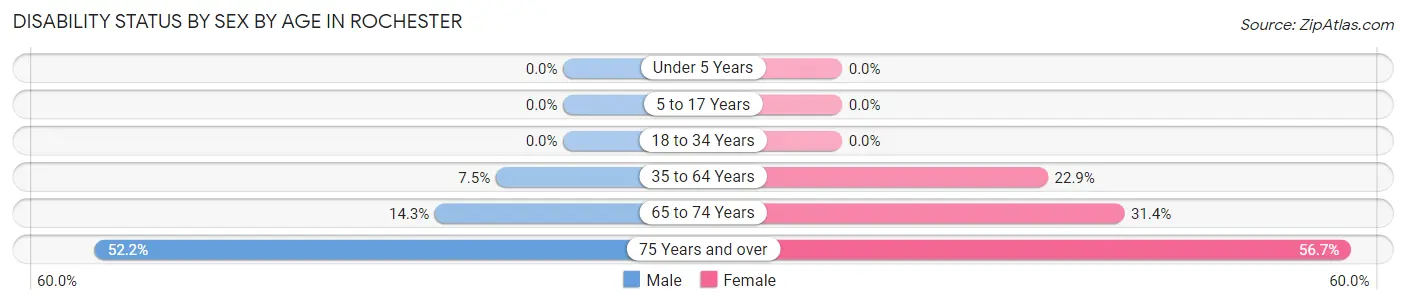
| Age Bracket | Male | Female |
| Under 5 Years | 0 (0.0%) | 0 (0.0%) |
| 5 to 17 Years | 0 (0.0%) | 0 (0.0%) |
| 18 to 34 Years | 0 (0.0%) | 0 (0.0%) |
| 35 to 64 Years | 3 (7.5%) | 11 (22.9%) |
| 65 to 74 Years | 3 (14.3%) | 11 (31.4%) |
| 75 Years and over | 12 (52.2%) | 38 (56.7%) |
Disability Class by Sex by Age in Rochester
Disability Class: Hearing Difficulty
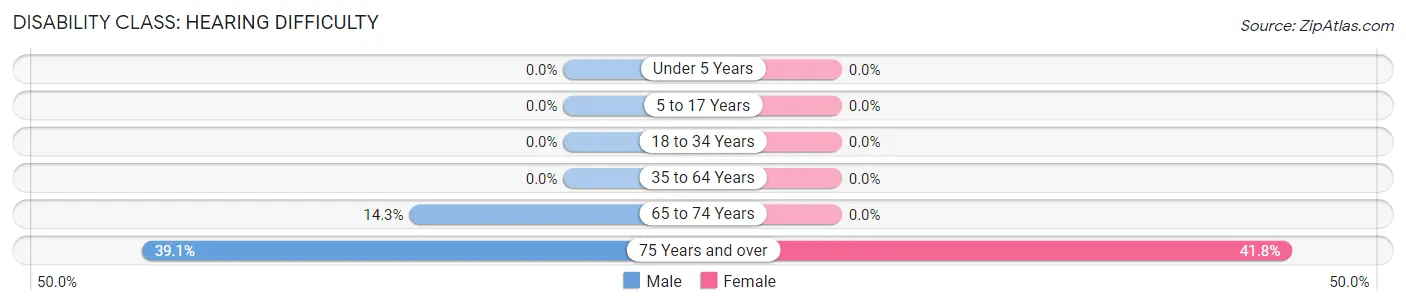
| Age Bracket | Male | Female |
| Under 5 Years | 0 (0.0%) | 0 (0.0%) |
| 5 to 17 Years | 0 (0.0%) | 0 (0.0%) |
| 18 to 34 Years | 0 (0.0%) | 0 (0.0%) |
| 35 to 64 Years | 0 (0.0%) | 0 (0.0%) |
| 65 to 74 Years | 3 (14.3%) | 0 (0.0%) |
| 75 Years and over | 9 (39.1%) | 28 (41.8%) |
Disability Class: Vision Difficulty
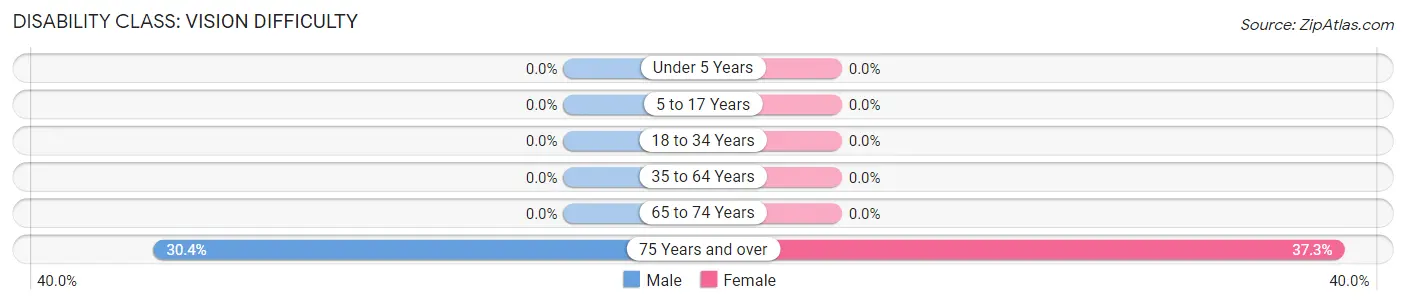
| Age Bracket | Male | Female |
| Under 5 Years | 0 (0.0%) | 0 (0.0%) |
| 5 to 17 Years | 0 (0.0%) | 0 (0.0%) |
| 18 to 34 Years | 0 (0.0%) | 0 (0.0%) |
| 35 to 64 Years | 0 (0.0%) | 0 (0.0%) |
| 65 to 74 Years | 0 (0.0%) | 0 (0.0%) |
| 75 Years and over | 7 (30.4%) | 25 (37.3%) |
Disability Class: Cognitive Difficulty
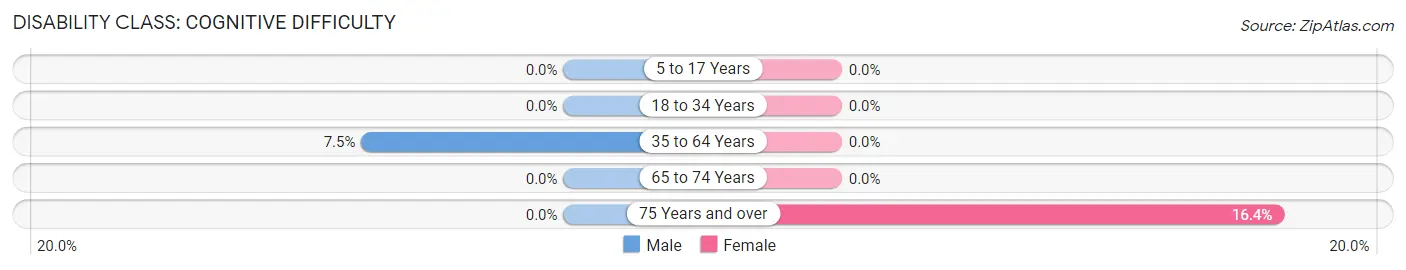
| Age Bracket | Male | Female |
| 5 to 17 Years | 0 (0.0%) | 0 (0.0%) |
| 18 to 34 Years | 0 (0.0%) | 0 (0.0%) |
| 35 to 64 Years | 3 (7.5%) | 0 (0.0%) |
| 65 to 74 Years | 0 (0.0%) | 0 (0.0%) |
| 75 Years and over | 0 (0.0%) | 11 (16.4%) |
Disability Class: Ambulatory Difficulty
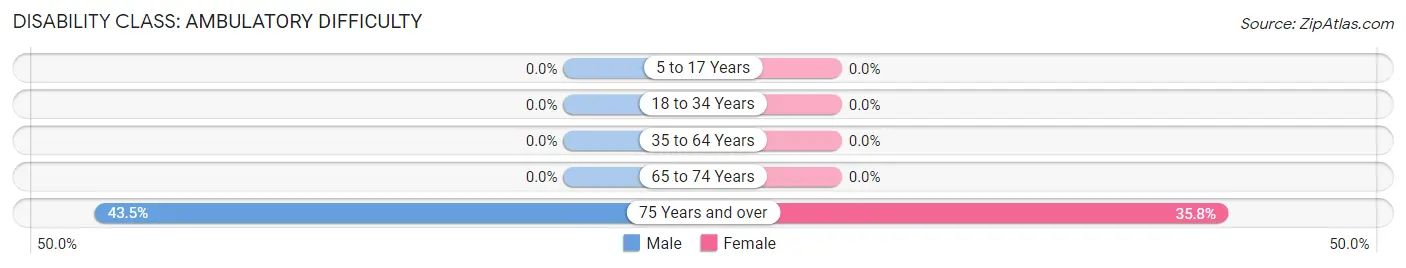
| Age Bracket | Male | Female |
| 5 to 17 Years | 0 (0.0%) | 0 (0.0%) |
| 18 to 34 Years | 0 (0.0%) | 0 (0.0%) |
| 35 to 64 Years | 0 (0.0%) | 0 (0.0%) |
| 65 to 74 Years | 0 (0.0%) | 0 (0.0%) |
| 75 Years and over | 10 (43.5%) | 24 (35.8%) |
Disability Class: Self-Care Difficulty
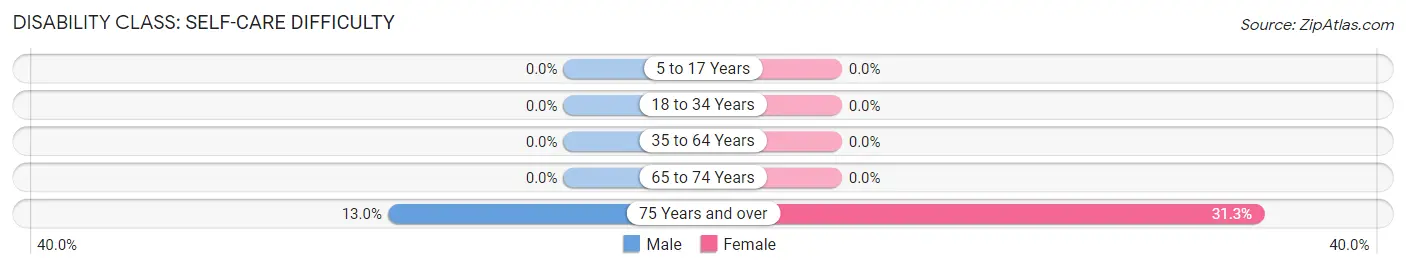
| Age Bracket | Male | Female |
| 5 to 17 Years | 0 (0.0%) | 0 (0.0%) |
| 18 to 34 Years | 0 (0.0%) | 0 (0.0%) |
| 35 to 64 Years | 0 (0.0%) | 0 (0.0%) |
| 65 to 74 Years | 0 (0.0%) | 0 (0.0%) |
| 75 Years and over | 3 (13.0%) | 21 (31.3%) |
Technology Access in Rochester
Computing Device Access in Rochester
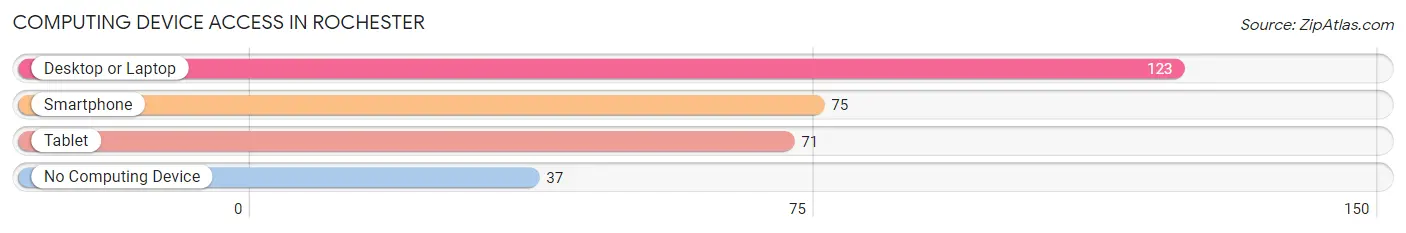
| Device Type | # Households | % Households |
| Desktop or Laptop | 123 | 76.9% |
| Smartphone | 75 | 46.9% |
| Tablet | 71 | 44.4% |
| No Computing Device | 37 | 23.1% |
| Total | 160 | 100.0% |
Internet Access in Rochester
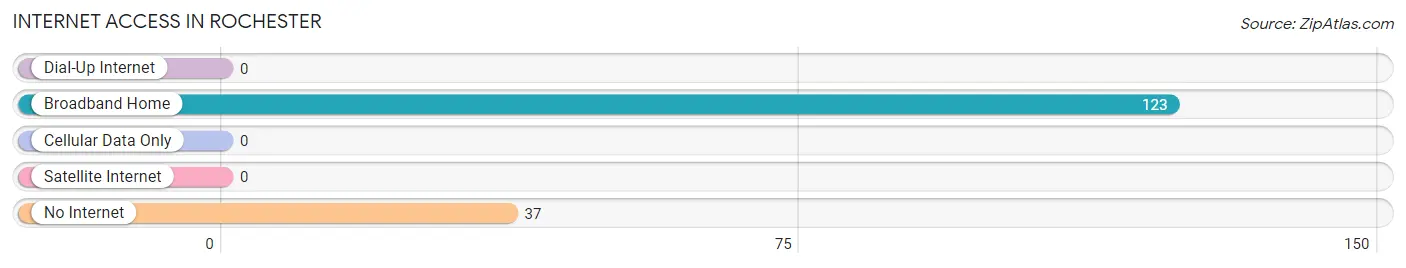
| Internet Type | # Households | % Households |
| Dial-Up Internet | 0 | 0.0% |
| Broadband Home | 123 | 76.9% |
| Cellular Data Only | 0 | 0.0% |
| Satellite Internet | 0 | 0.0% |
| No Internet | 37 | 23.1% |
| Total | 160 | 100.0% |
Rochester Summary
Rochester, Vermont is a small town located in the heart of the Green Mountains in the state of Vermont. It is a rural community with a population of just over 1,000 people. The town is located in Windsor County and is part of the White River Valley region.
History
Rochester was first settled in 1780 by a group of settlers from Massachusetts. The town was named after Rochester, Massachusetts, which was the hometown of the settlers. The town was incorporated in 1781 and was the first town in Windsor County to be incorporated.
The town was originally an agricultural community, with the main crops being wheat, corn, and potatoes. The town also had a sawmill, gristmill, and a blacksmith shop. In the late 1800s, the town began to grow and develop as a tourist destination. The town was known for its beautiful scenery and was a popular destination for outdoor activities such as fishing, hunting, and skiing.
Geography
Rochester is located in the White River Valley region of Vermont. The town is situated in the Green Mountains and is surrounded by mountains and forests. The town is located on the banks of the White River, which is a tributary of the Connecticut River. The town is located about 25 miles from the state capital of Montpelier.
The town has a total area of 8.2 square miles, all of which is land. The town is located at an elevation of 1,000 feet above sea level. The town has a humid continental climate, with cold winters and warm summers.
Economy
Rochester’s economy is largely based on tourism and agriculture. The town is a popular destination for outdoor activities such as fishing, hunting, and skiing. The town also has a number of small businesses, including restaurants, shops, and lodging.
The town is also home to a number of small farms, which produce a variety of crops, including corn, potatoes, and hay. The town also has a number of small manufacturing businesses, which produce a variety of products, including furniture, clothing, and wood products.
Demographics
As of the 2010 census, the town had a population of 1,037 people. The racial makeup of the town was 97.3% White, 0.4% African American, 0.2% Native American, 0.2% Asian, 0.1% Pacific Islander, 0.6% from other races, and 1.2% from two or more races. Hispanic or Latino of any race were 1.2% of the population.
The median income for a household in the town was $41,250, and the median income for a family was $50,000. The per capita income for the town was $20,945. About 8.3% of families and 11.2% of the population were below the poverty line, including 14.3% of those under age 18 and 8.3% of those age 65 or over.
Rochester is a small town with a rich history and a vibrant economy. The town is a popular destination for outdoor activities and is home to a number of small businesses and farms. The town has a diverse population and a strong sense of community.
Common Questions
What is the Total Population of Rochester?
Total Population of Rochester is 296.
What is the Total Male Population of Rochester?
Total Male Population of Rochester is 116.
What is the Total Female Population of Rochester?
Total Female Population of Rochester is 180.
What is the Ratio of Males per 100 Females in Rochester?
There are 64.44 Males per 100 Females in Rochester.
What is the Ratio of Females per 100 Males in Rochester?
There are 155.17 Females per 100 Males in Rochester.
What is the Median Population Age in Rochester?
Median Population Age in Rochester is 64.6 Years.
What is the Average Family Size in Rochester
Average Family Size in Rochester is 2.9 People.
What is the Average Household Size in Rochester
Average Household Size in Rochester is 1.8 People.
What is Per Capita Income in Rochester?
Per Capita income in Rochester is $32,995.
What is the Median Family Income in Rochester?
Median Family Income in Rochester is $120,125.
What is the Median Household income in Rochester?
Median Household Income in Rochester is $41,250.
What is Income or Wage Gap in Rochester?
Income or Wage Gap in Rochester is 26.7%.
Women in Rochester earn 73.3 cents for every dollar earned by a man.
What is Inequality or Gini Index in Rochester?
Inequality or Gini Index in Rochester is 0.41.
How Large is the Labor Force in Rochester?
There are 106 People in the Labor Forcein in Rochester.
What is the Percentage of People in the Labor Force in Rochester?
38.7% of People are in the Labor Force in Rochester.
What is the Unemployment Rate in Rochester?
Unemployment Rate in Rochester is 2.8%.