Immigrants from Japan vs Immigrants from Costa Rica 4 or more Vehicles in Household

COMPARE

Immigrants from Japan
Race
Ancestry
AfghanAfricanAlaska NativeAlaskan AthabascanAlbanianAleutAlsatianAmericanApacheArabArapahoArgentineanArmenianAssyrian/Chaldean/SyriacAustralianAustrianBahamianBangladeshiBarbadianBasqueBelgianBelizeanBermudanBhutaneseBlackfeetBolivianBrazilianBritishBritish West IndianBulgarianBurmeseCajunCambodianCanadianCape VerdeanCarpatho RusynCelticCentral AmericanCentral American IndianCherokeeCheyenneChickasawChileanChineseChippewaChoctawColombianColvilleComancheCosta RicanCreeCreekCroatianCrowCubanCypriotCzechCzechoslovakianDanishDelawareDominicanDutchDutch West IndianEastern EuropeanEcuadorianEgyptianEnglishEstonianEthiopianEuropeanFijianFilipinoFinnishFrenchFrench American IndianFrench CanadianGermanGerman RussianGhanaianGreekGuamanian/ChamorroGuatemalanGuyaneseHaitianHmongHonduranHopiHoumaHungarianIcelanderIndian (Asian)IndonesianInupiatIranianIraqiIrishIroquoisIsraeliItalianJamaicanJapaneseJordanianKenyanKiowaKoreanLaotianLatvianLebaneseLiberianLithuanianLumbeeLuxembourgerMacedonianMalaysianMalteseMarshalleseMenomineeMexicanMexican American IndianMongolianMoroccanNative HawaiianNavajoNepaleseNew ZealanderNicaraguanNigerianNorthern EuropeanNorwegianOkinawanOsageOttawaPaiutePakistaniPalestinianPanamanianParaguayanPennsylvania GermanPeruvianPimaPolishPortuguesePotawatomiPuebloPuerto RicanPuget Sound SalishRomanianRussianSalvadoranSamoanScandinavianScotch-IrishScottishSeminoleSenegaleseSerbianShoshoneSierra LeoneanSiouxSlavicSlovakSloveneSomaliSouth AfricanSouth AmericanSouth American IndianSoviet UnionSpaniardSpanishSpanish AmericanSpanish American IndianSri LankanSubsaharan AfricanSudaneseSwedishSwissSyrianTaiwaneseThaiTlingit-HaidaTohono O'OdhamTonganTrinidadian and TobagonianTsimshianTurkishU.S. Virgin IslanderUgandanUkrainianUruguayanUteVenezuelanVietnameseWelshWest IndianYakamaYaquiYugoslavianYumanYup'ikZimbabwean
Immigration
NonimmigrantsImmigrantsAfghanistanAfricaAlbaniaArgentinaArmeniaAsiaAustraliaAustriaBahamasBangladeshBarbadosBelarusBelgiumBelizeBoliviaBosnia and HerzegovinaBrazilBulgariaBurma/MyanmarCabo VerdeCambodiaCameroonCanadaCaribbeanCentral AmericaChileChinaColombiaCongoCroatiaCubaCzechoslovakiaDenmarkDominicaDominican RepublicEastern AfricaEastern AsiaEastern EuropeEcuadorEgyptEl SalvadorEnglandEritreaEthiopiaEuropeFijiFranceGermanyGhanaGreeceGrenadaGuatemalaGuyanaHaitiHondurasHong KongHungaryIndiaIndonesiaIranIraqIrelandIsraelItalyJamaicaJapanJordanKazakhstanKenyaKoreaKuwaitLaosLatin AmericaLatviaLebanonLiberiaLithuaniaMalaysiaMexicoMicronesiaMiddle AfricaMoldovaMoroccoNepalNetherlandsNicaraguaNigeriaNorth AmericaNorth MacedoniaNorthern AfricaNorthern EuropeNorwayOceaniaPakistanPanamaPeruPhilippinesPolandPortugalRomaniaRussiaSaudi ArabiaScotlandSenegalSerbiaSierra LeoneSingaporeSomaliaSouth AfricaSouth AmericaSouth Central AsiaSouth Eastern AsiaSouthern EuropeSpainSri LankaSt. Vincent and the GrenadinesSudanSwedenSwitzerlandSyriaTaiwanThailandTrinidad and TobagoTurkeyUgandaUkraineUruguayUzbekistanVenezuelaVietnamWest IndiesWestern AfricaWestern AsiaWestern EuropeYemenZaireZimbabweAzores
Immigrants from Costa Rica
Race
Ancestry
AfghanAfricanAlaska NativeAlaskan AthabascanAlbanianAleutAlsatianAmericanApacheArabArapahoArgentineanArmenianAssyrian/Chaldean/SyriacAustralianAustrianBahamianBangladeshiBarbadianBasqueBelgianBelizeanBermudanBhutaneseBlackfeetBolivianBrazilianBritishBritish West IndianBulgarianBurmeseCajunCambodianCanadianCape VerdeanCarpatho RusynCelticCentral AmericanCentral American IndianCherokeeCheyenneChickasawChileanChineseChippewaChoctawColombianColvilleComancheCosta RicanCreeCreekCroatianCrowCubanCypriotCzechCzechoslovakianDanishDelawareDominicanDutchDutch West IndianEastern EuropeanEcuadorianEgyptianEnglishEstonianEthiopianEuropeanFijianFilipinoFinnishFrenchFrench American IndianFrench CanadianGermanGerman RussianGhanaianGreekGuamanian/ChamorroGuatemalanGuyaneseHaitianHmongHonduranHopiHoumaHungarianIcelanderIndian (Asian)IndonesianInupiatIranianIraqiIrishIroquoisIsraeliItalianJamaicanJapaneseJordanianKenyanKiowaKoreanLaotianLatvianLebaneseLiberianLithuanianLumbeeLuxembourgerMacedonianMalaysianMalteseMarshalleseMenomineeMexicanMexican American IndianMongolianMoroccanNative HawaiianNavajoNepaleseNew ZealanderNicaraguanNigerianNorthern EuropeanNorwegianOkinawanOsageOttawaPaiutePakistaniPalestinianPanamanianParaguayanPennsylvania GermanPeruvianPimaPolishPortuguesePotawatomiPuebloPuerto RicanPuget Sound SalishRomanianRussianSalvadoranSamoanScandinavianScotch-IrishScottishSeminoleSenegaleseSerbianShoshoneSierra LeoneanSiouxSlavicSlovakSloveneSomaliSouth AfricanSouth AmericanSouth American IndianSoviet UnionSpaniardSpanishSpanish AmericanSpanish American IndianSri LankanSubsaharan AfricanSudaneseSwedishSwissSyrianTaiwaneseThaiTlingit-HaidaTohono O'OdhamTonganTrinidadian and TobagonianTsimshianTurkishU.S. Virgin IslanderUgandanUkrainianUruguayanUteVenezuelanVietnameseWelshWest IndianYakamaYaquiYugoslavianYumanYup'ikZimbabwean
Immigration
NonimmigrantsImmigrantsAfghanistanAfricaAlbaniaArgentinaArmeniaAsiaAustraliaAustriaBahamasBangladeshBarbadosBelarusBelgiumBelizeBoliviaBosnia and HerzegovinaBrazilBulgariaBurma/MyanmarCabo VerdeCambodiaCameroonCanadaCaribbeanCentral AmericaChileChinaColombiaCongoCosta RicaCroatiaCubaCzechoslovakiaDenmarkDominicaDominican RepublicEastern AfricaEastern AsiaEastern EuropeEcuadorEgyptEl SalvadorEnglandEritreaEthiopiaEuropeFijiFranceGermanyGhanaGreeceGrenadaGuatemalaGuyanaHaitiHondurasHong KongHungaryIndiaIndonesiaIranIraqIrelandIsraelItalyJamaicaJordanKazakhstanKenyaKoreaKuwaitLaosLatin AmericaLatviaLebanonLiberiaLithuaniaMalaysiaMexicoMicronesiaMiddle AfricaMoldovaMoroccoNepalNetherlandsNicaraguaNigeriaNorth AmericaNorth MacedoniaNorthern AfricaNorthern EuropeNorwayOceaniaPakistanPanamaPeruPhilippinesPolandPortugalRomaniaRussiaSaudi ArabiaScotlandSenegalSerbiaSierra LeoneSingaporeSomaliaSouth AfricaSouth AmericaSouth Central AsiaSouth Eastern AsiaSouthern EuropeSpainSri LankaSt. Vincent and the GrenadinesSudanSwedenSwitzerlandSyriaTaiwanThailandTrinidad and TobagoTurkeyUgandaUkraineUruguayUzbekistanVenezuelaVietnamWest IndiesWestern AfricaWestern AsiaWestern EuropeYemenZaireZimbabweAzores
4 or more Vehicles in Household
Income
Poverty
Unemployment
Labor Participation
Family Structure
Vehicle Availability
Education Level
Disability

4 or more Vehicles in Household Comparison

Immigrants from Japan

Immigrants from Costa Rica

Average
Good
6.3%
4 OR MORE VEHICLES IN HOUSEHOLD
43.1/ 100
METRIC RATING
179th/ 347
METRIC RANK
6.5%
4 OR MORE VEHICLES IN HOUSEHOLD
74.4/ 100
METRIC RATING
146th/ 347
METRIC RANK

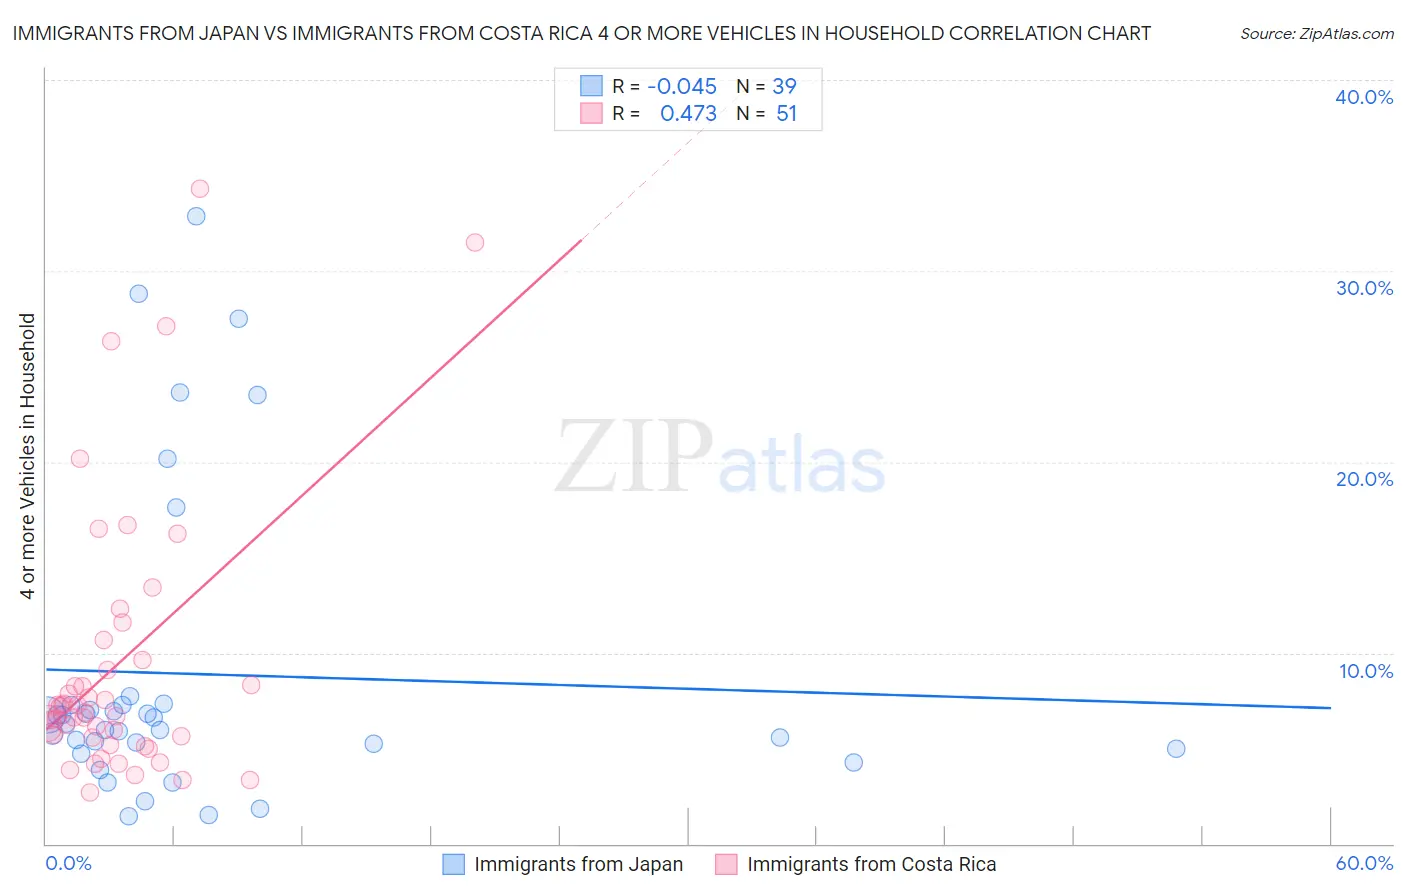
Immigrants from Japan vs Immigrants from Costa Rica 4 or more Vehicles in Household Correlation Chart

The statistical analysis conducted on geographies consisting of 338,505,499 people shows no correlation between the proportion of Immigrants from Japan and percentage of households with 4 or more vehicles available in the United States with a correlation coefficient (R) of -0.045 and weighted average of 6.3%. Similarly, the statistical analysis conducted on geographies consisting of 203,475,365 people shows a moderate positive correlation between the proportion of Immigrants from Costa Rica and percentage of households with 4 or more vehicles available in the United States with a correlation coefficient (R) of 0.473 and weighted average of 6.5%, a difference of 3.4%.
Immigrants from Japan vs Immigrants from Costa Rica 4 or more Vehicles in Household

4 or more Vehicles in Household Correlation Summary

MeasurementImmigrants from JapanImmigrants from Costa Rica
Minimum1.5%2.7%
Maximum32.8%34.3%
Range31.4%31.6%
Mean8.9%9.4%
Median6.3%6.9%
Interquartile 25% (IQ1)5.0%5.6%
Interquartile 75% (IQ3)7.3%9.6%
Interquartile Range (IQR)2.3%4.1%
Standard Deviation (Sample)8.0%7.1%
Standard Deviation (Population)7.9%7.0%

Similar Demographics by 4 or more Vehicles in Household

Demographics Similar to Immigrants from Japan by 4 or more Vehicles in Household

In terms of 4 or more vehicles in household, the demographic groups most similar to Immigrants from Japan are Syrian (6.3%, a difference of 0.11%), Belizean (6.3%, a difference of 0.15%), Yugoslavian (6.3%, a difference of 0.20%), South American Indian (6.3%, a difference of 0.25%), and Slovak (6.3%, a difference of 0.39%).
DemographicsRating | Rank4 or more Vehicles in Household
Immigrants | Lebanon
51.7
/100
|
#172
Average
6.3%
Slovenes
51.1
/100
|
#173
Average
6.3%
Lithuanians
50.0
/100
|
#174
Average
6.3%
Immigrants | Western Europe
48.8
/100
|
#175
Average
6.3%
Ukrainians
47.6
/100
|
#176
Average
6.3%
Slovaks
46.9
/100
|
#177
Average
6.3%
Belizeans
44.5
/100
|
#178
Average
6.3%
Immigrants | Japan
43.1
/100
|
#179
Average
6.3%
Syrians
42.0
/100
|
#180
Average
6.3%
Yugoslavians
41.1
/100
|
#181
Average
6.3%
South American Indians
40.7
/100
|
#182
Average
6.3%
Immigrants | Burma/Myanmar
37.5
/100
|
#183
Fair
6.2%
Iraqis
37.3
/100
|
#184
Fair
6.2%
Thais
36.9
/100
|
#185
Fair
6.2%
Immigrants | Northern Europe
36.8
/100
|
#186
Fair
6.2%

Demographics Similar to Immigrants from Costa Rica by 4 or more Vehicles in Household

In terms of 4 or more vehicles in household, the demographic groups most similar to Immigrants from Costa Rica are Immigrants from Iran (6.5%, a difference of 0.050%), Immigrants from Jordan (6.5%, a difference of 0.090%), Greek (6.5%, a difference of 0.090%), New Zealander (6.5%, a difference of 0.13%), and Immigrants from Hong Kong (6.5%, a difference of 0.27%).
DemographicsRating | Rank4 or more Vehicles in Household
Jordanians
82.1
/100
|
#139
Excellent
6.6%
Slavs
81.6
/100
|
#140
Excellent
6.6%
Australians
80.8
/100
|
#141
Excellent
6.6%
Immigrants | Iraq
79.4
/100
|
#142
Good
6.5%
Immigrants | Canada
78.6
/100
|
#143
Good
6.5%
Immigrants | North America
78.5
/100
|
#144
Good
6.5%
Croatians
77.8
/100
|
#145
Good
6.5%
Immigrants | Costa Rica
74.4
/100
|
#146
Good
6.5%
Immigrants | Iran
73.9
/100
|
#147
Good
6.5%
Immigrants | Jordan
73.7
/100
|
#148
Good
6.5%
Greeks
73.6
/100
|
#149
Good
6.5%
New Zealanders
73.3
/100
|
#150
Good
6.5%
Immigrants | Hong Kong
72.2
/100
|
#151
Good
6.5%
Yuman
72.1
/100
|
#152
Good
6.5%
Immigrants | Armenia
71.2
/100
|
#153
Good
6.5%