Zip Codes with the Most Immigrants from Northern Africa in Houston, TX
RELATED REPORTS & OPTIONS
Northern Africa
Houston
Compare Zip Codes
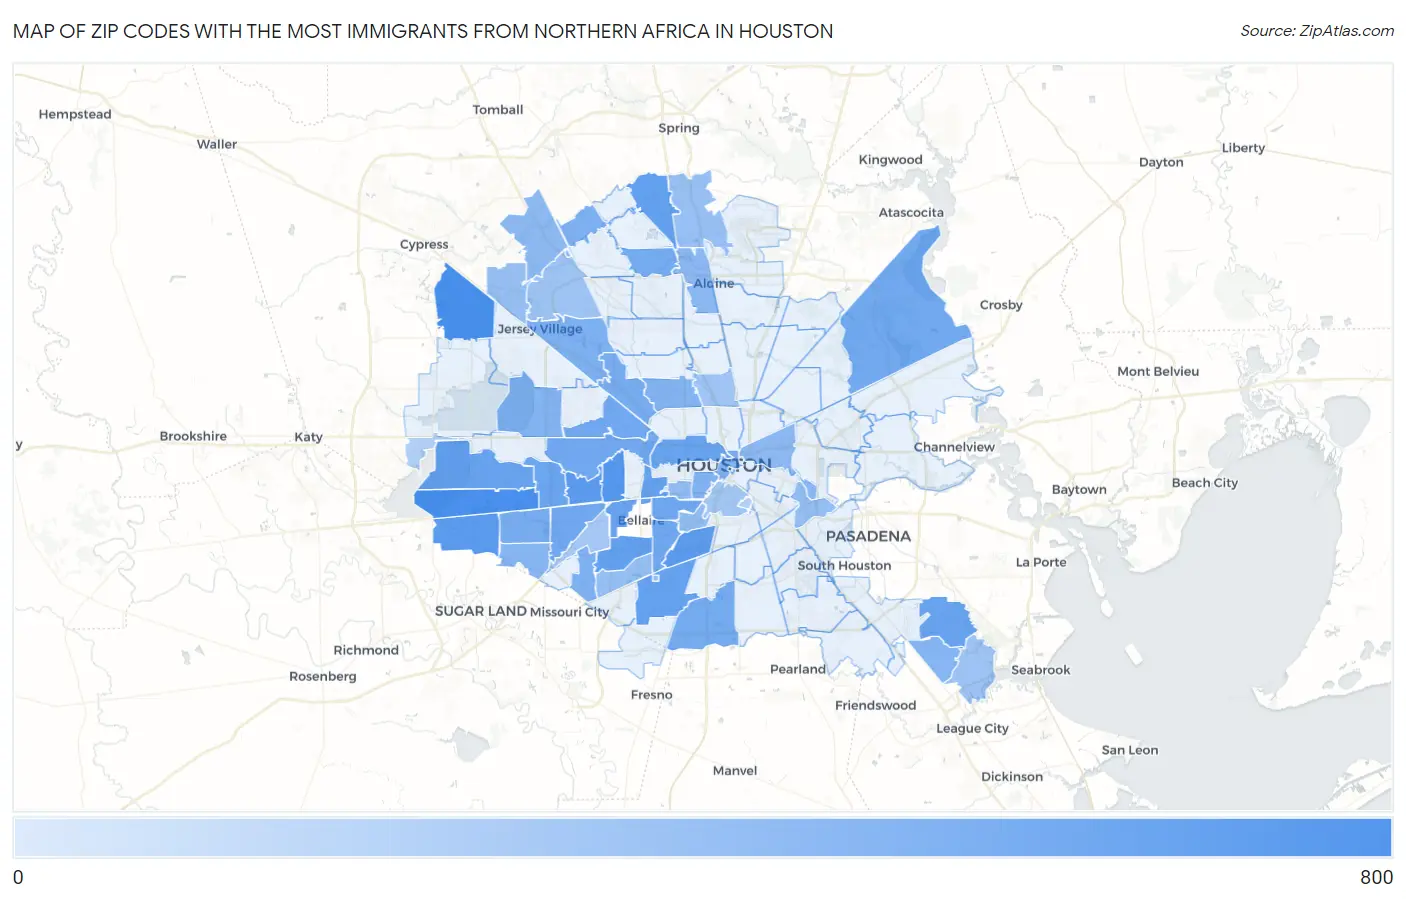
Map of Zip Codes with the Most Immigrants from Northern Africa in Houston
0
800
Zip Codes with the Most Immigrants from Northern Africa in Houston, TX
| Zip Code | Northern Africa | vs State | vs National | |
| 1. | 77095 | 707 | 30,660(2.31%)#3 | 421,832(0.17%)#43 |
| 2. | 77082 | 615 | 30,660(2.01%)#5 | 421,832(0.15%)#65 |
| 3. | 77057 | 378 | 30,660(1.23%)#14 | 421,832(0.09%)#171 |
| 4. | 77054 | 285 | 30,660(0.93%)#24 | 421,832(0.07%)#271 |
| 5. | 77083 | 273 | 30,660(0.89%)#25 | 421,832(0.06%)#285 |
| 6. | 77063 | 272 | 30,660(0.89%)#26 | 421,832(0.06%)#287 |
| 7. | 77096 | 205 | 30,660(0.67%)#39 | 421,832(0.05%)#481 |
| 8. | 77090 | 202 | 30,660(0.66%)#40 | 421,832(0.05%)#487 |
| 9. | 77045 | 194 | 30,660(0.63%)#41 | 421,832(0.05%)#518 |
| 10. | 77027 | 185 | 30,660(0.60%)#43 | 421,832(0.04%)#550 |
| 11. | 77081 | 173 | 30,660(0.56%)#47 | 421,832(0.04%)#604 |
| 12. | 77077 | 165 | 30,660(0.54%)#50 | 421,832(0.04%)#630 |
| 13. | 77059 | 165 | 30,660(0.54%)#51 | 421,832(0.04%)#635 |
| 14. | 77007 | 150 | 30,660(0.49%)#54 | 421,832(0.04%)#705 |
| 15. | 77042 | 142 | 30,660(0.46%)#60 | 421,832(0.03%)#766 |
| 16. | 77005 | 122 | 30,660(0.40%)#72 | 421,832(0.03%)#896 |
| 17. | 77036 | 119 | 30,660(0.39%)#75 | 421,832(0.03%)#925 |
| 18. | 77025 | 118 | 30,660(0.38%)#78 | 421,832(0.03%)#945 |
| 19. | 77055 | 116 | 30,660(0.38%)#82 | 421,832(0.03%)#962 |
| 20. | 77024 | 112 | 30,660(0.37%)#87 | 421,832(0.03%)#1,012 |
| 21. | 77044 | 104 | 30,660(0.34%)#91 | 421,832(0.02%)#1,092 |
| 22. | 77067 | 93 | 30,660(0.30%)#96 | 421,832(0.02%)#1,217 |
| 23. | 77047 | 90 | 30,660(0.29%)#102 | 421,832(0.02%)#1,259 |
| 24. | 77072 | 81 | 30,660(0.26%)#114 | 421,832(0.02%)#1,379 |
| 25. | 77092 | 80 | 30,660(0.26%)#117 | 421,832(0.02%)#1,401 |
| 26. | 77071 | 63 | 30,660(0.21%)#131 | 421,832(0.01%)#1,708 |
| 27. | 77040 | 62 | 30,660(0.20%)#133 | 421,832(0.01%)#1,724 |
| 28. | 77069 | 59 | 30,660(0.19%)#138 | 421,832(0.01%)#1,795 |
| 29. | 77006 | 58 | 30,660(0.19%)#143 | 421,832(0.01%)#1,827 |
| 30. | 77002 | 53 | 30,660(0.17%)#150 | 421,832(0.01%)#1,956 |
| 31. | 77018 | 51 | 30,660(0.17%)#156 | 421,832(0.01%)#2,004 |
| 32. | 77043 | 51 | 30,660(0.17%)#157 | 421,832(0.01%)#2,007 |
| 33. | 77062 | 47 | 30,660(0.15%)#163 | 421,832(0.01%)#2,131 |
| 34. | 77099 | 39 | 30,660(0.13%)#179 | 421,832(0.01%)#2,388 |
| 35. | 77020 | 35 | 30,660(0.11%)#188 | 421,832(0.01%)#2,566 |
| 36. | 77060 | 34 | 30,660(0.11%)#190 | 421,832(0.01%)#2,590 |
| 37. | 77070 | 31 | 30,660(0.10%)#198 | 421,832(0.01%)#2,744 |
| 38. | 77098 | 27 | 30,660(0.09%)#208 | 421,832(0.01%)#2,974 |
| 39. | 77030 | 24 | 30,660(0.08%)#216 | 421,832(0.01%)#3,145 |
| 40. | 77035 | 22 | 30,660(0.07%)#224 | 421,832(0.01%)#3,249 |
| 41. | 77012 | 21 | 30,660(0.07%)#229 | 421,832(0.00%)#3,311 |
| 42. | 77073 | 20 | 30,660(0.07%)#232 | 421,832(0.00%)#3,346 |
| 43. | 77065 | 20 | 30,660(0.07%)#233 | 421,832(0.00%)#3,349 |
| 44. | 77064 | 14 | 30,660(0.05%)#259 | 421,832(0.00%)#3,867 |
| 45. | 77058 | 14 | 30,660(0.05%)#264 | 421,832(0.00%)#3,914 |
| 46. | 77022 | 13 | 30,660(0.04%)#272 | 421,832(0.00%)#3,983 |
| 47. | 77004 | 11 | 30,660(0.04%)#281 | 421,832(0.00%)#4,183 |
| 48. | 77074 | 10 | 30,660(0.03%)#287 | 421,832(0.00%)#4,281 |
| 49. | 77204 | 6 | 30,660(0.02%)#305 | 421,832(0.00%)#4,819 |
| 50. | 77094 | 5 | 30,660(0.02%)#313 | 421,832(0.00%)#4,912 |
1
Common Questions
What are the Top 10 Zip Codes with the Most Immigrants from Northern Africa in Houston, TX?
Top 10 Zip Codes with the Most Immigrants from Northern Africa in Houston, TX are:
What zip code has the Most Immigrants from Northern Africa in Houston, TX?
77095 has the Most Immigrants from Northern Africa in Houston, TX with 707.
What is the Total Immigrants from Northern Africa in Houston, TX?
Total Immigrants from Northern Africa in Houston is 4,145.
What is the Total Immigrants from Northern Africa in Texas?
Total Immigrants from Northern Africa in Texas is 30,660.
What is the Total Immigrants from Northern Africa in the United States?
Total Immigrants from Northern Africa in the United States is 421,832.