Zip Codes with the Largest Guatemalan Community in Houston, TX
RELATED REPORTS & OPTIONS
Guatemalan
Houston
Compare Zip Codes
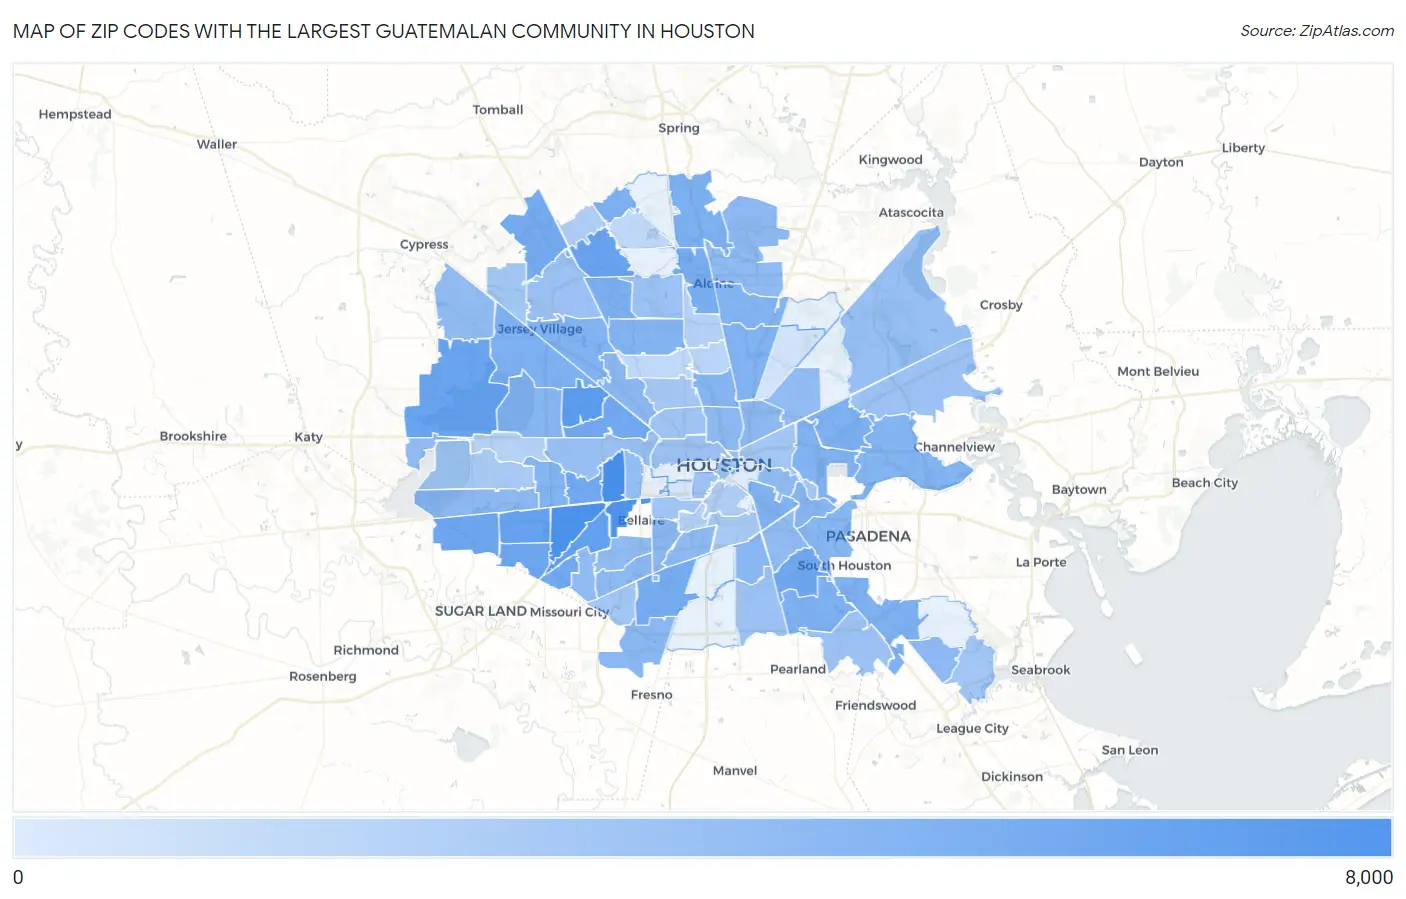
Map of Zip Codes with the Largest Guatemalan Community in Houston
0
8,000
Zip Codes with the Largest Guatemalan Community in Houston, TX
| Zip Code | Guatemalan | vs State | vs National | |
| 1. | 77057 | 7,051 | 125,510(5.62%)#1 | 1,669,094(0.42%)#10 |
| 2. | 77036 | 5,680 | 125,510(4.53%)#2 | 1,669,094(0.34%)#15 |
| 3. | 77081 | 4,575 | 125,510(3.65%)#3 | 1,669,094(0.27%)#20 |
| 4. | 77080 | 2,738 | 125,510(2.18%)#4 | 1,669,094(0.16%)#68 |
| 5. | 77074 | 1,753 | 125,510(1.40%)#6 | 1,669,094(0.11%)#134 |
| 6. | 77072 | 1,513 | 125,510(1.21%)#10 | 1,669,094(0.09%)#176 |
| 7. | 77066 | 1,460 | 125,510(1.16%)#11 | 1,669,094(0.09%)#185 |
| 8. | 77084 | 1,272 | 125,510(1.01%)#12 | 1,669,094(0.08%)#241 |
| 9. | 77083 | 1,029 | 125,510(0.82%)#17 | 1,669,094(0.06%)#323 |
| 10. | 77099 | 1,018 | 125,510(0.81%)#18 | 1,669,094(0.06%)#329 |
| 11. | 77055 | 938 | 125,510(0.75%)#19 | 1,669,094(0.06%)#348 |
| 12. | 77061 | 872 | 125,510(0.69%)#22 | 1,669,094(0.05%)#383 |
| 13. | 77063 | 865 | 125,510(0.69%)#23 | 1,669,094(0.05%)#390 |
| 14. | 77031 | 804 | 125,510(0.64%)#26 | 1,669,094(0.05%)#423 |
| 15. | 77045 | 706 | 125,510(0.56%)#33 | 1,669,094(0.04%)#498 |
| 16. | 77070 | 680 | 125,510(0.54%)#34 | 1,669,094(0.04%)#519 |
| 17. | 77060 | 629 | 125,510(0.50%)#37 | 1,669,094(0.04%)#580 |
| 18. | 77073 | 496 | 125,510(0.40%)#54 | 1,669,094(0.03%)#746 |
| 19. | 77086 | 495 | 125,510(0.39%)#55 | 1,669,094(0.03%)#748 |
| 20. | 77034 | 460 | 125,510(0.37%)#63 | 1,669,094(0.03%)#811 |
| 21. | 77068 | 456 | 125,510(0.36%)#65 | 1,669,094(0.03%)#823 |
| 22. | 77041 | 454 | 125,510(0.36%)#66 | 1,669,094(0.03%)#827 |
| 23. | 77075 | 451 | 125,510(0.36%)#67 | 1,669,094(0.03%)#837 |
| 24. | 77013 | 431 | 125,510(0.34%)#69 | 1,669,094(0.03%)#879 |
| 25. | 77029 | 407 | 125,510(0.32%)#71 | 1,669,094(0.02%)#932 |
| 26. | 77093 | 378 | 125,510(0.30%)#76 | 1,669,094(0.02%)#1,002 |
| 27. | 77040 | 377 | 125,510(0.30%)#78 | 1,669,094(0.02%)#1,010 |
| 28. | 77023 | 377 | 125,510(0.30%)#79 | 1,669,094(0.02%)#1,012 |
| 29. | 77015 | 361 | 125,510(0.29%)#81 | 1,669,094(0.02%)#1,051 |
| 30. | 77088 | 361 | 125,510(0.29%)#82 | 1,669,094(0.02%)#1,052 |
| 31. | 77042 | 354 | 125,510(0.28%)#83 | 1,669,094(0.02%)#1,067 |
| 32. | 77039 | 336 | 125,510(0.27%)#86 | 1,669,094(0.02%)#1,112 |
| 33. | 77022 | 309 | 125,510(0.25%)#94 | 1,669,094(0.02%)#1,197 |
| 34. | 77012 | 294 | 125,510(0.23%)#99 | 1,669,094(0.02%)#1,260 |
| 35. | 77017 | 282 | 125,510(0.22%)#104 | 1,669,094(0.02%)#1,317 |
| 36. | 77043 | 266 | 125,510(0.21%)#110 | 1,669,094(0.02%)#1,397 |
| 37. | 77092 | 263 | 125,510(0.21%)#111 | 1,669,094(0.02%)#1,414 |
| 38. | 77053 | 255 | 125,510(0.20%)#115 | 1,669,094(0.02%)#1,465 |
| 39. | 77025 | 250 | 125,510(0.20%)#120 | 1,669,094(0.01%)#1,488 |
| 40. | 77033 | 244 | 125,510(0.19%)#121 | 1,669,094(0.01%)#1,512 |
| 41. | 77082 | 230 | 125,510(0.18%)#127 | 1,669,094(0.01%)#1,577 |
| 42. | 77035 | 226 | 125,510(0.18%)#131 | 1,669,094(0.01%)#1,604 |
| 43. | 77062 | 224 | 125,510(0.18%)#132 | 1,669,094(0.01%)#1,619 |
| 44. | 77009 | 215 | 125,510(0.17%)#137 | 1,669,094(0.01%)#1,679 |
| 45. | 77026 | 212 | 125,510(0.17%)#141 | 1,669,094(0.01%)#1,706 |
| 46. | 77032 | 202 | 125,510(0.16%)#145 | 1,669,094(0.01%)#1,769 |
| 47. | 77054 | 191 | 125,510(0.15%)#152 | 1,669,094(0.01%)#1,850 |
| 48. | 77096 | 186 | 125,510(0.15%)#156 | 1,669,094(0.01%)#1,882 |
| 49. | 77087 | 183 | 125,510(0.15%)#157 | 1,669,094(0.01%)#1,904 |
| 50. | 77095 | 182 | 125,510(0.15%)#158 | 1,669,094(0.01%)#1,909 |
| 51. | 77028 | 181 | 125,510(0.14%)#161 | 1,669,094(0.01%)#1,927 |
| 52. | 77071 | 171 | 125,510(0.14%)#171 | 1,669,094(0.01%)#2,019 |
| 53. | 77011 | 171 | 125,510(0.14%)#172 | 1,669,094(0.01%)#2,023 |
| 54. | 77094 | 151 | 125,510(0.12%)#191 | 1,669,094(0.01%)#2,213 |
| 55. | 77056 | 133 | 125,510(0.11%)#212 | 1,669,094(0.01%)#2,428 |
| 56. | 77024 | 124 | 125,510(0.10%)#225 | 1,669,094(0.01%)#2,530 |
| 57. | 77044 | 119 | 125,510(0.09%)#234 | 1,669,094(0.01%)#2,591 |
| 58. | 77007 | 116 | 125,510(0.09%)#238 | 1,669,094(0.01%)#2,636 |
| 59. | 77089 | 114 | 125,510(0.09%)#244 | 1,669,094(0.01%)#2,680 |
| 60. | 77048 | 111 | 125,510(0.09%)#253 | 1,669,094(0.01%)#2,739 |
| 61. | 77038 | 107 | 125,510(0.09%)#258 | 1,669,094(0.01%)#2,792 |
| 62. | 77049 | 97 | 125,510(0.08%)#274 | 1,669,094(0.01%)#2,983 |
| 63. | 77064 | 95 | 125,510(0.08%)#279 | 1,669,094(0.01%)#3,022 |
| 64. | 77006 | 88 | 125,510(0.07%)#285 | 1,669,094(0.01%)#3,174 |
| 65. | 77008 | 87 | 125,510(0.07%)#286 | 1,669,094(0.01%)#3,196 |
| 66. | 77005 | 78 | 125,510(0.06%)#306 | 1,669,094(0.00%)#3,372 |
| 67. | 77002 | 78 | 125,510(0.06%)#307 | 1,669,094(0.00%)#3,381 |
| 68. | 77020 | 71 | 125,510(0.06%)#319 | 1,669,094(0.00%)#3,550 |
| 69. | 77058 | 71 | 125,510(0.06%)#321 | 1,669,094(0.00%)#3,553 |
| 70. | 77065 | 69 | 125,510(0.05%)#328 | 1,669,094(0.00%)#3,598 |
| 71. | 77085 | 67 | 125,510(0.05%)#336 | 1,669,094(0.00%)#3,672 |
| 72. | 77018 | 64 | 125,510(0.05%)#346 | 1,669,094(0.00%)#3,762 |
| 73. | 77021 | 56 | 125,510(0.04%)#368 | 1,669,094(0.00%)#4,015 |
| 74. | 77077 | 54 | 125,510(0.04%)#374 | 1,669,094(0.00%)#4,077 |
| 75. | 77004 | 39 | 125,510(0.03%)#431 | 1,669,094(0.00%)#4,736 |
| 76. | 77069 | 37 | 125,510(0.03%)#445 | 1,669,094(0.00%)#4,853 |
| 77. | 77037 | 31 | 125,510(0.02%)#476 | 1,669,094(0.00%)#5,226 |
| 78. | 77079 | 28 | 125,510(0.02%)#488 | 1,669,094(0.00%)#5,376 |
| 79. | 77030 | 27 | 125,510(0.02%)#496 | 1,669,094(0.00%)#5,464 |
| 80. | 77076 | 22 | 125,510(0.02%)#525 | 1,669,094(0.00%)#5,846 |
| 81. | 77091 | 17 | 125,510(0.01%)#560 | 1,669,094(0.00%)#6,303 |
| 82. | 77014 | 16 | 125,510(0.01%)#566 | 1,669,094(0.00%)#6,388 |
| 83. | 77016 | 6 | 125,510(0.00%)#662 | 1,669,094(0.00%)#7,786 |
| 84. | 77098 | 5 | 125,510(0.00%)#673 | 1,669,094(0.00%)#7,981 |
| 85. | 77003 | 3 | 125,510(0.00%)#707 | 1,669,094(0.00%)#8,339 |
1
Common Questions
What are the Top 10 Zip Codes with the Largest Guatemalan Community in Houston, TX?
Top 10 Zip Codes with the Largest Guatemalan Community in Houston, TX are:
What zip code has the Largest Guatemalan Community in Houston, TX?
77057 has the Largest Guatemalan Community in Houston, TX with 7,051.
What is the Total Guatemalan Population in Houston, TX?
Total Guatemalan Population in Houston is 38,631.
What is the Total Guatemalan Population in Texas?
Total Guatemalan Population in Texas is 125,510.
What is the Total Guatemalan Population in the United States?
Total Guatemalan Population in the United States is 1,669,094.