Zip Codes with the Highest Percentage of Population with a Degree in Social Sciences in Houston, TX
RELATED REPORTS & OPTIONS
Social Sciences
Houston
Compare Zip Codes
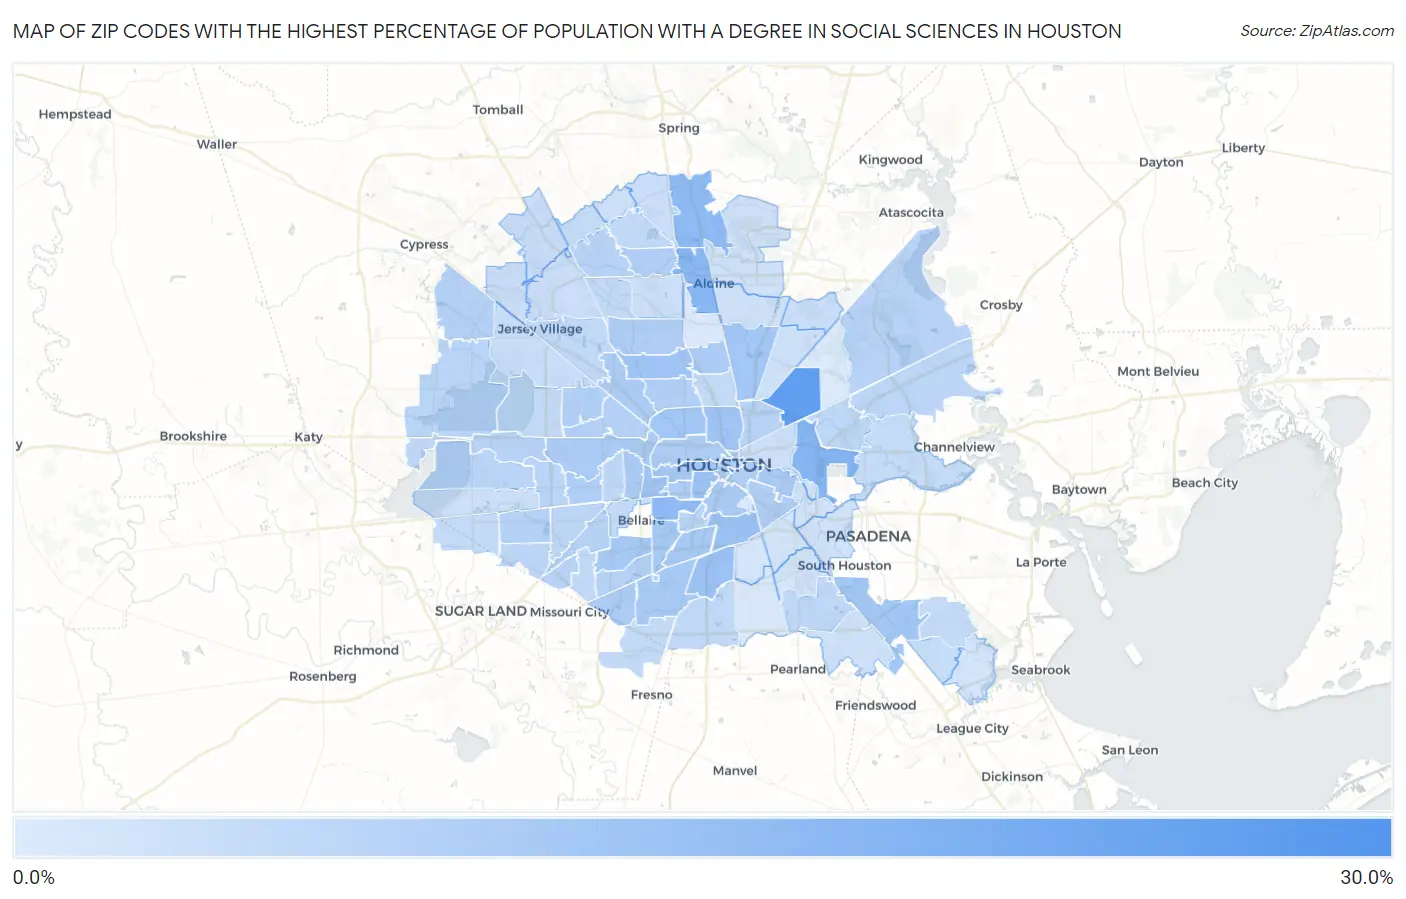
Map of Zip Codes with the Highest Percentage of Population with a Degree in Social Sciences in Houston
0.0%
30.0%
Zip Codes with the Highest Percentage of Population with a Degree in Social Sciences in Houston, TX
| Zip Code | % Graduates | vs State | vs National | |
| 1. | 77010 | 25.7% | 6.1%(+19.6)#24 | 8.1%(+17.6)#596 |
| 2. | 77028 | 21.2% | 6.1%(+15.0)#33 | 8.1%(+13.1)#866 |
| 3. | 77029 | 15.2% | 6.1%(+9.06)#61 | 8.1%(+7.12)#1,886 |
| 4. | 77060 | 14.5% | 6.1%(+8.36)#68 | 8.1%(+6.42)#2,145 |
| 5. | 77005 | 13.7% | 6.1%(+7.55)#79 | 8.1%(+5.61)#2,492 |
| 6. | 77073 | 13.6% | 6.1%(+7.48)#81 | 8.1%(+5.54)#2,540 |
| 7. | 77051 | 11.4% | 6.1%(+5.26)#119 | 8.1%(+3.32)#4,011 |
| 8. | 77006 | 11.3% | 6.1%(+5.18)#120 | 8.1%(+3.24)#4,072 |
| 9. | 77021 | 11.2% | 6.1%(+5.07)#124 | 8.1%(+3.13)#4,167 |
| 10. | 77027 | 10.7% | 6.1%(+4.58)#140 | 8.1%(+2.64)#4,688 |
| 11. | 77091 | 10.7% | 6.1%(+4.56)#141 | 8.1%(+2.63)#4,704 |
| 12. | 77009 | 10.6% | 6.1%(+4.48)#145 | 8.1%(+2.54)#4,803 |
| 13. | 77008 | 10.5% | 6.1%(+4.34)#147 | 8.1%(+2.40)#4,971 |
| 14. | 77034 | 10.2% | 6.1%(+4.11)#156 | 8.1%(+2.17)#5,261 |
| 15. | 77093 | 10.2% | 6.1%(+4.09)#157 | 8.1%(+2.15)#5,281 |
| 16. | 77019 | 9.8% | 6.1%(+3.64)#173 | 8.1%(+1.70)#5,848 |
| 17. | 77025 | 9.7% | 6.1%(+3.56)#180 | 8.1%(+1.62)#5,958 |
| 18. | 77045 | 9.6% | 6.1%(+3.42)#188 | 8.1%(+1.49)#6,144 |
| 19. | 77096 | 9.5% | 6.1%(+3.41)#189 | 8.1%(+1.47)#6,161 |
| 20. | 77054 | 9.5% | 6.1%(+3.34)#195 | 8.1%(+1.40)#6,237 |
| 21. | 77004 | 9.4% | 6.1%(+3.24)#204 | 8.1%(+1.30)#6,400 |
| 22. | 77024 | 9.3% | 6.1%(+3.21)#206 | 8.1%(+1.27)#6,428 |
| 23. | 77076 | 9.3% | 6.1%(+3.17)#209 | 8.1%(+1.23)#6,486 |
| 24. | 77056 | 9.2% | 6.1%(+3.04)#219 | 8.1%(+1.10)#6,666 |
| 25. | 77011 | 9.2% | 6.1%(+3.04)#220 | 8.1%(+1.10)#6,679 |
| 26. | 77085 | 9.0% | 6.1%(+2.87)#228 | 8.1%(+0.930)#6,961 |
| 27. | 77092 | 8.9% | 6.1%(+2.79)#231 | 8.1%(+0.854)#7,078 |
| 28. | 77007 | 8.7% | 6.1%(+2.54)#254 | 8.1%(+0.601)#7,477 |
| 29. | 77088 | 8.5% | 6.1%(+2.34)#272 | 8.1%(+0.396)#7,875 |
| 30. | 77098 | 8.4% | 6.1%(+2.24)#280 | 8.1%(+0.297)#8,057 |
| 31. | 77063 | 8.3% | 6.1%(+2.14)#290 | 8.1%(+0.200)#8,222 |
| 32. | 77023 | 8.2% | 6.1%(+2.05)#304 | 8.1%(+0.109)#8,397 |
| 33. | 77002 | 8.1% | 6.1%(+1.99)#308 | 8.1%(+0.054)#8,498 |
| 34. | 77003 | 8.0% | 6.1%(+1.91)#315 | 8.1%(-0.028)#8,654 |
| 35. | 77067 | 8.0% | 6.1%(+1.88)#322 | 8.1%(-0.062)#8,730 |
| 36. | 77080 | 8.0% | 6.1%(+1.82)#327 | 8.1%(-0.121)#8,847 |
| 37. | 77055 | 7.7% | 6.1%(+1.58)#347 | 8.1%(-0.356)#9,338 |
| 38. | 77018 | 7.7% | 6.1%(+1.55)#350 | 8.1%(-0.389)#9,414 |
| 39. | 77074 | 7.5% | 6.1%(+1.38)#364 | 8.1%(-0.560)#9,746 |
| 40. | 77095 | 7.5% | 6.1%(+1.36)#370 | 8.1%(-0.582)#9,798 |
| 41. | 77072 | 7.4% | 6.1%(+1.31)#375 | 8.1%(-0.630)#9,910 |
| 42. | 77035 | 7.4% | 6.1%(+1.27)#381 | 8.1%(-0.668)#9,991 |
| 43. | 77066 | 7.2% | 6.1%(+1.08)#403 | 8.1%(-0.860)#10,414 |
| 44. | 77026 | 7.1% | 6.1%(+0.994)#419 | 8.1%(-0.946)#10,645 |
| 45. | 77031 | 7.1% | 6.1%(+0.959)#423 | 8.1%(-0.980)#10,703 |
| 46. | 77044 | 7.1% | 6.1%(+0.954)#426 | 8.1%(-0.986)#10,722 |
| 47. | 77079 | 7.0% | 6.1%(+0.820)#447 | 8.1%(-1.12)#11,021 |
| 48. | 77077 | 6.9% | 6.1%(+0.769)#458 | 8.1%(-1.17)#11,154 |
| 49. | 77084 | 6.8% | 6.1%(+0.673)#465 | 8.1%(-1.27)#11,370 |
| 50. | 77042 | 6.8% | 6.1%(+0.629)#472 | 8.1%(-1.31)#11,471 |
| 51. | 77030 | 6.7% | 6.1%(+0.551)#477 | 8.1%(-1.39)#11,658 |
| 52. | 77049 | 6.5% | 6.1%(+0.415)#493 | 8.1%(-1.52)#12,002 |
| 53. | 77036 | 6.5% | 6.1%(+0.324)#507 | 8.1%(-1.62)#12,217 |
| 54. | 77099 | 6.4% | 6.1%(+0.231)#526 | 8.1%(-1.71)#12,480 |
| 55. | 77057 | 6.1% | 6.1%(-0.015)#568 | 8.1%(-1.95)#13,041 |
| 56. | 77013 | 6.1% | 6.1%(-0.016)#570 | 8.1%(-1.96)#13,043 |
| 57. | 77075 | 5.9% | 6.1%(-0.201)#597 | 8.1%(-2.14)#13,514 |
| 58. | 77094 | 5.9% | 6.1%(-0.270)#607 | 8.1%(-2.21)#13,681 |
| 59. | 77047 | 5.8% | 6.1%(-0.303)#614 | 8.1%(-2.24)#13,762 |
| 60. | 77040 | 5.7% | 6.1%(-0.434)#630 | 8.1%(-2.37)#14,074 |
| 61. | 77071 | 5.7% | 6.1%(-0.459)#635 | 8.1%(-2.40)#14,139 |
| 62. | 77014 | 5.7% | 6.1%(-0.461)#636 | 8.1%(-2.40)#14,143 |
| 63. | 77022 | 5.5% | 6.1%(-0.637)#665 | 8.1%(-2.58)#14,580 |
| 64. | 77086 | 5.4% | 6.1%(-0.743)#684 | 8.1%(-2.68)#14,864 |
| 65. | 77043 | 5.4% | 6.1%(-0.777)#693 | 8.1%(-2.72)#14,949 |
| 66. | 77083 | 5.3% | 6.1%(-0.804)#699 | 8.1%(-2.74)#15,003 |
| 67. | 77053 | 5.3% | 6.1%(-0.805)#700 | 8.1%(-2.74)#15,005 |
| 68. | 77059 | 5.3% | 6.1%(-0.836)#702 | 8.1%(-2.78)#15,088 |
| 69. | 77081 | 5.2% | 6.1%(-0.949)#729 | 8.1%(-2.89)#15,384 |
| 70. | 77062 | 5.1% | 6.1%(-1.04)#744 | 8.1%(-2.98)#15,616 |
| 71. | 77069 | 5.1% | 6.1%(-1.07)#753 | 8.1%(-3.01)#15,682 |
| 72. | 77015 | 5.0% | 6.1%(-1.14)#767 | 8.1%(-3.08)#15,876 |
| 73. | 77070 | 4.7% | 6.1%(-1.42)#812 | 8.1%(-3.36)#16,499 |
| 74. | 77041 | 4.7% | 6.1%(-1.48)#824 | 8.1%(-3.42)#16,679 |
| 75. | 77065 | 4.4% | 6.1%(-1.76)#867 | 8.1%(-3.70)#17,335 |
| 76. | 77050 | 4.3% | 6.1%(-1.82)#878 | 8.1%(-3.75)#17,473 |
| 77. | 77064 | 4.3% | 6.1%(-1.82)#880 | 8.1%(-3.76)#17,493 |
| 78. | 77090 | 4.3% | 6.1%(-1.83)#881 | 8.1%(-3.77)#17,523 |
| 79. | 77046 | 4.2% | 6.1%(-1.92)#899 | 8.1%(-3.86)#17,729 |
| 80. | 77038 | 4.0% | 6.1%(-2.13)#933 | 8.1%(-4.07)#18,197 |
| 81. | 77082 | 4.0% | 6.1%(-2.14)#935 | 8.1%(-4.08)#18,229 |
| 82. | 77020 | 4.0% | 6.1%(-2.15)#937 | 8.1%(-4.09)#18,241 |
| 83. | 77089 | 3.8% | 6.1%(-2.38)#967 | 8.1%(-4.32)#18,768 |
| 84. | 77068 | 3.7% | 6.1%(-2.42)#978 | 8.1%(-4.36)#18,872 |
| 85. | 77016 | 3.7% | 6.1%(-2.44)#984 | 8.1%(-4.38)#18,941 |
| 86. | 77039 | 3.6% | 6.1%(-2.50)#994 | 8.1%(-4.43)#19,043 |
| 87. | 77032 | 3.5% | 6.1%(-2.60)#1,014 | 8.1%(-4.54)#19,286 |
| 88. | 77012 | 3.3% | 6.1%(-2.80)#1,043 | 8.1%(-4.74)#19,687 |
| 89. | 77017 | 3.2% | 6.1%(-2.95)#1,062 | 8.1%(-4.89)#19,968 |
| 90. | 77058 | 2.9% | 6.1%(-3.20)#1,087 | 8.1%(-5.14)#20,504 |
| 91. | 77033 | 2.9% | 6.1%(-3.22)#1,090 | 8.1%(-5.16)#20,561 |
| 92. | 77087 | 2.9% | 6.1%(-3.28)#1,097 | 8.1%(-5.22)#20,652 |
| 93. | 77061 | 2.8% | 6.1%(-3.30)#1,099 | 8.1%(-5.24)#20,682 |
| 94. | 77048 | 1.9% | 6.1%(-4.20)#1,222 | 8.1%(-6.14)#22,288 |
| 95. | 77037 | 1.9% | 6.1%(-4.22)#1,225 | 8.1%(-6.16)#22,315 |
| 96. | 77204 | 1.7% | 6.1%(-4.45)#1,257 | 8.1%(-6.39)#22,664 |
| 97. | 77078 | 1.7% | 6.1%(-4.48)#1,266 | 8.1%(-6.42)#22,731 |
1
Common Questions
What are the Top 10 Zip Codes with the Highest Percentage of Population with a Degree in Social Sciences in Houston, TX?
Top 10 Zip Codes with the Highest Percentage of Population with a Degree in Social Sciences in Houston, TX are:
What zip code has the Highest Percentage of Population with a Degree in Social Sciences in Houston, TX?
77010 has the Highest Percentage of Population with a Degree in Social Sciences in Houston, TX with 25.7%.
What is the Percentage of Population with a Degree in Social Sciences in Houston, TX?
Percentage of Population with a Degree in Social Sciences in Houston is 7.9%.
What is the Percentage of Population with a Degree in Social Sciences in Texas?
Percentage of Population with a Degree in Social Sciences in Texas is 6.1%.
What is the Percentage of Population with a Degree in Social Sciences in the United States?
Percentage of Population with a Degree in Social Sciences in the United States is 8.1%.