Winchester, OK
Winchester Map
Winchester Overview
524
TOTAL POPULATION
299
MALE POPULATION
225
FEMALE POPULATION
132.89
MALES / 100 FEMALES
75.25
FEMALES / 100 MALES
42.6
MEDIAN AGE
2.8
AVG FAMILY SIZE
2.6
AVG HOUSEHOLD SIZE
$27,775
PER CAPITA INCOME
$57,396
AVG FAMILY INCOME
$57,813
AVG HOUSEHOLD INCOME
47.0%
WAGE / INCOME GAP [ % ]
53.0¢/ $1
WAGE / INCOME GAP [ $ ]
0.41
INEQUALITY / GINI INDEX
217
LABOR FORCE [ PEOPLE ]
52.9%
PERCENT IN LABOR FORCE
6.0%
UNEMPLOYMENT RATE
Winchester Area Codes
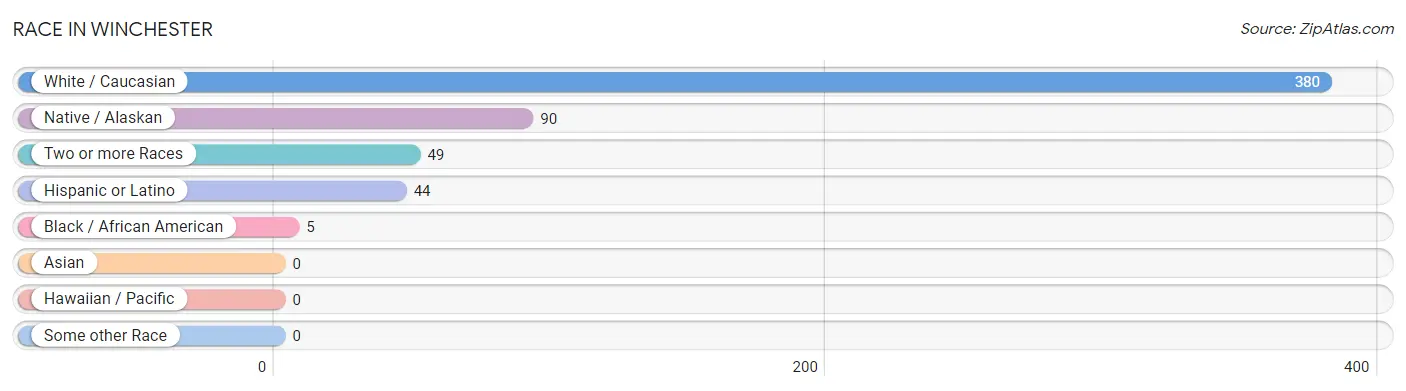
Race in Winchester
The most populous races in Winchester are White / Caucasian (380 | 72.5%), Native / Alaskan (90 | 17.2%), and Two or more Races (49 | 9.3%).
| Race | # Population | % Population |
| Asian | 0 | 0.0% |
| Black / African American | 5 | 0.9% |
| Hawaiian / Pacific | 0 | 0.0% |
| Hispanic or Latino | 44 | 8.4% |
| Native / Alaskan | 90 | 17.2% |
| White / Caucasian | 380 | 72.5% |
| Two or more Races | 49 | 9.3% |
| Some other Race | 0 | 0.0% |
| Total | 524 | 100.0% |
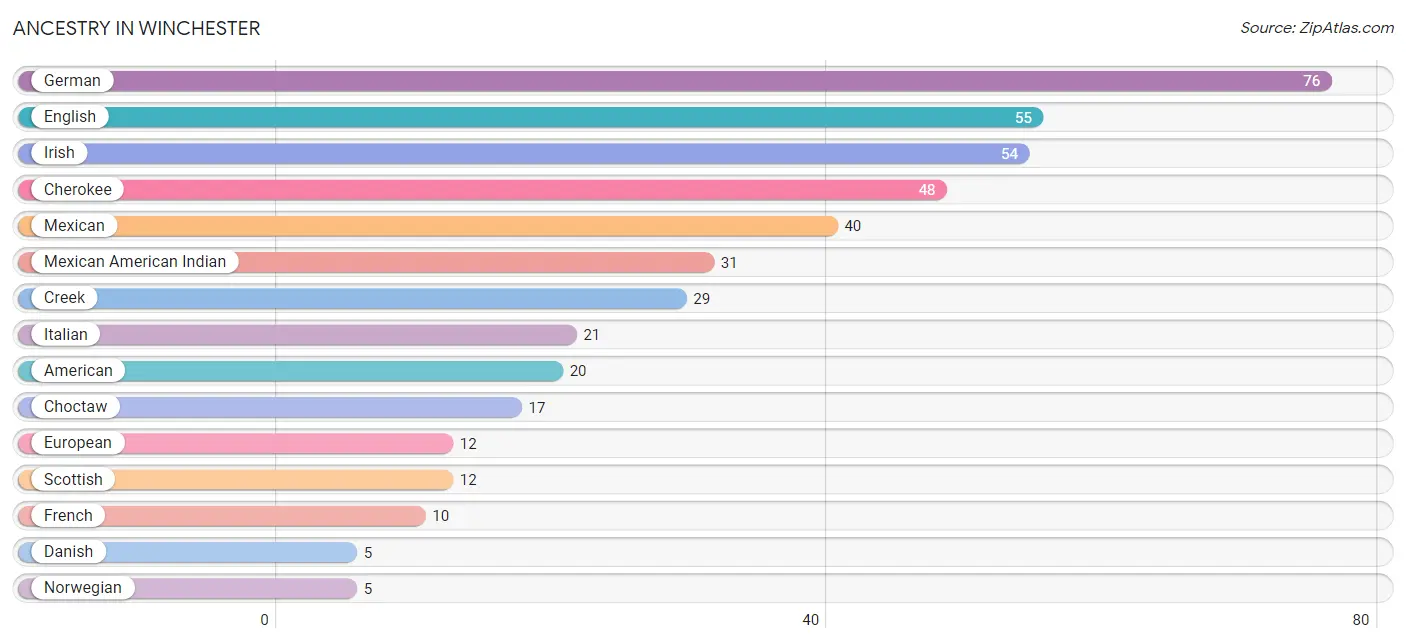
Ancestry in Winchester
The most populous ancestries reported in Winchester are German (76 | 14.5%), English (55 | 10.5%), Irish (54 | 10.3%), Cherokee (48 | 9.2%), and Mexican (40 | 7.6%), together accounting for 52.1% of all Winchester residents.
| Ancestry | # Population | % Population |
| American | 20 | 3.8% |
| Austrian | 4 | 0.8% |
| Blackfeet | 2 | 0.4% |
| Canadian | 2 | 0.4% |
| Cherokee | 48 | 9.2% |
| Choctaw | 17 | 3.2% |
| Creek | 29 | 5.5% |
| Danish | 5 | 0.9% |
| Dutch | 2 | 0.4% |
| Dutch West Indian | 4 | 0.8% |
| English | 55 | 10.5% |
| European | 12 | 2.3% |
| French | 10 | 1.9% |
| German | 76 | 14.5% |
| Irish | 54 | 10.3% |
| Italian | 21 | 4.0% |
| Mexican | 40 | 7.6% |
| Mexican American Indian | 31 | 5.9% |
| Norwegian | 5 | 0.9% |
| Polish | 4 | 0.8% |
| Portuguese | 5 | 0.9% |
| Puerto Rican | 4 | 0.8% |
| Scandinavian | 2 | 0.4% |
| Scotch-Irish | 4 | 0.8% |
| Scottish | 12 | 2.3% |
| Seminole | 1 | 0.2% |
| Swedish | 2 | 0.4% |
| Welsh | 2 | 0.4% | View All 28 Rows |
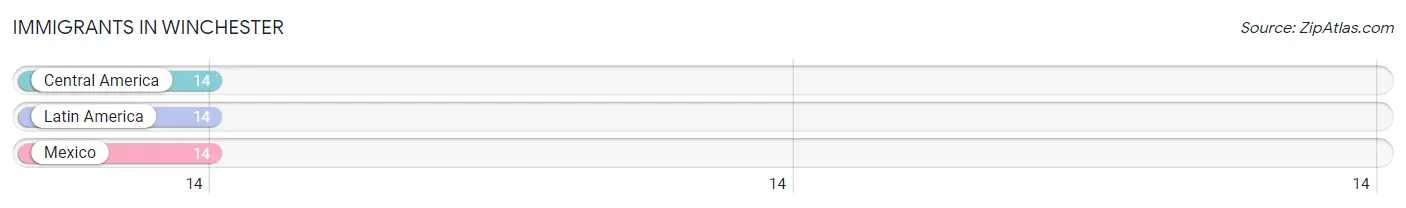
Immigrants in Winchester
The most numerous immigrant groups reported in Winchester came from Central America (14 | 2.7%), Latin America (14 | 2.7%), and Mexico (14 | 2.7%), together accounting for 8.0% of all Winchester residents.
| Immigration Origin | # Population | % Population |
| Central America | 14 | 2.7% |
| Latin America | 14 | 2.7% |
| Mexico | 14 | 2.7% | View All 3 Rows |
Sex and Age in Winchester
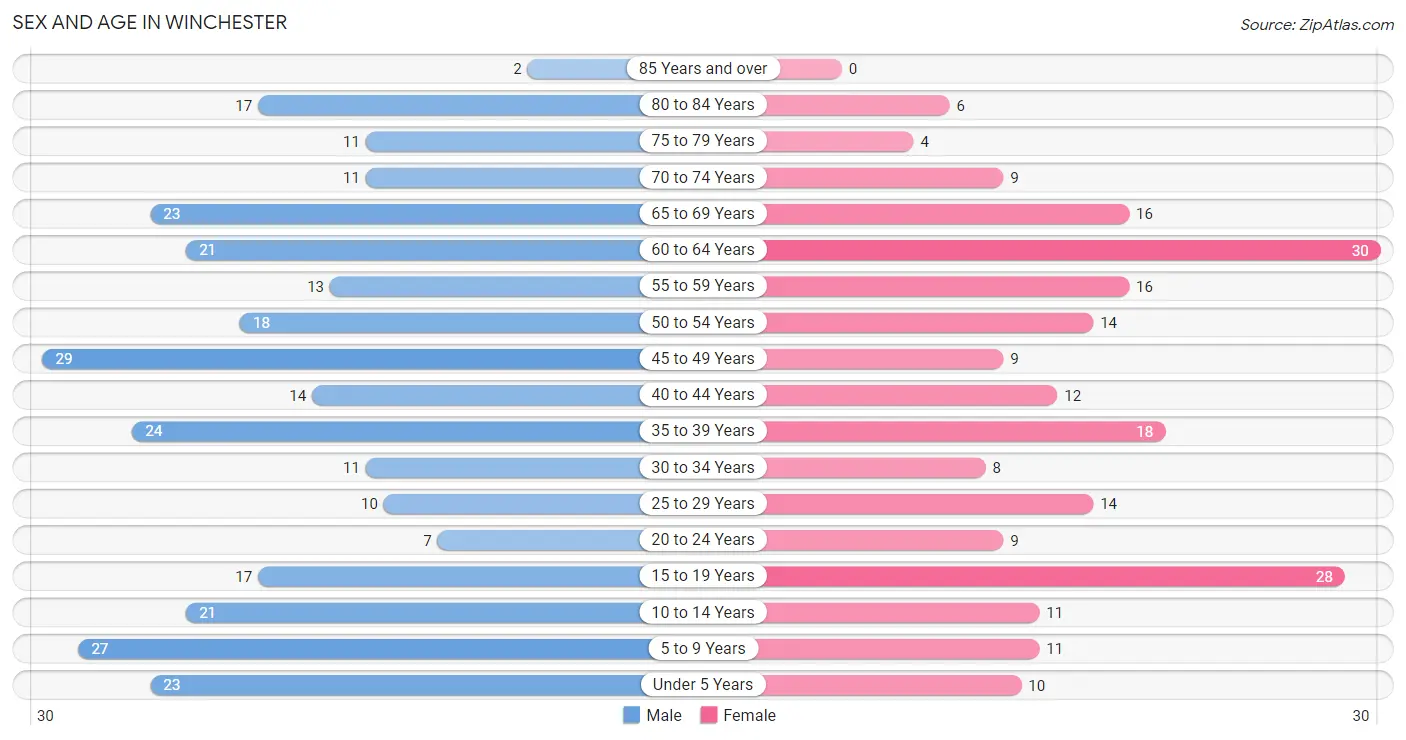
Sex and Age in Winchester
The most populous age groups in Winchester are 45 to 49 Years (29 | 9.7%) for men and 60 to 64 Years (30 | 13.3%) for women.
| Age Bracket | Male | Female |
| Under 5 Years | 23 (7.7%) | 10 (4.4%) |
| 5 to 9 Years | 27 (9.0%) | 11 (4.9%) |
| 10 to 14 Years | 21 (7.0%) | 11 (4.9%) |
| 15 to 19 Years | 17 (5.7%) | 28 (12.4%) |
| 20 to 24 Years | 7 (2.3%) | 9 (4.0%) |
| 25 to 29 Years | 10 (3.3%) | 14 (6.2%) |
| 30 to 34 Years | 11 (3.7%) | 8 (3.6%) |
| 35 to 39 Years | 24 (8.0%) | 18 (8.0%) |
| 40 to 44 Years | 14 (4.7%) | 12 (5.3%) |
| 45 to 49 Years | 29 (9.7%) | 9 (4.0%) |
| 50 to 54 Years | 18 (6.0%) | 14 (6.2%) |
| 55 to 59 Years | 13 (4.3%) | 16 (7.1%) |
| 60 to 64 Years | 21 (7.0%) | 30 (13.3%) |
| 65 to 69 Years | 23 (7.7%) | 16 (7.1%) |
| 70 to 74 Years | 11 (3.7%) | 9 (4.0%) |
| 75 to 79 Years | 11 (3.7%) | 4 (1.8%) |
| 80 to 84 Years | 17 (5.7%) | 6 (2.7%) |
| 85 Years and over | 2 (0.7%) | 0 (0.0%) |
| Total | 299 (100.0%) | 225 (100.0%) |
Families and Households in Winchester
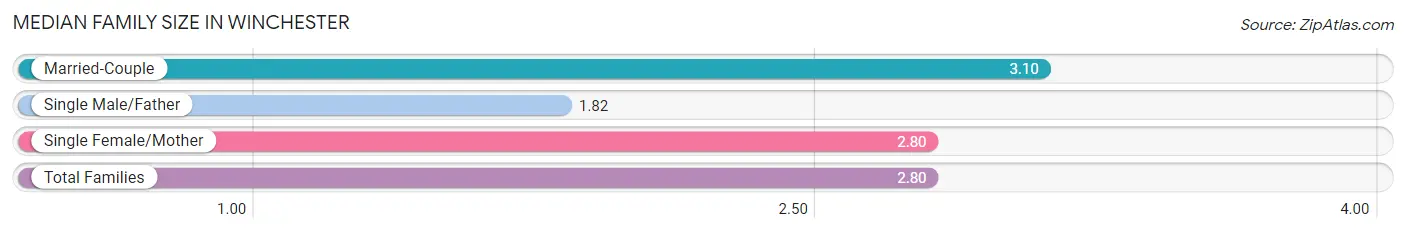
Median Family Size in Winchester
The median family size in Winchester is 2.80 persons per family, with married-couple families (107 | 69.0%) accounting for the largest median family size of 3.1 persons per family. On the other hand, single male/father families (33 | 21.3%) represent the smallest median family size with 1.82 persons per family.
| Family Type | # Families | Family Size |
| Married-Couple | 107 (69.0%) | 3.10 |
| Single Male/Father | 33 (21.3%) | 1.82 |
| Single Female/Mother | 15 (9.7%) | 2.80 |
| Total Families | 155 (100.0%) | 2.80 |
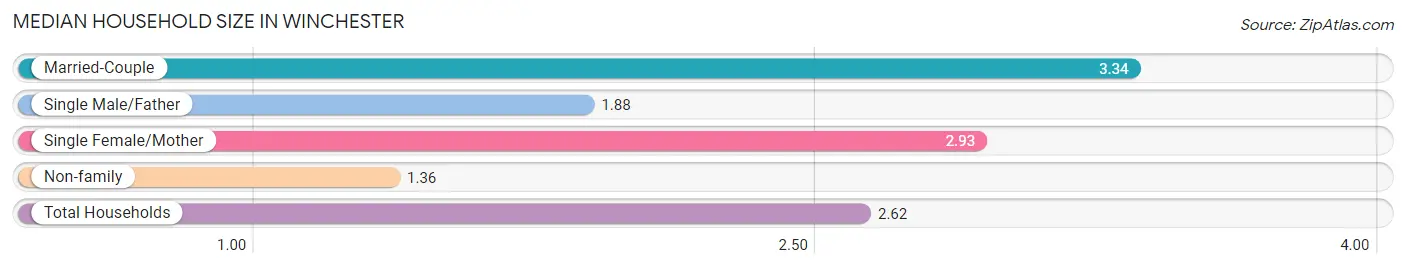
Median Household Size in Winchester
The median household size in Winchester is 2.62 persons per household, with married-couple households (107 | 53.5%) accounting for the largest median household size of 3.34 persons per household. non-family households (45 | 22.5%) represent the smallest median household size with 1.36 persons per household.
| Household Type | # Households | Household Size |
| Married-Couple | 107 (53.5%) | 3.34 |
| Single Male/Father | 33 (16.5%) | 1.88 |
| Single Female/Mother | 15 (7.5%) | 2.93 |
| Non-family | 45 (22.5%) | 1.36 |
| Total Households | 200 (100.0%) | 2.62 |
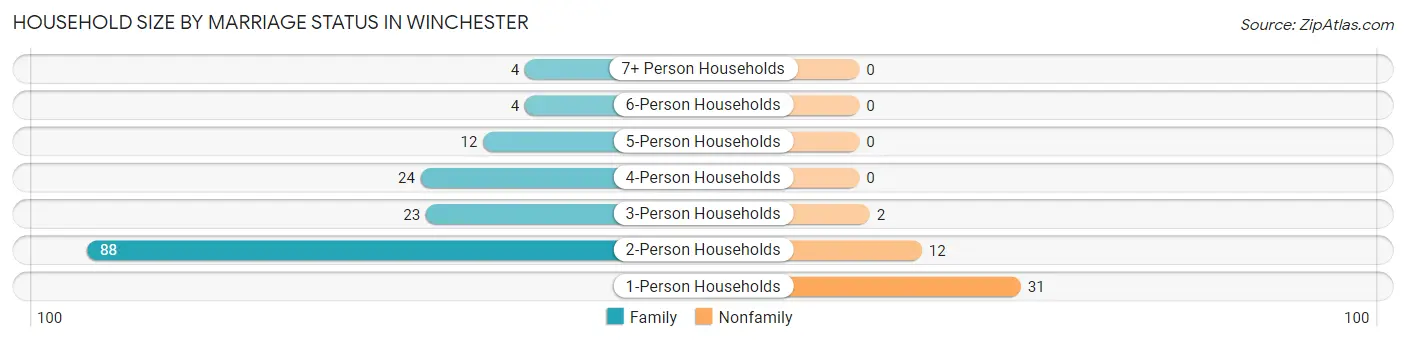
Household Size by Marriage Status in Winchester
Out of a total of 200 households in Winchester, 155 (77.5%) are family households, while 45 (22.5%) are nonfamily households. The most numerous type of family households are 2-person households, comprising 88, and the most common type of nonfamily households are 1-person households, comprising 31.
| Household Size | Family Households | Nonfamily Households |
| 1-Person Households | - | 31 (15.5%) |
| 2-Person Households | 88 (44.0%) | 12 (6.0%) |
| 3-Person Households | 23 (11.5%) | 2 (1.0%) |
| 4-Person Households | 24 (12.0%) | 0 (0.0%) |
| 5-Person Households | 12 (6.0%) | 0 (0.0%) |
| 6-Person Households | 4 (2.0%) | 0 (0.0%) |
| 7+ Person Households | 4 (2.0%) | 0 (0.0%) |
| Total | 155 (77.5%) | 45 (22.5%) |
Female Fertility in Winchester
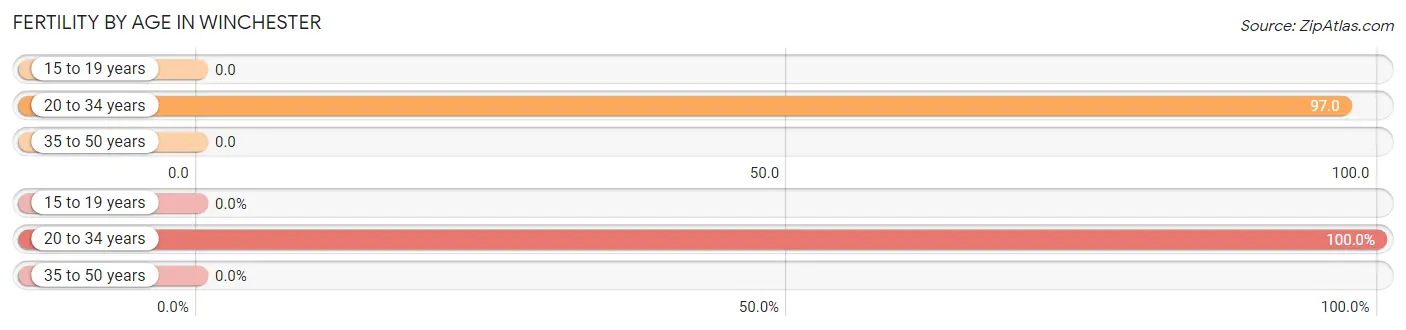
Fertility by Age in Winchester
Average fertility rate in Winchester is 30.0 births per 1,000 women. Women in the age bracket of 20 to 34 years have the highest fertility rate with 97.0 births per 1,000 women. Women in the age bracket of 20 to 34 years acount for 100.0% of all women with births.
| Age Bracket | Women with Births | Births / 1,000 Women |
| 15 to 19 years | 0 (0.0%) | 0.0 |
| 20 to 34 years | 3 (100.0%) | 97.0 |
| 35 to 50 years | 0 (0.0%) | 0.0 |
| Total | 3 (100.0%) | 30.0 |
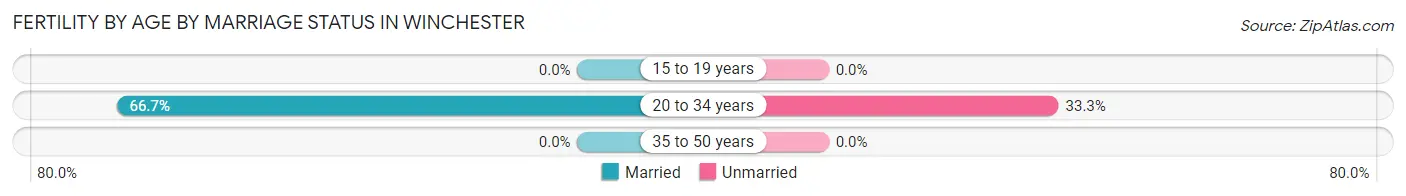
Fertility by Age by Marriage Status in Winchester
66.7% of women with births (3) in Winchester are married. The highest percentage of unmarried women with births falls into 20 to 34 years age bracket with 33.3% of them unmarried at the time of birth, while the lowest percentage of unmarried women with births belong to 20 to 34 years age bracket with 33.3% of them unmarried.
| Age Bracket | Married | Unmarried |
| 15 to 19 years | 0 (0.0%) | 0 (0.0%) |
| 20 to 34 years | 2 (66.7%) | 1 (33.3%) |
| 35 to 50 years | 0 (0.0%) | 0 (0.0%) |
| Total | 2 (66.7%) | 1 (33.3%) |
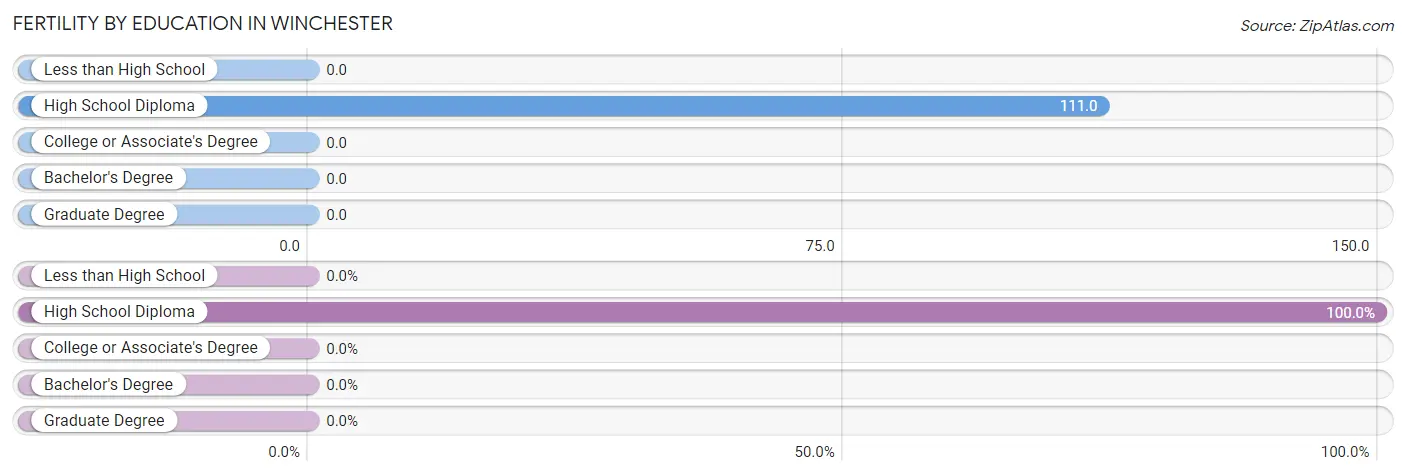
Fertility by Education in Winchester
| Educational Attainment | Women with Births | Births / 1,000 Women |
| Less than High School | 0 (0.0%) | 0.0 |
| High School Diploma | 3 (100.0%) | 111.0 |
| College or Associate's Degree | 0 (0.0%) | 0.0 |
| Bachelor's Degree | 0 (0.0%) | 0.0 |
| Graduate Degree | 0 (0.0%) | 0.0 |
| Total | 3 (100.0%) | 30.0 |
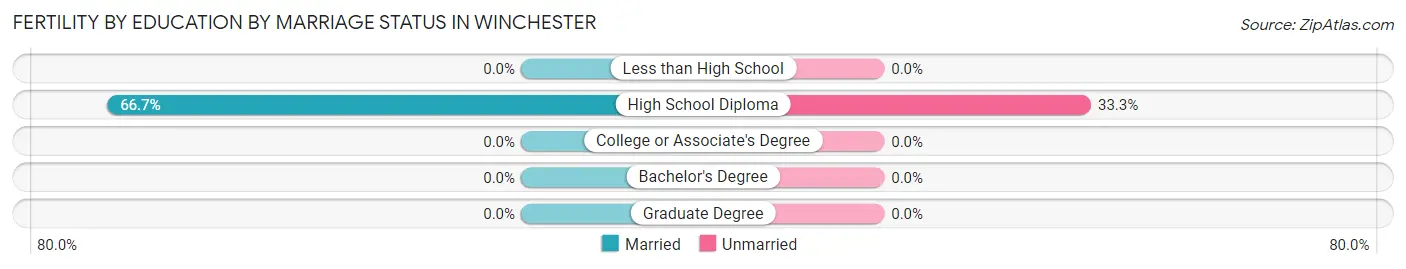
Fertility by Education by Marriage Status in Winchester
33.3% of women with births in Winchester are unmarried. Women with the educational attainment of high school diploma are most likely to be married with 66.7% of them married at childbirth, while women with the educational attainment of high school diploma are least likely to be married with 33.3% of them unmarried at childbirth.
| Educational Attainment | Married | Unmarried |
| Less than High School | 0 (0.0%) | 0 (0.0%) |
| High School Diploma | 2 (66.7%) | 1 (33.3%) |
| College or Associate's Degree | 0 (0.0%) | 0 (0.0%) |
| Bachelor's Degree | 0 (0.0%) | 0 (0.0%) |
| Graduate Degree | 0 (0.0%) | 0 (0.0%) |
| Total | 2 (66.7%) | 1 (33.3%) |
Income in Winchester
Income Overview in Winchester
Per Capita Income in Winchester is $27,775, while median incomes of families and households are $57,396 and $57,813 respectively.
| Characteristic | Number | Measure |
| Per Capita Income | 524 | $27,775 |
| Median Family Income | 155 | $57,396 |
| Mean Family Income | 155 | $74,170 |
| Median Household Income | 200 | $57,813 |
| Mean Household Income | 200 | $70,690 |
| Income Deficit | 155 | $0 |
| Wage / Income Gap (%) | 524 | 46.99% |
| Wage / Income Gap ($) | 524 | 53.01¢ per $1 |
| Gini / Inequality Index | 524 | 0.41 |
Earnings by Sex in Winchester
Average Earnings in Winchester are $36,406, $47,159 for men and $25,000 for women, a difference of 47.0%.
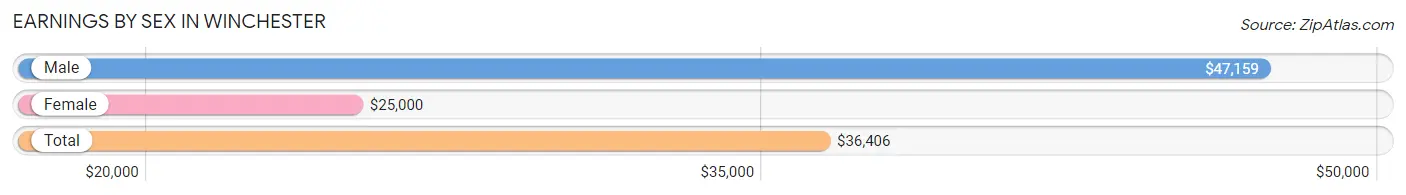
| Sex | Number | Average Earnings |
| Male | 141 (58.5%) | $47,159 |
| Female | 100 (41.5%) | $25,000 |
| Total | 241 (100.0%) | $36,406 |
Earnings by Sex by Income Bracket in Winchester
The most common earnings brackets in Winchester are $55,000 to $64,999 for men (20 | 14.2%) and $25,000 to $29,999 for women (11 | 11.0%).
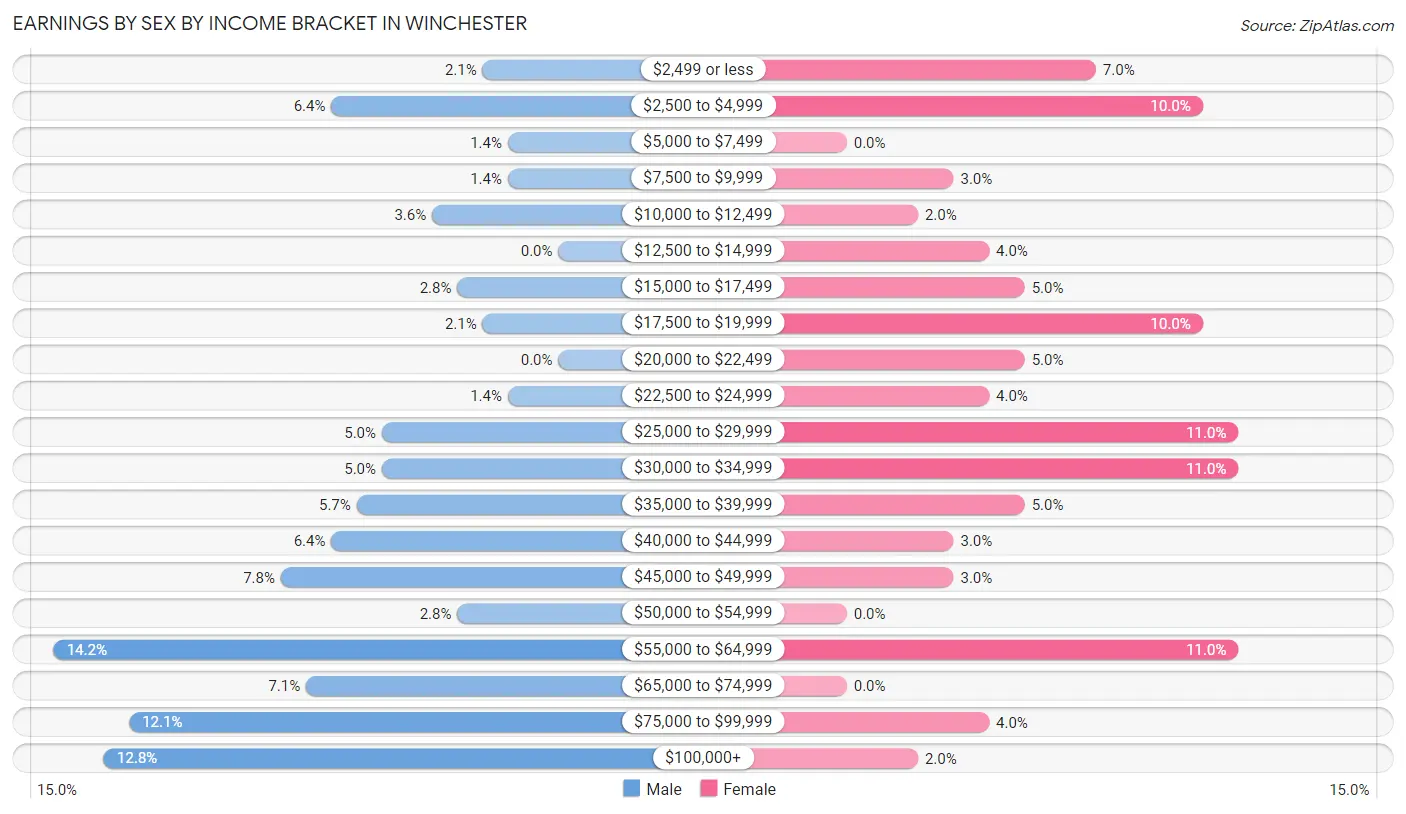
| Income | Male | Female |
| $2,499 or less | 3 (2.1%) | 7 (7.0%) |
| $2,500 to $4,999 | 9 (6.4%) | 10 (10.0%) |
| $5,000 to $7,499 | 2 (1.4%) | 0 (0.0%) |
| $7,500 to $9,999 | 2 (1.4%) | 3 (3.0%) |
| $10,000 to $12,499 | 5 (3.5%) | 2 (2.0%) |
| $12,500 to $14,999 | 0 (0.0%) | 4 (4.0%) |
| $15,000 to $17,499 | 4 (2.8%) | 5 (5.0%) |
| $17,500 to $19,999 | 3 (2.1%) | 10 (10.0%) |
| $20,000 to $22,499 | 0 (0.0%) | 5 (5.0%) |
| $22,500 to $24,999 | 2 (1.4%) | 4 (4.0%) |
| $25,000 to $29,999 | 7 (5.0%) | 11 (11.0%) |
| $30,000 to $34,999 | 7 (5.0%) | 11 (11.0%) |
| $35,000 to $39,999 | 8 (5.7%) | 5 (5.0%) |
| $40,000 to $44,999 | 9 (6.4%) | 3 (3.0%) |
| $45,000 to $49,999 | 11 (7.8%) | 3 (3.0%) |
| $50,000 to $54,999 | 4 (2.8%) | 0 (0.0%) |
| $55,000 to $64,999 | 20 (14.2%) | 11 (11.0%) |
| $65,000 to $74,999 | 10 (7.1%) | 0 (0.0%) |
| $75,000 to $99,999 | 17 (12.1%) | 4 (4.0%) |
| $100,000+ | 18 (12.8%) | 2 (2.0%) |
| Total | 141 (100.0%) | 100 (100.0%) |
Earnings by Sex by Educational Attainment in Winchester
Average earnings in Winchester are $52,500 for men and $26,875 for women, a difference of 48.8%. Men with an educational attainment of bachelor's degree enjoy the highest average annual earnings of $84,643, while those with high school diploma education earn the least with $44,750. Women with an educational attainment of graduate degree earn the most with the average annual earnings of $78,750, while those with high school diploma education have the smallest earnings of $21,667.
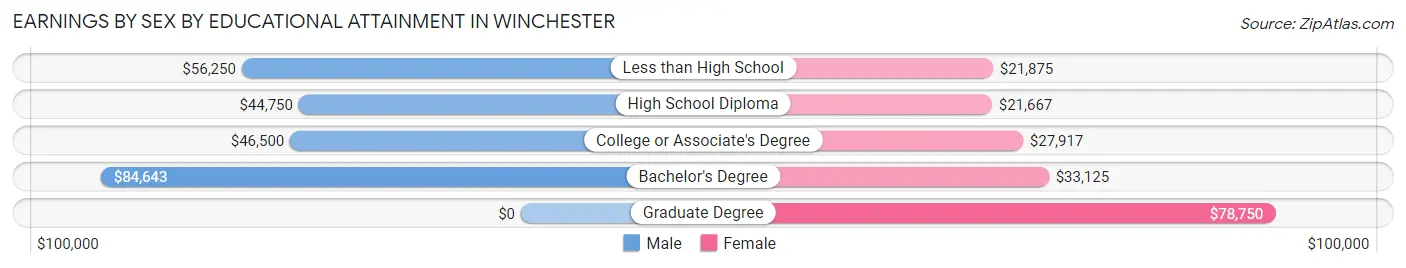
| Educational Attainment | Male Income | Female Income |
| Less than High School | $56,250 | $21,875 |
| High School Diploma | $44,750 | $21,667 |
| College or Associate's Degree | $46,500 | $27,917 |
| Bachelor's Degree | $84,643 | $33,125 |
| Graduate Degree | - | - |
| Total | $52,500 | $26,875 |
Family Income in Winchester
Family Income Brackets in Winchester
According to the Winchester family income data, there are 36 families falling into the $50,000 to $74,999 income range, which is the most common income bracket and makes up 23.2% of all families. Conversely, the less than $10,000 income bracket is the least frequent group with only 2 families (1.3%) belonging to this category.
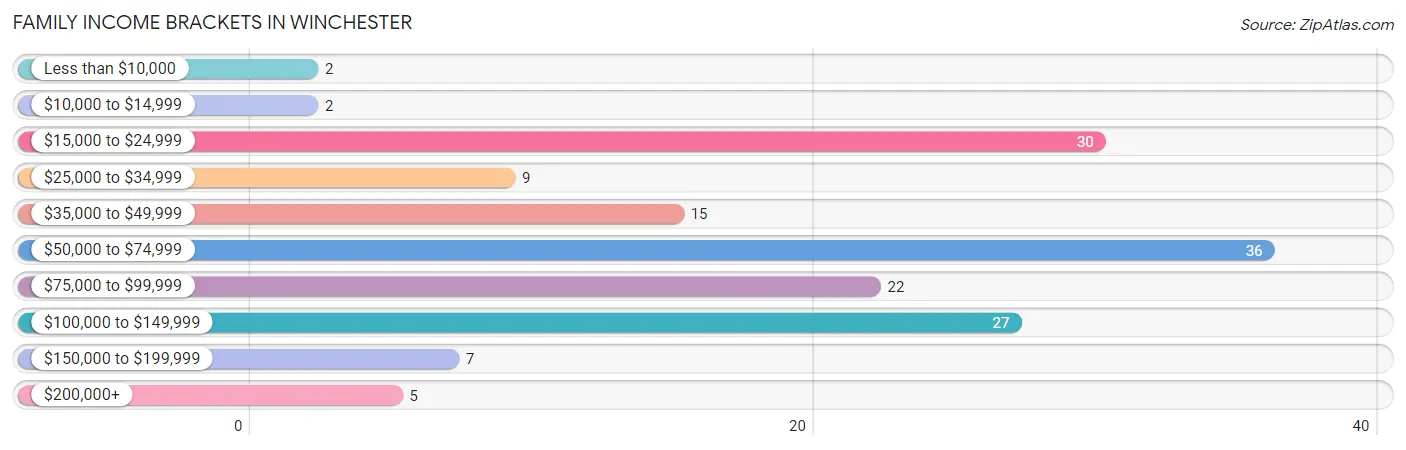
| Income Bracket | # Families | % Families |
| Less than $10,000 | 2 | 1.3% |
| $10,000 to $14,999 | 2 | 1.3% |
| $15,000 to $24,999 | 30 | 19.4% |
| $25,000 to $34,999 | 9 | 5.8% |
| $35,000 to $49,999 | 15 | 9.7% |
| $50,000 to $74,999 | 36 | 23.2% |
| $75,000 to $99,999 | 22 | 14.2% |
| $100,000 to $149,999 | 27 | 17.4% |
| $150,000 to $199,999 | 7 | 4.5% |
| $200,000+ | 5 | 3.2% |
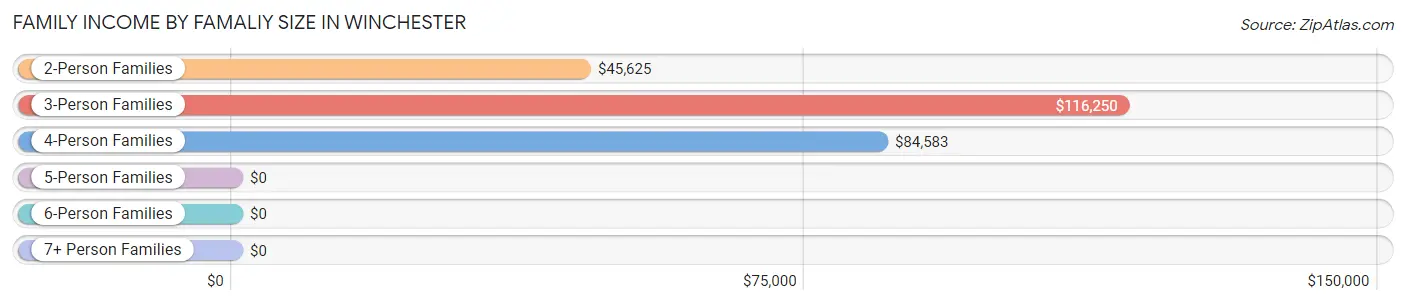
Family Income by Famaliy Size in Winchester
3-person families (25 | 16.1%) account for the highest median family income in Winchester with $116,250 per family, while 3-person families (25 | 16.1%) have the highest median income of $38,750 per family member.
| Income Bracket | # Families | Median Income |
| 2-Person Families | 91 (58.7%) | $45,625 |
| 3-Person Families | 25 (16.1%) | $116,250 |
| 4-Person Families | 23 (14.8%) | $84,583 |
| 5-Person Families | 14 (9.0%) | $0 |
| 6-Person Families | 0 (0.0%) | $0 |
| 7+ Person Families | 2 (1.3%) | $0 |
| Total | 155 (100.0%) | $57,396 |
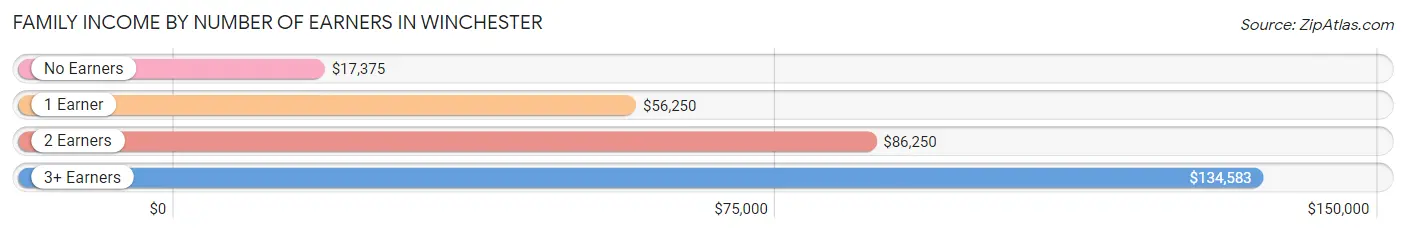
Family Income by Number of Earners in Winchester
The median family income in Winchester is $57,396, with families comprising 3+ earners (21) having the highest median family income of $134,583, while families with no earners (46) have the lowest median family income of $17,375, accounting for 13.6% and 29.7% of families, respectively.
| Number of Earners | # Families | Median Income |
| No Earners | 46 (29.7%) | $17,375 |
| 1 Earner | 42 (27.1%) | $56,250 |
| 2 Earners | 46 (29.7%) | $86,250 |
| 3+ Earners | 21 (13.6%) | $134,583 |
| Total | 155 (100.0%) | $57,396 |
Household Income in Winchester
Household Income Brackets in Winchester
With 52 households falling in the category, the $50,000 to $74,999 income range is the most frequent in Winchester, accounting for 26.0% of all households. In contrast, only 5 households (2.5%) fall into the $200,000+ income bracket, making it the least populous group.
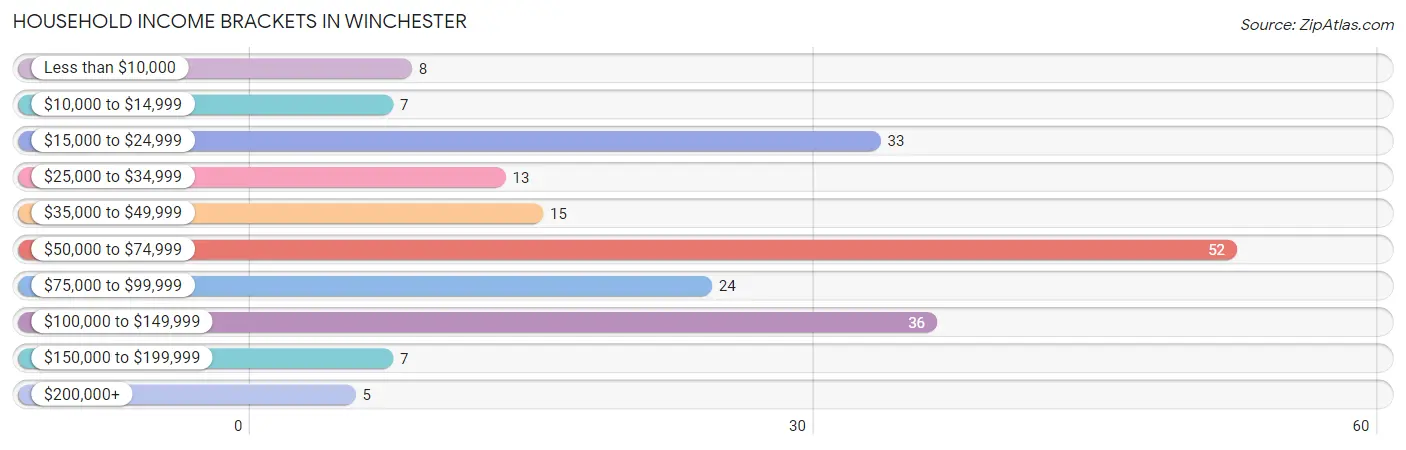
| Income Bracket | # Households | % Households |
| Less than $10,000 | 8 | 4.0% |
| $10,000 to $14,999 | 7 | 3.5% |
| $15,000 to $24,999 | 33 | 16.5% |
| $25,000 to $34,999 | 13 | 6.5% |
| $35,000 to $49,999 | 15 | 7.5% |
| $50,000 to $74,999 | 52 | 26.0% |
| $75,000 to $99,999 | 24 | 12.0% |
| $100,000 to $149,999 | 36 | 18.0% |
| $150,000 to $199,999 | 7 | 3.5% |
| $200,000+ | 5 | 2.5% |
Household Income by Householder Age in Winchester
The median household income in Winchester is $57,813, with the highest median household income of $69,375 found in the 25 to 44 years age bracket for the primary householder. A total of 57 households (28.5%) fall into this category. Meanwhile, the 15 to 24 years age bracket for the primary householder has the lowest median household income of $0, with 4 households (2.0%) in this group.
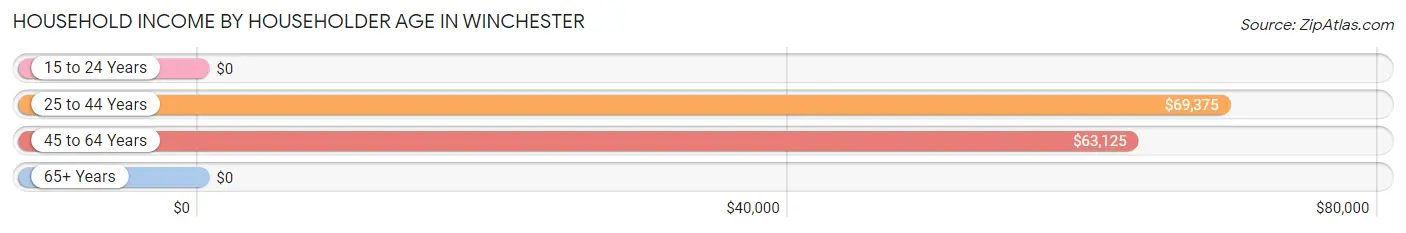
| Income Bracket | # Households | Median Income |
| 15 to 24 Years | 4 (2.0%) | $0 |
| 25 to 44 Years | 57 (28.5%) | $69,375 |
| 45 to 64 Years | 77 (38.5%) | $63,125 |
| 65+ Years | 62 (31.0%) | $0 |
| Total | 200 (100.0%) | $57,813 |
Poverty in Winchester
Income Below Poverty by Sex and Age in Winchester
With 19.2% poverty level for males and 12.0% for females among the residents of Winchester, 75 year old and over males and 75 year old and over females are the most vulnerable to poverty, with 20 males (66.7%) and 3 females (30.0%) in their respective age groups living below the poverty level.
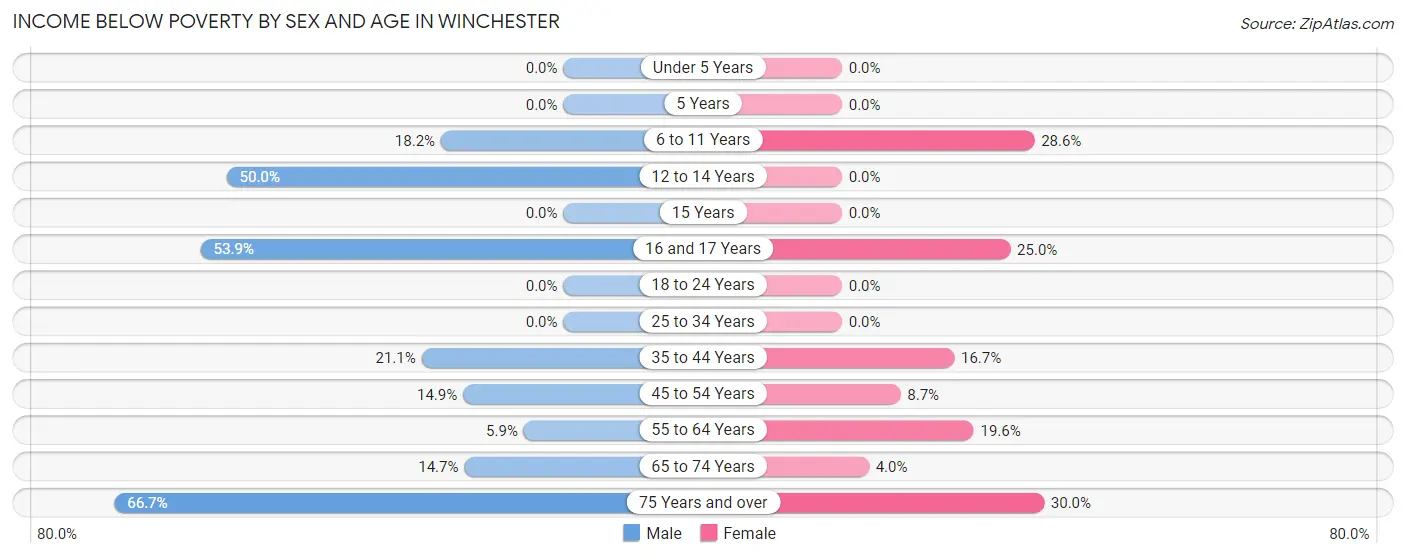
| Age Bracket | Male | Female |
| Under 5 Years | 0 (0.0%) | 0 (0.0%) |
| 5 Years | 0 (0.0%) | 0 (0.0%) |
| 6 to 11 Years | 4 (18.2%) | 4 (28.6%) |
| 12 to 14 Years | 2 (50.0%) | 0 (0.0%) |
| 15 Years | 0 (0.0%) | 0 (0.0%) |
| 16 and 17 Years | 7 (53.8%) | 3 (25.0%) |
| 18 to 24 Years | 0 (0.0%) | 0 (0.0%) |
| 25 to 34 Years | 0 (0.0%) | 0 (0.0%) |
| 35 to 44 Years | 8 (21.0%) | 5 (16.7%) |
| 45 to 54 Years | 7 (14.9%) | 2 (8.7%) |
| 55 to 64 Years | 2 (5.9%) | 9 (19.6%) |
| 65 to 74 Years | 5 (14.7%) | 1 (4.0%) |
| 75 Years and over | 20 (66.7%) | 3 (30.0%) |
| Total | 55 (19.2%) | 27 (12.0%) |
Income Above Poverty by Sex and Age in Winchester
According to the poverty statistics in Winchester, males aged under 5 years and females aged under 5 years are the age groups that are most secure financially, with 100.0% of males and 100.0% of females in these age groups living above the poverty line.
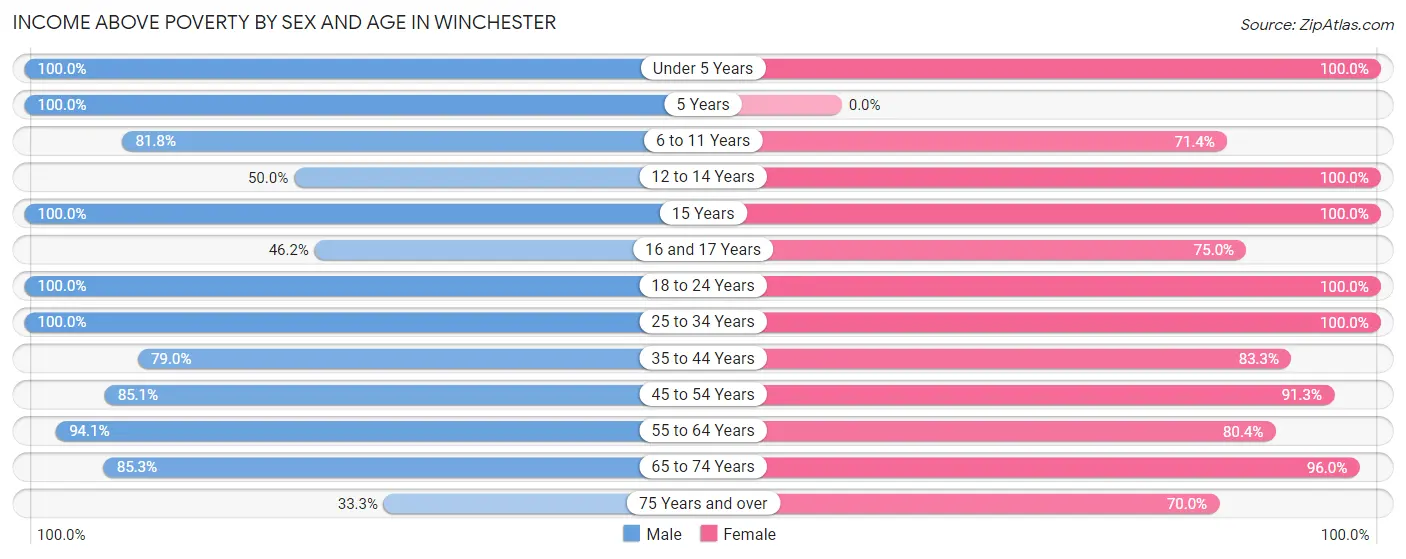
| Age Bracket | Male | Female |
| Under 5 Years | 23 (100.0%) | 10 (100.0%) |
| 5 Years | 9 (100.0%) | 0 (0.0%) |
| 6 to 11 Years | 18 (81.8%) | 10 (71.4%) |
| 12 to 14 Years | 2 (50.0%) | 8 (100.0%) |
| 15 Years | 2 (100.0%) | 9 (100.0%) |
| 16 and 17 Years | 6 (46.2%) | 9 (75.0%) |
| 18 to 24 Years | 9 (100.0%) | 16 (100.0%) |
| 25 to 34 Years | 21 (100.0%) | 22 (100.0%) |
| 35 to 44 Years | 30 (78.9%) | 25 (83.3%) |
| 45 to 54 Years | 40 (85.1%) | 21 (91.3%) |
| 55 to 64 Years | 32 (94.1%) | 37 (80.4%) |
| 65 to 74 Years | 29 (85.3%) | 24 (96.0%) |
| 75 Years and over | 10 (33.3%) | 7 (70.0%) |
| Total | 231 (80.8%) | 198 (88.0%) |
Income Below Poverty Among Married-Couple Families in Winchester
The poverty statistics for married-couple families in Winchester show that 6.5% or 7 of the total 107 families live below the poverty line. Families with 3 or 4 children have the highest poverty rate of 14.3%, comprising of 2 families. On the other hand, families with 1 or 2 children have the lowest poverty rate of 0.0%, which includes 0 families.
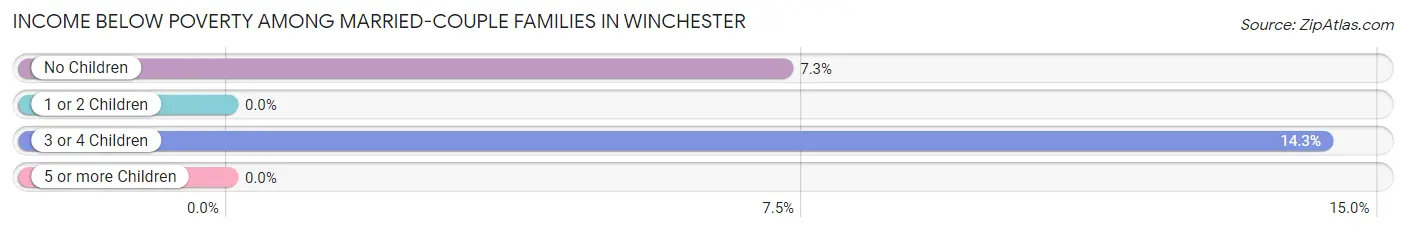
| Children | Above Poverty | Below Poverty |
| No Children | 64 (92.7%) | 5 (7.2%) |
| 1 or 2 Children | 24 (100.0%) | 0 (0.0%) |
| 3 or 4 Children | 12 (85.7%) | 2 (14.3%) |
| 5 or more Children | 0 (0.0%) | 0 (0.0%) |
| Total | 100 (93.5%) | 7 (6.5%) |
Income Below Poverty Among Single-Parent Households in Winchester
According to the poverty data in Winchester, 57.6% or 19 single-father households and 20.0% or 3 single-mother households are living below the poverty line. Among single-father households, those with 1 or 2 children have the highest poverty rate, with 19 households (65.5%) experiencing poverty. Likewise, among single-mother households, those with 1 or 2 children have the highest poverty rate, with 3 households (42.9%) falling below the poverty line.
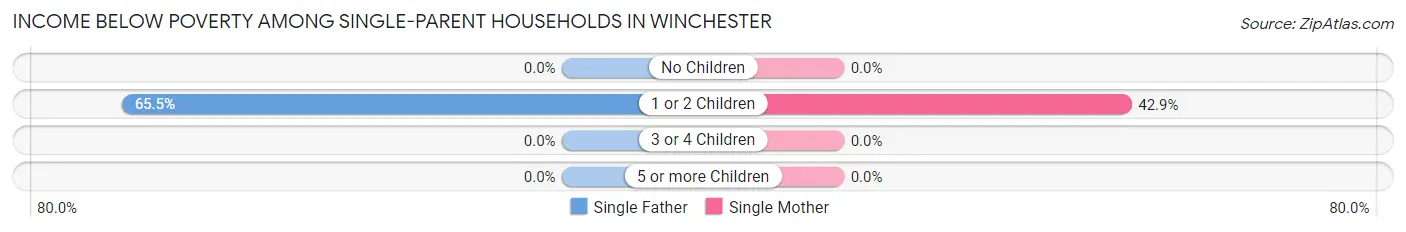
| Children | Single Father | Single Mother |
| No Children | 0 (0.0%) | 0 (0.0%) |
| 1 or 2 Children | 19 (65.5%) | 3 (42.9%) |
| 3 or 4 Children | 0 (0.0%) | 0 (0.0%) |
| 5 or more Children | 0 (0.0%) | 0 (0.0%) |
| Total | 19 (57.6%) | 3 (20.0%) |
Income Below Poverty Among Married-Couple vs Single-Parent Households in Winchester
The poverty data for Winchester shows that 7 of the married-couple family households (6.5%) and 22 of the single-parent households (45.8%) are living below the poverty level. Within the married-couple family households, those with 3 or 4 children have the highest poverty rate, with 2 households (14.3%) falling below the poverty line. Among the single-parent households, those with 1 or 2 children have the highest poverty rate, with 22 household (61.1%) living below poverty.
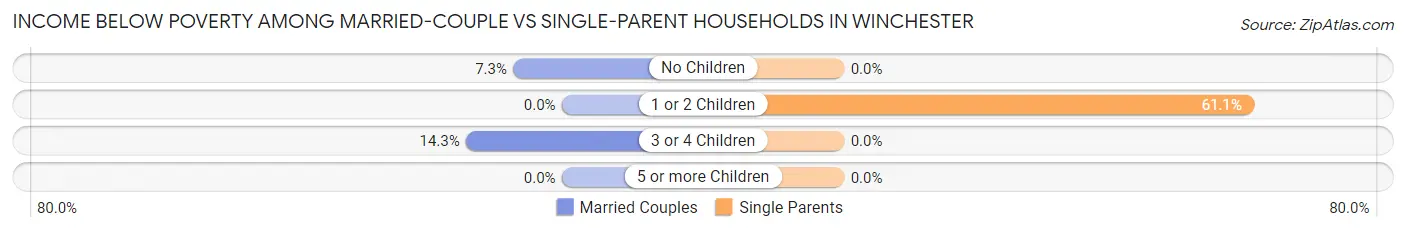
| Children | Married-Couple Families | Single-Parent Households |
| No Children | 5 (7.2%) | 0 (0.0%) |
| 1 or 2 Children | 0 (0.0%) | 22 (61.1%) |
| 3 or 4 Children | 2 (14.3%) | 0 (0.0%) |
| 5 or more Children | 0 (0.0%) | 0 (0.0%) |
| Total | 7 (6.5%) | 22 (45.8%) |
Employment Characteristics in Winchester
Employment by Class of Employer in Winchester
Among the 193 employed individuals in Winchester, private company employees (149 | 77.2%), not-for-profit organizations (10 | 5.2%), and self-employed (not incorporated) (9 | 4.7%) make up the most common classes of employment.
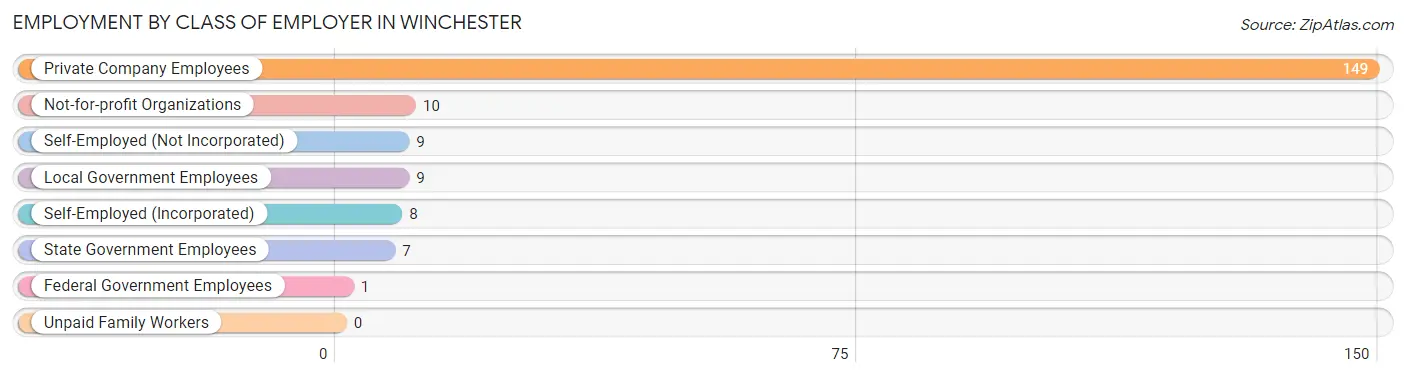
| Employer Class | # Employees | % Employees |
| Private Company Employees | 149 | 77.2% |
| Self-Employed (Incorporated) | 8 | 4.2% |
| Self-Employed (Not Incorporated) | 9 | 4.7% |
| Not-for-profit Organizations | 10 | 5.2% |
| Local Government Employees | 9 | 4.7% |
| State Government Employees | 7 | 3.6% |
| Federal Government Employees | 1 | 0.5% |
| Unpaid Family Workers | 0 | 0.0% |
| Total | 193 | 100.0% |
Employment Status by Age in Winchester
According to the labor force statistics for Winchester, out of the total population over 16 years of age (410), 52.9% or 217 individuals are in the labor force, with 6.0% or 13 of them unemployed. The age group with the highest labor force participation rate is 30 to 34 years, with 89.5% or 17 individuals in the labor force. Within the labor force, the 65 to 74 years age range has the highest percentage of unemployed individuals, with 22.2% or 2 of them being unemployed.
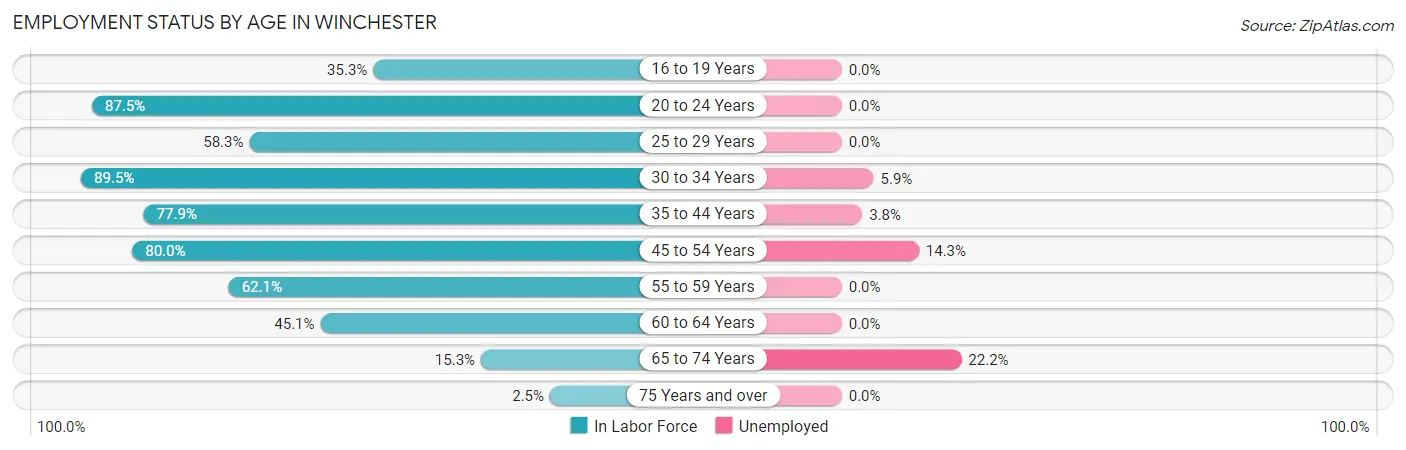
| Age Bracket | In Labor Force | Unemployed |
| 16 to 19 Years | 12 (35.3%) | 0 (0.0%) |
| 20 to 24 Years | 14 (87.5%) | 0 (0.0%) |
| 25 to 29 Years | 14 (58.3%) | 0 (0.0%) |
| 30 to 34 Years | 17 (89.5%) | 1 (5.9%) |
| 35 to 44 Years | 53 (77.9%) | 2 (3.8%) |
| 45 to 54 Years | 56 (80.0%) | 8 (14.3%) |
| 55 to 59 Years | 18 (62.1%) | 0 (0.0%) |
| 60 to 64 Years | 23 (45.1%) | 0 (0.0%) |
| 65 to 74 Years | 9 (15.3%) | 2 (22.2%) |
| 75 Years and over | 1 (2.5%) | 0 (0.0%) |
| Total | 217 (52.9%) | 13 (6.0%) |
Employment Status by Educational Attainment in Winchester
According to labor force statistics for Winchester, 69.3% of individuals (181) out of the total population between 25 and 64 years of age (261) are in the labor force, with 6.1% or 11 of them being unemployed. The group with the highest labor force participation rate are those with the educational attainment of bachelor's degree or higher, with 86.3% or 44 individuals in the labor force. Within the labor force, individuals with less than high school education have the highest percentage of unemployment, with 25.0% or 3 of them being unemployed.
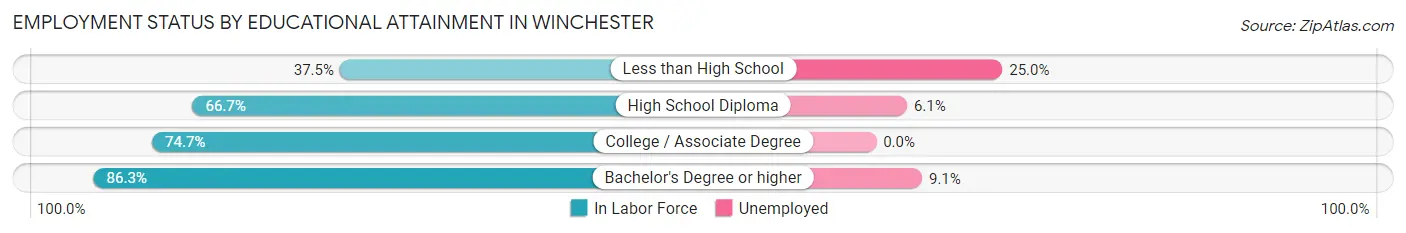
| Educational Attainment | In Labor Force | Unemployed |
| Less than High School | 12 (37.5%) | 8 (25.0%) |
| High School Diploma | 66 (66.7%) | 6 (6.1%) |
| College / Associate Degree | 59 (74.7%) | 0 (0.0%) |
| Bachelor's Degree or higher | 44 (86.3%) | 5 (9.1%) |
| Total | 181 (69.3%) | 16 (6.1%) |
Employment Occupations by Sex in Winchester
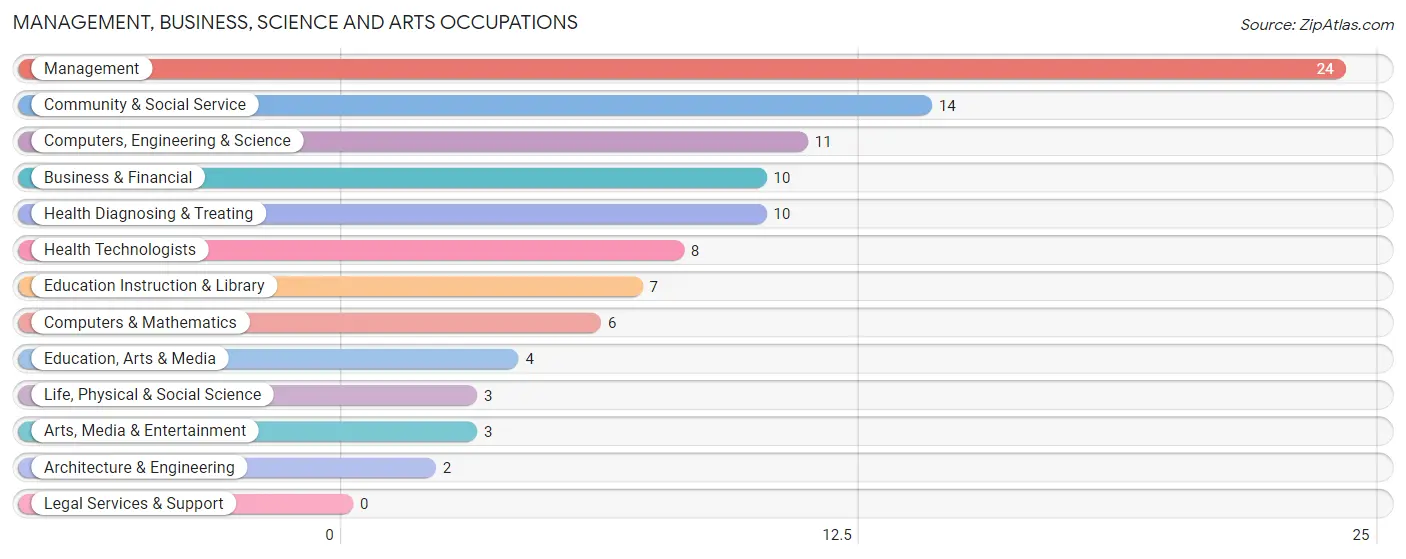
Management, Business, Science and Arts Occupations
The most common Management, Business, Science and Arts occupations in Winchester are Management (24 | 11.8%), Community & Social Service (14 | 6.9%), Computers, Engineering & Science (11 | 5.4%), Business & Financial (10 | 4.9%), and Health Diagnosing & Treating (10 | 4.9%).
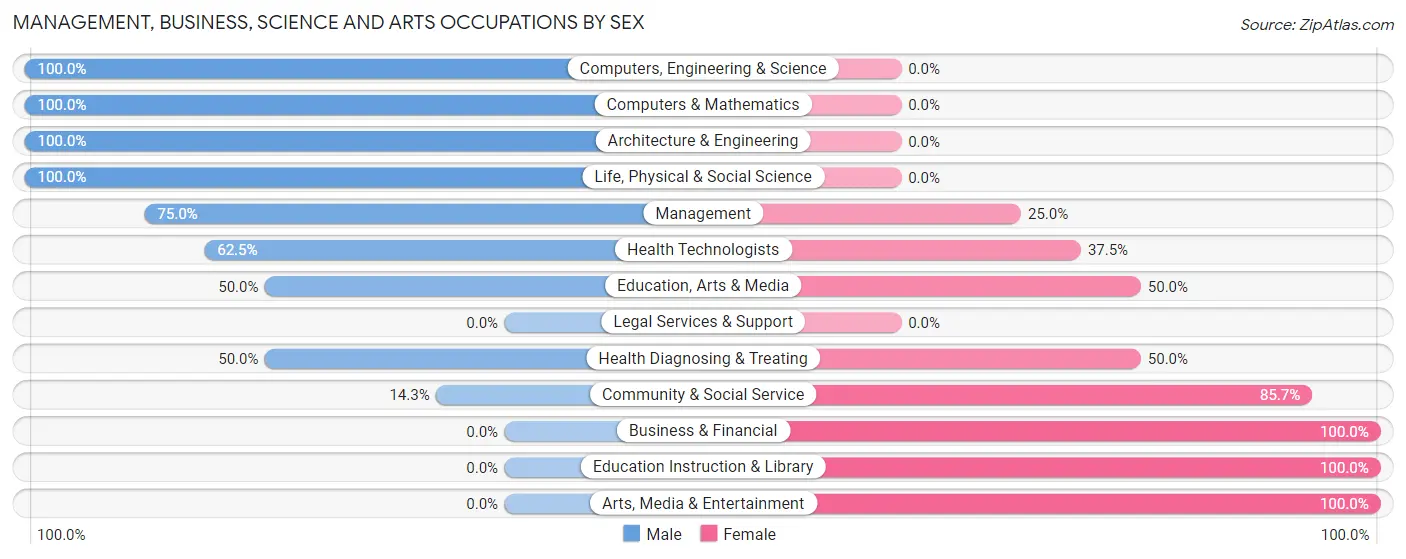
Management, Business, Science and Arts Occupations by Sex
Within the Management, Business, Science and Arts occupations in Winchester, the most male-oriented occupations are Computers, Engineering & Science (100.0%), Computers & Mathematics (100.0%), and Architecture & Engineering (100.0%), while the most female-oriented occupations are Business & Financial (100.0%), Education Instruction & Library (100.0%), and Arts, Media & Entertainment (100.0%).
| Occupation | Male | Female |
| Management | 18 (75.0%) | 6 (25.0%) |
| Business & Financial | 0 (0.0%) | 10 (100.0%) |
| Computers, Engineering & Science | 11 (100.0%) | 0 (0.0%) |
| Computers & Mathematics | 6 (100.0%) | 0 (0.0%) |
| Architecture & Engineering | 2 (100.0%) | 0 (0.0%) |
| Life, Physical & Social Science | 3 (100.0%) | 0 (0.0%) |
| Community & Social Service | 2 (14.3%) | 12 (85.7%) |
| Education, Arts & Media | 2 (50.0%) | 2 (50.0%) |
| Legal Services & Support | 0 (0.0%) | 0 (0.0%) |
| Education Instruction & Library | 0 (0.0%) | 7 (100.0%) |
| Arts, Media & Entertainment | 0 (0.0%) | 3 (100.0%) |
| Health Diagnosing & Treating | 5 (50.0%) | 5 (50.0%) |
| Health Technologists | 5 (62.5%) | 3 (37.5%) |
| Total (Category) | 36 (52.2%) | 33 (47.8%) |
| Total (Overall) | 123 (60.3%) | 81 (39.7%) |
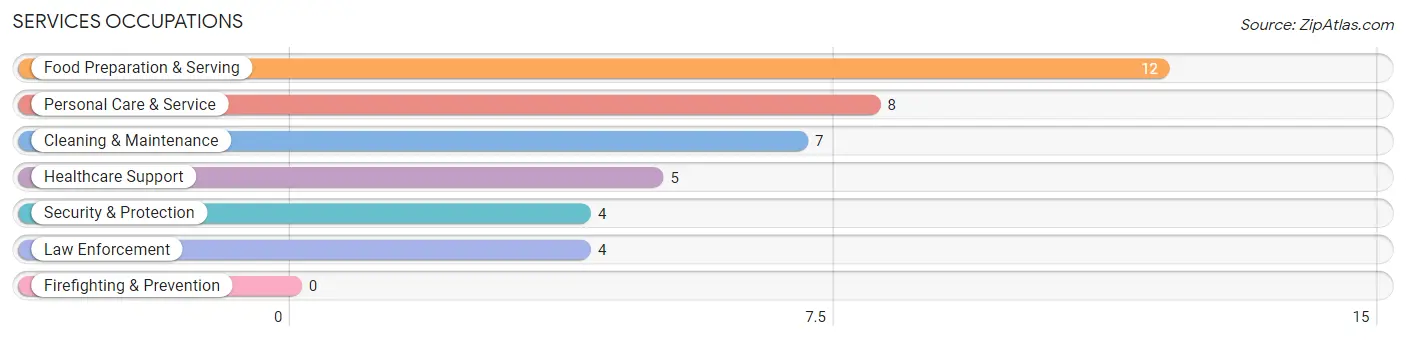
Services Occupations
The most common Services occupations in Winchester are Food Preparation & Serving (12 | 5.9%), Personal Care & Service (8 | 3.9%), Cleaning & Maintenance (7 | 3.4%), Healthcare Support (5 | 2.5%), and Security & Protection (4 | 2.0%).
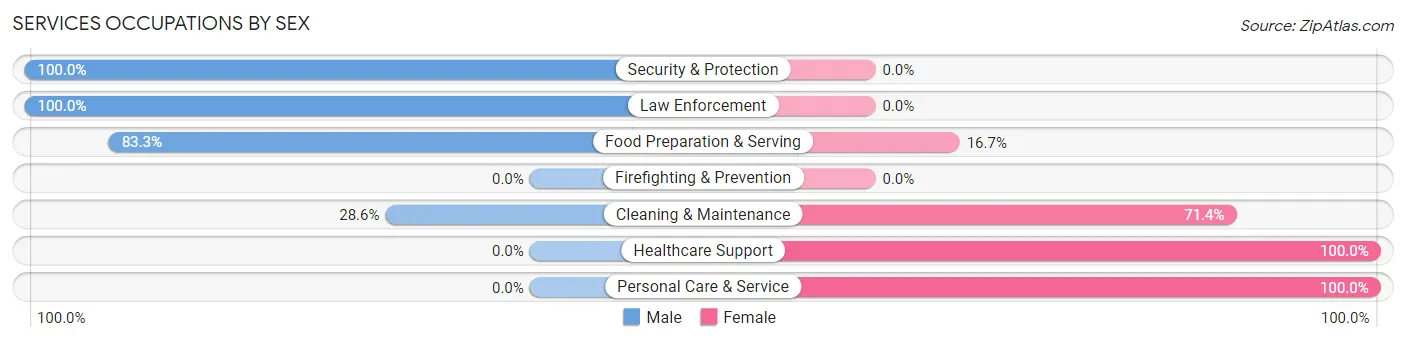
Services Occupations by Sex
Within the Services occupations in Winchester, the most male-oriented occupations are Security & Protection (100.0%), Law Enforcement (100.0%), and Food Preparation & Serving (83.3%), while the most female-oriented occupations are Healthcare Support (100.0%), Personal Care & Service (100.0%), and Cleaning & Maintenance (71.4%).
| Occupation | Male | Female |
| Healthcare Support | 0 (0.0%) | 5 (100.0%) |
| Security & Protection | 4 (100.0%) | 0 (0.0%) |
| Firefighting & Prevention | 0 (0.0%) | 0 (0.0%) |
| Law Enforcement | 4 (100.0%) | 0 (0.0%) |
| Food Preparation & Serving | 10 (83.3%) | 2 (16.7%) |
| Cleaning & Maintenance | 2 (28.6%) | 5 (71.4%) |
| Personal Care & Service | 0 (0.0%) | 8 (100.0%) |
| Total (Category) | 16 (44.4%) | 20 (55.6%) |
| Total (Overall) | 123 (60.3%) | 81 (39.7%) |
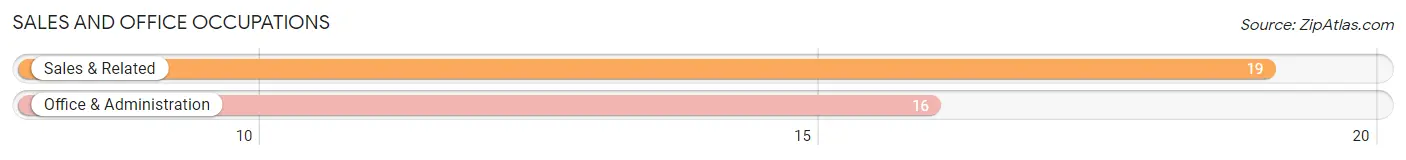
Sales and Office Occupations
The most common Sales and Office occupations in Winchester are Sales & Related (19 | 9.3%), and Office & Administration (16 | 7.8%).
Sales and Office Occupations by Sex
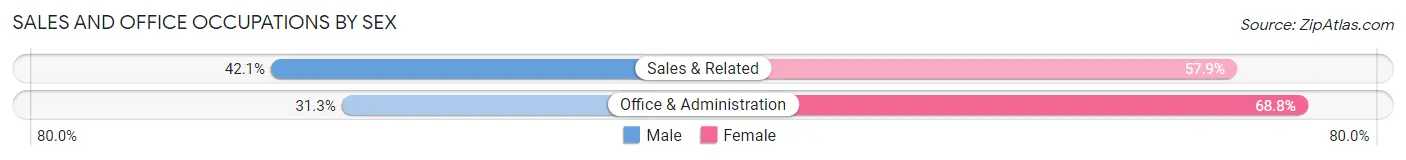
| Occupation | Male | Female |
| Sales & Related | 8 (42.1%) | 11 (57.9%) |
| Office & Administration | 5 (31.2%) | 11 (68.8%) |
| Total (Category) | 13 (37.1%) | 22 (62.9%) |
| Total (Overall) | 123 (60.3%) | 81 (39.7%) |
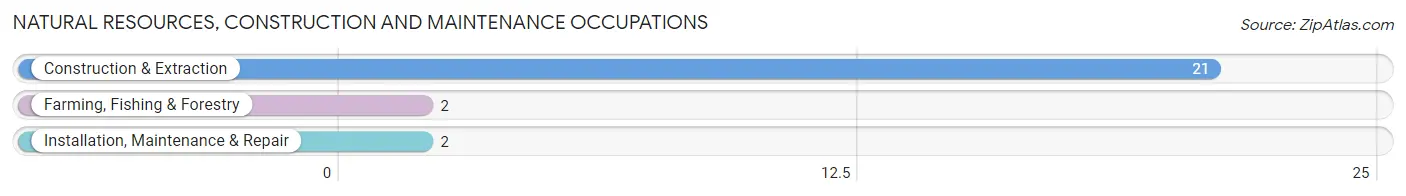
Natural Resources, Construction and Maintenance Occupations
The most common Natural Resources, Construction and Maintenance occupations in Winchester are Construction & Extraction (21 | 10.3%), Farming, Fishing & Forestry (2 | 1.0%), and Installation, Maintenance & Repair (2 | 1.0%).
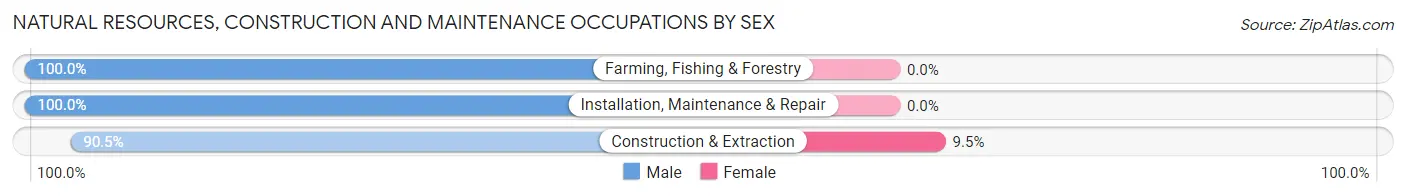
Natural Resources, Construction and Maintenance Occupations by Sex
| Occupation | Male | Female |
| Farming, Fishing & Forestry | 2 (100.0%) | 0 (0.0%) |
| Construction & Extraction | 19 (90.5%) | 2 (9.5%) |
| Installation, Maintenance & Repair | 2 (100.0%) | 0 (0.0%) |
| Total (Category) | 23 (92.0%) | 2 (8.0%) |
| Total (Overall) | 123 (60.3%) | 81 (39.7%) |
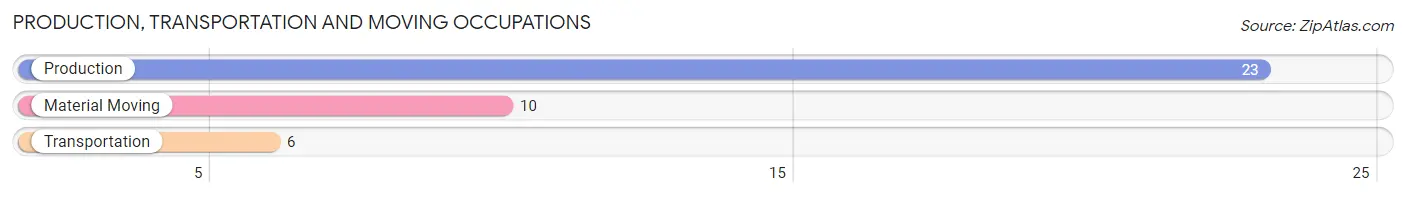
Production, Transportation and Moving Occupations
The most common Production, Transportation and Moving occupations in Winchester are Production (23 | 11.3%), Material Moving (10 | 4.9%), and Transportation (6 | 2.9%).
Production, Transportation and Moving Occupations by Sex
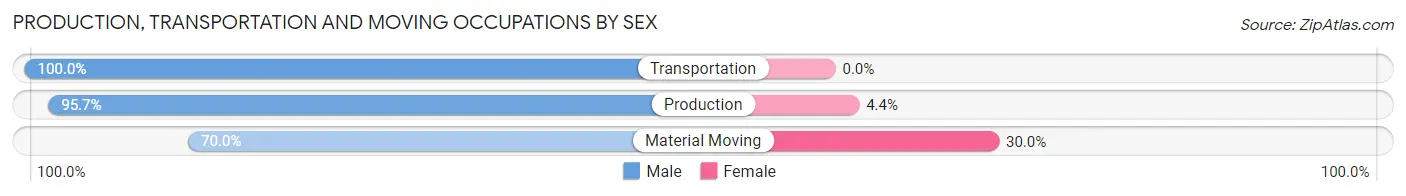
| Occupation | Male | Female |
| Production | 22 (95.7%) | 1 (4.3%) |
| Transportation | 6 (100.0%) | 0 (0.0%) |
| Material Moving | 7 (70.0%) | 3 (30.0%) |
| Total (Category) | 35 (89.7%) | 4 (10.3%) |
| Total (Overall) | 123 (60.3%) | 81 (39.7%) |
Employment Industries by Sex in Winchester
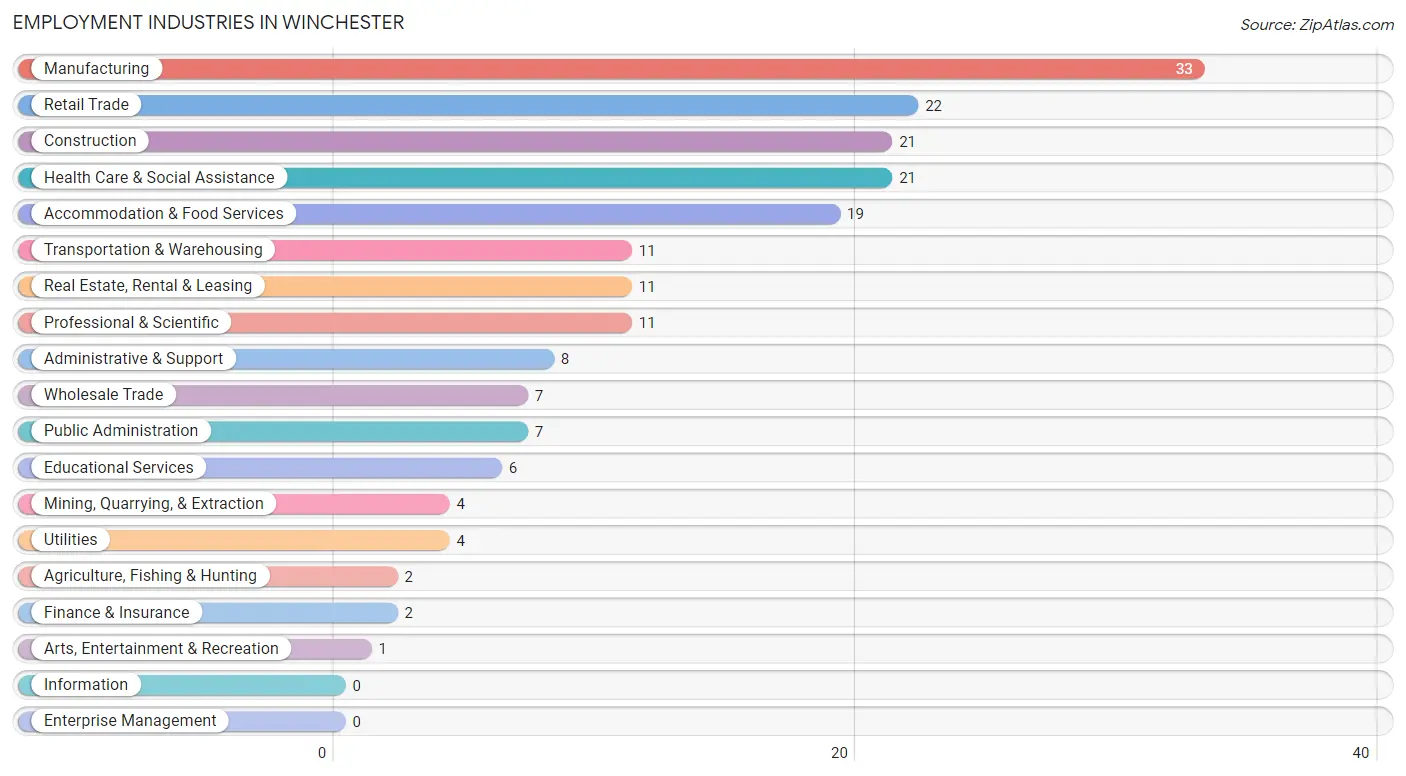
Employment Industries in Winchester
The major employment industries in Winchester include Manufacturing (33 | 16.2%), Retail Trade (22 | 10.8%), Construction (21 | 10.3%), Health Care & Social Assistance (21 | 10.3%), and Accommodation & Food Services (19 | 9.3%).
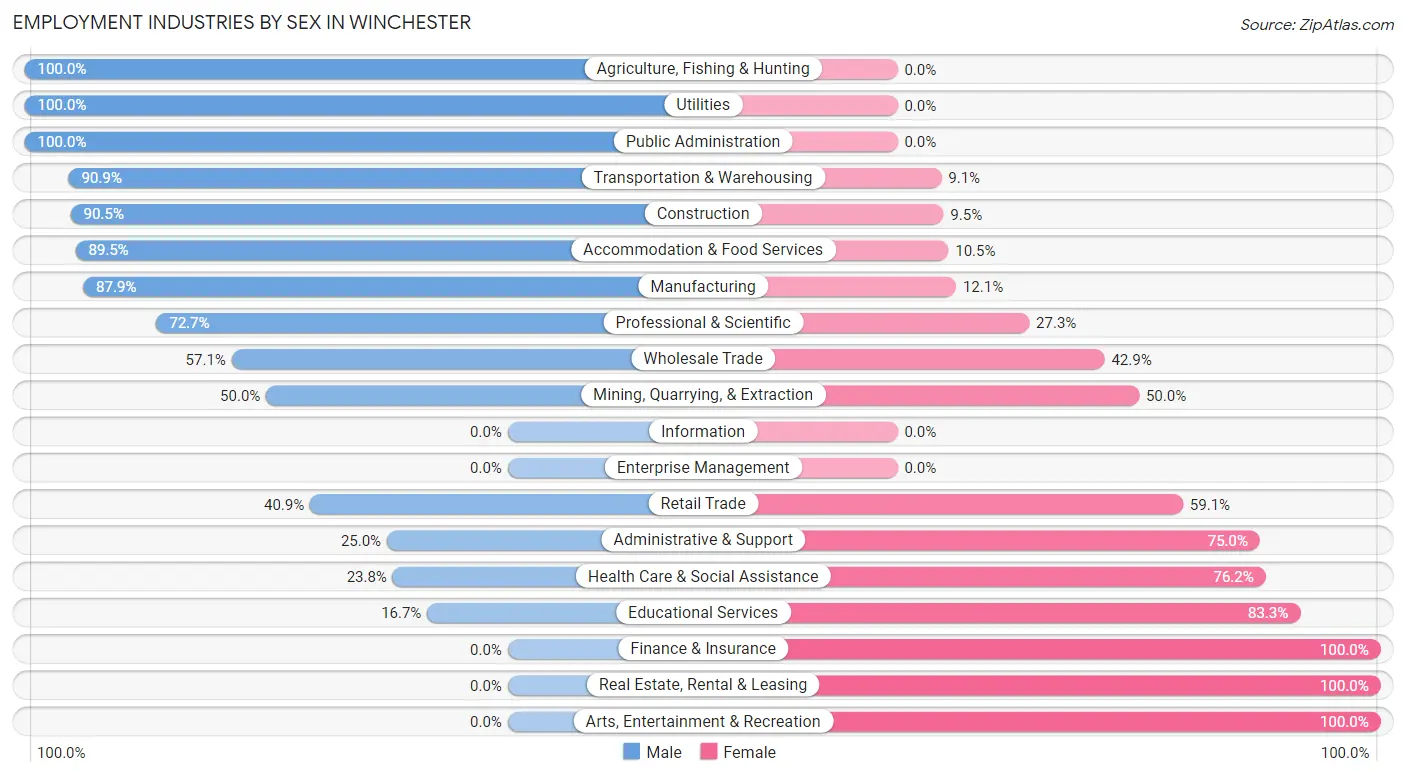
Employment Industries by Sex in Winchester
The Winchester industries that see more men than women are Agriculture, Fishing & Hunting (100.0%), Utilities (100.0%), and Public Administration (100.0%), whereas the industries that tend to have a higher number of women are Finance & Insurance (100.0%), Real Estate, Rental & Leasing (100.0%), and Arts, Entertainment & Recreation (100.0%).
| Industry | Male | Female |
| Agriculture, Fishing & Hunting | 2 (100.0%) | 0 (0.0%) |
| Mining, Quarrying, & Extraction | 2 (50.0%) | 2 (50.0%) |
| Construction | 19 (90.5%) | 2 (9.5%) |
| Manufacturing | 29 (87.9%) | 4 (12.1%) |
| Wholesale Trade | 4 (57.1%) | 3 (42.9%) |
| Retail Trade | 9 (40.9%) | 13 (59.1%) |
| Transportation & Warehousing | 10 (90.9%) | 1 (9.1%) |
| Utilities | 4 (100.0%) | 0 (0.0%) |
| Information | 0 (0.0%) | 0 (0.0%) |
| Finance & Insurance | 0 (0.0%) | 2 (100.0%) |
| Real Estate, Rental & Leasing | 0 (0.0%) | 11 (100.0%) |
| Professional & Scientific | 8 (72.7%) | 3 (27.3%) |
| Enterprise Management | 0 (0.0%) | 0 (0.0%) |
| Administrative & Support | 2 (25.0%) | 6 (75.0%) |
| Educational Services | 1 (16.7%) | 5 (83.3%) |
| Health Care & Social Assistance | 5 (23.8%) | 16 (76.2%) |
| Arts, Entertainment & Recreation | 0 (0.0%) | 1 (100.0%) |
| Accommodation & Food Services | 17 (89.5%) | 2 (10.5%) |
| Public Administration | 7 (100.0%) | 0 (0.0%) |
| Total | 123 (60.3%) | 81 (39.7%) |
Education in Winchester
School Enrollment in Winchester
The most common levels of schooling among the 124 students in Winchester are high school (48 | 38.7%), elementary school (30 | 24.2%), and middle school (20 | 16.1%).
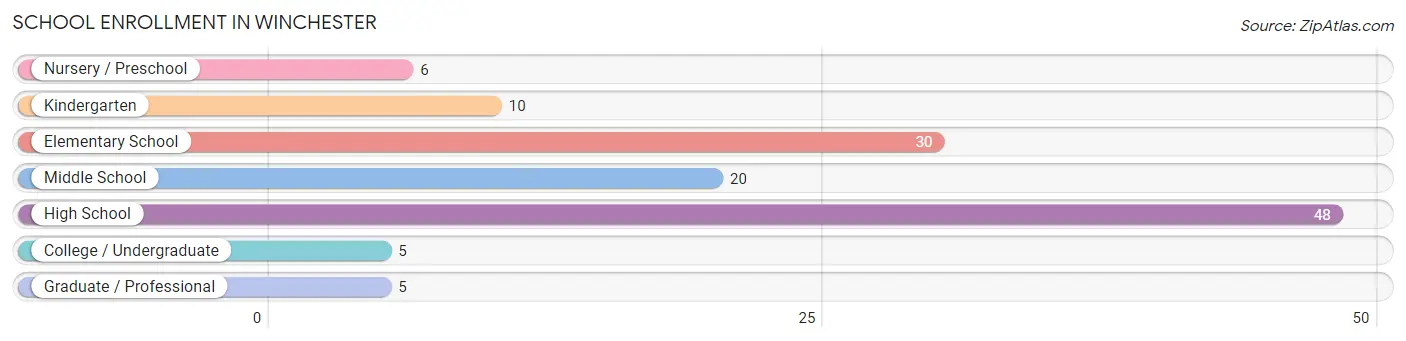
| School Level | # Students | % Students |
| Nursery / Preschool | 6 | 4.8% |
| Kindergarten | 10 | 8.1% |
| Elementary School | 30 | 24.2% |
| Middle School | 20 | 16.1% |
| High School | 48 | 38.7% |
| College / Undergraduate | 5 | 4.0% |
| Graduate / Professional | 5 | 4.0% |
| Total | 124 | 100.0% |
School Enrollment by Age by Funding Source in Winchester
Out of a total of 124 students who are enrolled in schools in Winchester, 50 (40.3%) attend a private institution, while the remaining 74 (59.7%) are enrolled in public schools. The age group of 18 to 19 year olds has the highest likelihood of being enrolled in private schools, with 3 (75.0% in the age bracket) enrolled. Conversely, the age group of 3 to 4 year olds has the lowest likelihood of being enrolled in a private school, with 1 (100.0% in the age bracket) attending a public institution.
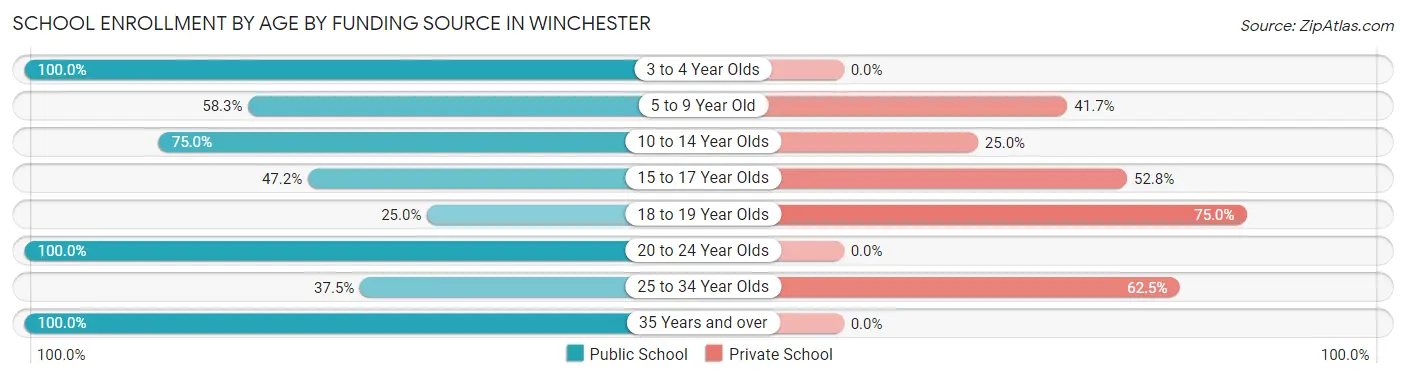
| Age Bracket | Public School | Private School |
| 3 to 4 Year Olds | 1 (100.0%) | 0 (0.0%) |
| 5 to 9 Year Old | 21 (58.3%) | 15 (41.7%) |
| 10 to 14 Year Olds | 24 (75.0%) | 8 (25.0%) |
| 15 to 17 Year Olds | 17 (47.2%) | 19 (52.8%) |
| 18 to 19 Year Olds | 1 (25.0%) | 3 (75.0%) |
| 20 to 24 Year Olds | 2 (100.0%) | 0 (0.0%) |
| 25 to 34 Year Olds | 3 (37.5%) | 5 (62.5%) |
| 35 Years and over | 5 (100.0%) | 0 (0.0%) |
| Total | 74 (59.7%) | 50 (40.3%) |
Educational Attainment by Field of Study in Winchester
Business (16 | 20.5%), arts & humanities (16 | 20.5%), education (13 | 16.7%), science & technology (10 | 12.8%), and computers & mathematics (4 | 5.1%) are the most common fields of study among 78 individuals in Winchester who have obtained a bachelor's degree or higher.
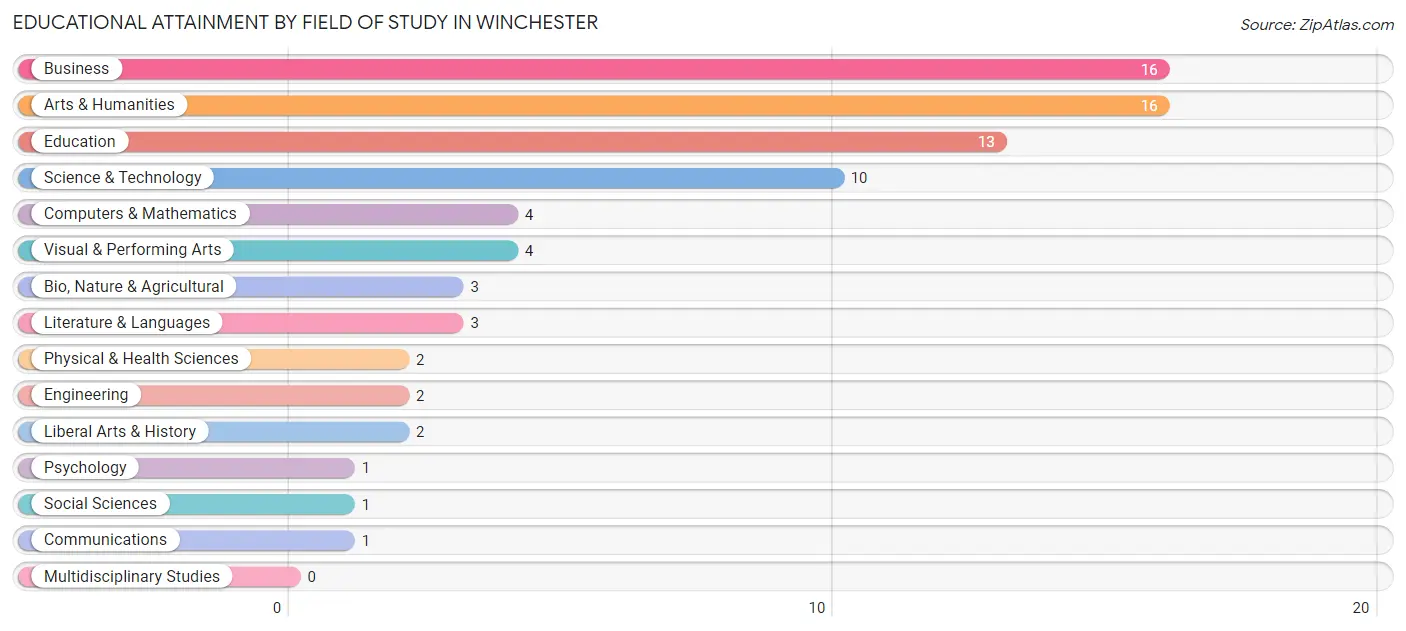
| Field of Study | # Graduates | % Graduates |
| Computers & Mathematics | 4 | 5.1% |
| Bio, Nature & Agricultural | 3 | 3.8% |
| Physical & Health Sciences | 2 | 2.6% |
| Psychology | 1 | 1.3% |
| Social Sciences | 1 | 1.3% |
| Engineering | 2 | 2.6% |
| Multidisciplinary Studies | 0 | 0.0% |
| Science & Technology | 10 | 12.8% |
| Business | 16 | 20.5% |
| Education | 13 | 16.7% |
| Literature & Languages | 3 | 3.8% |
| Liberal Arts & History | 2 | 2.6% |
| Visual & Performing Arts | 4 | 5.1% |
| Communications | 1 | 1.3% |
| Arts & Humanities | 16 | 20.5% |
| Total | 78 | 100.0% |
Transportation & Commute in Winchester
Vehicle Availability by Sex in Winchester
The most prevalent vehicle ownership categories in Winchester are males with 3 vehicles (49, accounting for 40.5%) and females with 3 vehicles (29, making up 68.1%).
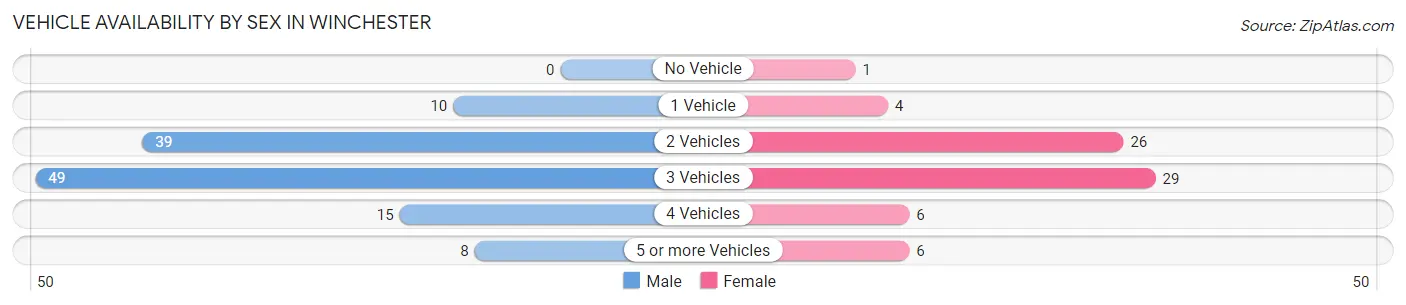
| Vehicles Available | Male | Female |
| No Vehicle | 0 (0.0%) | 1 (1.4%) |
| 1 Vehicle | 10 (8.3%) | 4 (5.6%) |
| 2 Vehicles | 39 (32.2%) | 26 (36.1%) |
| 3 Vehicles | 49 (40.5%) | 29 (40.3%) |
| 4 Vehicles | 15 (12.4%) | 6 (8.3%) |
| 5 or more Vehicles | 8 (6.6%) | 6 (8.3%) |
| Total | 121 (100.0%) | 72 (100.0%) |
Commute Time in Winchester
The most frequently occuring commute durations in Winchester are 30 to 34 minutes (30 commuters, 16.9%), 15 to 19 minutes (29 commuters, 16.3%), and 35 to 39 minutes (25 commuters, 14.0%).
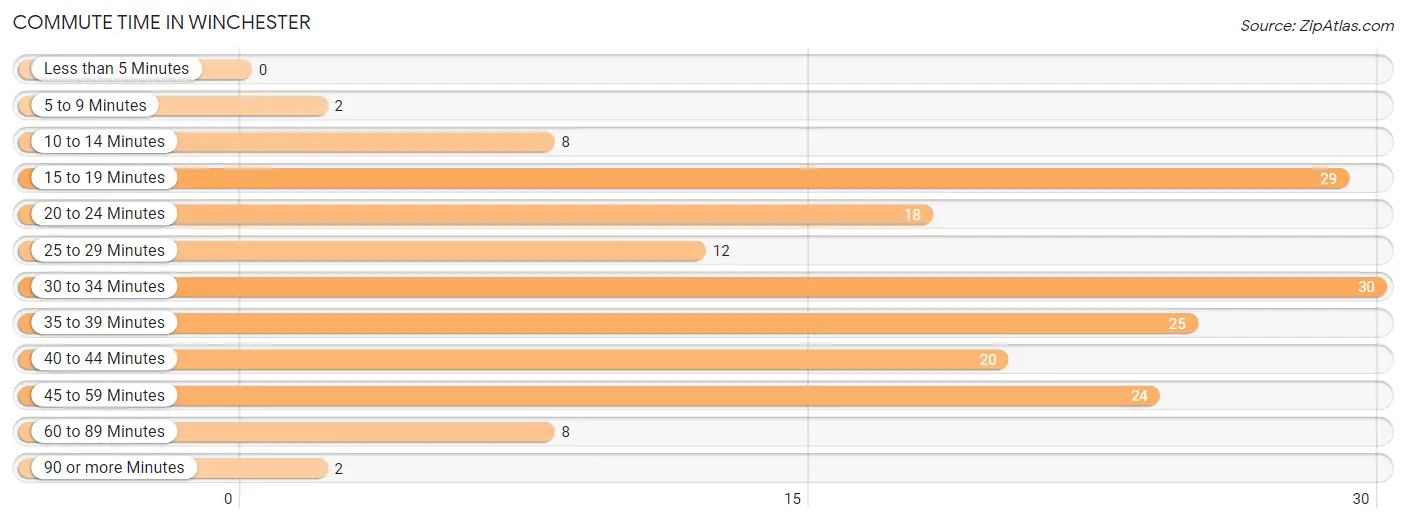
| Commute Time | # Commuters | % Commuters |
| Less than 5 Minutes | 0 | 0.0% |
| 5 to 9 Minutes | 2 | 1.1% |
| 10 to 14 Minutes | 8 | 4.5% |
| 15 to 19 Minutes | 29 | 16.3% |
| 20 to 24 Minutes | 18 | 10.1% |
| 25 to 29 Minutes | 12 | 6.7% |
| 30 to 34 Minutes | 30 | 16.9% |
| 35 to 39 Minutes | 25 | 14.0% |
| 40 to 44 Minutes | 20 | 11.2% |
| 45 to 59 Minutes | 24 | 13.5% |
| 60 to 89 Minutes | 8 | 4.5% |
| 90 or more Minutes | 2 | 1.1% |
Commute Time by Sex in Winchester
The most common commute times in Winchester are 35 to 39 minutes (23 commuters, 20.0%) for males and 30 to 34 minutes (16 commuters, 25.4%) for females.
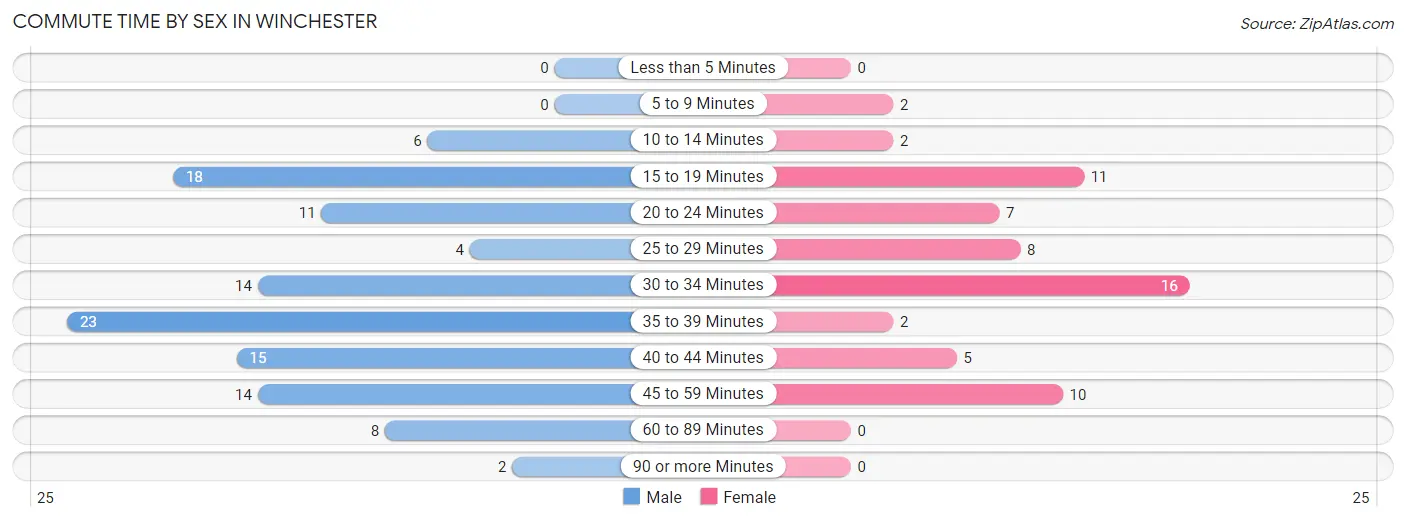
| Commute Time | Male | Female |
| Less than 5 Minutes | 0 (0.0%) | 0 (0.0%) |
| 5 to 9 Minutes | 0 (0.0%) | 2 (3.2%) |
| 10 to 14 Minutes | 6 (5.2%) | 2 (3.2%) |
| 15 to 19 Minutes | 18 (15.7%) | 11 (17.5%) |
| 20 to 24 Minutes | 11 (9.6%) | 7 (11.1%) |
| 25 to 29 Minutes | 4 (3.5%) | 8 (12.7%) |
| 30 to 34 Minutes | 14 (12.2%) | 16 (25.4%) |
| 35 to 39 Minutes | 23 (20.0%) | 2 (3.2%) |
| 40 to 44 Minutes | 15 (13.0%) | 5 (7.9%) |
| 45 to 59 Minutes | 14 (12.2%) | 10 (15.9%) |
| 60 to 89 Minutes | 8 (7.0%) | 0 (0.0%) |
| 90 or more Minutes | 2 (1.7%) | 0 (0.0%) |
Time of Departure to Work by Sex in Winchester
The most frequent times of departure to work in Winchester are 7:00 AM to 7:29 AM (22, 19.1%) for males and 7:30 AM to 7:59 AM (12, 19.1%) for females.
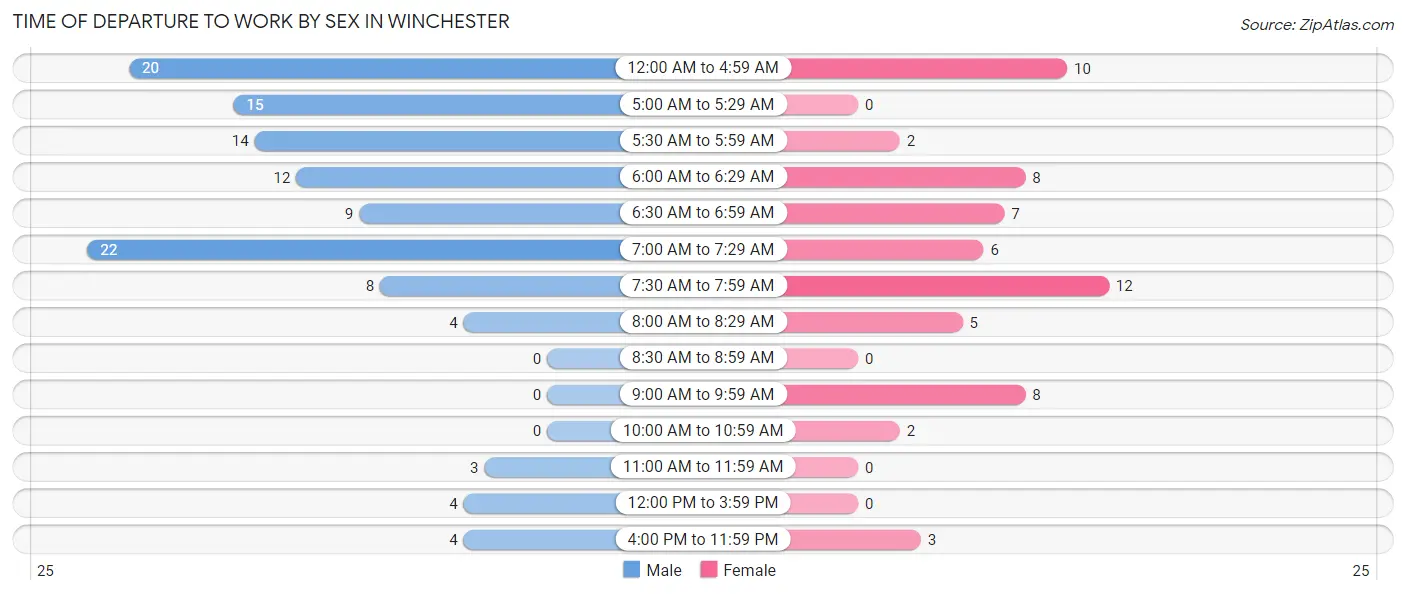
| Time of Departure | Male | Female |
| 12:00 AM to 4:59 AM | 20 (17.4%) | 10 (15.9%) |
| 5:00 AM to 5:29 AM | 15 (13.0%) | 0 (0.0%) |
| 5:30 AM to 5:59 AM | 14 (12.2%) | 2 (3.2%) |
| 6:00 AM to 6:29 AM | 12 (10.4%) | 8 (12.7%) |
| 6:30 AM to 6:59 AM | 9 (7.8%) | 7 (11.1%) |
| 7:00 AM to 7:29 AM | 22 (19.1%) | 6 (9.5%) |
| 7:30 AM to 7:59 AM | 8 (7.0%) | 12 (19.1%) |
| 8:00 AM to 8:29 AM | 4 (3.5%) | 5 (7.9%) |
| 8:30 AM to 8:59 AM | 0 (0.0%) | 0 (0.0%) |
| 9:00 AM to 9:59 AM | 0 (0.0%) | 8 (12.7%) |
| 10:00 AM to 10:59 AM | 0 (0.0%) | 2 (3.2%) |
| 11:00 AM to 11:59 AM | 3 (2.6%) | 0 (0.0%) |
| 12:00 PM to 3:59 PM | 4 (3.5%) | 0 (0.0%) |
| 4:00 PM to 11:59 PM | 4 (3.5%) | 3 (4.8%) |
| Total | 115 (100.0%) | 63 (100.0%) |
Housing Occupancy in Winchester
Occupancy by Ownership in Winchester
Of the total 200 dwellings in Winchester, owner-occupied units account for 174 (87.0%), while renter-occupied units make up 26 (13.0%).
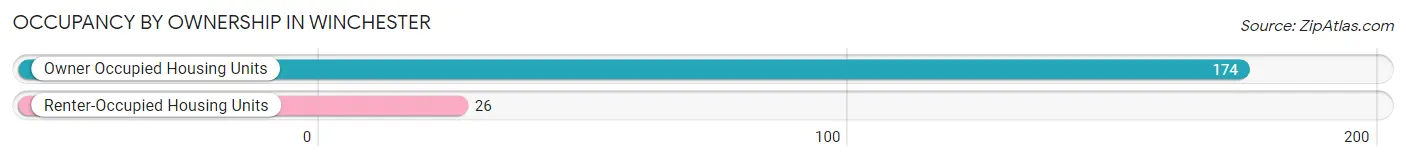
| Occupancy | # Housing Units | % Housing Units |
| Owner Occupied Housing Units | 174 | 87.0% |
| Renter-Occupied Housing Units | 26 | 13.0% |
| Total Occupied Housing Units | 200 | 100.0% |
Occupancy by Household Size in Winchester
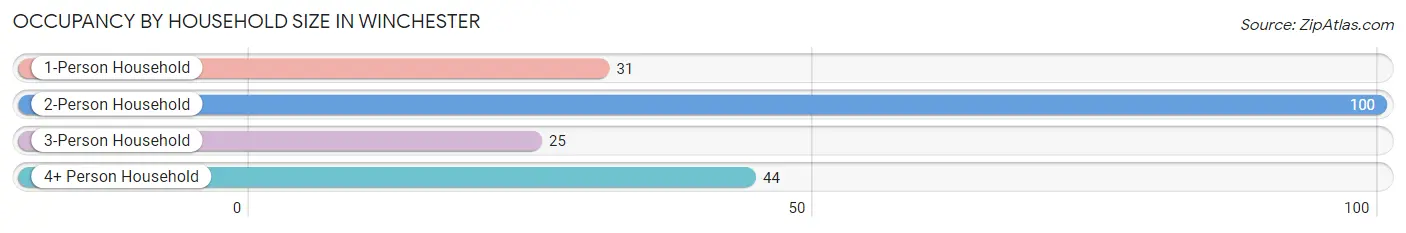
| Household Size | # Housing Units | % Housing Units |
| 1-Person Household | 31 | 15.5% |
| 2-Person Household | 100 | 50.0% |
| 3-Person Household | 25 | 12.5% |
| 4+ Person Household | 44 | 22.0% |
| Total Housing Units | 200 | 100.0% |
Occupancy by Ownership by Household Size in Winchester
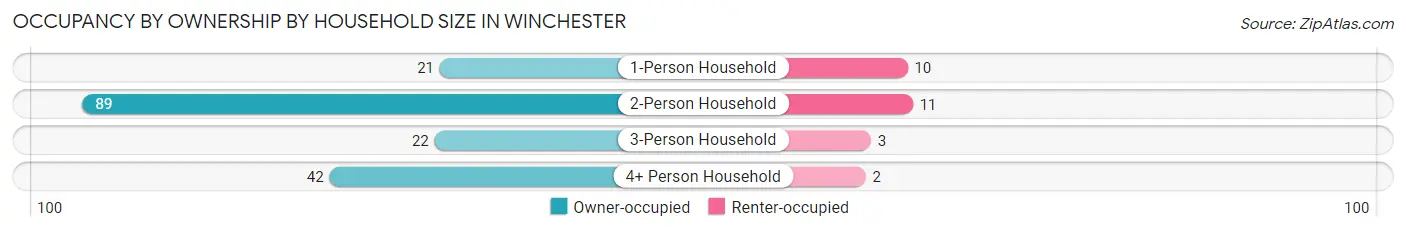
| Household Size | Owner-occupied | Renter-occupied |
| 1-Person Household | 21 (67.7%) | 10 (32.3%) |
| 2-Person Household | 89 (89.0%) | 11 (11.0%) |
| 3-Person Household | 22 (88.0%) | 3 (12.0%) |
| 4+ Person Household | 42 (95.5%) | 2 (4.5%) |
| Total Housing Units | 174 (87.0%) | 26 (13.0%) |
Occupancy by Educational Attainment in Winchester

| Household Size | Owner-occupied | Renter-occupied |
| Less than High School | 45 (100.0%) | 0 (0.0%) |
| High School Diploma | 38 (82.6%) | 8 (17.4%) |
| College/Associate Degree | 49 (76.6%) | 15 (23.4%) |
| Bachelor's Degree or higher | 42 (93.3%) | 3 (6.7%) |
Occupancy by Age of Householder in Winchester
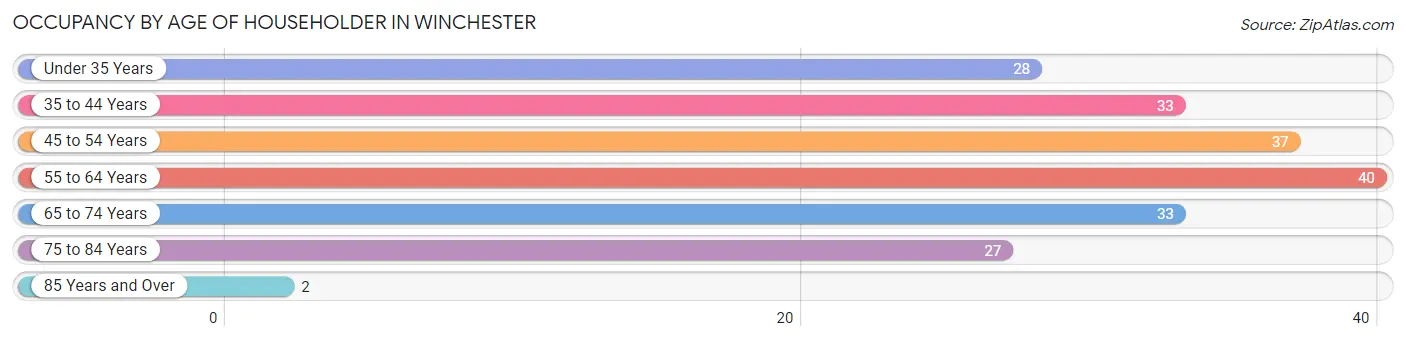
| Age Bracket | # Households | % Households |
| Under 35 Years | 28 | 14.0% |
| 35 to 44 Years | 33 | 16.5% |
| 45 to 54 Years | 37 | 18.5% |
| 55 to 64 Years | 40 | 20.0% |
| 65 to 74 Years | 33 | 16.5% |
| 75 to 84 Years | 27 | 13.5% |
| 85 Years and Over | 2 | 1.0% |
| Total | 200 | 100.0% |
Housing Finances in Winchester
Median Income by Occupancy in Winchester
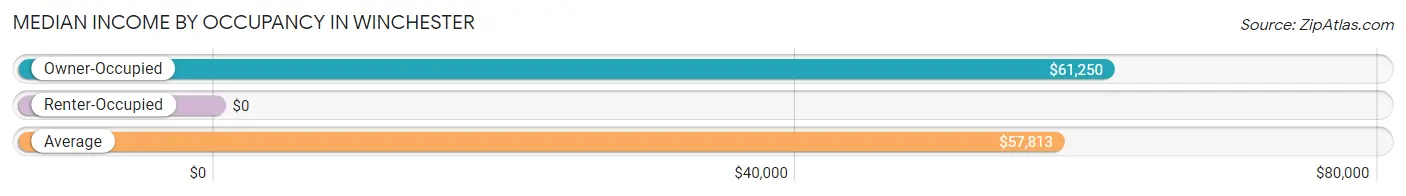
| Occupancy Type | # Households | Median Income |
| Owner-Occupied | 174 (87.0%) | $61,250 |
| Renter-Occupied | 26 (13.0%) | $0 |
| Average | 200 (100.0%) | $57,813 |
Occupancy by Householder Income Bracket in Winchester
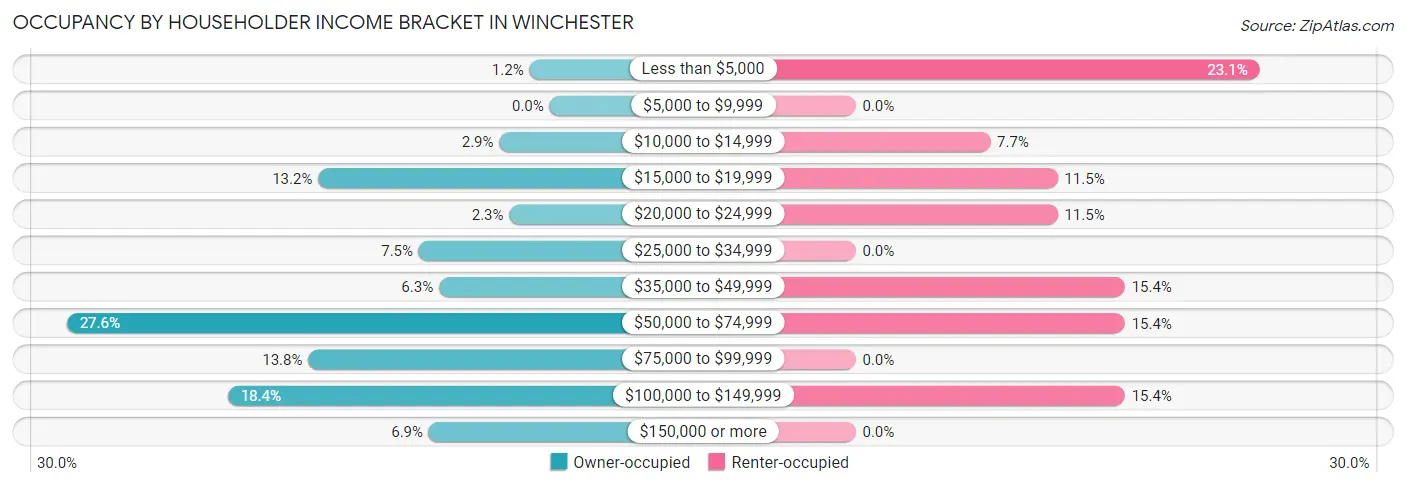
| Income Bracket | Owner-occupied | Renter-occupied |
| Less than $5,000 | 2 (1.1%) | 6 (23.1%) |
| $5,000 to $9,999 | 0 (0.0%) | 0 (0.0%) |
| $10,000 to $14,999 | 5 (2.9%) | 2 (7.7%) |
| $15,000 to $19,999 | 23 (13.2%) | 3 (11.5%) |
| $20,000 to $24,999 | 4 (2.3%) | 3 (11.5%) |
| $25,000 to $34,999 | 13 (7.5%) | 0 (0.0%) |
| $35,000 to $49,999 | 11 (6.3%) | 4 (15.4%) |
| $50,000 to $74,999 | 48 (27.6%) | 4 (15.4%) |
| $75,000 to $99,999 | 24 (13.8%) | 0 (0.0%) |
| $100,000 to $149,999 | 32 (18.4%) | 4 (15.4%) |
| $150,000 or more | 12 (6.9%) | 0 (0.0%) |
| Total | 174 (100.0%) | 26 (100.0%) |
Monthly Housing Cost Tiers in Winchester
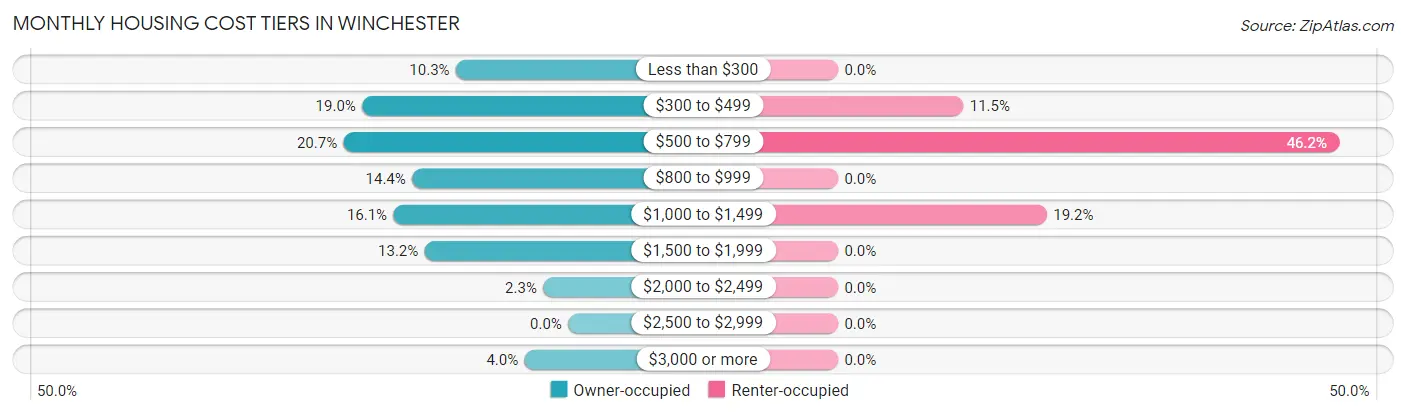
| Monthly Cost | Owner-occupied | Renter-occupied |
| Less than $300 | 18 (10.3%) | 0 (0.0%) |
| $300 to $499 | 33 (19.0%) | 3 (11.5%) |
| $500 to $799 | 36 (20.7%) | 12 (46.2%) |
| $800 to $999 | 25 (14.4%) | 0 (0.0%) |
| $1,000 to $1,499 | 28 (16.1%) | 5 (19.2%) |
| $1,500 to $1,999 | 23 (13.2%) | 0 (0.0%) |
| $2,000 to $2,499 | 4 (2.3%) | 0 (0.0%) |
| $2,500 to $2,999 | 0 (0.0%) | 0 (0.0%) |
| $3,000 or more | 7 (4.0%) | 0 (0.0%) |
| Total | 174 (100.0%) | 26 (100.0%) |
Physical Housing Characteristics in Winchester
Housing Structures in Winchester
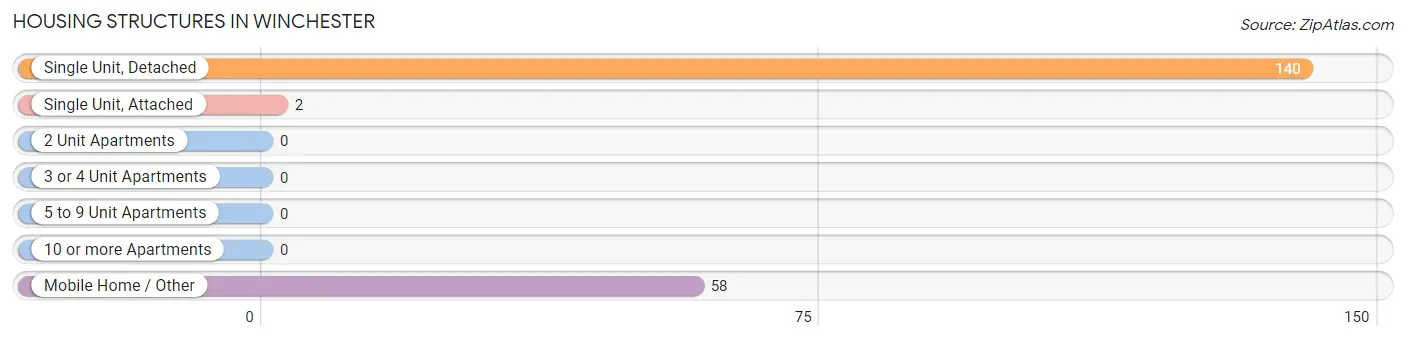
| Structure Type | # Housing Units | % Housing Units |
| Single Unit, Detached | 140 | 70.0% |
| Single Unit, Attached | 2 | 1.0% |
| 2 Unit Apartments | 0 | 0.0% |
| 3 or 4 Unit Apartments | 0 | 0.0% |
| 5 to 9 Unit Apartments | 0 | 0.0% |
| 10 or more Apartments | 0 | 0.0% |
| Mobile Home / Other | 58 | 29.0% |
| Total | 200 | 100.0% |
Housing Structures by Occupancy in Winchester
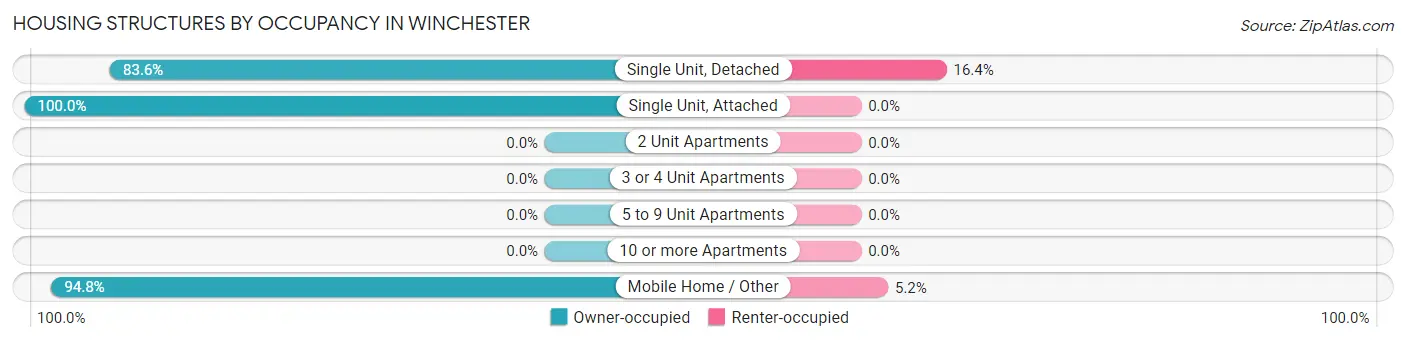
| Structure Type | Owner-occupied | Renter-occupied |
| Single Unit, Detached | 117 (83.6%) | 23 (16.4%) |
| Single Unit, Attached | 2 (100.0%) | 0 (0.0%) |
| 2 Unit Apartments | 0 (0.0%) | 0 (0.0%) |
| 3 or 4 Unit Apartments | 0 (0.0%) | 0 (0.0%) |
| 5 to 9 Unit Apartments | 0 (0.0%) | 0 (0.0%) |
| 10 or more Apartments | 0 (0.0%) | 0 (0.0%) |
| Mobile Home / Other | 55 (94.8%) | 3 (5.2%) |
| Total | 174 (87.0%) | 26 (13.0%) |
Housing Structures by Number of Rooms in Winchester
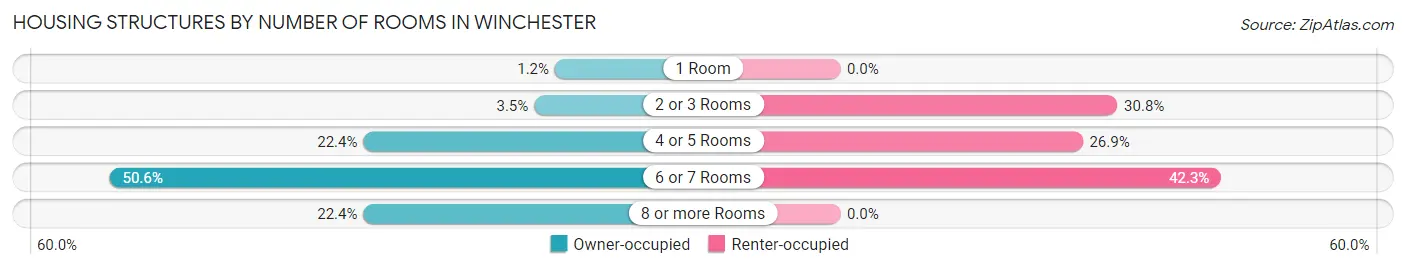
| Number of Rooms | Owner-occupied | Renter-occupied |
| 1 Room | 2 (1.1%) | 0 (0.0%) |
| 2 or 3 Rooms | 6 (3.5%) | 8 (30.8%) |
| 4 or 5 Rooms | 39 (22.4%) | 7 (26.9%) |
| 6 or 7 Rooms | 88 (50.6%) | 11 (42.3%) |
| 8 or more Rooms | 39 (22.4%) | 0 (0.0%) |
| Total | 174 (100.0%) | 26 (100.0%) |
Housing Structure by Heating Type in Winchester
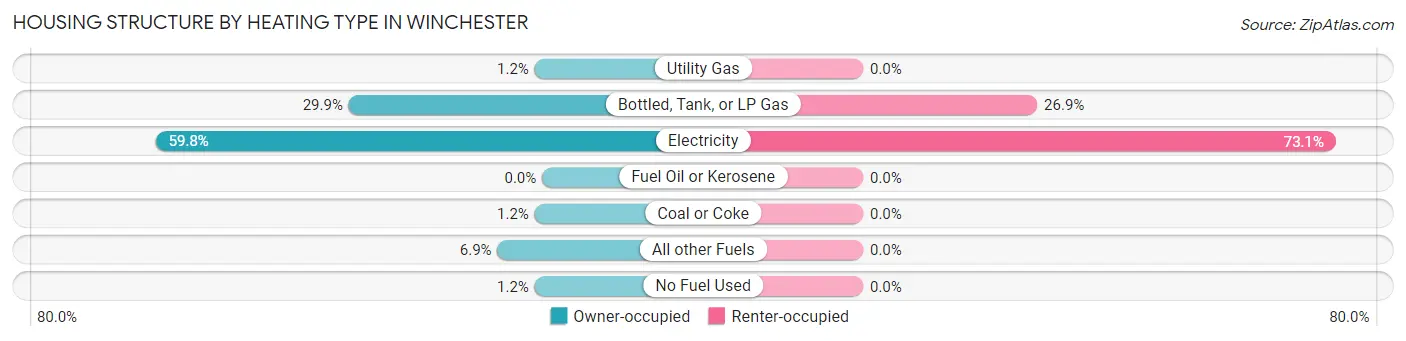
| Heating Type | Owner-occupied | Renter-occupied |
| Utility Gas | 2 (1.1%) | 0 (0.0%) |
| Bottled, Tank, or LP Gas | 52 (29.9%) | 7 (26.9%) |
| Electricity | 104 (59.8%) | 19 (73.1%) |
| Fuel Oil or Kerosene | 0 (0.0%) | 0 (0.0%) |
| Coal or Coke | 2 (1.1%) | 0 (0.0%) |
| All other Fuels | 12 (6.9%) | 0 (0.0%) |
| No Fuel Used | 2 (1.1%) | 0 (0.0%) |
| Total | 174 (100.0%) | 26 (100.0%) |
Household Vehicle Usage in Winchester
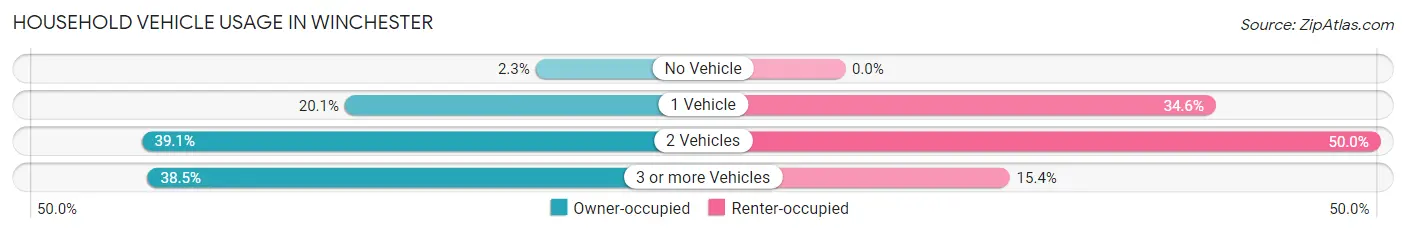
| Vehicles per Household | Owner-occupied | Renter-occupied |
| No Vehicle | 4 (2.3%) | 0 (0.0%) |
| 1 Vehicle | 35 (20.1%) | 9 (34.6%) |
| 2 Vehicles | 68 (39.1%) | 13 (50.0%) |
| 3 or more Vehicles | 67 (38.5%) | 4 (15.4%) |
| Total | 174 (100.0%) | 26 (100.0%) |
Real Estate & Mortgages in Winchester
Real Estate and Mortgage Overview in Winchester
| Characteristic | Without Mortgage | With Mortgage |
| Housing Units | 86 | 88 |
| Median Property Value | $135,700 | $165,000 |
| Median Household Income | $65,000 | $2 |
| Monthly Housing Costs | $467 | $7 |
| Real Estate Taxes | $1,000 | $16 |
Property Value by Mortgage Status in Winchester
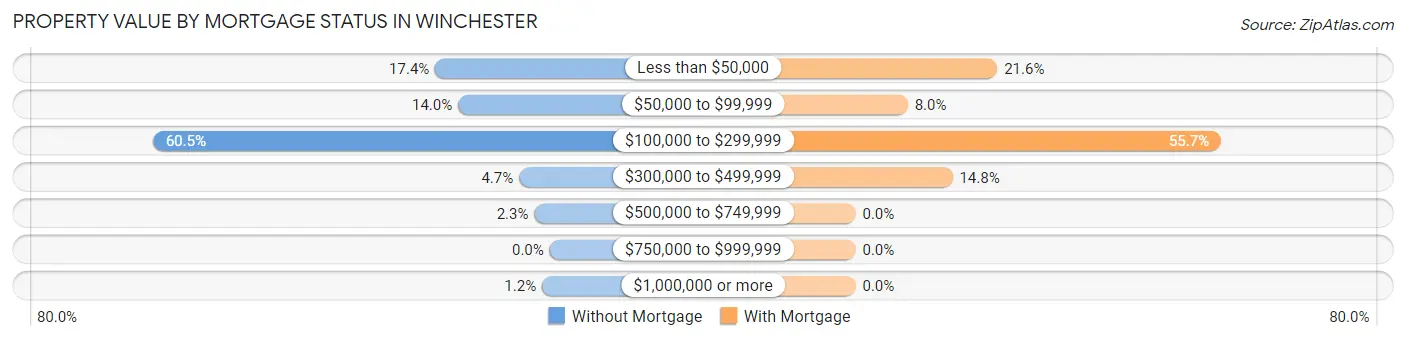
| Property Value | Without Mortgage | With Mortgage |
| Less than $50,000 | 15 (17.4%) | 19 (21.6%) |
| $50,000 to $99,999 | 12 (14.0%) | 7 (8.0%) |
| $100,000 to $299,999 | 52 (60.5%) | 49 (55.7%) |
| $300,000 to $499,999 | 4 (4.6%) | 13 (14.8%) |
| $500,000 to $749,999 | 2 (2.3%) | 0 (0.0%) |
| $750,000 to $999,999 | 0 (0.0%) | 0 (0.0%) |
| $1,000,000 or more | 1 (1.2%) | 0 (0.0%) |
| Total | 86 (100.0%) | 88 (100.0%) |
Household Income by Mortgage Status in Winchester
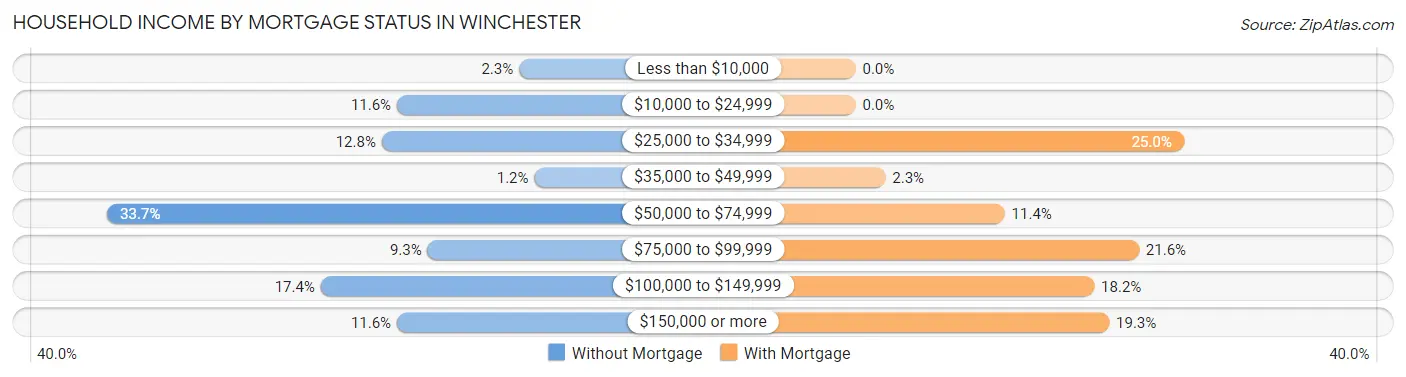
| Household Income | Without Mortgage | With Mortgage |
| Less than $10,000 | 2 (2.3%) | 0 (0.0%) |
| $10,000 to $24,999 | 10 (11.6%) | 0 (0.0%) |
| $25,000 to $34,999 | 11 (12.8%) | 22 (25.0%) |
| $35,000 to $49,999 | 1 (1.2%) | 2 (2.3%) |
| $50,000 to $74,999 | 29 (33.7%) | 10 (11.4%) |
| $75,000 to $99,999 | 8 (9.3%) | 19 (21.6%) |
| $100,000 to $149,999 | 15 (17.4%) | 16 (18.2%) |
| $150,000 or more | 10 (11.6%) | 17 (19.3%) |
| Total | 86 (100.0%) | 88 (100.0%) |
Property Value to Household Income Ratio in Winchester
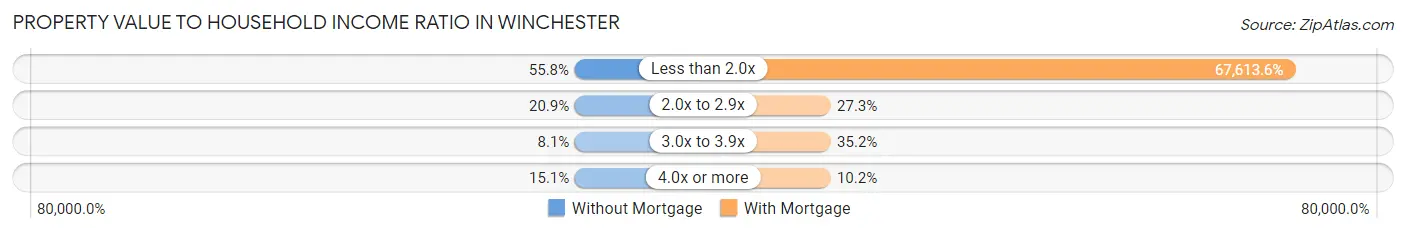
| Value-to-Income Ratio | Without Mortgage | With Mortgage |
| Less than 2.0x | 48 (55.8%) | 59,500 (67,613.6%) |
| 2.0x to 2.9x | 18 (20.9%) | 24 (27.3%) |
| 3.0x to 3.9x | 7 (8.1%) | 31 (35.2%) |
| 4.0x or more | 13 (15.1%) | 9 (10.2%) |
| Total | 86 (100.0%) | 88 (100.0%) |
Real Estate Taxes by Mortgage Status in Winchester
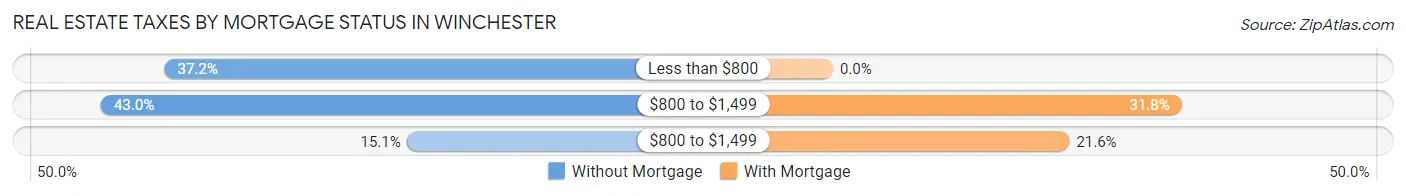
| Property Taxes | Without Mortgage | With Mortgage |
| Less than $800 | 32 (37.2%) | 0 (0.0%) |
| $800 to $1,499 | 37 (43.0%) | 28 (31.8%) |
| $800 to $1,499 | 13 (15.1%) | 19 (21.6%) |
| Total | 86 (100.0%) | 88 (100.0%) |
Health & Disability in Winchester
Health Insurance Coverage by Age in Winchester
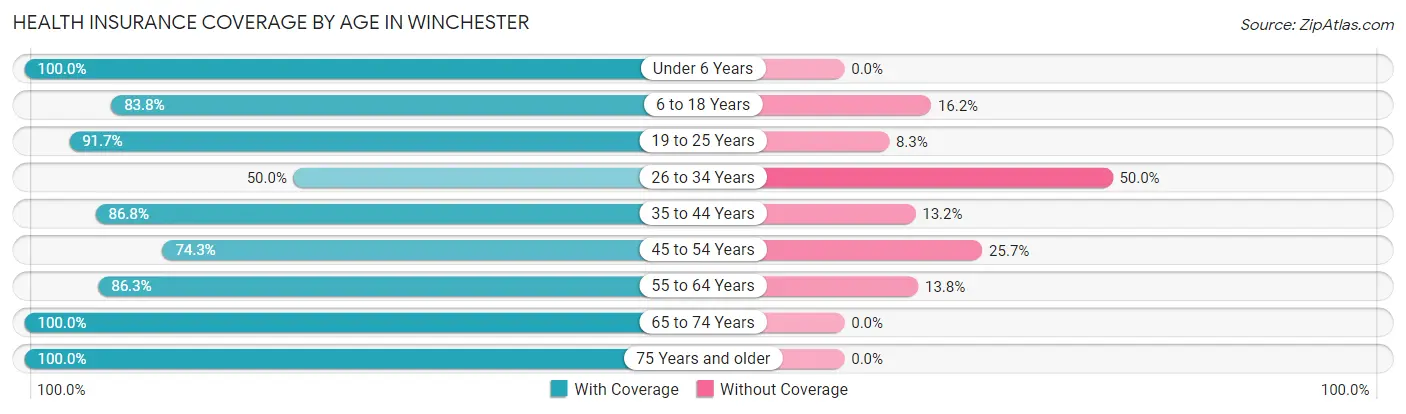
| Age Bracket | With Coverage | Without Coverage |
| Under 6 Years | 46 (100.0%) | 0 (0.0%) |
| 6 to 18 Years | 83 (83.8%) | 16 (16.2%) |
| 19 to 25 Years | 22 (91.7%) | 2 (8.3%) |
| 26 to 34 Years | 19 (50.0%) | 19 (50.0%) |
| 35 to 44 Years | 59 (86.8%) | 9 (13.2%) |
| 45 to 54 Years | 52 (74.3%) | 18 (25.7%) |
| 55 to 64 Years | 69 (86.3%) | 11 (13.8%) |
| 65 to 74 Years | 59 (100.0%) | 0 (0.0%) |
| 75 Years and older | 40 (100.0%) | 0 (0.0%) |
| Total | 449 (85.7%) | 75 (14.3%) |
Health Insurance Coverage by Citizenship Status in Winchester
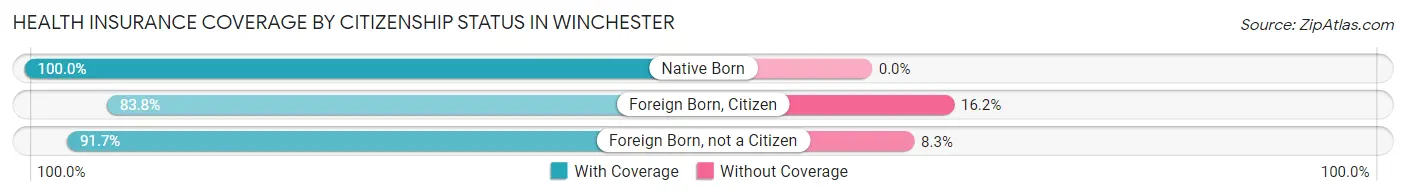
| Citizenship Status | With Coverage | Without Coverage |
| Native Born | 46 (100.0%) | 0 (0.0%) |
| Foreign Born, Citizen | 83 (83.8%) | 16 (16.2%) |
| Foreign Born, not a Citizen | 22 (91.7%) | 2 (8.3%) |
Health Insurance Coverage by Household Income in Winchester
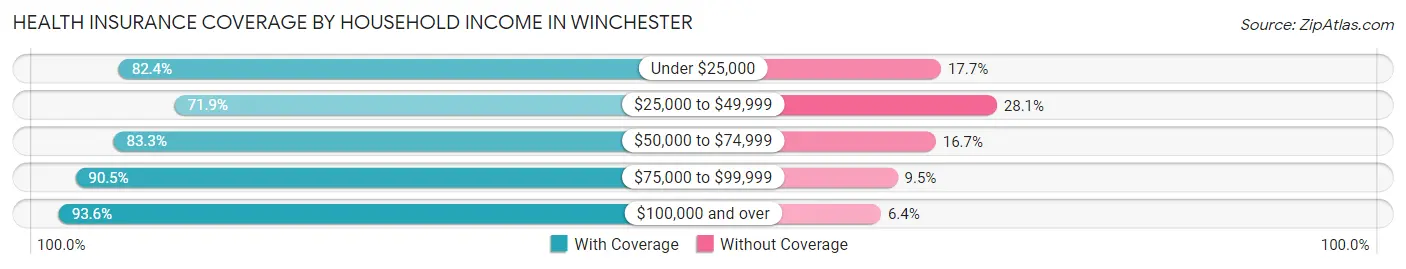
| Household Income | With Coverage | Without Coverage |
| Under $25,000 | 70 (82.4%) | 15 (17.6%) |
| $25,000 to $49,999 | 46 (71.9%) | 18 (28.1%) |
| $50,000 to $74,999 | 130 (83.3%) | 26 (16.7%) |
| $75,000 to $99,999 | 57 (90.5%) | 6 (9.5%) |
| $100,000 and over | 146 (93.6%) | 10 (6.4%) |
Public vs Private Health Insurance Coverage by Age in Winchester
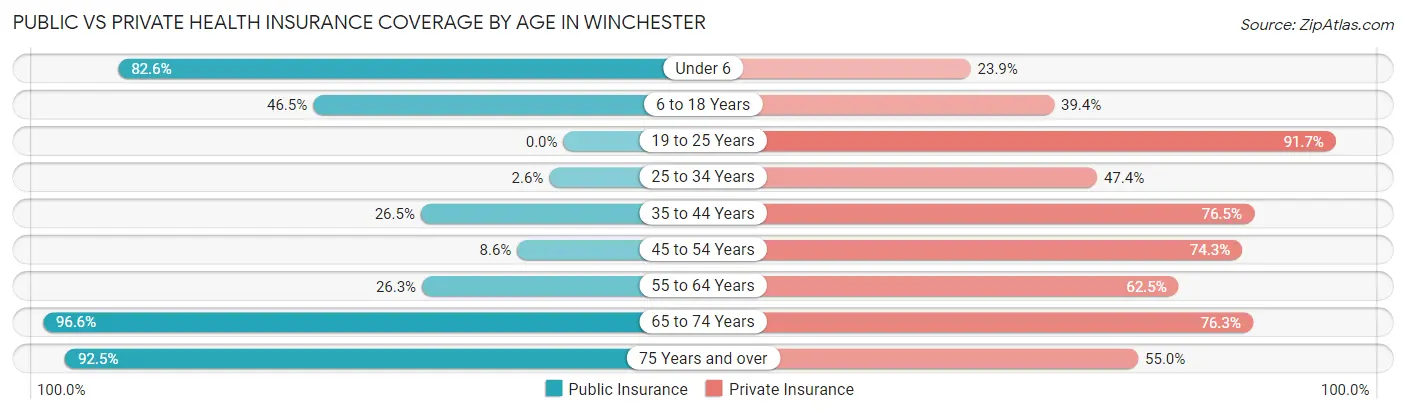
| Age Bracket | Public Insurance | Private Insurance |
| Under 6 | 38 (82.6%) | 11 (23.9%) |
| 6 to 18 Years | 46 (46.5%) | 39 (39.4%) |
| 19 to 25 Years | 0 (0.0%) | 22 (91.7%) |
| 25 to 34 Years | 1 (2.6%) | 18 (47.4%) |
| 35 to 44 Years | 18 (26.5%) | 52 (76.5%) |
| 45 to 54 Years | 6 (8.6%) | 52 (74.3%) |
| 55 to 64 Years | 21 (26.3%) | 50 (62.5%) |
| 65 to 74 Years | 57 (96.6%) | 45 (76.3%) |
| 75 Years and over | 37 (92.5%) | 22 (55.0%) |
| Total | 224 (42.7%) | 311 (59.4%) |
Disability Status by Sex by Age in Winchester
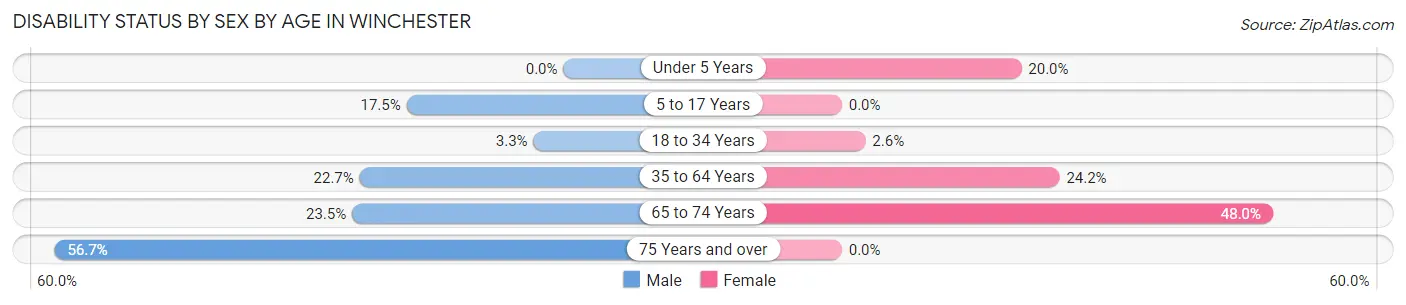
| Age Bracket | Male | Female |
| Under 5 Years | 0 (0.0%) | 2 (20.0%) |
| 5 to 17 Years | 11 (17.5%) | 0 (0.0%) |
| 18 to 34 Years | 1 (3.3%) | 1 (2.6%) |
| 35 to 64 Years | 27 (22.7%) | 24 (24.2%) |
| 65 to 74 Years | 8 (23.5%) | 12 (48.0%) |
| 75 Years and over | 17 (56.7%) | 0 (0.0%) |
Disability Class by Sex by Age in Winchester
Disability Class: Hearing Difficulty
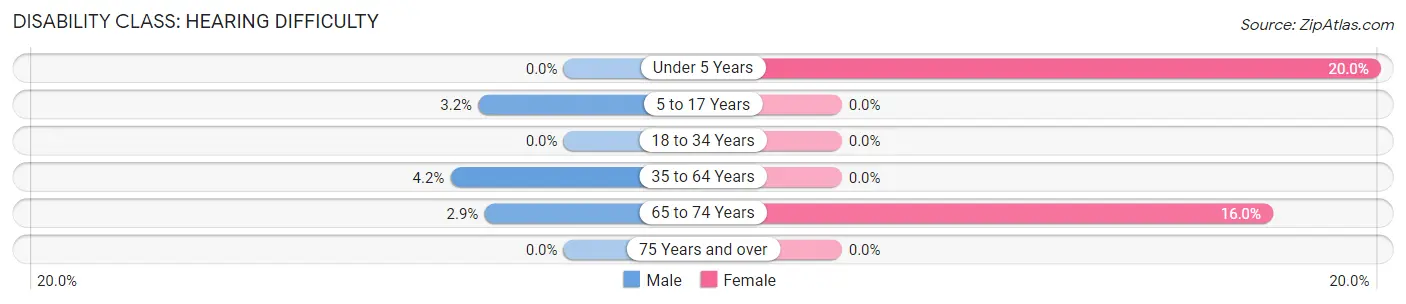
| Age Bracket | Male | Female |
| Under 5 Years | 0 (0.0%) | 2 (20.0%) |
| 5 to 17 Years | 2 (3.2%) | 0 (0.0%) |
| 18 to 34 Years | 0 (0.0%) | 0 (0.0%) |
| 35 to 64 Years | 5 (4.2%) | 0 (0.0%) |
| 65 to 74 Years | 1 (2.9%) | 4 (16.0%) |
| 75 Years and over | 0 (0.0%) | 0 (0.0%) |
Disability Class: Vision Difficulty
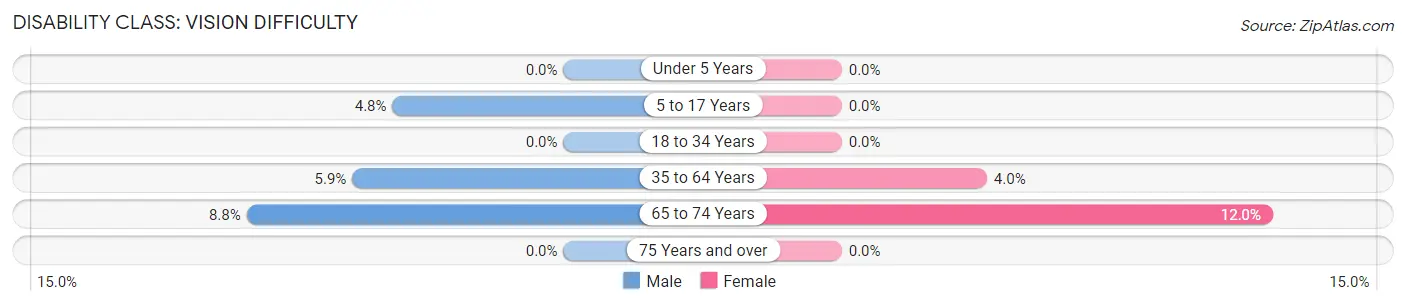
| Age Bracket | Male | Female |
| Under 5 Years | 0 (0.0%) | 0 (0.0%) |
| 5 to 17 Years | 3 (4.8%) | 0 (0.0%) |
| 18 to 34 Years | 0 (0.0%) | 0 (0.0%) |
| 35 to 64 Years | 7 (5.9%) | 4 (4.0%) |
| 65 to 74 Years | 3 (8.8%) | 3 (12.0%) |
| 75 Years and over | 0 (0.0%) | 0 (0.0%) |
Disability Class: Cognitive Difficulty
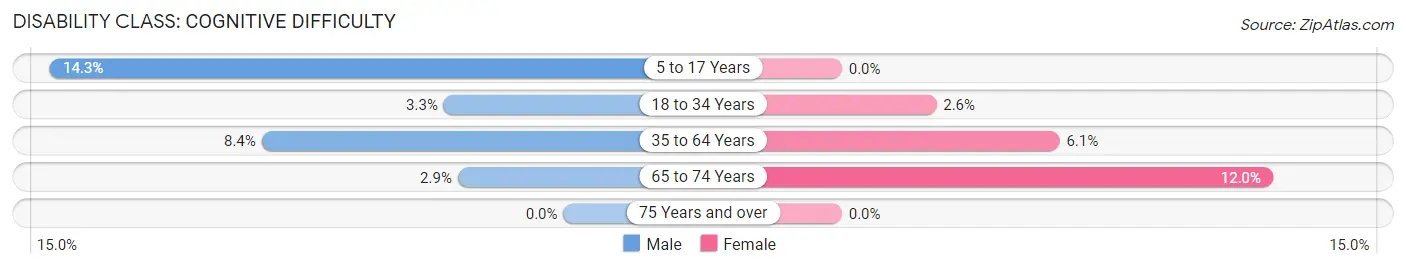
| Age Bracket | Male | Female |
| 5 to 17 Years | 9 (14.3%) | 0 (0.0%) |
| 18 to 34 Years | 1 (3.3%) | 1 (2.6%) |
| 35 to 64 Years | 10 (8.4%) | 6 (6.1%) |
| 65 to 74 Years | 1 (2.9%) | 3 (12.0%) |
| 75 Years and over | 0 (0.0%) | 0 (0.0%) |
Disability Class: Ambulatory Difficulty
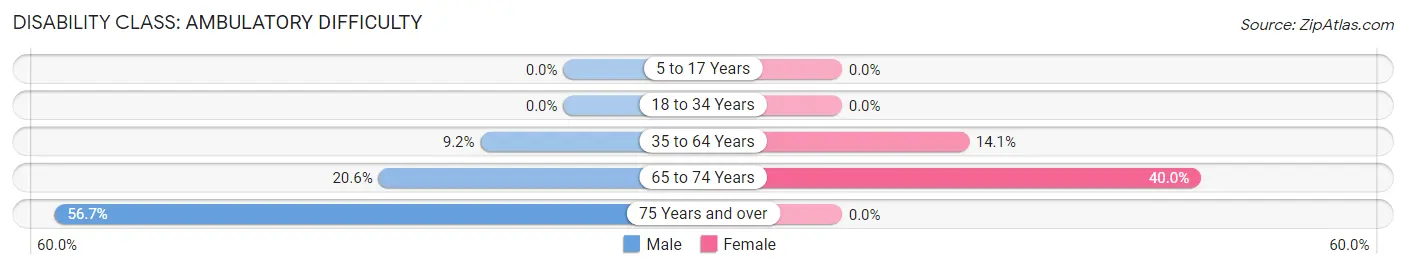
| Age Bracket | Male | Female |
| 5 to 17 Years | 0 (0.0%) | 0 (0.0%) |
| 18 to 34 Years | 0 (0.0%) | 0 (0.0%) |
| 35 to 64 Years | 11 (9.2%) | 14 (14.1%) |
| 65 to 74 Years | 7 (20.6%) | 10 (40.0%) |
| 75 Years and over | 17 (56.7%) | 0 (0.0%) |
Disability Class: Self-Care Difficulty
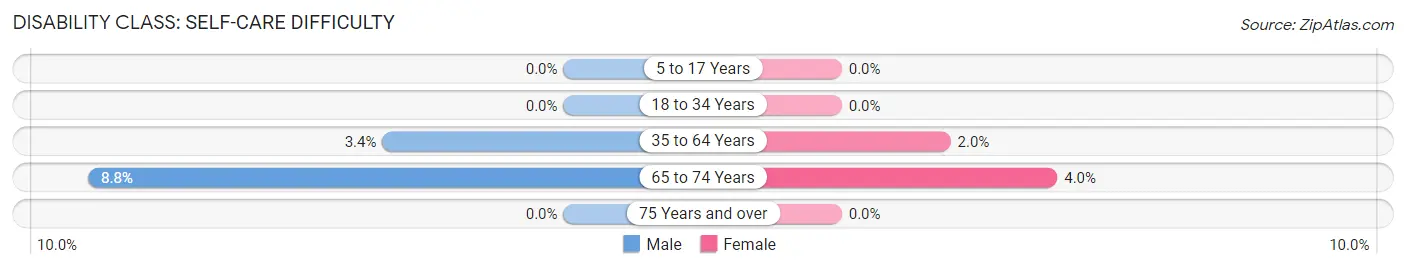
| Age Bracket | Male | Female |
| 5 to 17 Years | 0 (0.0%) | 0 (0.0%) |
| 18 to 34 Years | 0 (0.0%) | 0 (0.0%) |
| 35 to 64 Years | 4 (3.4%) | 2 (2.0%) |
| 65 to 74 Years | 3 (8.8%) | 1 (4.0%) |
| 75 Years and over | 0 (0.0%) | 0 (0.0%) |
Technology Access in Winchester
Computing Device Access in Winchester
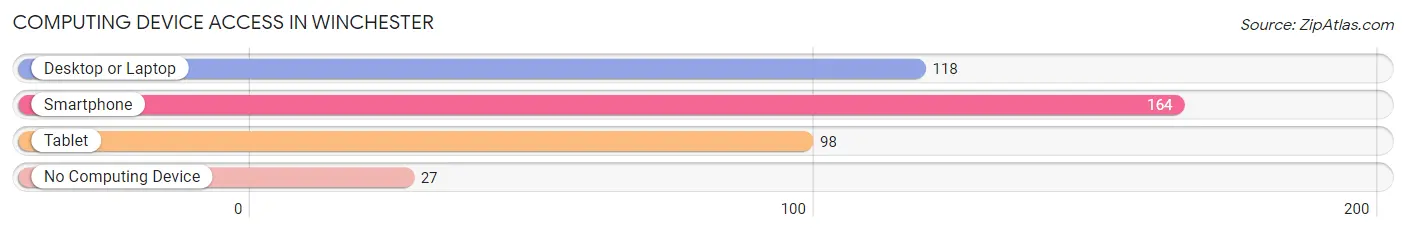
| Device Type | # Households | % Households |
| Desktop or Laptop | 118 | 59.0% |
| Smartphone | 164 | 82.0% |
| Tablet | 98 | 49.0% |
| No Computing Device | 27 | 13.5% |
| Total | 200 | 100.0% |
Internet Access in Winchester
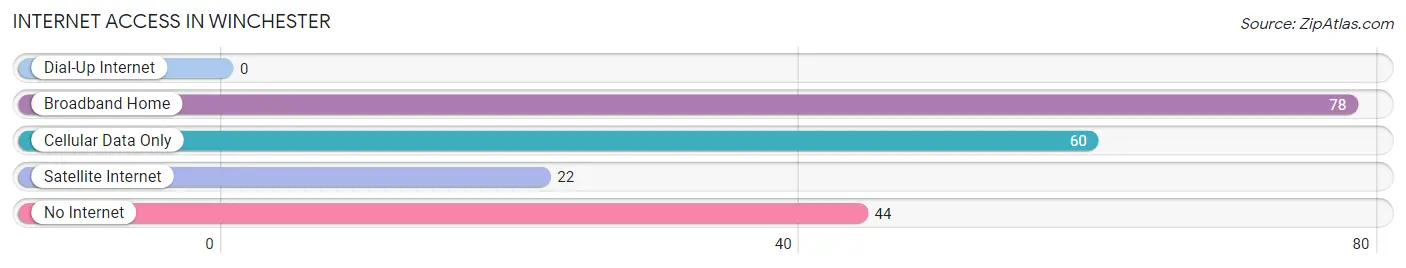
| Internet Type | # Households | % Households |
| Dial-Up Internet | 0 | 0.0% |
| Broadband Home | 78 | 39.0% |
| Cellular Data Only | 60 | 30.0% |
| Satellite Internet | 22 | 11.0% |
| No Internet | 44 | 22.0% |
| Total | 200 | 100.0% |
Winchester Summary
Winchester, Oklahoma is a small town located in the southwestern part of the state, in Kiowa County. It is situated on the banks of the Washita River, and is surrounded by rolling hills and prairies. The town was founded in 1891, and was named after the Winchester Rifle Company. It has a population of approximately 500 people, and is a rural community with a strong agricultural base.
Geography
Winchester is located in the southwestern part of Oklahoma, in Kiowa County. It is situated on the banks of the Washita River, and is surrounded by rolling hills and prairies. The town is located at an elevation of 1,068 feet above sea level. The climate in Winchester is semi-arid, with hot summers and mild winters. The average annual temperature is around 64 degrees Fahrenheit, and the average annual precipitation is around 24 inches.
Economy
The economy of Winchester is largely based on agriculture. The town is home to several farms and ranches, which produce a variety of crops and livestock. The town also has a few small businesses, including a grocery store, a hardware store, and a few restaurants. The town is also home to a few manufacturing companies, which produce a variety of products, including furniture, clothing, and automotive parts.
Demographics
As of the 2010 census, the population of Winchester was 498 people. The racial makeup of the town was 95.2% White, 0.2% African American, 0.4% Native American, 0.2% Asian, 0.2% Pacific Islander, 0.2% from other races, and 3.8% from two or more races. The median household income was $30,000, and the median family income was $35,000. The per capita income was $14,000.
History
Winchester was founded in 1891, and was named after the Winchester Rifle Company. The town was originally a trading post for the Kiowa and Comanche tribes, and was later used as a stop on the Chisholm Trail. The town was incorporated in 1901, and the first post office was established in 1902. The town grew slowly, and by the 1930s, it had a population of around 500 people. The town was largely agricultural, and the main crops were wheat, corn, and cotton.
In the 1950s, the town began to experience a decline in population, as many of the younger residents moved away in search of better job opportunities. The town was also affected by the Dust Bowl, and many of the farms and ranches were abandoned. In the 1970s, the town began to experience a resurgence, as new businesses began to move into the area. Today, Winchester is a small, rural community with a strong agricultural base.
Common Questions
What is the Total Population of Winchester?
Total Population of Winchester is 524.
What is the Total Male Population of Winchester?
Total Male Population of Winchester is 299.
What is the Total Female Population of Winchester?
Total Female Population of Winchester is 225.
What is the Ratio of Males per 100 Females in Winchester?
There are 132.89 Males per 100 Females in Winchester.
What is the Ratio of Females per 100 Males in Winchester?
There are 75.25 Females per 100 Males in Winchester.
What is the Median Population Age in Winchester?
Median Population Age in Winchester is 42.6 Years.
What is the Average Family Size in Winchester
Average Family Size in Winchester is 2.8 People.
What is the Average Household Size in Winchester
Average Household Size in Winchester is 2.6 People.
What is Per Capita Income in Winchester?
Per Capita income in Winchester is $27,775.
What is the Median Family Income in Winchester?
Median Family Income in Winchester is $57,396.
What is the Median Household income in Winchester?
Median Household Income in Winchester is $57,813.
What is Income or Wage Gap in Winchester?
Income or Wage Gap in Winchester is 47.0%.
Women in Winchester earn 53.0 cents for every dollar earned by a man.
What is Inequality or Gini Index in Winchester?
Inequality or Gini Index in Winchester is 0.41.
How Large is the Labor Force in Winchester?
There are 217 People in the Labor Forcein in Winchester.
What is the Percentage of People in the Labor Force in Winchester?
52.9% of People are in the Labor Force in Winchester.
What is the Unemployment Rate in Winchester?
Unemployment Rate in Winchester is 6.0%.