New Cordell, OK
New Cordell Map
New Cordell Overview
2,769
TOTAL POPULATION
1,544
MALE POPULATION
1,225
FEMALE POPULATION
126.04
MALES / 100 FEMALES
79.34
FEMALES / 100 MALES
36.4
MEDIAN AGE
3.5
AVG FAMILY SIZE
2.7
AVG HOUSEHOLD SIZE
$26,477
PER CAPITA INCOME
$72,031
AVG FAMILY INCOME
$68,295
AVG HOUSEHOLD INCOME
36.8%
WAGE / INCOME GAP [ % ]
63.2¢/ $1
WAGE / INCOME GAP [ $ ]
0.36
INEQUALITY / GINI INDEX
1,266
LABOR FORCE [ PEOPLE ]
59.2%
PERCENT IN LABOR FORCE
4.9%
UNEMPLOYMENT RATE
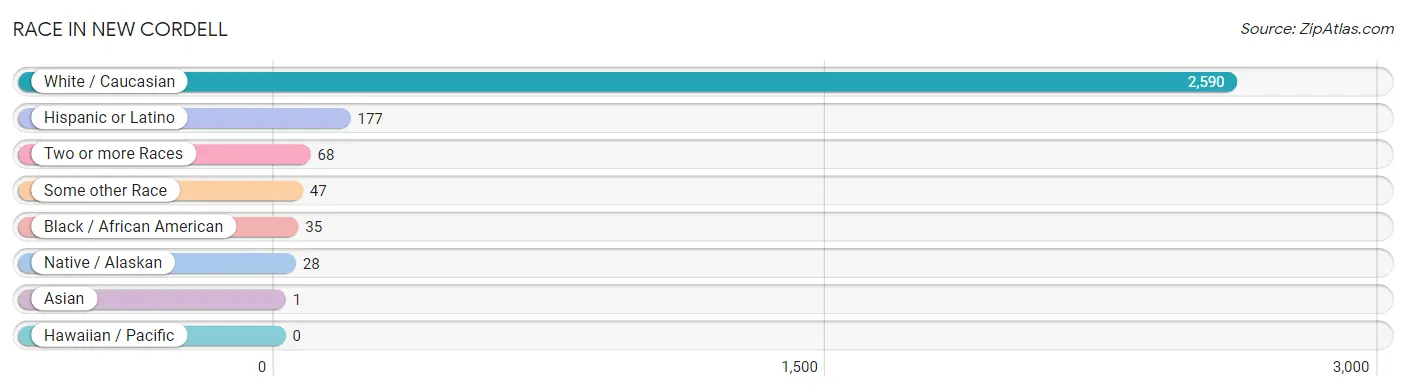
Race in New Cordell
The most populous races in New Cordell are White / Caucasian (2,590 | 93.5%), Hispanic or Latino (177 | 6.4%), and Two or more Races (68 | 2.5%).
| Race | # Population | % Population |
| Asian | 1 | 0.0% |
| Black / African American | 35 | 1.3% |
| Hawaiian / Pacific | 0 | 0.0% |
| Hispanic or Latino | 177 | 6.4% |
| Native / Alaskan | 28 | 1.0% |
| White / Caucasian | 2,590 | 93.5% |
| Two or more Races | 68 | 2.5% |
| Some other Race | 47 | 1.7% |
| Total | 2,769 | 100.0% |
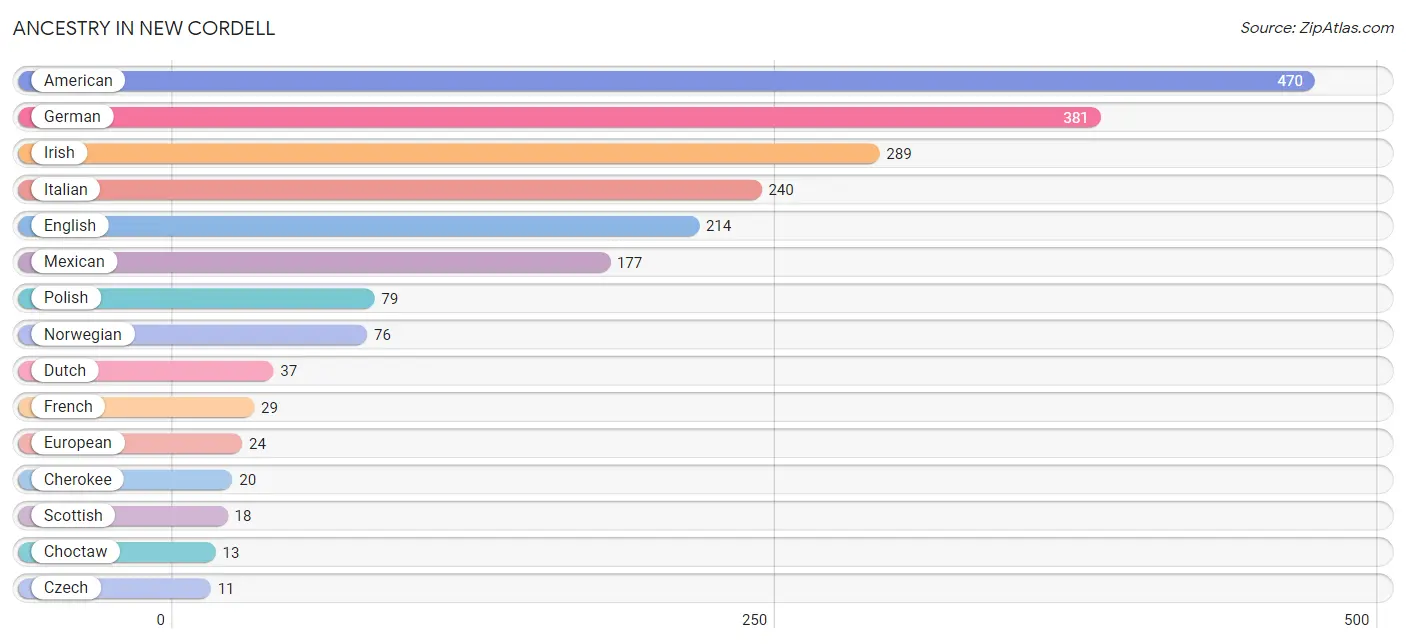
Ancestry in New Cordell
The most populous ancestries reported in New Cordell are American (470 | 17.0%), German (381 | 13.8%), Irish (289 | 10.4%), Italian (240 | 8.7%), and English (214 | 7.7%), together accounting for 57.6% of all New Cordell residents.
| Ancestry | # Population | % Population |
| American | 470 | 17.0% |
| Bhutanese | 3 | 0.1% |
| Cherokee | 20 | 0.7% |
| Choctaw | 13 | 0.5% |
| Comanche | 4 | 0.1% |
| Czech | 11 | 0.4% |
| Dutch | 37 | 1.3% |
| English | 214 | 7.7% |
| European | 24 | 0.9% |
| French | 29 | 1.1% |
| German | 381 | 13.8% |
| Irish | 289 | 10.4% |
| Israeli | 6 | 0.2% |
| Italian | 240 | 8.7% |
| Malaysian | 5 | 0.2% |
| Mexican | 177 | 6.4% |
| Northern European | 10 | 0.4% |
| Norwegian | 76 | 2.7% |
| Osage | 6 | 0.2% |
| Polish | 79 | 2.9% |
| Russian | 10 | 0.4% |
| Scotch-Irish | 10 | 0.4% |
| Scottish | 18 | 0.6% |
| Swedish | 9 | 0.3% | View All 24 Rows |
Immigrants in New Cordell

| Immigration Origin | # Population | % Population | View All 0 Rows |
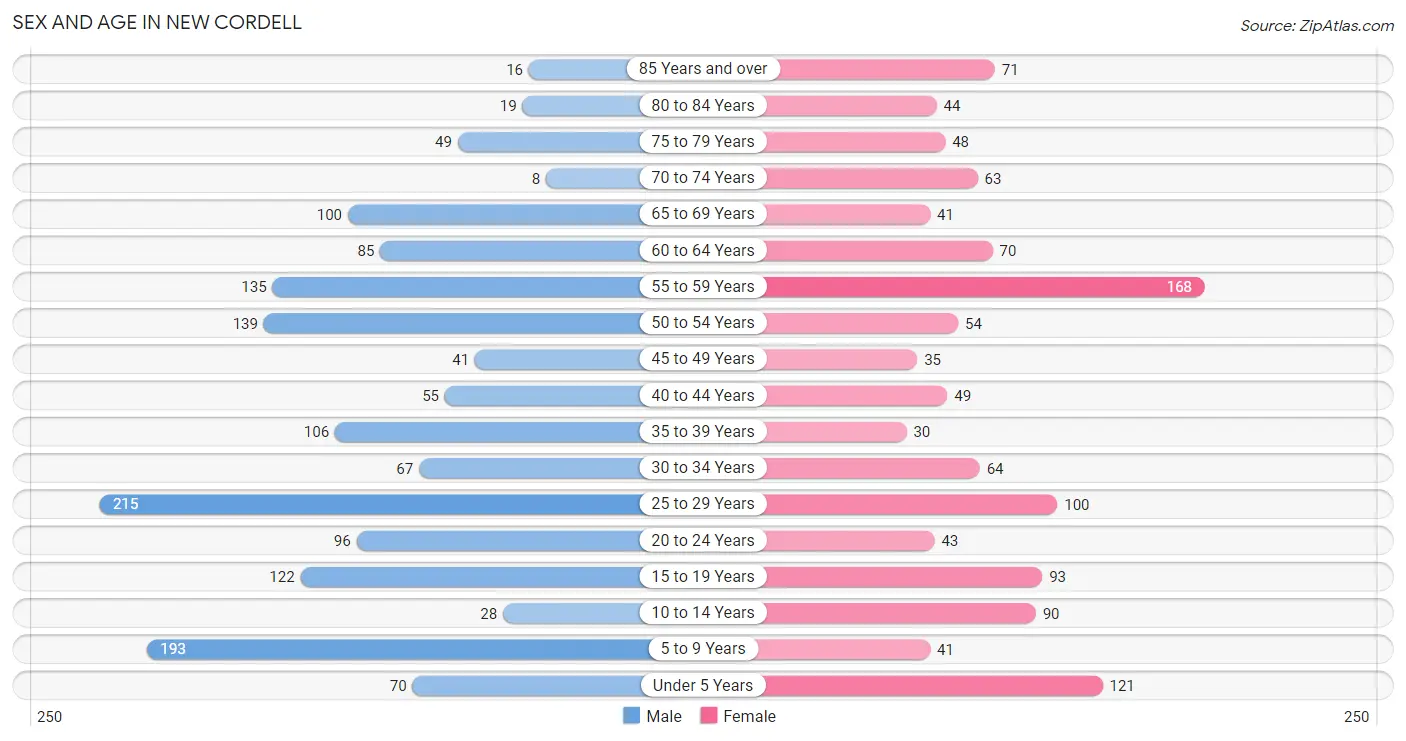
Sex and Age in New Cordell
Sex and Age in New Cordell
The most populous age groups in New Cordell are 25 to 29 Years (215 | 13.9%) for men and 55 to 59 Years (168 | 13.7%) for women.
| Age Bracket | Male | Female |
| Under 5 Years | 70 (4.5%) | 121 (9.9%) |
| 5 to 9 Years | 193 (12.5%) | 41 (3.4%) |
| 10 to 14 Years | 28 (1.8%) | 90 (7.3%) |
| 15 to 19 Years | 122 (7.9%) | 93 (7.6%) |
| 20 to 24 Years | 96 (6.2%) | 43 (3.5%) |
| 25 to 29 Years | 215 (13.9%) | 100 (8.2%) |
| 30 to 34 Years | 67 (4.3%) | 64 (5.2%) |
| 35 to 39 Years | 106 (6.9%) | 30 (2.5%) |
| 40 to 44 Years | 55 (3.6%) | 49 (4.0%) |
| 45 to 49 Years | 41 (2.7%) | 35 (2.9%) |
| 50 to 54 Years | 139 (9.0%) | 54 (4.4%) |
| 55 to 59 Years | 135 (8.7%) | 168 (13.7%) |
| 60 to 64 Years | 85 (5.5%) | 70 (5.7%) |
| 65 to 69 Years | 100 (6.5%) | 41 (3.4%) |
| 70 to 74 Years | 8 (0.5%) | 63 (5.1%) |
| 75 to 79 Years | 49 (3.2%) | 48 (3.9%) |
| 80 to 84 Years | 19 (1.2%) | 44 (3.6%) |
| 85 Years and over | 16 (1.0%) | 71 (5.8%) |
| Total | 1,544 (100.0%) | 1,225 (100.0%) |
Families and Households in New Cordell
Median Family Size in New Cordell
The median family size in New Cordell is 3.55 persons per family, with single female/mother families (39 | 6.5%) accounting for the largest median family size of 5 persons per family. On the other hand, single male/father families (11 | 1.8%) represent the smallest median family size with 1.55 persons per family.
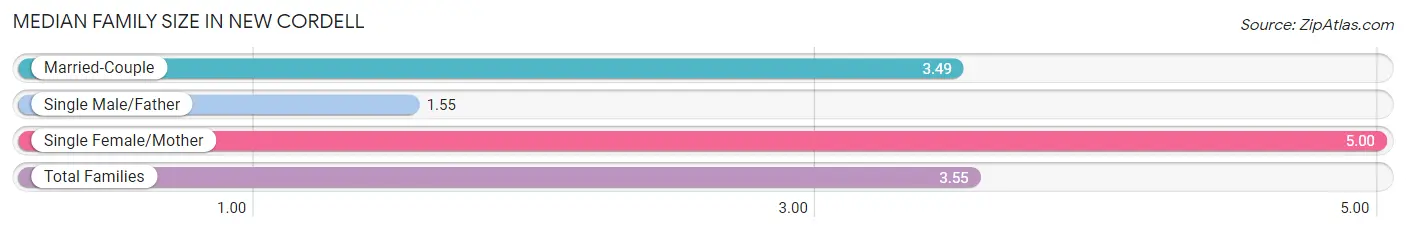
| Family Type | # Families | Family Size |
| Married-Couple | 549 (91.6%) | 3.49 |
| Single Male/Father | 11 (1.8%) | 1.55 |
| Single Female/Mother | 39 (6.5%) | 5.00 |
| Total Families | 599 (100.0%) | 3.55 |
Median Household Size in New Cordell
The median household size in New Cordell is 2.70 persons per household, with single female/mother households (39 | 4.0%) accounting for the largest median household size of 5.87 persons per household. non-family households (371 | 38.3%) represent the smallest median household size with 1.16 persons per household.
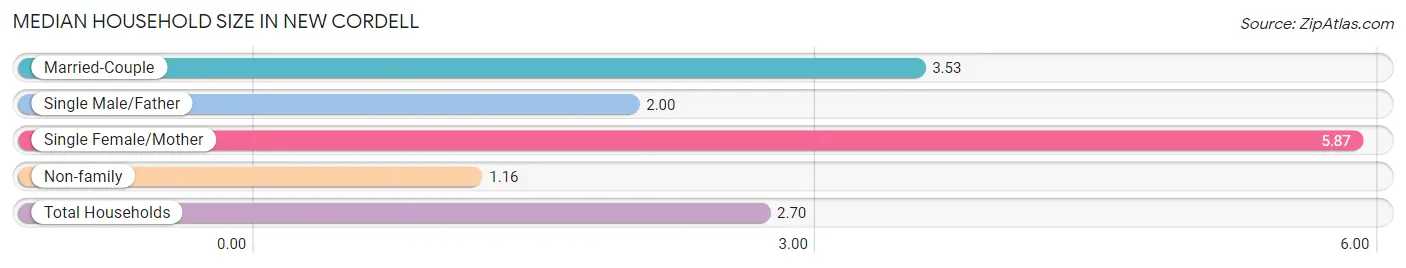
| Household Type | # Households | Household Size |
| Married-Couple | 549 (56.6%) | 3.53 |
| Single Male/Father | 11 (1.1%) | 2.00 |
| Single Female/Mother | 39 (4.0%) | 5.87 |
| Non-family | 371 (38.3%) | 1.16 |
| Total Households | 970 (100.0%) | 2.70 |
Household Size by Marriage Status in New Cordell
Out of a total of 970 households in New Cordell, 599 (61.8%) are family households, while 371 (38.3%) are nonfamily households. The most numerous type of family households are 2-person households, comprising 255, and the most common type of nonfamily households are 1-person households, comprising 327.
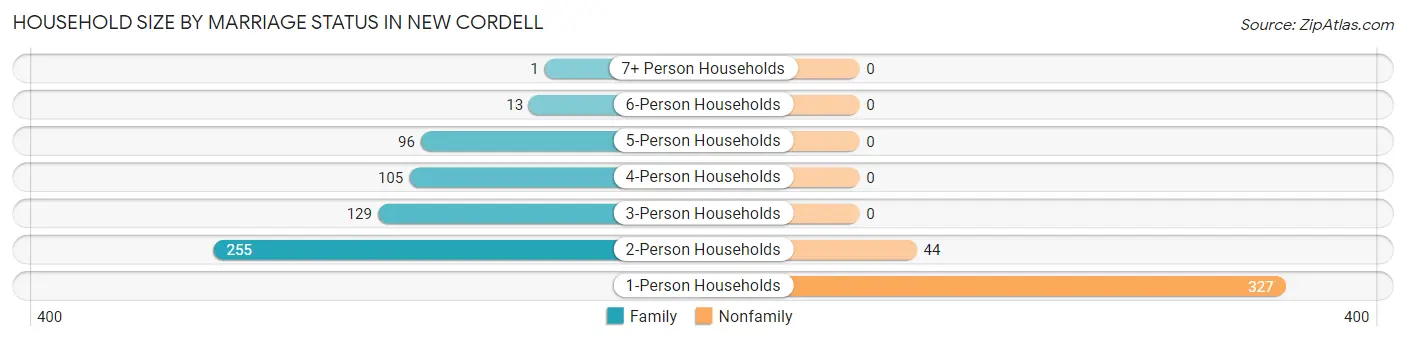
| Household Size | Family Households | Nonfamily Households |
| 1-Person Households | - | 327 (33.7%) |
| 2-Person Households | 255 (26.3%) | 44 (4.5%) |
| 3-Person Households | 129 (13.3%) | 0 (0.0%) |
| 4-Person Households | 105 (10.8%) | 0 (0.0%) |
| 5-Person Households | 96 (9.9%) | 0 (0.0%) |
| 6-Person Households | 13 (1.3%) | 0 (0.0%) |
| 7+ Person Households | 1 (0.1%) | 0 (0.0%) |
| Total | 599 (61.8%) | 371 (38.3%) |
Female Fertility in New Cordell
Fertility by Age in New Cordell
Average fertility rate in New Cordell is 45.0 births per 1,000 women. Women in the age bracket of 35 to 50 years have the highest fertility rate with 63.0 births per 1,000 women. Women in the age bracket of 20 to 34 years acount for 55.0% of all women with births.
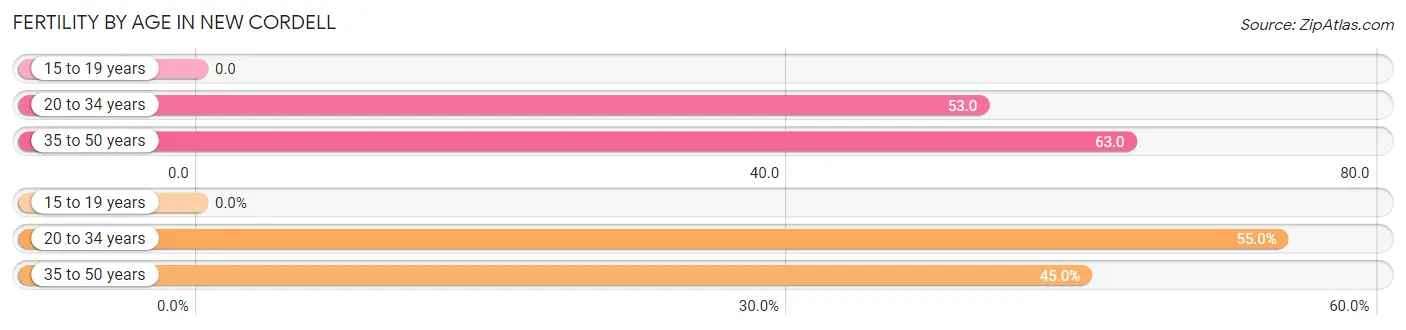
| Age Bracket | Women with Births | Births / 1,000 Women |
| 15 to 19 years | 0 (0.0%) | 0.0 |
| 20 to 34 years | 11 (55.0%) | 53.0 |
| 35 to 50 years | 9 (45.0%) | 63.0 |
| Total | 20 (100.0%) | 45.0 |
Fertility by Age by Marriage Status in New Cordell
20.0% of women with births (20) in New Cordell are married. The highest percentage of unmarried women with births falls into 35 to 50 years age bracket with 100.0% of them unmarried at the time of birth, while the lowest percentage of unmarried women with births belong to 20 to 34 years age bracket with 63.6% of them unmarried.
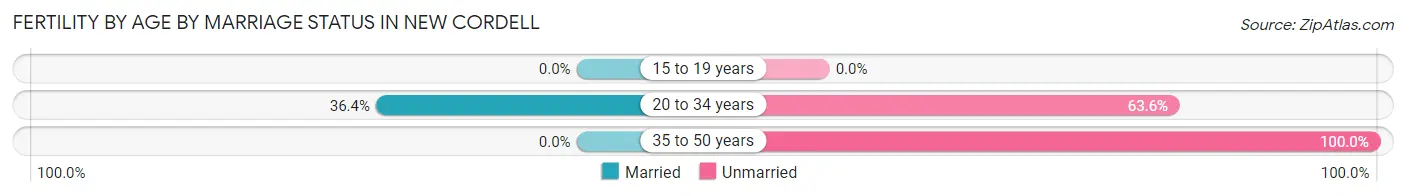
| Age Bracket | Married | Unmarried |
| 15 to 19 years | 0 (0.0%) | 0 (0.0%) |
| 20 to 34 years | 4 (36.4%) | 7 (63.6%) |
| 35 to 50 years | 0 (0.0%) | 9 (100.0%) |
| Total | 4 (20.0%) | 16 (80.0%) |
Fertility by Education in New Cordell
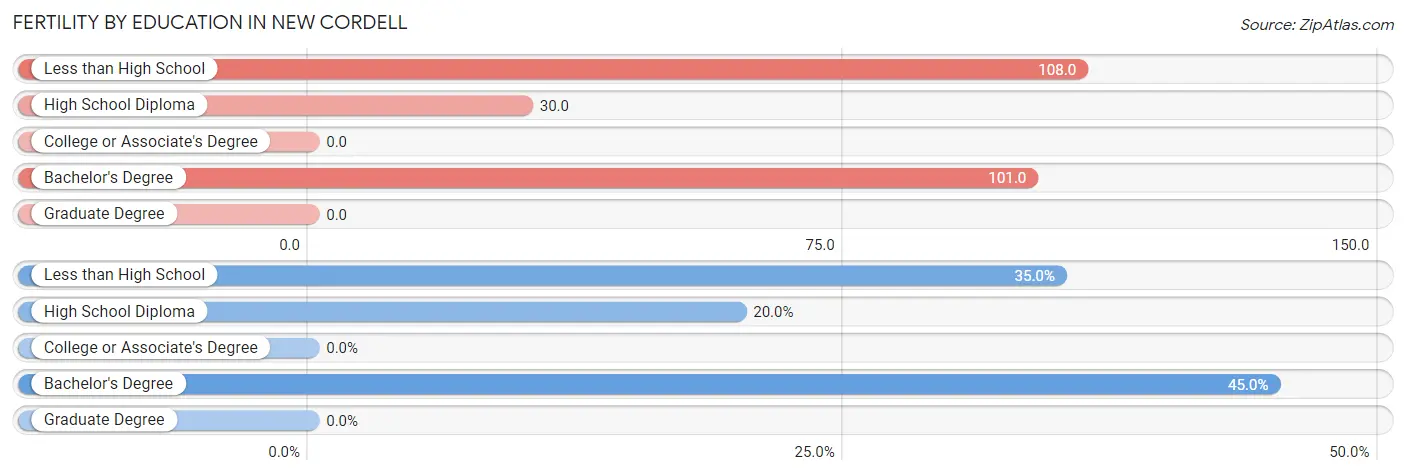
| Educational Attainment | Women with Births | Births / 1,000 Women |
| Less than High School | 7 (35.0%) | 108.0 |
| High School Diploma | 4 (20.0%) | 30.0 |
| College or Associate's Degree | 0 (0.0%) | 0.0 |
| Bachelor's Degree | 9 (45.0%) | 101.0 |
| Graduate Degree | 0 (0.0%) | 0.0 |
| Total | 20 (100.0%) | 45.0 |
Fertility by Education by Marriage Status in New Cordell
80.0% of women with births in New Cordell are unmarried. Women with the educational attainment of high school diploma are most likely to be married with 100.0% of them married at childbirth, while women with the educational attainment of less than high school are least likely to be married with 100.0% of them unmarried at childbirth.
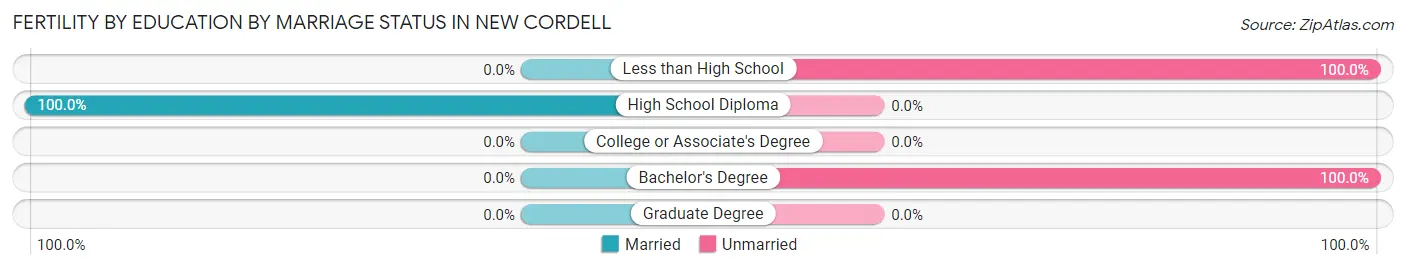
| Educational Attainment | Married | Unmarried |
| Less than High School | 0 (0.0%) | 7 (100.0%) |
| High School Diploma | 4 (100.0%) | 0 (0.0%) |
| College or Associate's Degree | 0 (0.0%) | 0 (0.0%) |
| Bachelor's Degree | 0 (0.0%) | 9 (100.0%) |
| Graduate Degree | 0 (0.0%) | 0 (0.0%) |
| Total | 4 (20.0%) | 16 (80.0%) |
Income in New Cordell
Income Overview in New Cordell
Per Capita Income in New Cordell is $26,477, while median incomes of families and households are $72,031 and $68,295 respectively.
| Characteristic | Number | Measure |
| Per Capita Income | 2,769 | $26,477 |
| Median Family Income | 599 | $72,031 |
| Mean Family Income | 599 | $83,369 |
| Median Household Income | 970 | $68,295 |
| Mean Household Income | 970 | $68,007 |
| Income Deficit | 599 | $0 |
| Wage / Income Gap (%) | 2,769 | 36.81% |
| Wage / Income Gap ($) | 2,769 | 63.19¢ per $1 |
| Gini / Inequality Index | 2,769 | 0.36 |
Earnings by Sex in New Cordell
Average Earnings in New Cordell are $37,922, $44,938 for men and $28,397 for women, a difference of 36.8%.
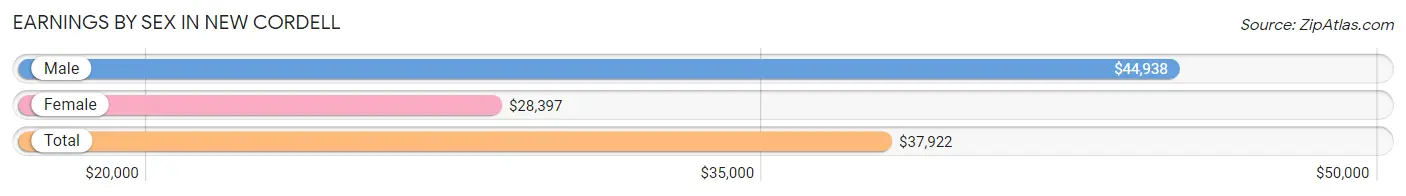
| Sex | Number | Average Earnings |
| Male | 775 (61.5%) | $44,938 |
| Female | 486 (38.5%) | $28,397 |
| Total | 1,261 (100.0%) | $37,922 |
Earnings by Sex by Income Bracket in New Cordell
The most common earnings brackets in New Cordell are $55,000 to $64,999 for men (92 | 11.9%) and $25,000 to $29,999 for women (117 | 24.1%).
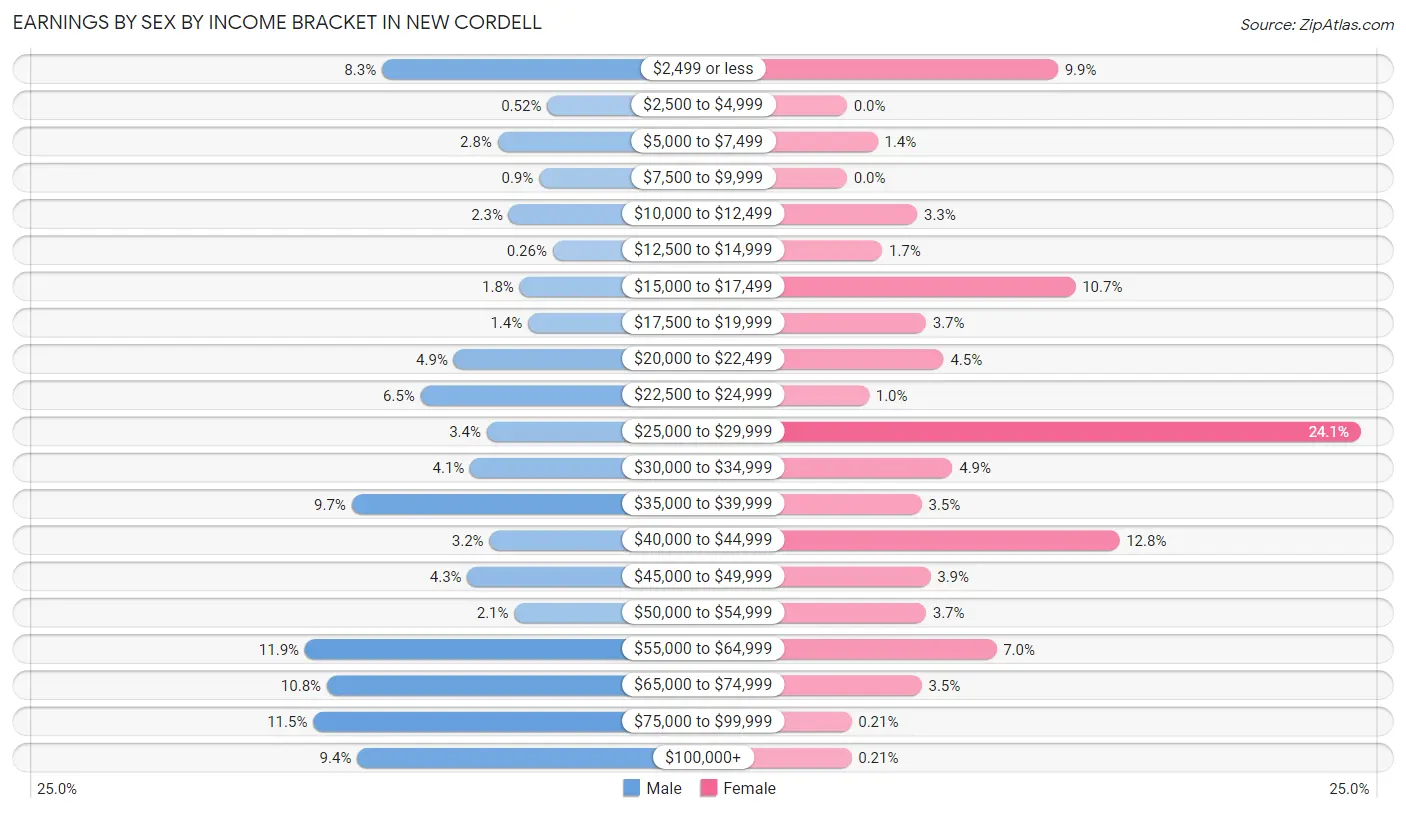
| Income | Male | Female |
| $2,499 or less | 64 (8.3%) | 48 (9.9%) |
| $2,500 to $4,999 | 4 (0.5%) | 0 (0.0%) |
| $5,000 to $7,499 | 22 (2.8%) | 7 (1.4%) |
| $7,500 to $9,999 | 7 (0.9%) | 0 (0.0%) |
| $10,000 to $12,499 | 18 (2.3%) | 16 (3.3%) |
| $12,500 to $14,999 | 2 (0.3%) | 8 (1.7%) |
| $15,000 to $17,499 | 14 (1.8%) | 52 (10.7%) |
| $17,500 to $19,999 | 11 (1.4%) | 18 (3.7%) |
| $20,000 to $22,499 | 38 (4.9%) | 22 (4.5%) |
| $22,500 to $24,999 | 50 (6.5%) | 5 (1.0%) |
| $25,000 to $29,999 | 26 (3.4%) | 117 (24.1%) |
| $30,000 to $34,999 | 32 (4.1%) | 24 (4.9%) |
| $35,000 to $39,999 | 75 (9.7%) | 17 (3.5%) |
| $40,000 to $44,999 | 25 (3.2%) | 62 (12.8%) |
| $45,000 to $49,999 | 33 (4.3%) | 19 (3.9%) |
| $50,000 to $54,999 | 16 (2.1%) | 18 (3.7%) |
| $55,000 to $64,999 | 92 (11.9%) | 34 (7.0%) |
| $65,000 to $74,999 | 84 (10.8%) | 17 (3.5%) |
| $75,000 to $99,999 | 89 (11.5%) | 1 (0.2%) |
| $100,000+ | 73 (9.4%) | 1 (0.2%) |
| Total | 775 (100.0%) | 486 (100.0%) |
Earnings by Sex by Educational Attainment in New Cordell
Average earnings in New Cordell are $46,250 for men and $29,359 for women, a difference of 36.5%. Men with an educational attainment of less than high school enjoy the highest average annual earnings of $83,100, while those with high school diploma education earn the least with $39,782. Women with an educational attainment of graduate degree earn the most with the average annual earnings of $55,972, while those with high school diploma education have the smallest earnings of $26,652.
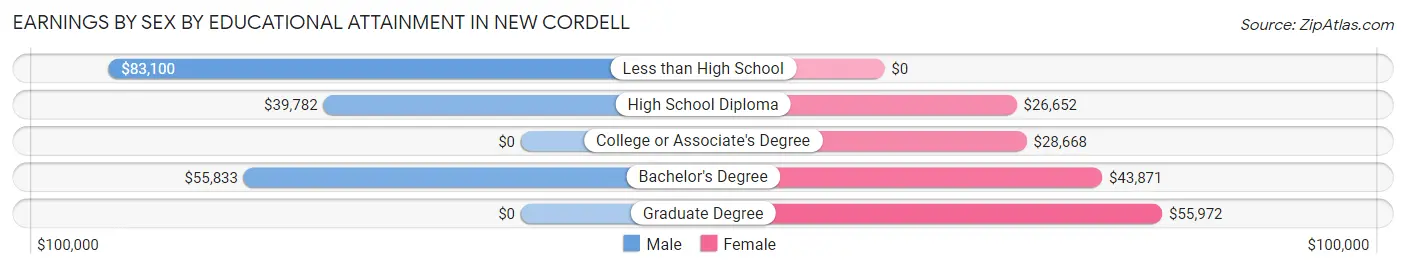
| Educational Attainment | Male Income | Female Income |
| Less than High School | $83,100 | $0 |
| High School Diploma | $39,782 | $26,652 |
| College or Associate's Degree | - | - |
| Bachelor's Degree | $55,833 | $43,871 |
| Graduate Degree | - | - |
| Total | $46,250 | $29,359 |
Family Income in New Cordell
Family Income Brackets in New Cordell
According to the New Cordell family income data, there are 175 families falling into the $50,000 to $74,999 income range, which is the most common income bracket and makes up 29.2% of all families.
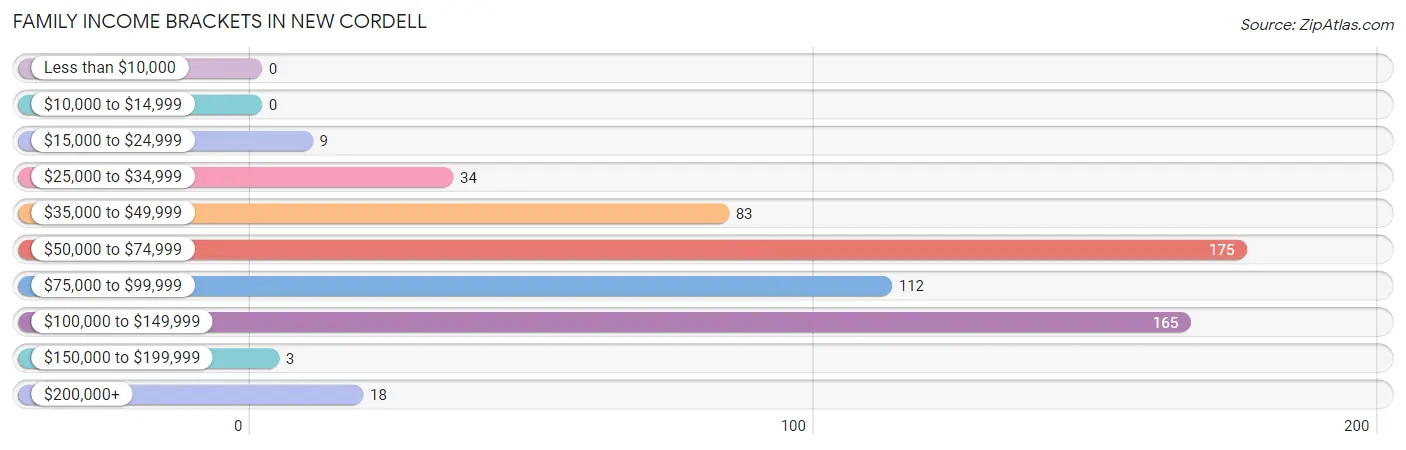
| Income Bracket | # Families | % Families |
| Less than $10,000 | 0 | 0.0% |
| $10,000 to $14,999 | 0 | 0.0% |
| $15,000 to $24,999 | 9 | 1.5% |
| $25,000 to $34,999 | 34 | 5.7% |
| $35,000 to $49,999 | 83 | 13.9% |
| $50,000 to $74,999 | 175 | 29.2% |
| $75,000 to $99,999 | 112 | 18.7% |
| $100,000 to $149,999 | 165 | 27.5% |
| $150,000 to $199,999 | 3 | 0.5% |
| $200,000+ | 18 | 3.0% |
Family Income by Famaliy Size in New Cordell
5-person families (103 | 17.2%) account for the highest median family income in New Cordell with $129,592 per family, while 2-person families (271 | 45.2%) have the highest median income of $41,843 per family member.
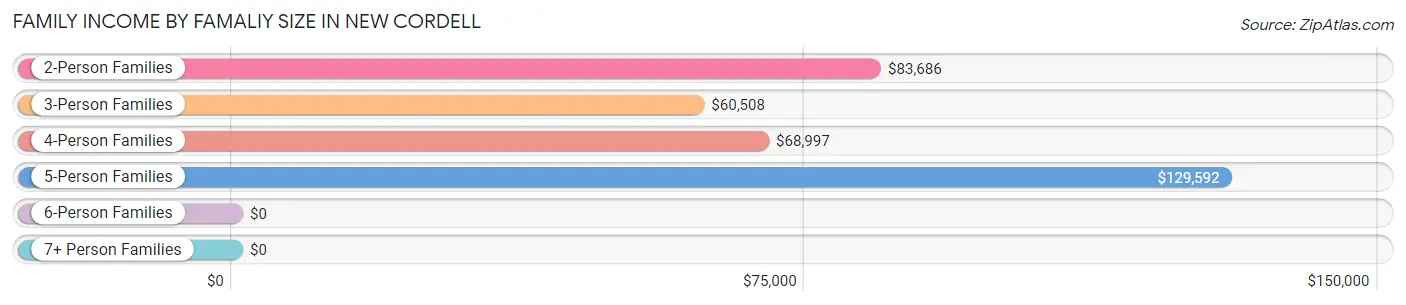
| Income Bracket | # Families | Median Income |
| 2-Person Families | 271 (45.2%) | $83,686 |
| 3-Person Families | 121 (20.2%) | $60,508 |
| 4-Person Families | 99 (16.5%) | $68,997 |
| 5-Person Families | 103 (17.2%) | $129,592 |
| 6-Person Families | 5 (0.8%) | $0 |
| 7+ Person Families | 0 (0.0%) | $0 |
| Total | 599 (100.0%) | $72,031 |
Family Income by Number of Earners in New Cordell
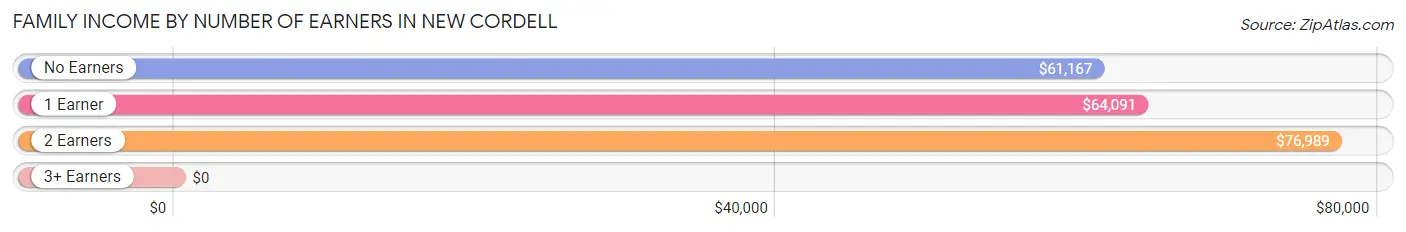
| Number of Earners | # Families | Median Income |
| No Earners | 60 (10.0%) | $61,167 |
| 1 Earner | 188 (31.4%) | $64,091 |
| 2 Earners | 331 (55.3%) | $76,989 |
| 3+ Earners | 20 (3.3%) | $0 |
| Total | 599 (100.0%) | $72,031 |
Household Income in New Cordell
Household Income Brackets in New Cordell
With 211 households falling in the category, the $100,000 to $149,999 income range is the most frequent in New Cordell, accounting for 21.7% of all households. In contrast, only 3 households (0.3%) fall into the $150,000 to $199,999 income bracket, making it the least populous group.
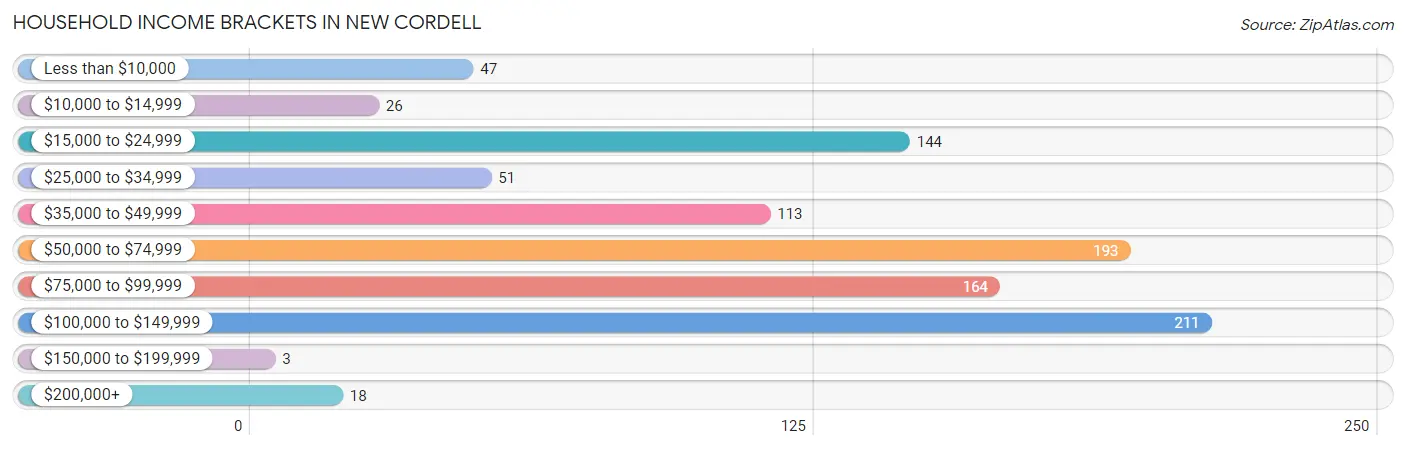
| Income Bracket | # Households | % Households |
| Less than $10,000 | 47 | 4.8% |
| $10,000 to $14,999 | 26 | 2.7% |
| $15,000 to $24,999 | 144 | 14.8% |
| $25,000 to $34,999 | 51 | 5.3% |
| $35,000 to $49,999 | 113 | 11.6% |
| $50,000 to $74,999 | 193 | 19.9% |
| $75,000 to $99,999 | 164 | 16.9% |
| $100,000 to $149,999 | 211 | 21.8% |
| $150,000 to $199,999 | 3 | 0.3% |
| $200,000+ | 18 | 1.9% |
Household Income by Householder Age in New Cordell
The median household income in New Cordell is $68,295, with the highest median household income of $68,813 found in the 45 to 64 years age bracket for the primary householder. A total of 373 households (38.5%) fall into this category. Meanwhile, the 25 to 44 years age bracket for the primary householder has the lowest median household income of $0, with 256 households (26.4%) in this group.
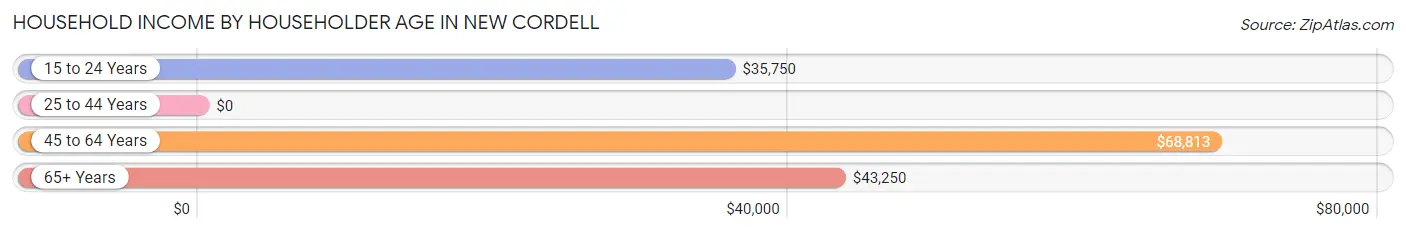
| Income Bracket | # Households | Median Income |
| 15 to 24 Years | 50 (5.1%) | $35,750 |
| 25 to 44 Years | 256 (26.4%) | $0 |
| 45 to 64 Years | 373 (38.5%) | $68,813 |
| 65+ Years | 291 (30.0%) | $43,250 |
| Total | 970 (100.0%) | $68,295 |
Poverty in New Cordell
Income Below Poverty by Sex and Age in New Cordell
With 4.0% poverty level for males and 7.1% for females among the residents of New Cordell, 35 to 44 year old males and 45 to 54 year old females are the most vulnerable to poverty, with 28 males (20.0%) and 12 females (13.5%) in their respective age groups living below the poverty level.
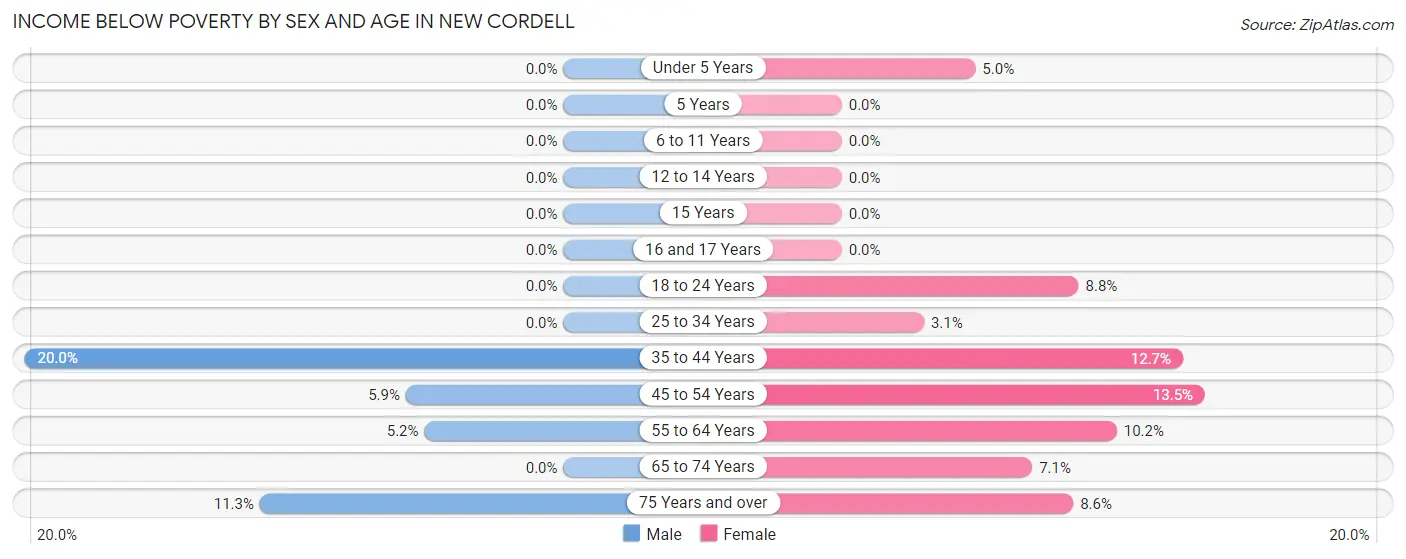
| Age Bracket | Male | Female |
| Under 5 Years | 0 (0.0%) | 6 (5.0%) |
| 5 Years | 0 (0.0%) | 0 (0.0%) |
| 6 to 11 Years | 0 (0.0%) | 0 (0.0%) |
| 12 to 14 Years | 0 (0.0%) | 0 (0.0%) |
| 15 Years | 0 (0.0%) | 0 (0.0%) |
| 16 and 17 Years | 0 (0.0%) | 0 (0.0%) |
| 18 to 24 Years | 0 (0.0%) | 8 (8.8%) |
| 25 to 34 Years | 0 (0.0%) | 5 (3.0%) |
| 35 to 44 Years | 28 (20.0%) | 10 (12.7%) |
| 45 to 54 Years | 10 (5.9%) | 12 (13.5%) |
| 55 to 64 Years | 11 (5.2%) | 24 (10.2%) |
| 65 to 74 Years | 0 (0.0%) | 7 (7.1%) |
| 75 Years and over | 8 (11.3%) | 11 (8.6%) |
| Total | 57 (4.0%) | 83 (7.1%) |
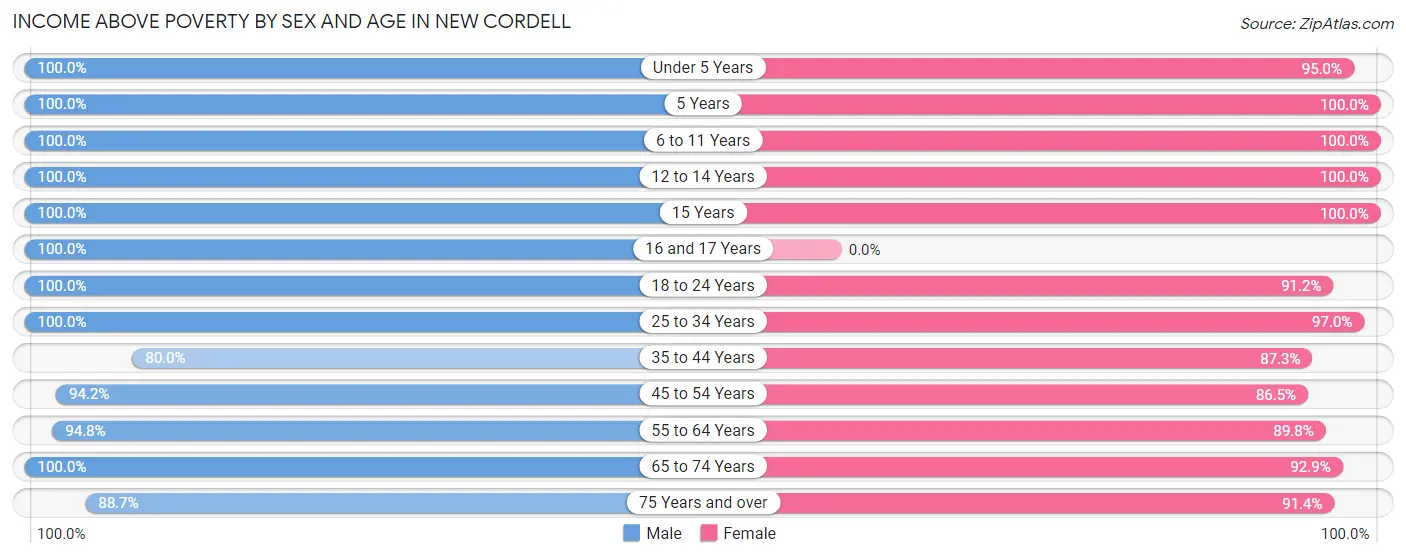
Income Above Poverty by Sex and Age in New Cordell
According to the poverty statistics in New Cordell, males aged under 5 years and females aged 5 years are the age groups that are most secure financially, with 100.0% of males and 100.0% of females in these age groups living above the poverty line.
| Age Bracket | Male | Female |
| Under 5 Years | 44 (100.0%) | 115 (95.0%) |
| 5 Years | 96 (100.0%) | 6 (100.0%) |
| 6 to 11 Years | 97 (100.0%) | 102 (100.0%) |
| 12 to 14 Years | 28 (100.0%) | 23 (100.0%) |
| 15 Years | 49 (100.0%) | 38 (100.0%) |
| 16 and 17 Years | 35 (100.0%) | 0 (0.0%) |
| 18 to 24 Years | 115 (100.0%) | 83 (91.2%) |
| 25 to 34 Years | 258 (100.0%) | 159 (97.0%) |
| 35 to 44 Years | 112 (80.0%) | 69 (87.3%) |
| 45 to 54 Years | 161 (94.2%) | 77 (86.5%) |
| 55 to 64 Years | 202 (94.8%) | 211 (89.8%) |
| 65 to 74 Years | 103 (100.0%) | 92 (92.9%) |
| 75 Years and over | 63 (88.7%) | 117 (91.4%) |
| Total | 1,363 (96.0%) | 1,092 (92.9%) |
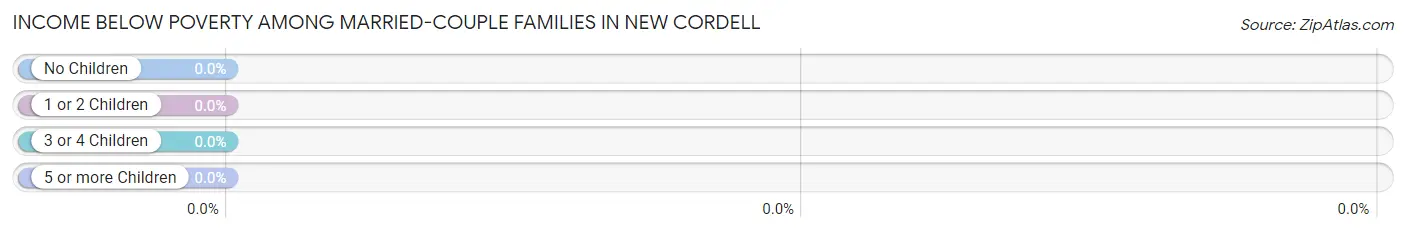
Income Below Poverty Among Married-Couple Families in New Cordell
| Children | Above Poverty | Below Poverty |
| No Children | 295 (100.0%) | 0 (0.0%) |
| 1 or 2 Children | 180 (100.0%) | 0 (0.0%) |
| 3 or 4 Children | 74 (100.0%) | 0 (0.0%) |
| 5 or more Children | 0 (0.0%) | 0 (0.0%) |
| Total | 549 (100.0%) | 0 (0.0%) |
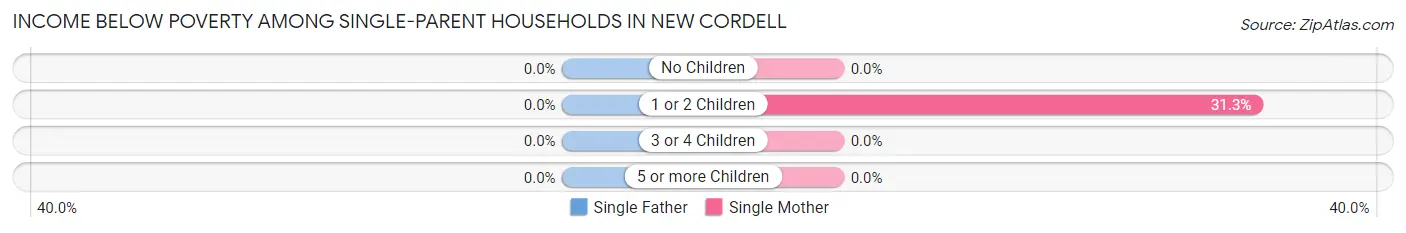
Income Below Poverty Among Single-Parent Households in New Cordell
| Children | Single Father | Single Mother |
| No Children | 0 (0.0%) | 0 (0.0%) |
| 1 or 2 Children | 0 (0.0%) | 5 (31.2%) |
| 3 or 4 Children | 0 (0.0%) | 0 (0.0%) |
| 5 or more Children | 0 (0.0%) | 0 (0.0%) |
| Total | 0 (0.0%) | 5 (12.8%) |
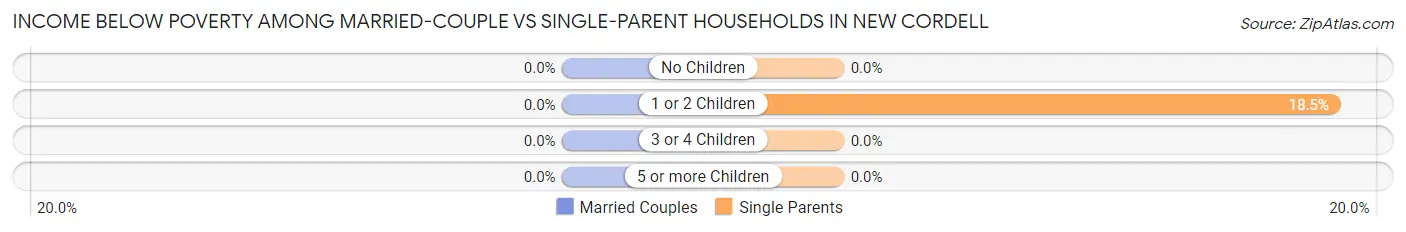
Income Below Poverty Among Married-Couple vs Single-Parent Households in New Cordell
| Children | Married-Couple Families | Single-Parent Households |
| No Children | 0 (0.0%) | 0 (0.0%) |
| 1 or 2 Children | 0 (0.0%) | 5 (18.5%) |
| 3 or 4 Children | 0 (0.0%) | 0 (0.0%) |
| 5 or more Children | 0 (0.0%) | 0 (0.0%) |
| Total | 0 (0.0%) | 5 (10.0%) |
Employment Characteristics in New Cordell
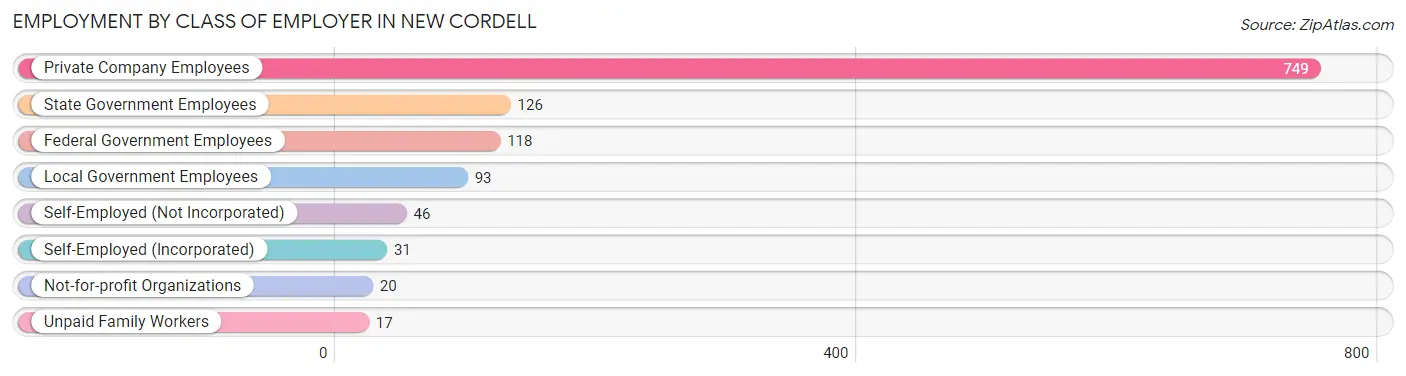
Employment by Class of Employer in New Cordell
Among the 1,200 employed individuals in New Cordell, private company employees (749 | 62.4%), state government employees (126 | 10.5%), and federal government employees (118 | 9.8%) make up the most common classes of employment.
| Employer Class | # Employees | % Employees |
| Private Company Employees | 749 | 62.4% |
| Self-Employed (Incorporated) | 31 | 2.6% |
| Self-Employed (Not Incorporated) | 46 | 3.8% |
| Not-for-profit Organizations | 20 | 1.7% |
| Local Government Employees | 93 | 7.7% |
| State Government Employees | 126 | 10.5% |
| Federal Government Employees | 118 | 9.8% |
| Unpaid Family Workers | 17 | 1.4% |
| Total | 1,200 | 100.0% |
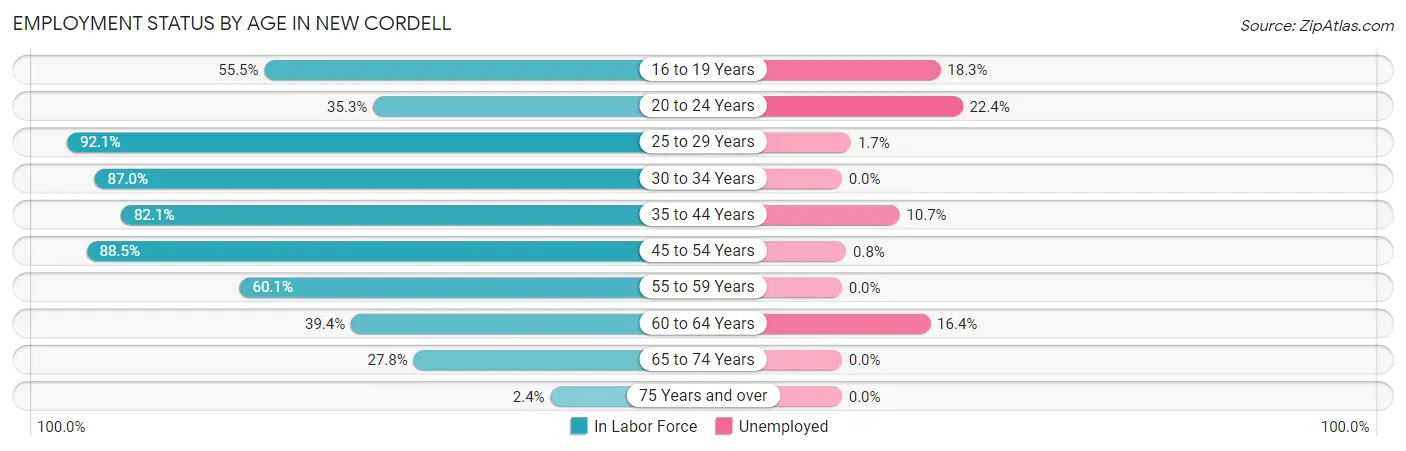
Employment Status by Age in New Cordell
According to the labor force statistics for New Cordell, out of the total population over 16 years of age (2,139), 59.2% or 1,266 individuals are in the labor force, with 4.9% or 62 of them unemployed. The age group with the highest labor force participation rate is 25 to 29 years, with 92.1% or 290 individuals in the labor force. Within the labor force, the 20 to 24 years age range has the highest percentage of unemployed individuals, with 22.4% or 11 of them being unemployed.
| Age Bracket | In Labor Force | Unemployed |
| 16 to 19 Years | 71 (55.5%) | 13 (18.3%) |
| 20 to 24 Years | 49 (35.3%) | 11 (22.4%) |
| 25 to 29 Years | 290 (92.1%) | 5 (1.7%) |
| 30 to 34 Years | 114 (87.0%) | 0 (0.0%) |
| 35 to 44 Years | 197 (82.1%) | 21 (10.7%) |
| 45 to 54 Years | 238 (88.5%) | 2 (0.8%) |
| 55 to 59 Years | 182 (60.1%) | 0 (0.0%) |
| 60 to 64 Years | 61 (39.4%) | 10 (16.4%) |
| 65 to 74 Years | 59 (27.8%) | 0 (0.0%) |
| 75 Years and over | 6 (2.4%) | 0 (0.0%) |
| Total | 1,266 (59.2%) | 62 (4.9%) |
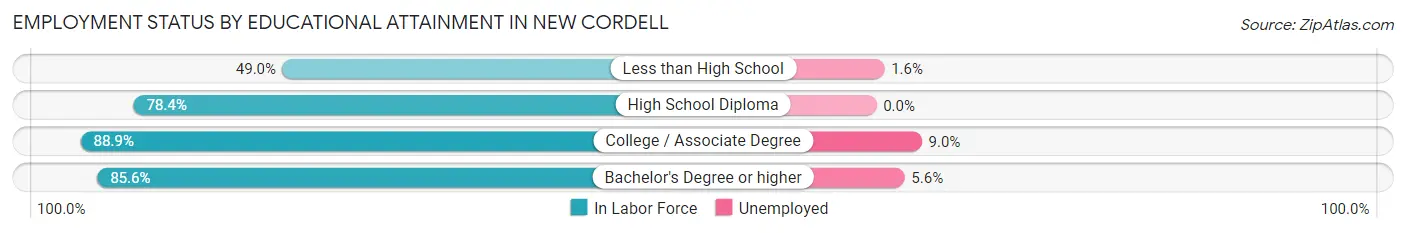
Employment Status by Educational Attainment in New Cordell
According to labor force statistics for New Cordell, 76.6% of individuals (1,082) out of the total population between 25 and 64 years of age (1,413) are in the labor force, with 3.5% or 38 of them being unemployed. The group with the highest labor force participation rate are those with the educational attainment of college / associate degree, with 88.9% or 289 individuals in the labor force. Within the labor force, individuals with college / associate degree education have the highest percentage of unemployment, with 9.0% or 26 of them being unemployed.
| Educational Attainment | In Labor Force | Unemployed |
| Less than High School | 125 (49.0%) | 4 (1.6%) |
| High School Diploma | 489 (78.4%) | 0 (0.0%) |
| College / Associate Degree | 289 (88.9%) | 29 (9.0%) |
| Bachelor's Degree or higher | 179 (85.6%) | 12 (5.6%) |
| Total | 1,082 (76.6%) | 49 (3.5%) |
Employment Occupations by Sex in New Cordell
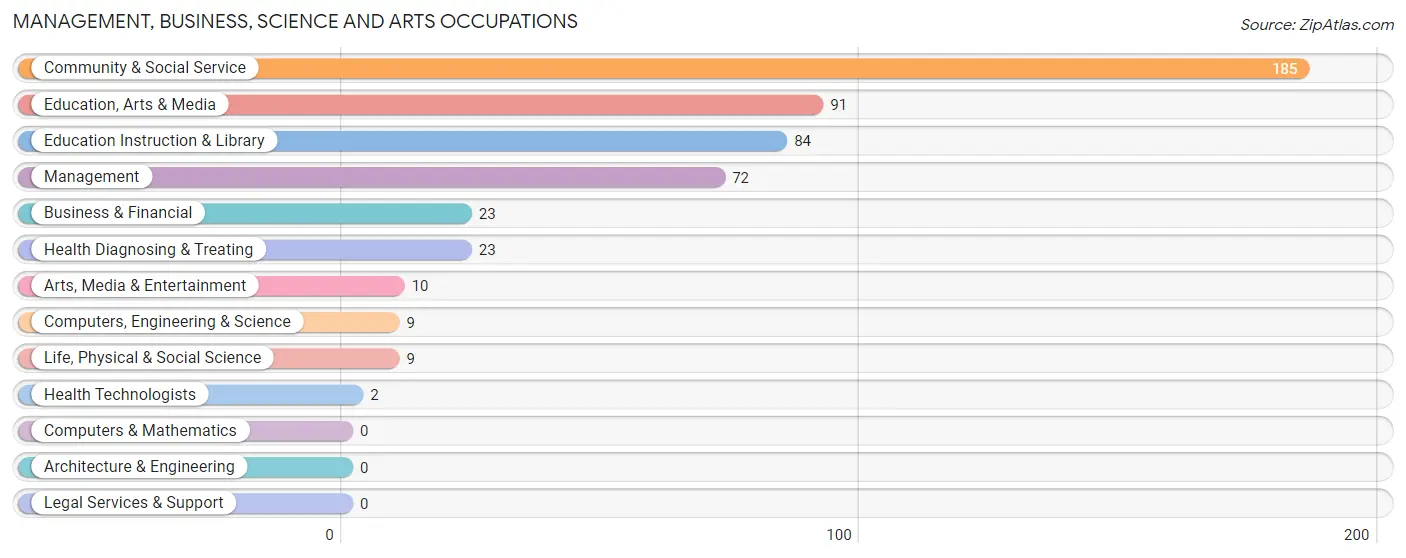
Management, Business, Science and Arts Occupations
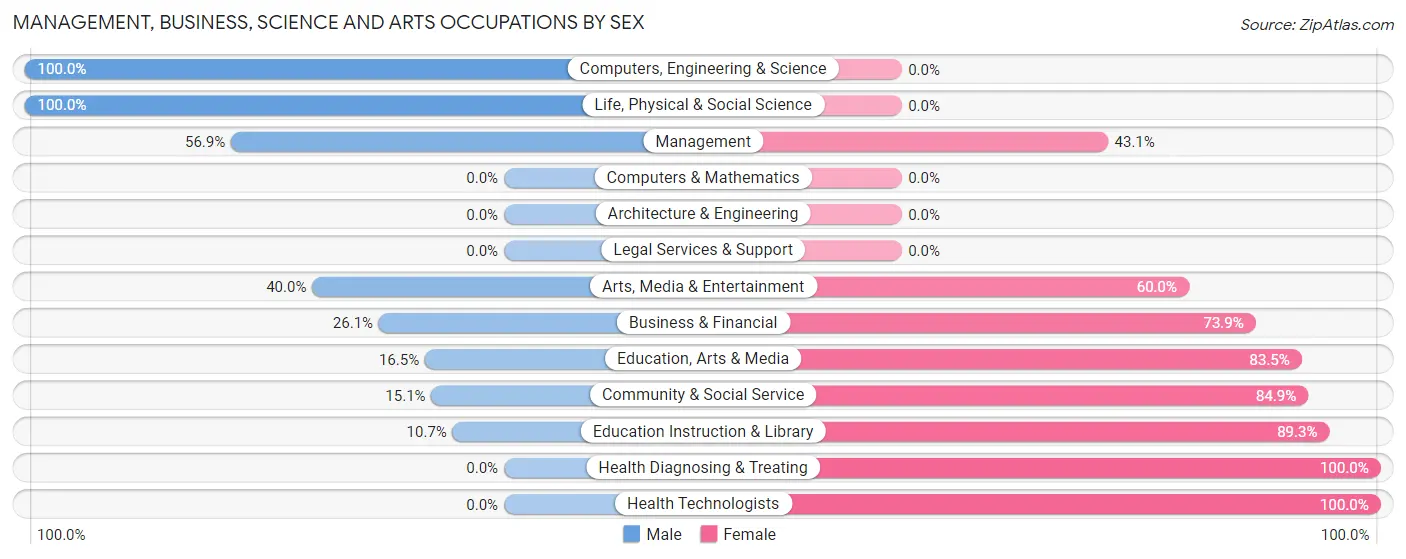
The most common Management, Business, Science and Arts occupations in New Cordell are Community & Social Service (185 | 15.3%), Education, Arts & Media (91 | 7.5%), Education Instruction & Library (84 | 7.0%), Management (72 | 6.0%), and Business & Financial (23 | 1.9%).
Management, Business, Science and Arts Occupations by Sex
Within the Management, Business, Science and Arts occupations in New Cordell, the most male-oriented occupations are Computers, Engineering & Science (100.0%), Life, Physical & Social Science (100.0%), and Management (56.9%), while the most female-oriented occupations are Health Diagnosing & Treating (100.0%), Health Technologists (100.0%), and Education Instruction & Library (89.3%).
| Occupation | Male | Female |
| Management | 41 (56.9%) | 31 (43.1%) |
| Business & Financial | 6 (26.1%) | 17 (73.9%) |
| Computers, Engineering & Science | 9 (100.0%) | 0 (0.0%) |
| Computers & Mathematics | 0 (0.0%) | 0 (0.0%) |
| Architecture & Engineering | 0 (0.0%) | 0 (0.0%) |
| Life, Physical & Social Science | 9 (100.0%) | 0 (0.0%) |
| Community & Social Service | 28 (15.1%) | 157 (84.9%) |
| Education, Arts & Media | 15 (16.5%) | 76 (83.5%) |
| Legal Services & Support | 0 (0.0%) | 0 (0.0%) |
| Education Instruction & Library | 9 (10.7%) | 75 (89.3%) |
| Arts, Media & Entertainment | 4 (40.0%) | 6 (60.0%) |
| Health Diagnosing & Treating | 0 (0.0%) | 23 (100.0%) |
| Health Technologists | 0 (0.0%) | 2 (100.0%) |
| Total (Category) | 84 (26.9%) | 228 (73.1%) |
| Total (Overall) | 729 (60.5%) | 476 (39.5%) |
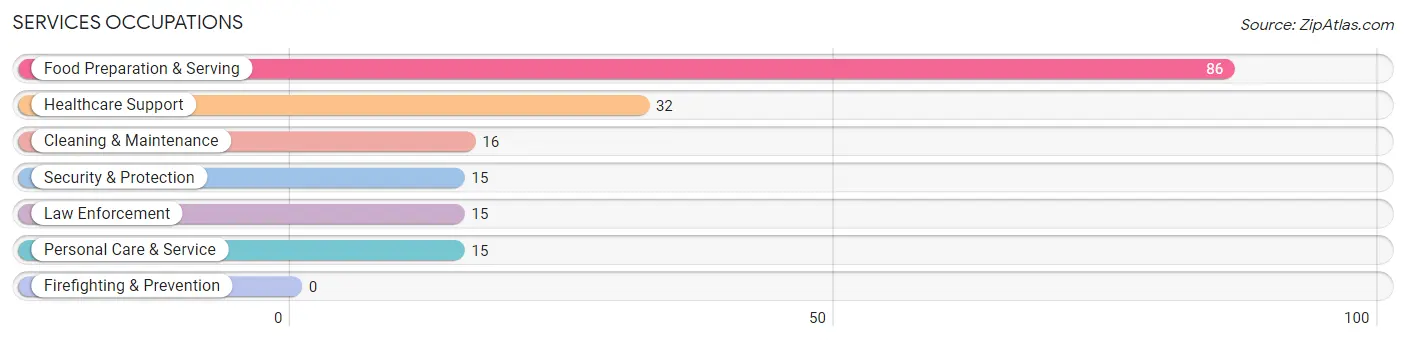
Services Occupations
The most common Services occupations in New Cordell are Food Preparation & Serving (86 | 7.1%), Healthcare Support (32 | 2.7%), Cleaning & Maintenance (16 | 1.3%), Security & Protection (15 | 1.2%), and Law Enforcement (15 | 1.2%).
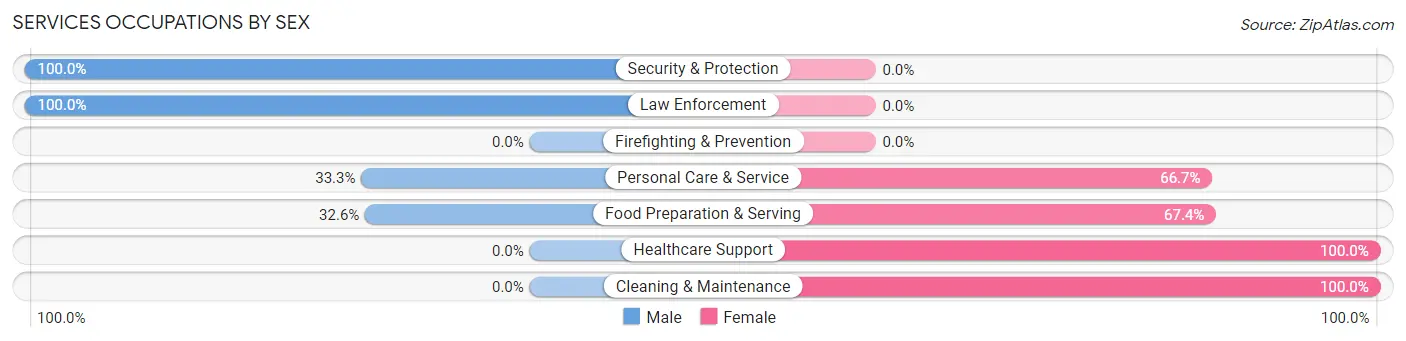
Services Occupations by Sex
Within the Services occupations in New Cordell, the most male-oriented occupations are Security & Protection (100.0%), Law Enforcement (100.0%), and Personal Care & Service (33.3%), while the most female-oriented occupations are Healthcare Support (100.0%), Cleaning & Maintenance (100.0%), and Food Preparation & Serving (67.4%).
| Occupation | Male | Female |
| Healthcare Support | 0 (0.0%) | 32 (100.0%) |
| Security & Protection | 15 (100.0%) | 0 (0.0%) |
| Firefighting & Prevention | 0 (0.0%) | 0 (0.0%) |
| Law Enforcement | 15 (100.0%) | 0 (0.0%) |
| Food Preparation & Serving | 28 (32.6%) | 58 (67.4%) |
| Cleaning & Maintenance | 0 (0.0%) | 16 (100.0%) |
| Personal Care & Service | 5 (33.3%) | 10 (66.7%) |
| Total (Category) | 48 (29.3%) | 116 (70.7%) |
| Total (Overall) | 729 (60.5%) | 476 (39.5%) |
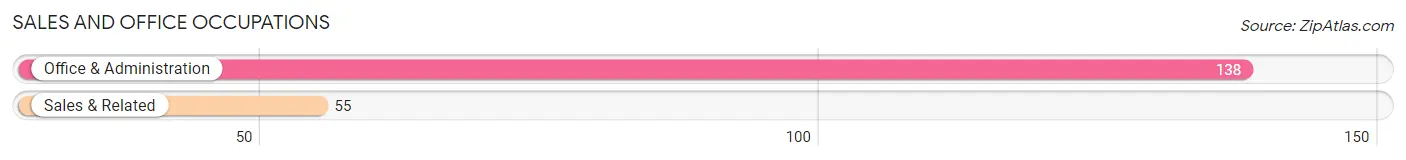
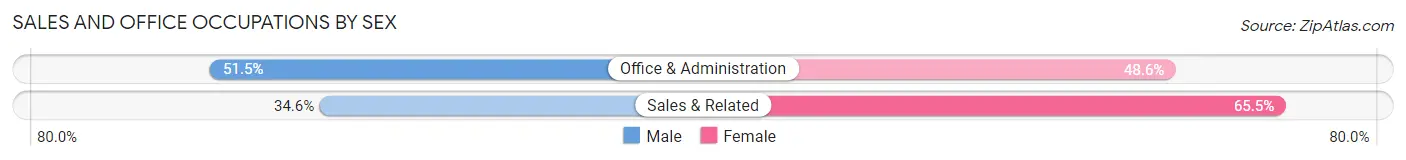
Sales and Office Occupations
The most common Sales and Office occupations in New Cordell are Office & Administration (138 | 11.5%), and Sales & Related (55 | 4.6%).
Sales and Office Occupations by Sex
| Occupation | Male | Female |
| Sales & Related | 19 (34.5%) | 36 (65.4%) |
| Office & Administration | 71 (51.4%) | 67 (48.5%) |
| Total (Category) | 90 (46.6%) | 103 (53.4%) |
| Total (Overall) | 729 (60.5%) | 476 (39.5%) |
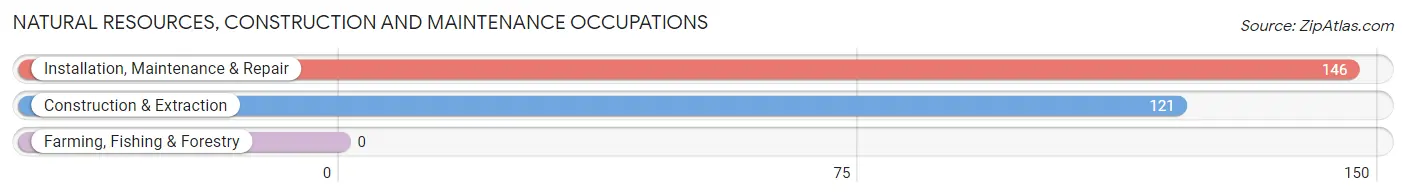
Natural Resources, Construction and Maintenance Occupations
The most common Natural Resources, Construction and Maintenance occupations in New Cordell are Installation, Maintenance & Repair (146 | 12.1%), and Construction & Extraction (121 | 10.0%).
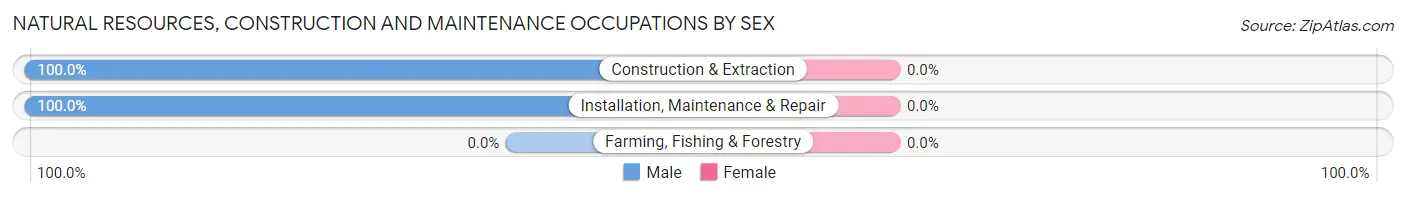
Natural Resources, Construction and Maintenance Occupations by Sex
| Occupation | Male | Female |
| Farming, Fishing & Forestry | 0 (0.0%) | 0 (0.0%) |
| Construction & Extraction | 121 (100.0%) | 0 (0.0%) |
| Installation, Maintenance & Repair | 146 (100.0%) | 0 (0.0%) |
| Total (Category) | 267 (100.0%) | 0 (0.0%) |
| Total (Overall) | 729 (60.5%) | 476 (39.5%) |
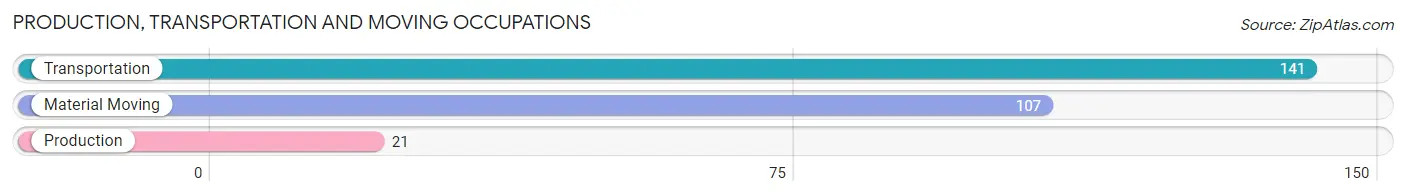
Production, Transportation and Moving Occupations
The most common Production, Transportation and Moving occupations in New Cordell are Transportation (141 | 11.7%), Material Moving (107 | 8.9%), and Production (21 | 1.7%).
Production, Transportation and Moving Occupations by Sex
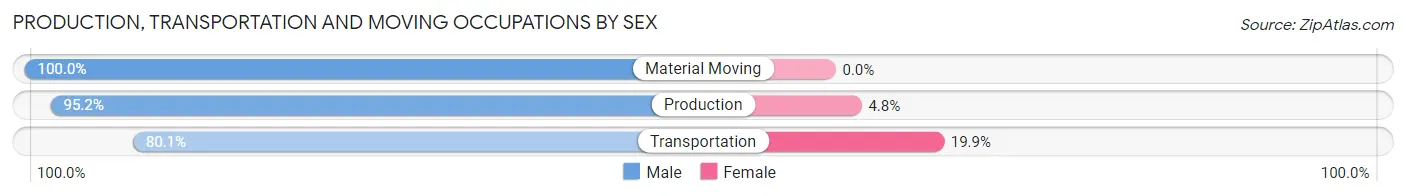
| Occupation | Male | Female |
| Production | 20 (95.2%) | 1 (4.8%) |
| Transportation | 113 (80.1%) | 28 (19.9%) |
| Material Moving | 107 (100.0%) | 0 (0.0%) |
| Total (Category) | 240 (89.2%) | 29 (10.8%) |
| Total (Overall) | 729 (60.5%) | 476 (39.5%) |
Employment Industries by Sex in New Cordell
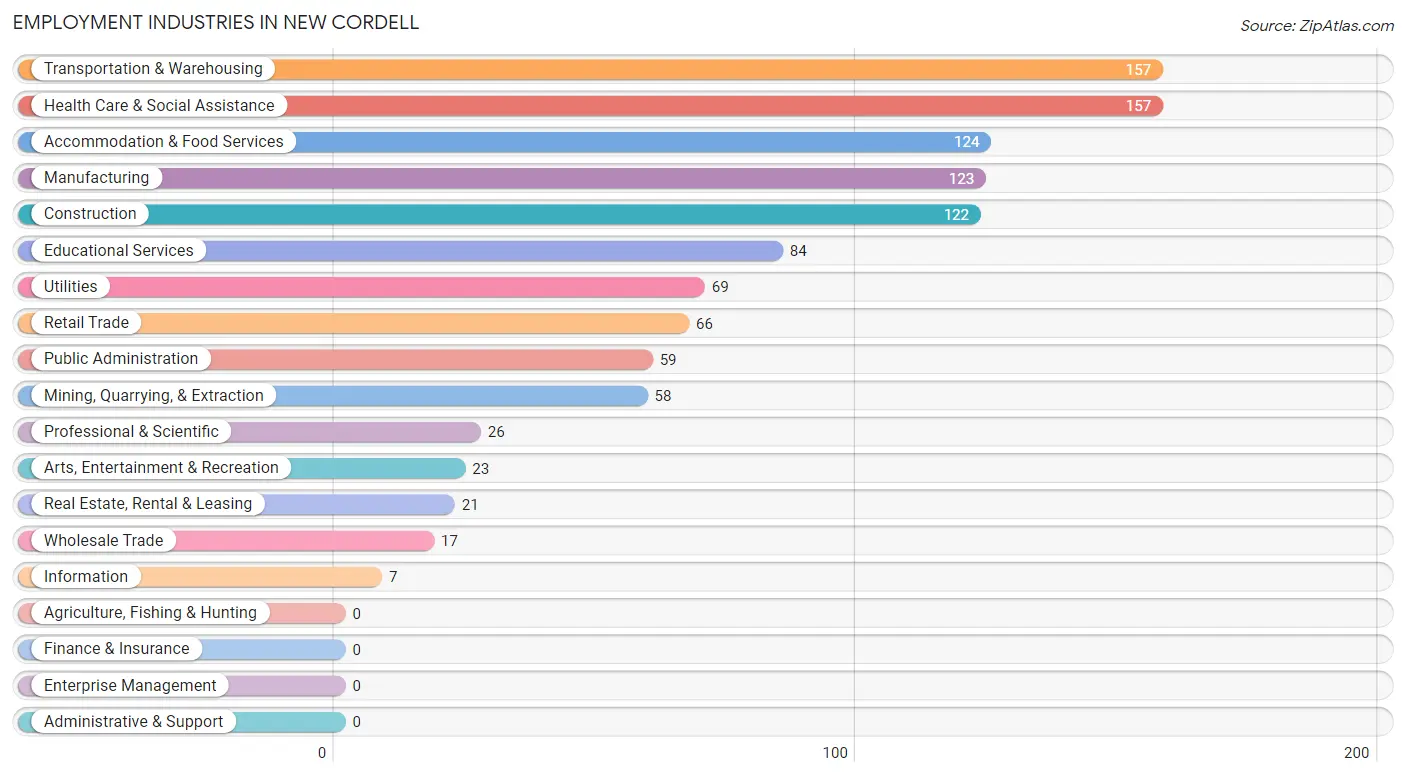
Employment Industries in New Cordell
The major employment industries in New Cordell include Transportation & Warehousing (157 | 13.0%), Health Care & Social Assistance (157 | 13.0%), Accommodation & Food Services (124 | 10.3%), Manufacturing (123 | 10.2%), and Construction (122 | 10.1%).
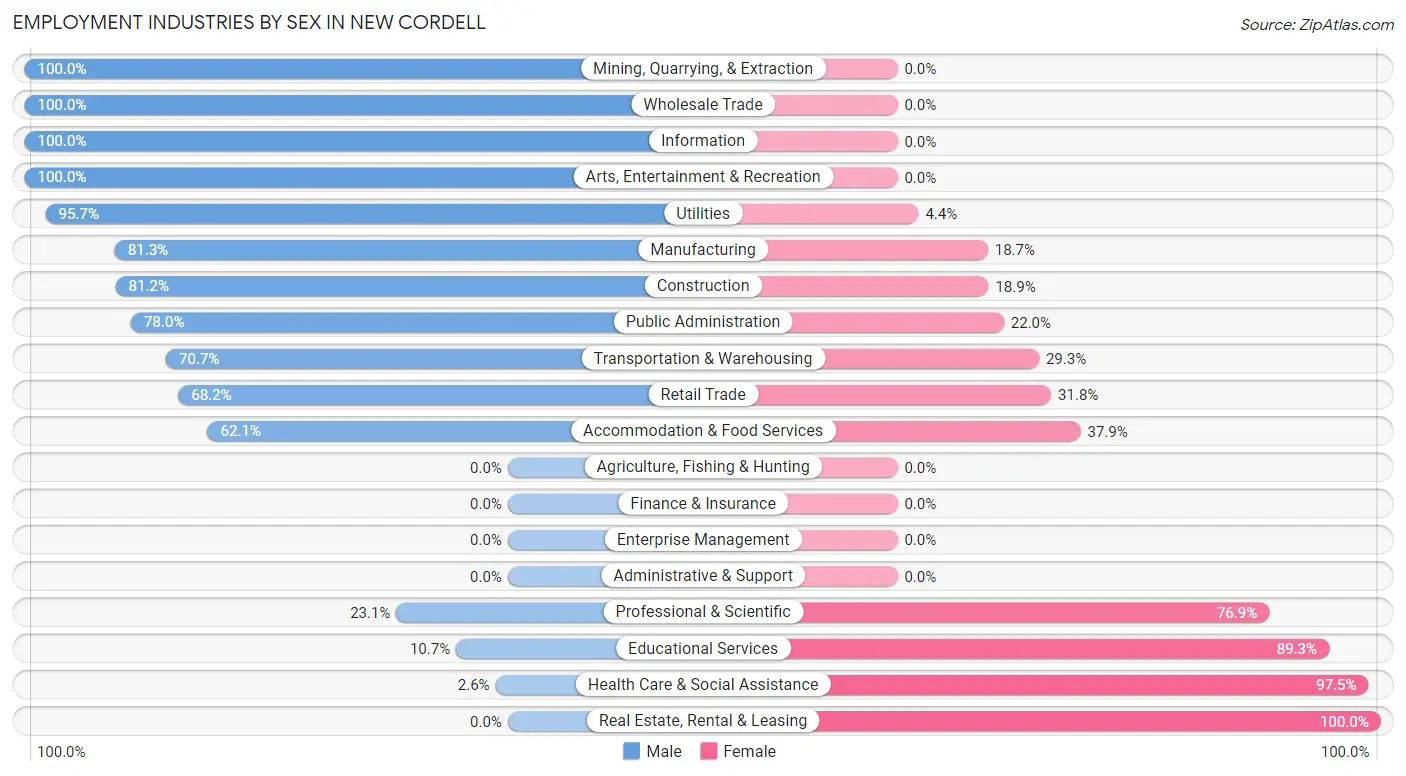
Employment Industries by Sex in New Cordell
The New Cordell industries that see more men than women are Mining, Quarrying, & Extraction (100.0%), Wholesale Trade (100.0%), and Information (100.0%), whereas the industries that tend to have a higher number of women are Real Estate, Rental & Leasing (100.0%), Health Care & Social Assistance (97.5%), and Educational Services (89.3%).
| Industry | Male | Female |
| Agriculture, Fishing & Hunting | 0 (0.0%) | 0 (0.0%) |
| Mining, Quarrying, & Extraction | 58 (100.0%) | 0 (0.0%) |
| Construction | 99 (81.1%) | 23 (18.9%) |
| Manufacturing | 100 (81.3%) | 23 (18.7%) |
| Wholesale Trade | 17 (100.0%) | 0 (0.0%) |
| Retail Trade | 45 (68.2%) | 21 (31.8%) |
| Transportation & Warehousing | 111 (70.7%) | 46 (29.3%) |
| Utilities | 66 (95.7%) | 3 (4.3%) |
| Information | 7 (100.0%) | 0 (0.0%) |
| Finance & Insurance | 0 (0.0%) | 0 (0.0%) |
| Real Estate, Rental & Leasing | 0 (0.0%) | 21 (100.0%) |
| Professional & Scientific | 6 (23.1%) | 20 (76.9%) |
| Enterprise Management | 0 (0.0%) | 0 (0.0%) |
| Administrative & Support | 0 (0.0%) | 0 (0.0%) |
| Educational Services | 9 (10.7%) | 75 (89.3%) |
| Health Care & Social Assistance | 4 (2.5%) | 153 (97.5%) |
| Arts, Entertainment & Recreation | 23 (100.0%) | 0 (0.0%) |
| Accommodation & Food Services | 77 (62.1%) | 47 (37.9%) |
| Public Administration | 46 (78.0%) | 13 (22.0%) |
| Total | 729 (60.5%) | 476 (39.5%) |
Education in New Cordell
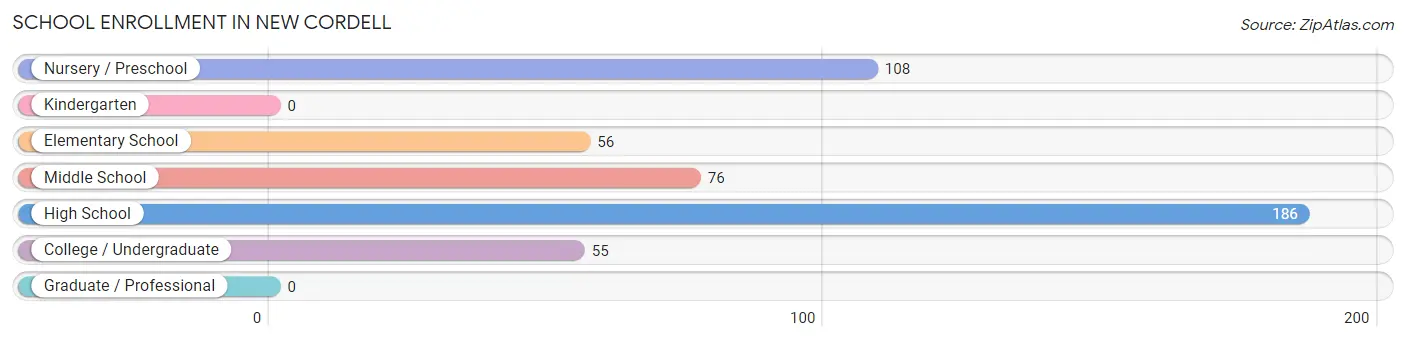
School Enrollment in New Cordell
The most common levels of schooling among the 481 students in New Cordell are high school (186 | 38.7%), nursery / preschool (108 | 22.5%), and middle school (76 | 15.8%).
| School Level | # Students | % Students |
| Nursery / Preschool | 108 | 22.5% |
| Kindergarten | 0 | 0.0% |
| Elementary School | 56 | 11.6% |
| Middle School | 76 | 15.8% |
| High School | 186 | 38.7% |
| College / Undergraduate | 55 | 11.4% |
| Graduate / Professional | 0 | 0.0% |
| Total | 481 | 100.0% |
School Enrollment by Age by Funding Source in New Cordell
Out of a total of 481 students who are enrolled in schools in New Cordell, 6 (1.2%) attend a private institution, while the remaining 475 (98.8%) are enrolled in public schools. The age group of 25 to 34 year olds has the highest likelihood of being enrolled in private schools, with 6 (100.0% in the age bracket) enrolled. Conversely, the age group of 3 to 4 year olds has the lowest likelihood of being enrolled in a private school, with 6 (100.0% in the age bracket) attending a public institution.
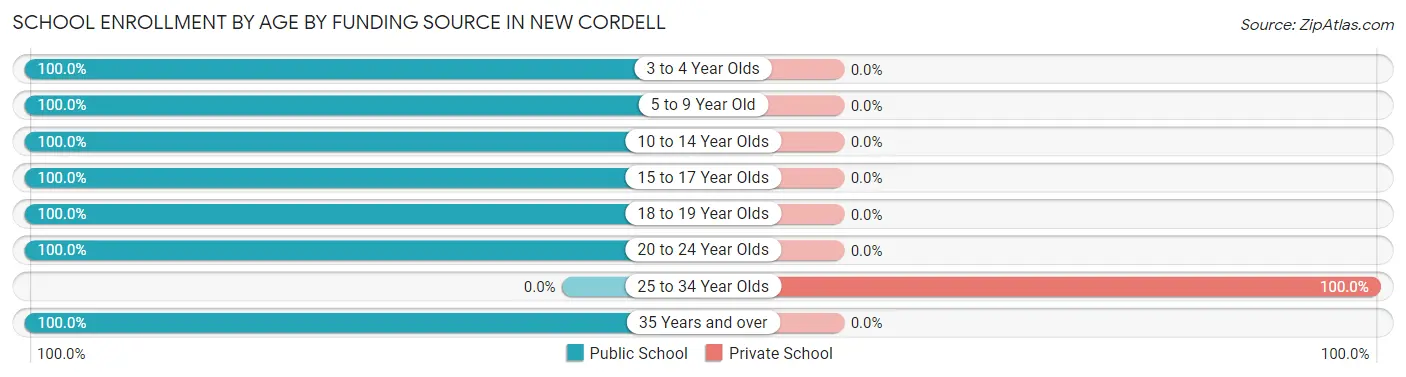
| Age Bracket | Public School | Private School |
| 3 to 4 Year Olds | 6 (100.0%) | 0 (0.0%) |
| 5 to 9 Year Old | 157 (100.0%) | 0 (0.0%) |
| 10 to 14 Year Olds | 77 (100.0%) | 0 (0.0%) |
| 15 to 17 Year Olds | 122 (100.0%) | 0 (0.0%) |
| 18 to 19 Year Olds | 60 (100.0%) | 0 (0.0%) |
| 20 to 24 Year Olds | 17 (100.0%) | 0 (0.0%) |
| 25 to 34 Year Olds | 0 (0.0%) | 6 (100.0%) |
| 35 Years and over | 36 (100.0%) | 0 (0.0%) |
| Total | 475 (98.8%) | 6 (1.2%) |
Educational Attainment by Field of Study in New Cordell
Education (129 | 43.9%), business (40 | 13.6%), engineering (28 | 9.5%), liberal arts & history (22 | 7.5%), and arts & humanities (21 | 7.1%) are the most common fields of study among 294 individuals in New Cordell who have obtained a bachelor's degree or higher.
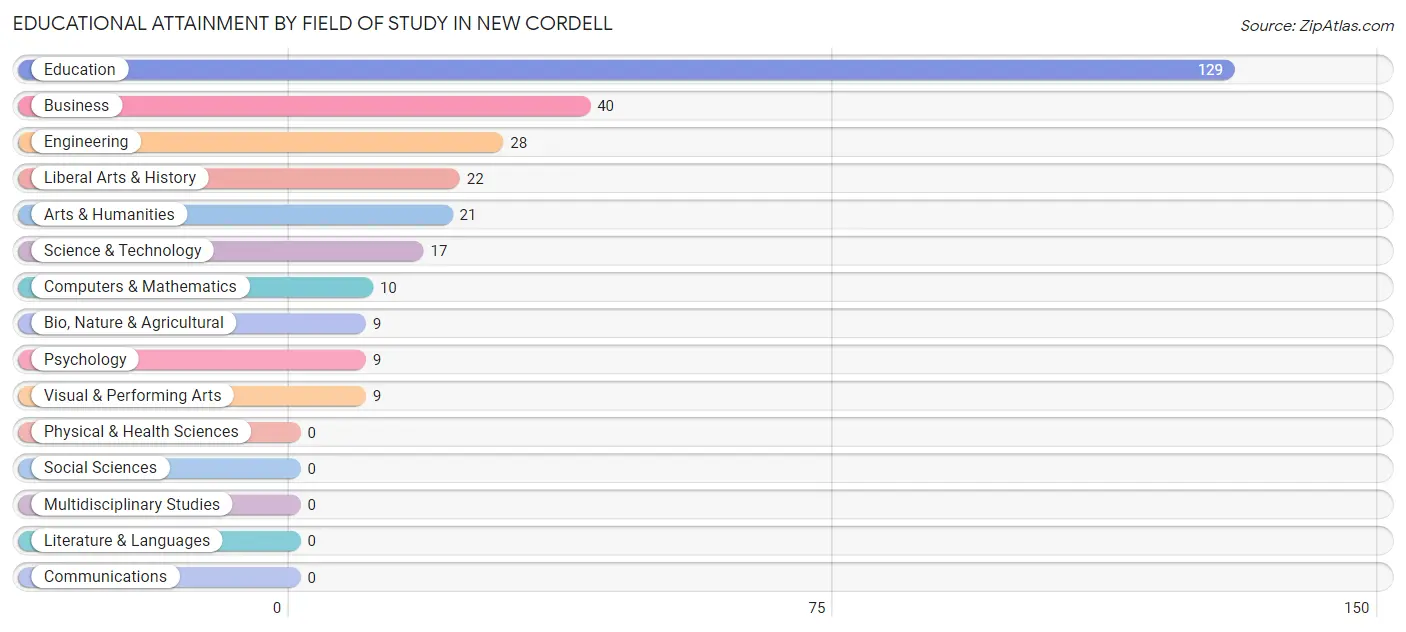
| Field of Study | # Graduates | % Graduates |
| Computers & Mathematics | 10 | 3.4% |
| Bio, Nature & Agricultural | 9 | 3.1% |
| Physical & Health Sciences | 0 | 0.0% |
| Psychology | 9 | 3.1% |
| Social Sciences | 0 | 0.0% |
| Engineering | 28 | 9.5% |
| Multidisciplinary Studies | 0 | 0.0% |
| Science & Technology | 17 | 5.8% |
| Business | 40 | 13.6% |
| Education | 129 | 43.9% |
| Literature & Languages | 0 | 0.0% |
| Liberal Arts & History | 22 | 7.5% |
| Visual & Performing Arts | 9 | 3.1% |
| Communications | 0 | 0.0% |
| Arts & Humanities | 21 | 7.1% |
| Total | 294 | 100.0% |
Transportation & Commute in New Cordell
Vehicle Availability by Sex in New Cordell
The most prevalent vehicle ownership categories in New Cordell are males with 2 vehicles (294, accounting for 40.6%) and females with 2 vehicles (218, making up 61.8%).
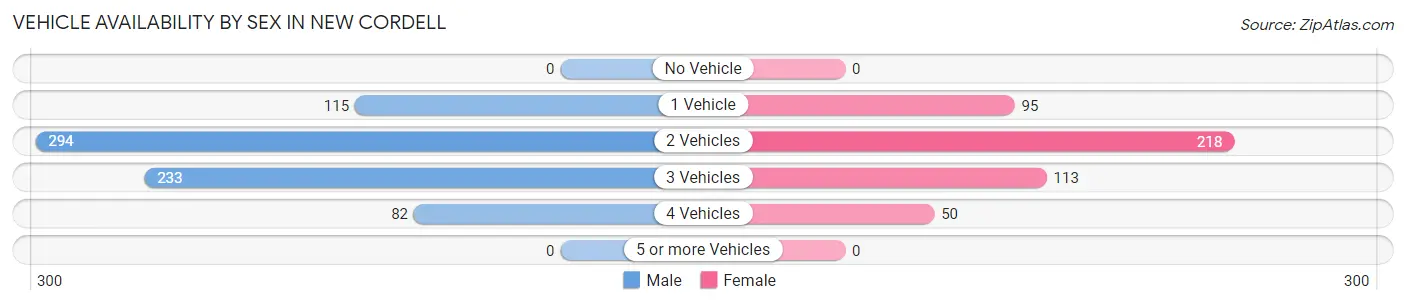
| Vehicles Available | Male | Female |
| No Vehicle | 0 (0.0%) | 0 (0.0%) |
| 1 Vehicle | 115 (15.9%) | 95 (20.0%) |
| 2 Vehicles | 294 (40.6%) | 218 (45.8%) |
| 3 Vehicles | 233 (32.2%) | 113 (23.7%) |
| 4 Vehicles | 82 (11.3%) | 50 (10.5%) |
| 5 or more Vehicles | 0 (0.0%) | 0 (0.0%) |
| Total | 724 (100.0%) | 476 (100.0%) |
Commute Time in New Cordell
The most frequently occuring commute durations in New Cordell are less than 5 minutes (242 commuters, 22.3%), 20 to 24 minutes (186 commuters, 17.1%), and 15 to 19 minutes (113 commuters, 10.4%).
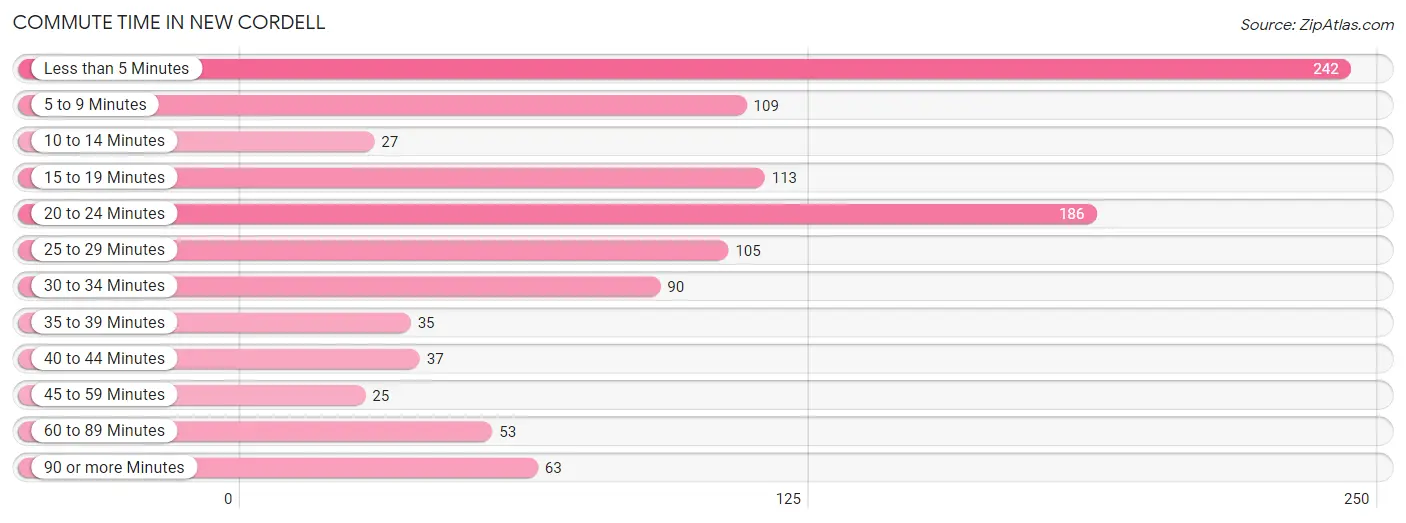
| Commute Time | # Commuters | % Commuters |
| Less than 5 Minutes | 242 | 22.3% |
| 5 to 9 Minutes | 109 | 10.1% |
| 10 to 14 Minutes | 27 | 2.5% |
| 15 to 19 Minutes | 113 | 10.4% |
| 20 to 24 Minutes | 186 | 17.1% |
| 25 to 29 Minutes | 105 | 9.7% |
| 30 to 34 Minutes | 90 | 8.3% |
| 35 to 39 Minutes | 35 | 3.2% |
| 40 to 44 Minutes | 37 | 3.4% |
| 45 to 59 Minutes | 25 | 2.3% |
| 60 to 89 Minutes | 53 | 4.9% |
| 90 or more Minutes | 63 | 5.8% |
Commute Time by Sex in New Cordell
The most common commute times in New Cordell are 15 to 19 minutes (113 commuters, 17.6%) for males and 20 to 24 minutes (140 commuters, 31.6%) for females.
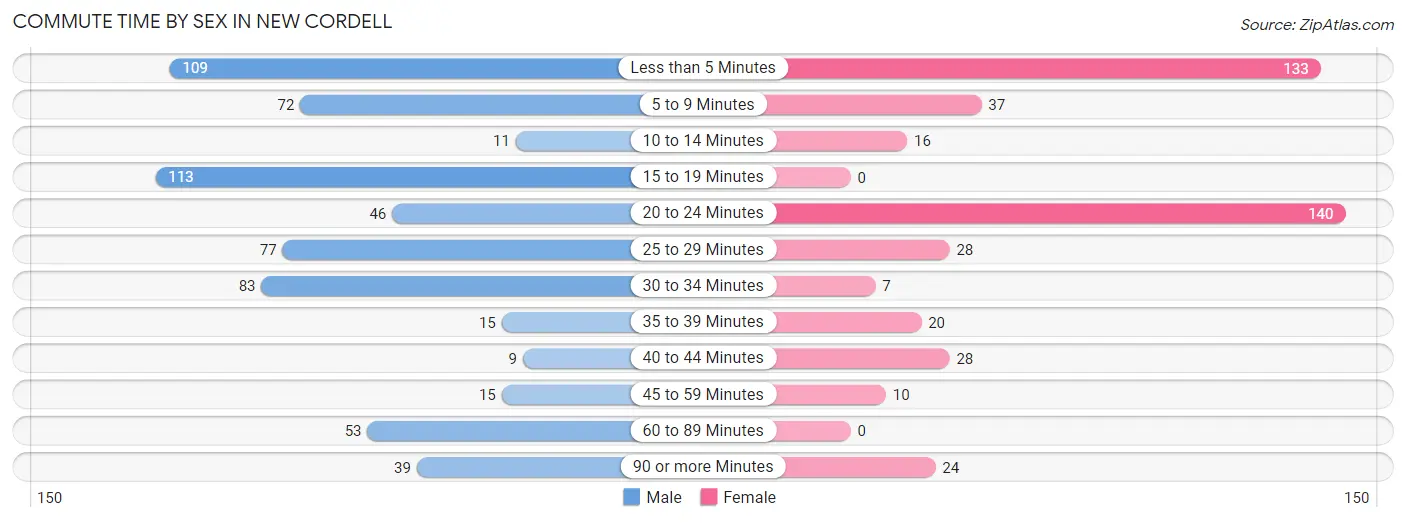
| Commute Time | Male | Female |
| Less than 5 Minutes | 109 (17.0%) | 133 (30.0%) |
| 5 to 9 Minutes | 72 (11.2%) | 37 (8.4%) |
| 10 to 14 Minutes | 11 (1.7%) | 16 (3.6%) |
| 15 to 19 Minutes | 113 (17.6%) | 0 (0.0%) |
| 20 to 24 Minutes | 46 (7.2%) | 140 (31.6%) |
| 25 to 29 Minutes | 77 (12.0%) | 28 (6.3%) |
| 30 to 34 Minutes | 83 (12.9%) | 7 (1.6%) |
| 35 to 39 Minutes | 15 (2.3%) | 20 (4.5%) |
| 40 to 44 Minutes | 9 (1.4%) | 28 (6.3%) |
| 45 to 59 Minutes | 15 (2.3%) | 10 (2.3%) |
| 60 to 89 Minutes | 53 (8.3%) | 0 (0.0%) |
| 90 or more Minutes | 39 (6.1%) | 24 (5.4%) |
Time of Departure to Work by Sex in New Cordell
The most frequent times of departure to work in New Cordell are 6:00 AM to 6:29 AM (191, 29.7%) for males and 7:00 AM to 7:29 AM (117, 26.4%) for females.
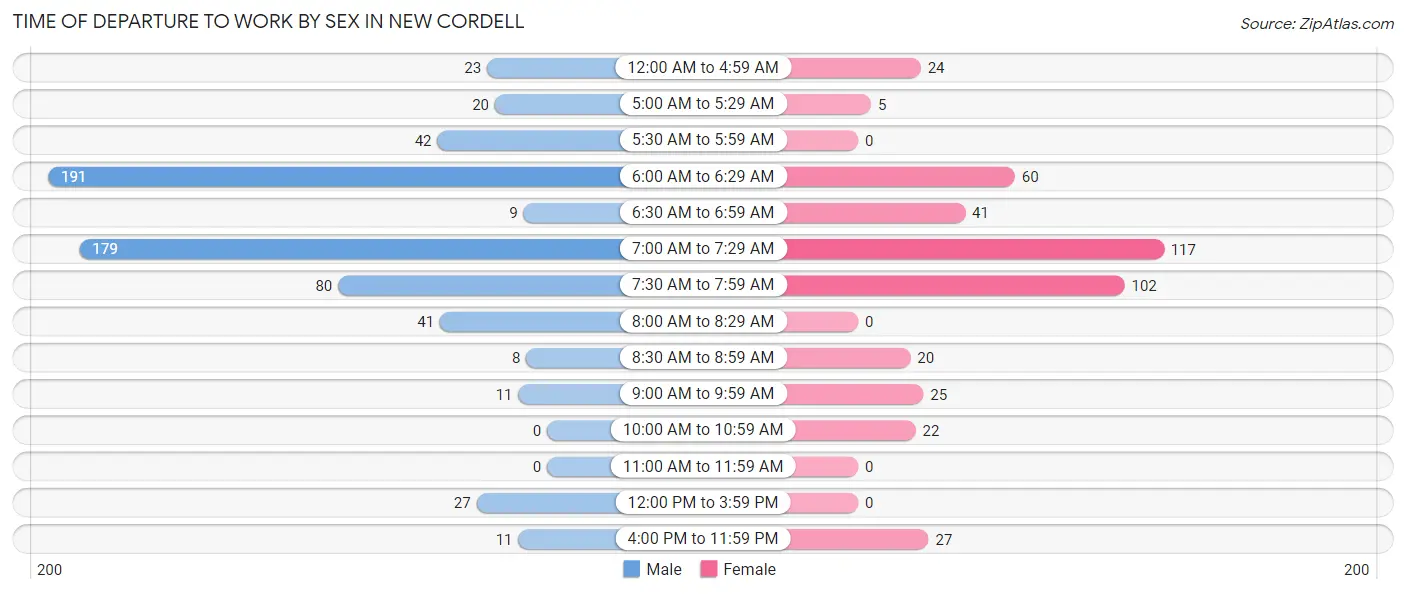
| Time of Departure | Male | Female |
| 12:00 AM to 4:59 AM | 23 (3.6%) | 24 (5.4%) |
| 5:00 AM to 5:29 AM | 20 (3.1%) | 5 (1.1%) |
| 5:30 AM to 5:59 AM | 42 (6.5%) | 0 (0.0%) |
| 6:00 AM to 6:29 AM | 191 (29.7%) | 60 (13.5%) |
| 6:30 AM to 6:59 AM | 9 (1.4%) | 41 (9.3%) |
| 7:00 AM to 7:29 AM | 179 (27.9%) | 117 (26.4%) |
| 7:30 AM to 7:59 AM | 80 (12.5%) | 102 (23.0%) |
| 8:00 AM to 8:29 AM | 41 (6.4%) | 0 (0.0%) |
| 8:30 AM to 8:59 AM | 8 (1.3%) | 20 (4.5%) |
| 9:00 AM to 9:59 AM | 11 (1.7%) | 25 (5.6%) |
| 10:00 AM to 10:59 AM | 0 (0.0%) | 22 (5.0%) |
| 11:00 AM to 11:59 AM | 0 (0.0%) | 0 (0.0%) |
| 12:00 PM to 3:59 PM | 27 (4.2%) | 0 (0.0%) |
| 4:00 PM to 11:59 PM | 11 (1.7%) | 27 (6.1%) |
| Total | 642 (100.0%) | 443 (100.0%) |
Housing Occupancy in New Cordell
Occupancy by Ownership in New Cordell
Of the total 970 dwellings in New Cordell, owner-occupied units account for 728 (75.0%), while renter-occupied units make up 242 (24.9%).
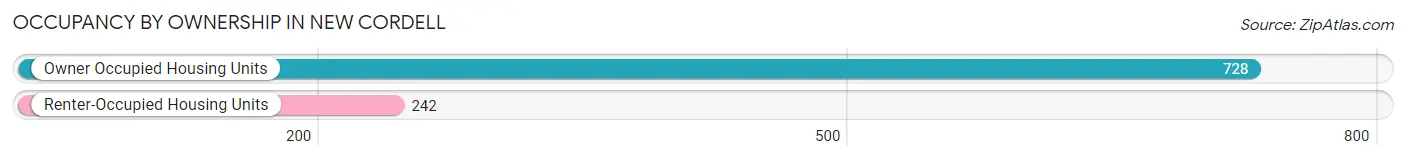
| Occupancy | # Housing Units | % Housing Units |
| Owner Occupied Housing Units | 728 | 75.0% |
| Renter-Occupied Housing Units | 242 | 24.9% |
| Total Occupied Housing Units | 970 | 100.0% |
Occupancy by Household Size in New Cordell
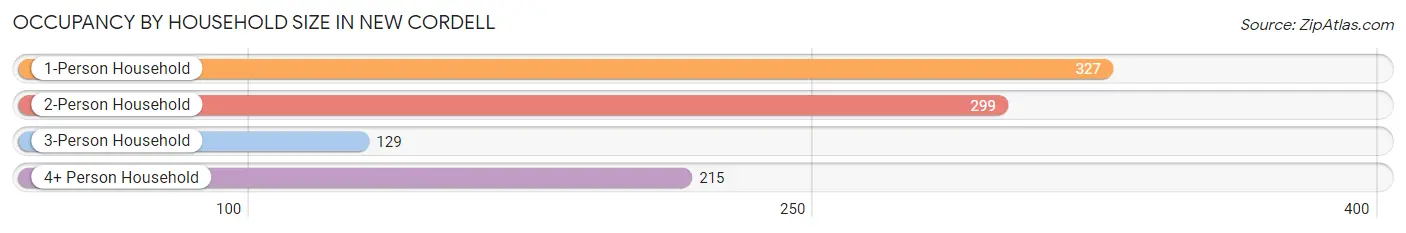
| Household Size | # Housing Units | % Housing Units |
| 1-Person Household | 327 | 33.7% |
| 2-Person Household | 299 | 30.8% |
| 3-Person Household | 129 | 13.3% |
| 4+ Person Household | 215 | 22.2% |
| Total Housing Units | 970 | 100.0% |
Occupancy by Ownership by Household Size in New Cordell
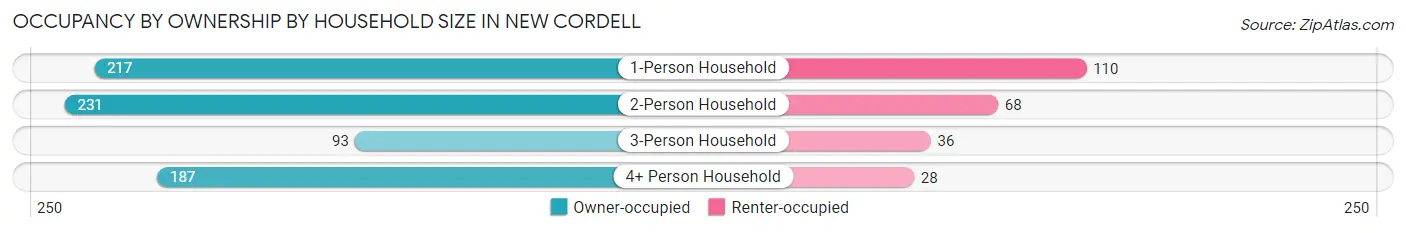
| Household Size | Owner-occupied | Renter-occupied |
| 1-Person Household | 217 (66.4%) | 110 (33.6%) |
| 2-Person Household | 231 (77.3%) | 68 (22.7%) |
| 3-Person Household | 93 (72.1%) | 36 (27.9%) |
| 4+ Person Household | 187 (87.0%) | 28 (13.0%) |
| Total Housing Units | 728 (75.0%) | 242 (24.9%) |
Occupancy by Educational Attainment in New Cordell
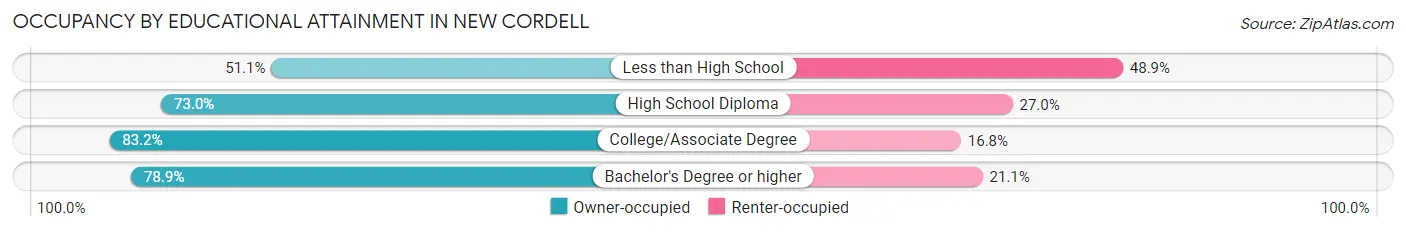
| Household Size | Owner-occupied | Renter-occupied |
| Less than High School | 47 (51.1%) | 45 (48.9%) |
| High School Diploma | 286 (73.0%) | 106 (27.0%) |
| College/Associate Degree | 223 (83.2%) | 45 (16.8%) |
| Bachelor's Degree or higher | 172 (78.9%) | 46 (21.1%) |
Occupancy by Age of Householder in New Cordell
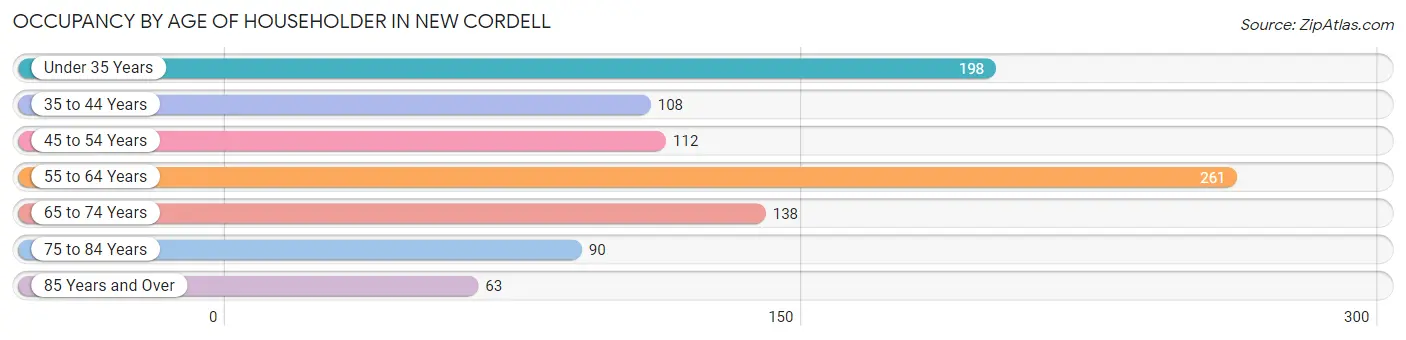
| Age Bracket | # Households | % Households |
| Under 35 Years | 198 | 20.4% |
| 35 to 44 Years | 108 | 11.1% |
| 45 to 54 Years | 112 | 11.6% |
| 55 to 64 Years | 261 | 26.9% |
| 65 to 74 Years | 138 | 14.2% |
| 75 to 84 Years | 90 | 9.3% |
| 85 Years and Over | 63 | 6.5% |
| Total | 970 | 100.0% |
Housing Finances in New Cordell
Median Income by Occupancy in New Cordell
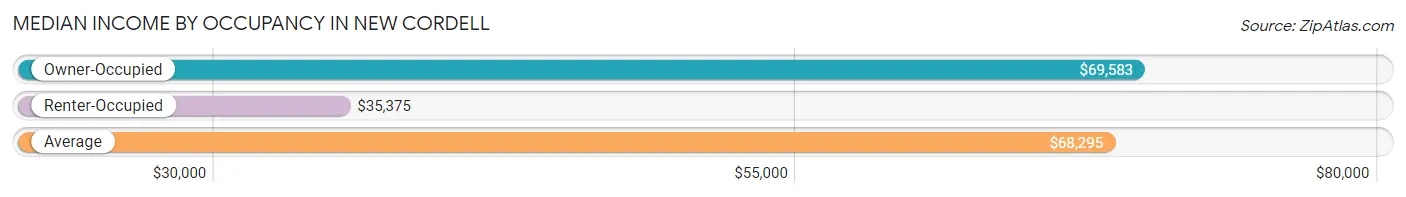
| Occupancy Type | # Households | Median Income |
| Owner-Occupied | 728 (75.0%) | $69,583 |
| Renter-Occupied | 242 (24.9%) | $35,375 |
| Average | 970 (100.0%) | $68,295 |
Occupancy by Householder Income Bracket in New Cordell
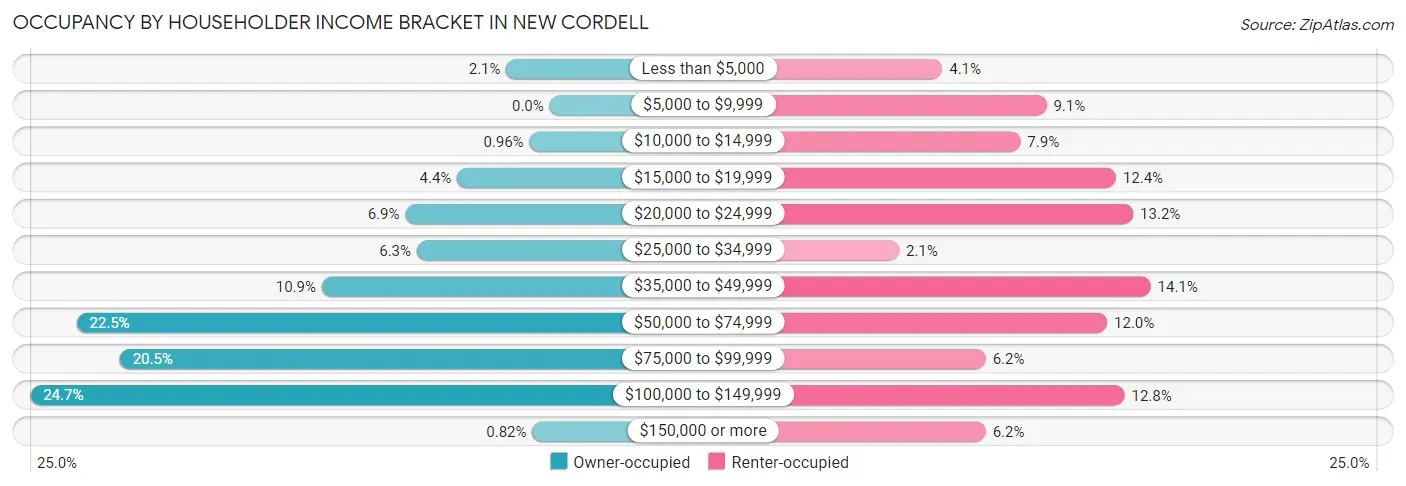
| Income Bracket | Owner-occupied | Renter-occupied |
| Less than $5,000 | 15 (2.1%) | 10 (4.1%) |
| $5,000 to $9,999 | 0 (0.0%) | 22 (9.1%) |
| $10,000 to $14,999 | 7 (1.0%) | 19 (7.9%) |
| $15,000 to $19,999 | 32 (4.4%) | 30 (12.4%) |
| $20,000 to $24,999 | 50 (6.9%) | 32 (13.2%) |
| $25,000 to $34,999 | 46 (6.3%) | 5 (2.1%) |
| $35,000 to $49,999 | 79 (10.8%) | 34 (14.1%) |
| $50,000 to $74,999 | 164 (22.5%) | 29 (12.0%) |
| $75,000 to $99,999 | 149 (20.5%) | 15 (6.2%) |
| $100,000 to $149,999 | 180 (24.7%) | 31 (12.8%) |
| $150,000 or more | 6 (0.8%) | 15 (6.2%) |
| Total | 728 (100.0%) | 242 (100.0%) |
Monthly Housing Cost Tiers in New Cordell
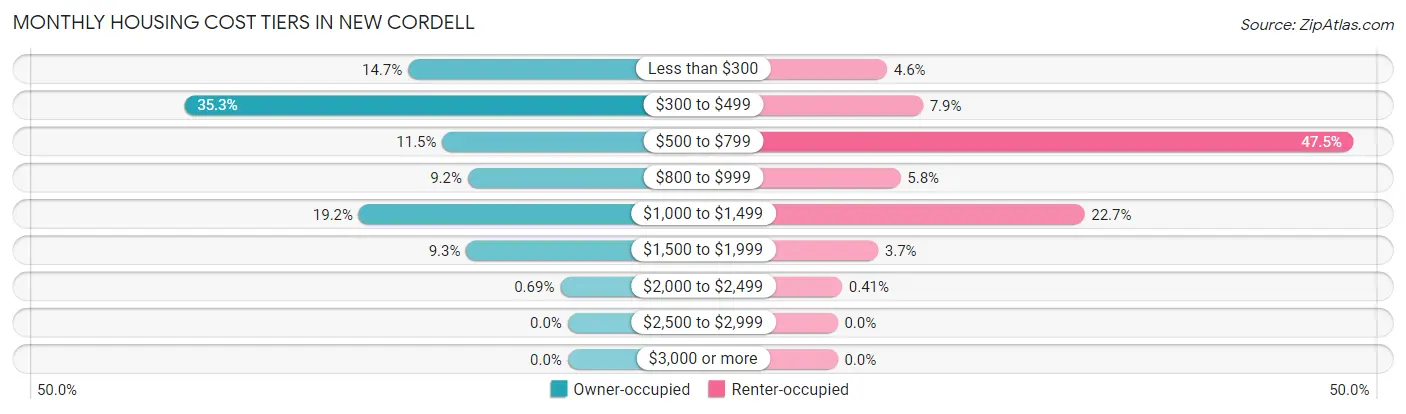
| Monthly Cost | Owner-occupied | Renter-occupied |
| Less than $300 | 107 (14.7%) | 11 (4.5%) |
| $300 to $499 | 257 (35.3%) | 19 (7.9%) |
| $500 to $799 | 84 (11.5%) | 115 (47.5%) |
| $800 to $999 | 67 (9.2%) | 14 (5.8%) |
| $1,000 to $1,499 | 140 (19.2%) | 55 (22.7%) |
| $1,500 to $1,999 | 68 (9.3%) | 9 (3.7%) |
| $2,000 to $2,499 | 5 (0.7%) | 1 (0.4%) |
| $2,500 to $2,999 | 0 (0.0%) | 0 (0.0%) |
| $3,000 or more | 0 (0.0%) | 0 (0.0%) |
| Total | 728 (100.0%) | 242 (100.0%) |
Physical Housing Characteristics in New Cordell
Housing Structures in New Cordell
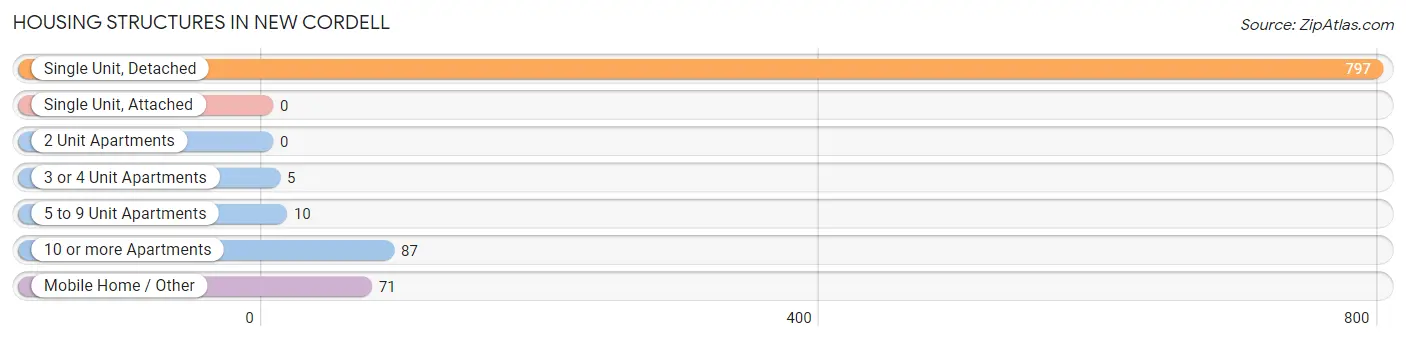
| Structure Type | # Housing Units | % Housing Units |
| Single Unit, Detached | 797 | 82.2% |
| Single Unit, Attached | 0 | 0.0% |
| 2 Unit Apartments | 0 | 0.0% |
| 3 or 4 Unit Apartments | 5 | 0.5% |
| 5 to 9 Unit Apartments | 10 | 1.0% |
| 10 or more Apartments | 87 | 9.0% |
| Mobile Home / Other | 71 | 7.3% |
| Total | 970 | 100.0% |
Housing Structures by Occupancy in New Cordell
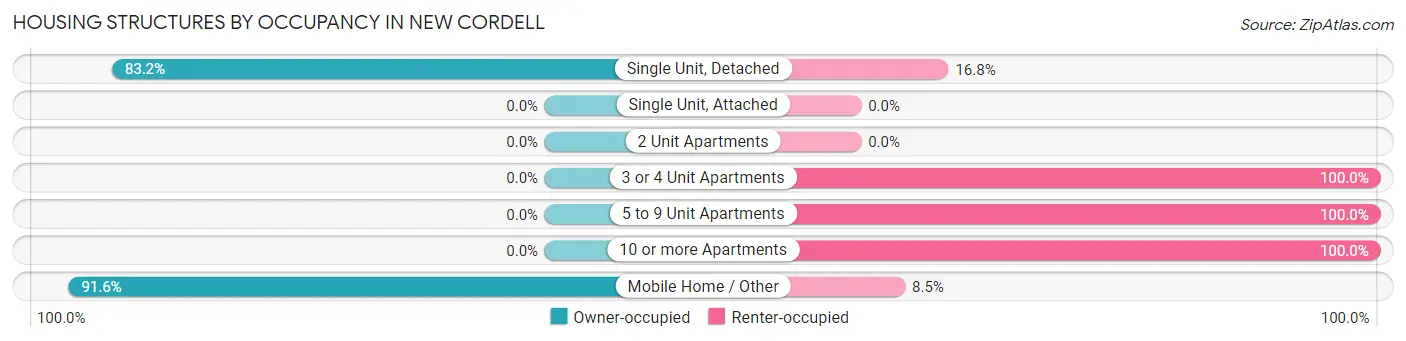
| Structure Type | Owner-occupied | Renter-occupied |
| Single Unit, Detached | 663 (83.2%) | 134 (16.8%) |
| Single Unit, Attached | 0 (0.0%) | 0 (0.0%) |
| 2 Unit Apartments | 0 (0.0%) | 0 (0.0%) |
| 3 or 4 Unit Apartments | 0 (0.0%) | 5 (100.0%) |
| 5 to 9 Unit Apartments | 0 (0.0%) | 10 (100.0%) |
| 10 or more Apartments | 0 (0.0%) | 87 (100.0%) |
| Mobile Home / Other | 65 (91.5%) | 6 (8.5%) |
| Total | 728 (75.0%) | 242 (24.9%) |
Housing Structures by Number of Rooms in New Cordell
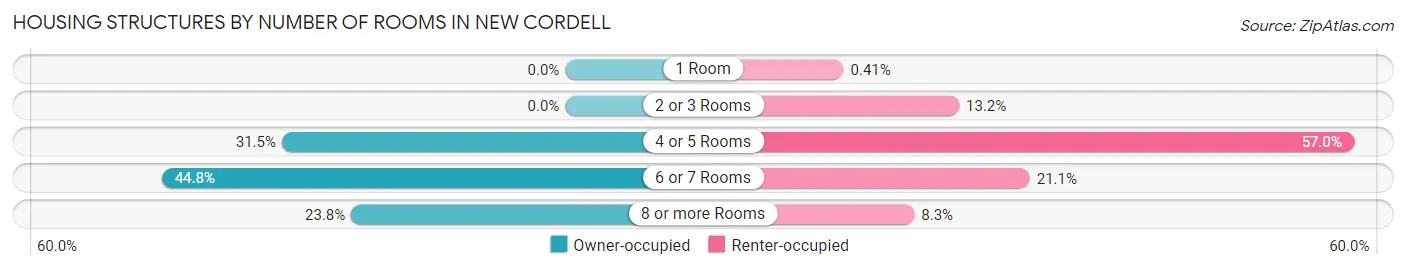
| Number of Rooms | Owner-occupied | Renter-occupied |
| 1 Room | 0 (0.0%) | 1 (0.4%) |
| 2 or 3 Rooms | 0 (0.0%) | 32 (13.2%) |
| 4 or 5 Rooms | 229 (31.5%) | 138 (57.0%) |
| 6 or 7 Rooms | 326 (44.8%) | 51 (21.1%) |
| 8 or more Rooms | 173 (23.8%) | 20 (8.3%) |
| Total | 728 (100.0%) | 242 (100.0%) |
Housing Structure by Heating Type in New Cordell
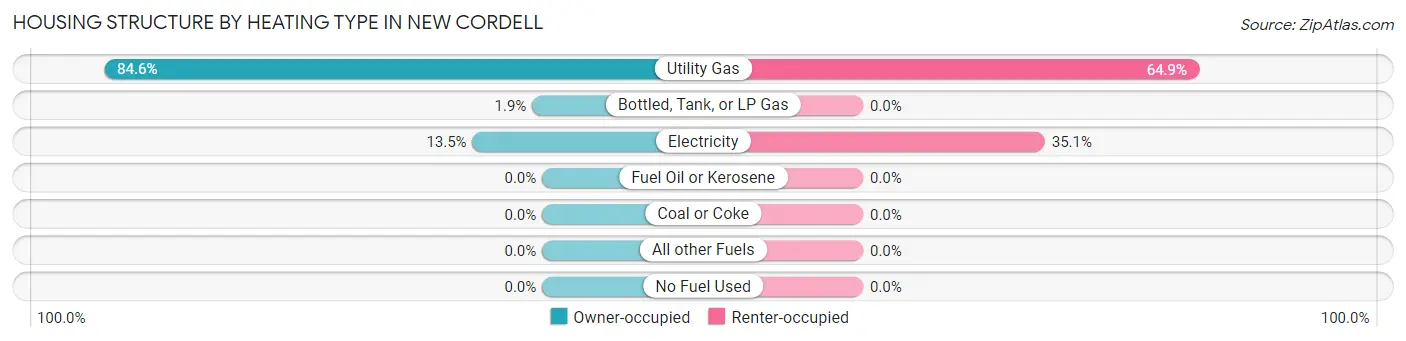
| Heating Type | Owner-occupied | Renter-occupied |
| Utility Gas | 616 (84.6%) | 157 (64.9%) |
| Bottled, Tank, or LP Gas | 14 (1.9%) | 0 (0.0%) |
| Electricity | 98 (13.5%) | 85 (35.1%) |
| Fuel Oil or Kerosene | 0 (0.0%) | 0 (0.0%) |
| Coal or Coke | 0 (0.0%) | 0 (0.0%) |
| All other Fuels | 0 (0.0%) | 0 (0.0%) |
| No Fuel Used | 0 (0.0%) | 0 (0.0%) |
| Total | 728 (100.0%) | 242 (100.0%) |
Household Vehicle Usage in New Cordell
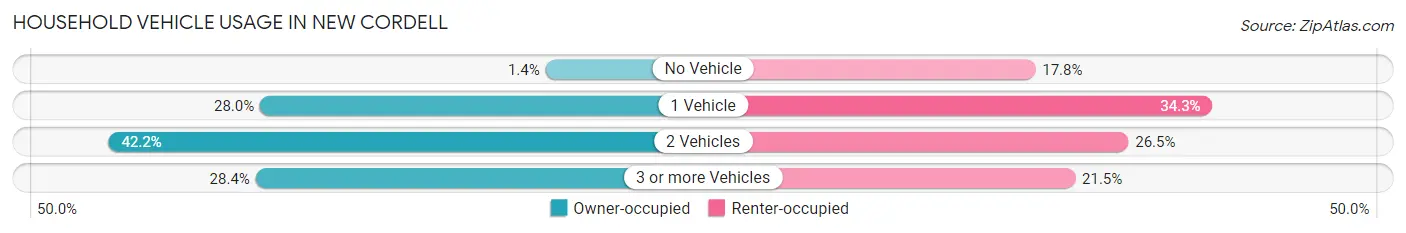
| Vehicles per Household | Owner-occupied | Renter-occupied |
| No Vehicle | 10 (1.4%) | 43 (17.8%) |
| 1 Vehicle | 204 (28.0%) | 83 (34.3%) |
| 2 Vehicles | 307 (42.2%) | 64 (26.5%) |
| 3 or more Vehicles | 207 (28.4%) | 52 (21.5%) |
| Total | 728 (100.0%) | 242 (100.0%) |
Real Estate & Mortgages in New Cordell
Real Estate and Mortgage Overview in New Cordell
| Characteristic | Without Mortgage | With Mortgage |
| Housing Units | 469 | 259 |
| Median Property Value | $91,900 | $98,100 |
| Median Household Income | $67,903 | $3 |
| Monthly Housing Costs | $375 | $0 |
| Real Estate Taxes | $467 | $11 |
Property Value by Mortgage Status in New Cordell
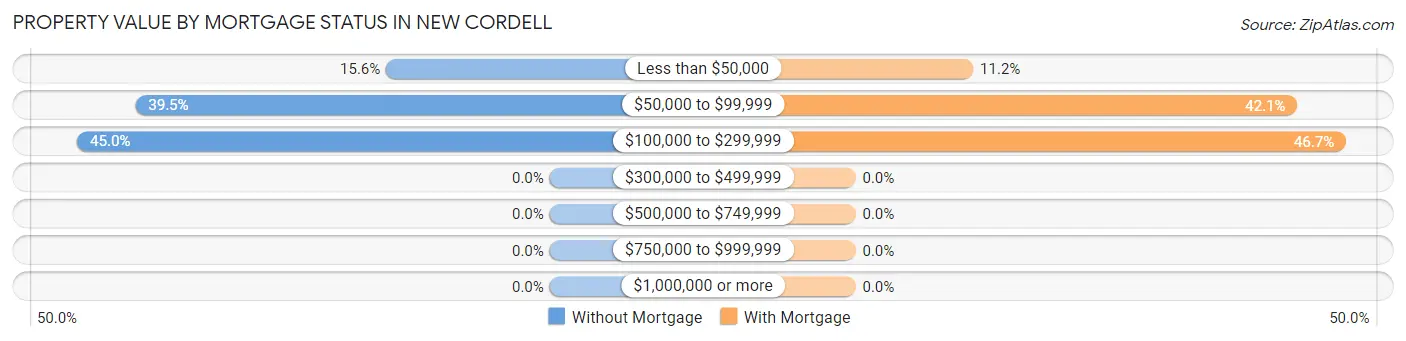
| Property Value | Without Mortgage | With Mortgage |
| Less than $50,000 | 73 (15.6%) | 29 (11.2%) |
| $50,000 to $99,999 | 185 (39.5%) | 109 (42.1%) |
| $100,000 to $299,999 | 211 (45.0%) | 121 (46.7%) |
| $300,000 to $499,999 | 0 (0.0%) | 0 (0.0%) |
| $500,000 to $749,999 | 0 (0.0%) | 0 (0.0%) |
| $750,000 to $999,999 | 0 (0.0%) | 0 (0.0%) |
| $1,000,000 or more | 0 (0.0%) | 0 (0.0%) |
| Total | 469 (100.0%) | 259 (100.0%) |
Household Income by Mortgage Status in New Cordell
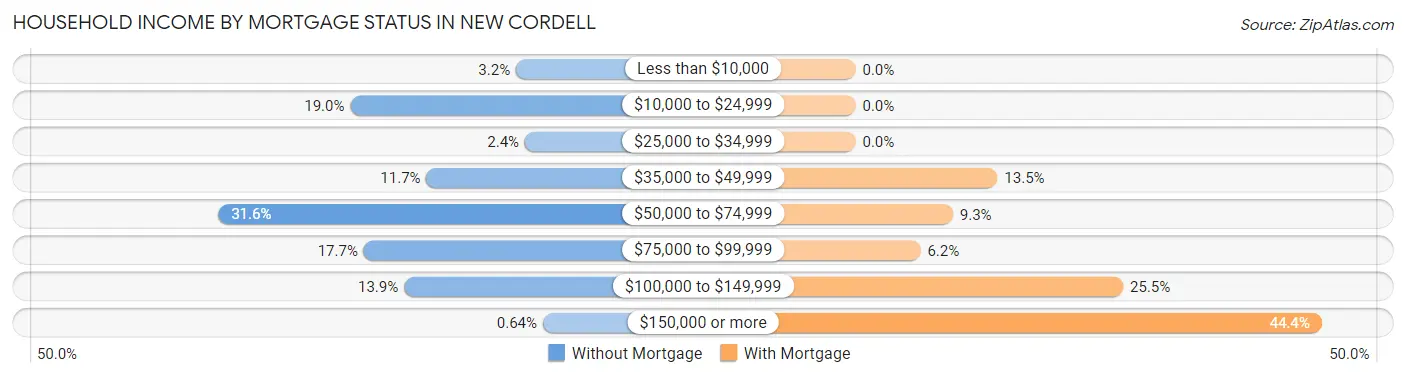
| Household Income | Without Mortgage | With Mortgage |
| Less than $10,000 | 15 (3.2%) | 0 (0.0%) |
| $10,000 to $24,999 | 89 (19.0%) | 0 (0.0%) |
| $25,000 to $34,999 | 11 (2.4%) | 0 (0.0%) |
| $35,000 to $49,999 | 55 (11.7%) | 35 (13.5%) |
| $50,000 to $74,999 | 148 (31.6%) | 24 (9.3%) |
| $75,000 to $99,999 | 83 (17.7%) | 16 (6.2%) |
| $100,000 to $149,999 | 65 (13.9%) | 66 (25.5%) |
| $150,000 or more | 3 (0.6%) | 115 (44.4%) |
| Total | 469 (100.0%) | 259 (100.0%) |
Property Value to Household Income Ratio in New Cordell
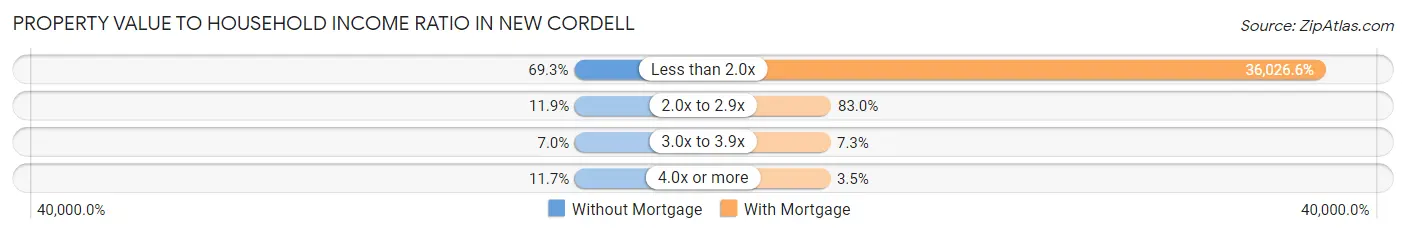
| Value-to-Income Ratio | Without Mortgage | With Mortgage |
| Less than 2.0x | 325 (69.3%) | 93,309 (36,026.6%) |
| 2.0x to 2.9x | 56 (11.9%) | 215 (83.0%) |
| 3.0x to 3.9x | 33 (7.0%) | 19 (7.3%) |
| 4.0x or more | 55 (11.7%) | 9 (3.5%) |
| Total | 469 (100.0%) | 259 (100.0%) |
Real Estate Taxes by Mortgage Status in New Cordell
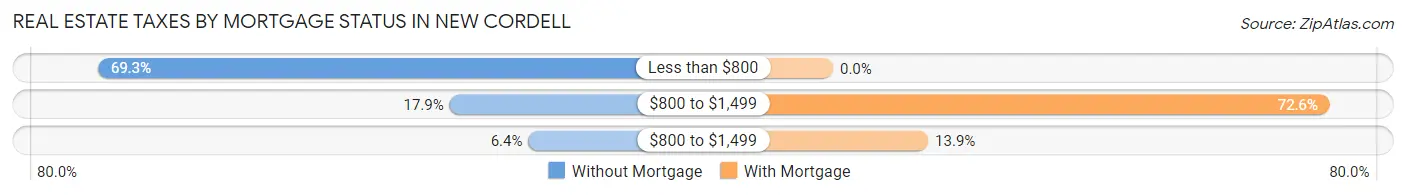
| Property Taxes | Without Mortgage | With Mortgage |
| Less than $800 | 325 (69.3%) | 0 (0.0%) |
| $800 to $1,499 | 84 (17.9%) | 188 (72.6%) |
| $800 to $1,499 | 30 (6.4%) | 36 (13.9%) |
| Total | 469 (100.0%) | 259 (100.0%) |
Health & Disability in New Cordell
Health Insurance Coverage by Age in New Cordell
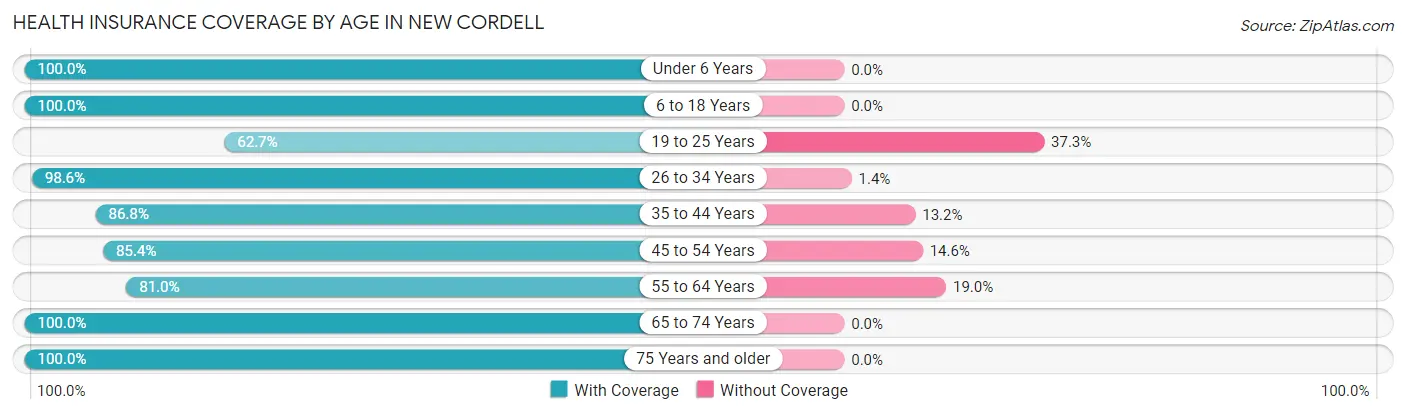
| Age Bracket | With Coverage | Without Coverage |
| Under 6 Years | 293 (100.0%) | 0 (0.0%) |
| 6 to 18 Years | 420 (100.0%) | 0 (0.0%) |
| 19 to 25 Years | 133 (62.7%) | 79 (37.3%) |
| 26 to 34 Years | 363 (98.6%) | 5 (1.4%) |
| 35 to 44 Years | 190 (86.8%) | 29 (13.2%) |
| 45 to 54 Years | 222 (85.4%) | 38 (14.6%) |
| 55 to 64 Years | 363 (81.0%) | 85 (19.0%) |
| 65 to 74 Years | 202 (100.0%) | 0 (0.0%) |
| 75 Years and older | 199 (100.0%) | 0 (0.0%) |
| Total | 2,385 (91.0%) | 236 (9.0%) |
Health Insurance Coverage by Citizenship Status in New Cordell
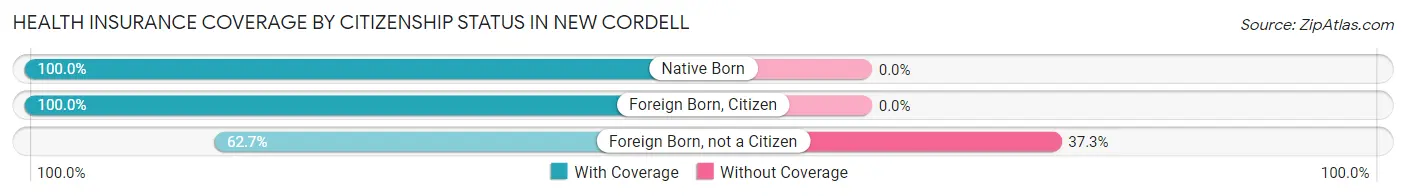
| Citizenship Status | With Coverage | Without Coverage |
| Native Born | 293 (100.0%) | 0 (0.0%) |
| Foreign Born, Citizen | 420 (100.0%) | 0 (0.0%) |
| Foreign Born, not a Citizen | 133 (62.7%) | 79 (37.3%) |
Health Insurance Coverage by Household Income in New Cordell
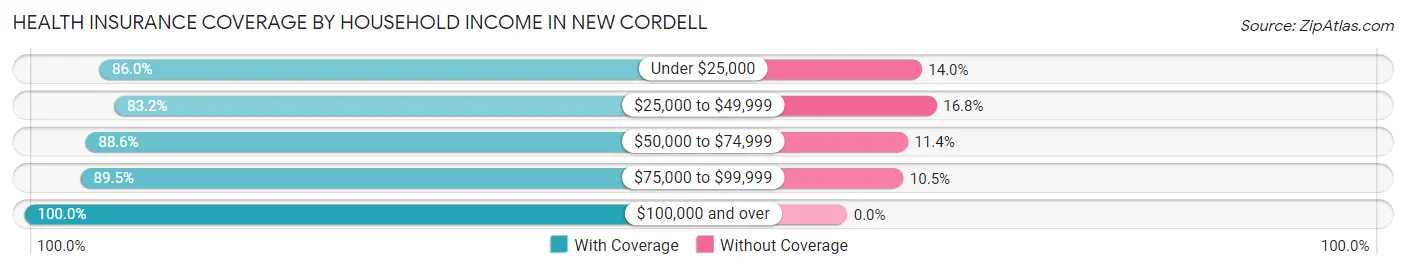
| Household Income | With Coverage | Without Coverage |
| Under $25,000 | 197 (86.0%) | 32 (14.0%) |
| $25,000 to $49,999 | 397 (83.2%) | 80 (16.8%) |
| $50,000 to $74,999 | 662 (88.6%) | 85 (11.4%) |
| $75,000 to $99,999 | 332 (89.5%) | 39 (10.5%) |
| $100,000 and over | 797 (100.0%) | 0 (0.0%) |
Public vs Private Health Insurance Coverage by Age in New Cordell
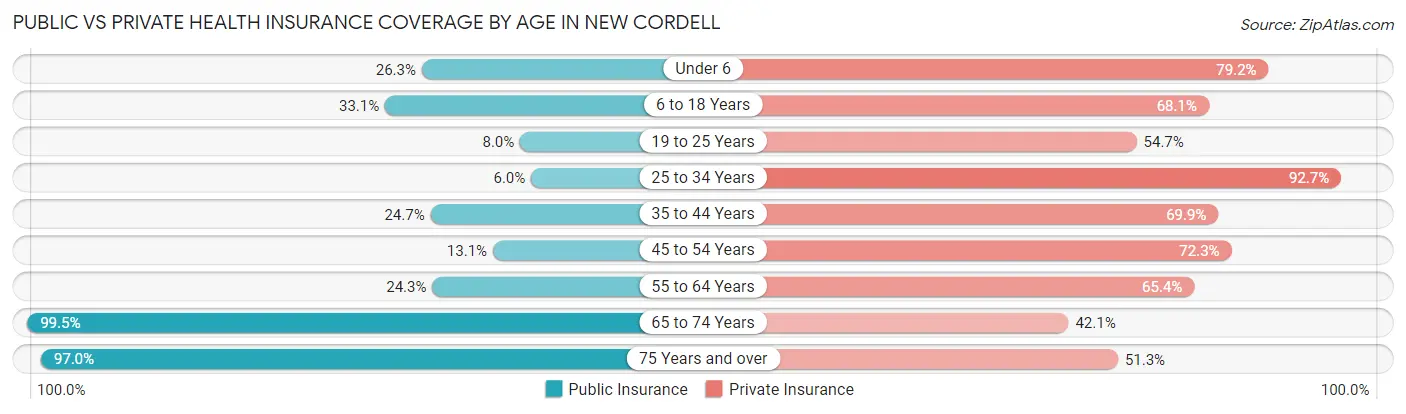
| Age Bracket | Public Insurance | Private Insurance |
| Under 6 | 77 (26.3%) | 232 (79.2%) |
| 6 to 18 Years | 139 (33.1%) | 286 (68.1%) |
| 19 to 25 Years | 17 (8.0%) | 116 (54.7%) |
| 25 to 34 Years | 22 (6.0%) | 341 (92.7%) |
| 35 to 44 Years | 54 (24.7%) | 153 (69.9%) |
| 45 to 54 Years | 34 (13.1%) | 188 (72.3%) |
| 55 to 64 Years | 109 (24.3%) | 293 (65.4%) |
| 65 to 74 Years | 201 (99.5%) | 85 (42.1%) |
| 75 Years and over | 193 (97.0%) | 102 (51.3%) |
| Total | 846 (32.3%) | 1,796 (68.5%) |
Disability Status by Sex by Age in New Cordell
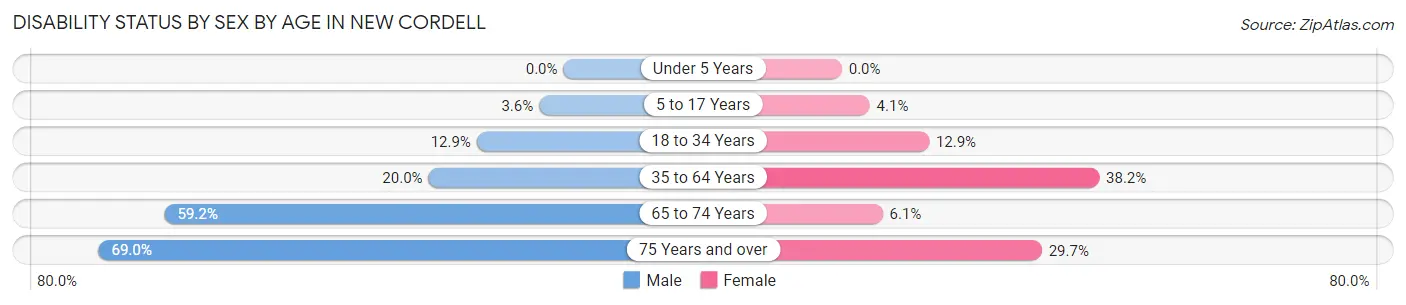
| Age Bracket | Male | Female |
| Under 5 Years | 0 (0.0%) | 0 (0.0%) |
| 5 to 17 Years | 11 (3.6%) | 7 (4.1%) |
| 18 to 34 Years | 48 (12.9%) | 33 (12.9%) |
| 35 to 64 Years | 105 (20.0%) | 154 (38.2%) |
| 65 to 74 Years | 61 (59.2%) | 6 (6.1%) |
| 75 Years and over | 49 (69.0%) | 38 (29.7%) |
Disability Class by Sex by Age in New Cordell
Disability Class: Hearing Difficulty
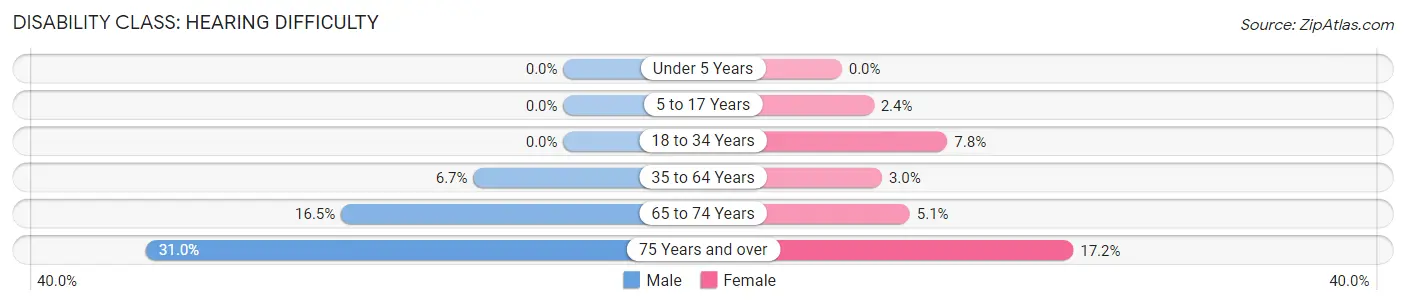
| Age Bracket | Male | Female |
| Under 5 Years | 0 (0.0%) | 0 (0.0%) |
| 5 to 17 Years | 0 (0.0%) | 4 (2.4%) |
| 18 to 34 Years | 0 (0.0%) | 20 (7.8%) |
| 35 to 64 Years | 35 (6.7%) | 12 (3.0%) |
| 65 to 74 Years | 17 (16.5%) | 5 (5.1%) |
| 75 Years and over | 22 (31.0%) | 22 (17.2%) |
Disability Class: Vision Difficulty
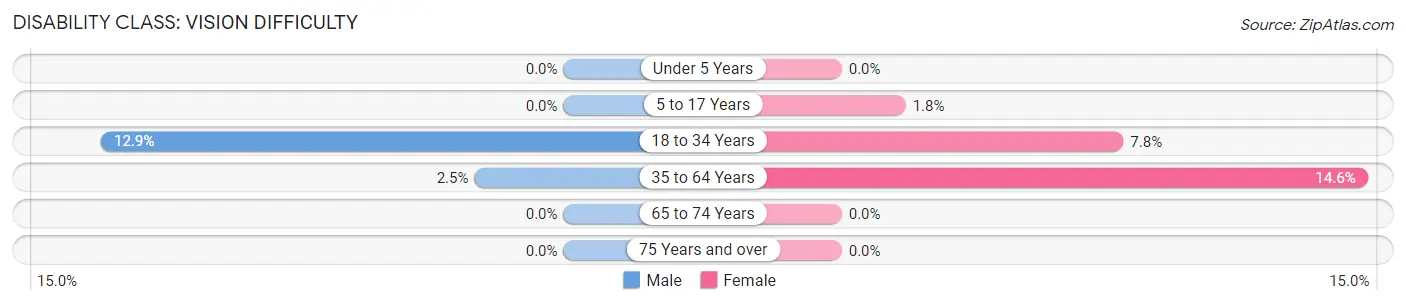
| Age Bracket | Male | Female |
| Under 5 Years | 0 (0.0%) | 0 (0.0%) |
| 5 to 17 Years | 0 (0.0%) | 3 (1.8%) |
| 18 to 34 Years | 48 (12.9%) | 20 (7.8%) |
| 35 to 64 Years | 13 (2.5%) | 59 (14.6%) |
| 65 to 74 Years | 0 (0.0%) | 0 (0.0%) |
| 75 Years and over | 0 (0.0%) | 0 (0.0%) |
Disability Class: Cognitive Difficulty
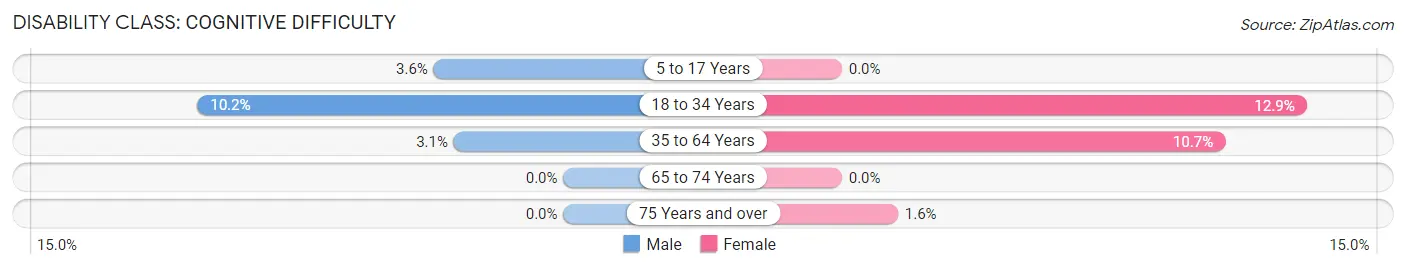
| Age Bracket | Male | Female |
| 5 to 17 Years | 11 (3.6%) | 0 (0.0%) |
| 18 to 34 Years | 38 (10.2%) | 33 (12.9%) |
| 35 to 64 Years | 16 (3.0%) | 43 (10.7%) |
| 65 to 74 Years | 0 (0.0%) | 0 (0.0%) |
| 75 Years and over | 0 (0.0%) | 2 (1.6%) |
Disability Class: Ambulatory Difficulty
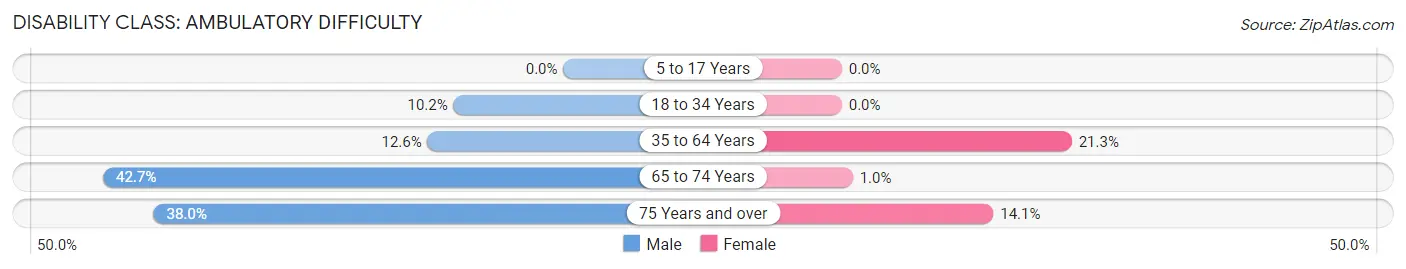
| Age Bracket | Male | Female |
| 5 to 17 Years | 0 (0.0%) | 0 (0.0%) |
| 18 to 34 Years | 38 (10.2%) | 0 (0.0%) |
| 35 to 64 Years | 66 (12.6%) | 86 (21.3%) |
| 65 to 74 Years | 44 (42.7%) | 1 (1.0%) |
| 75 Years and over | 27 (38.0%) | 18 (14.1%) |
Disability Class: Self-Care Difficulty
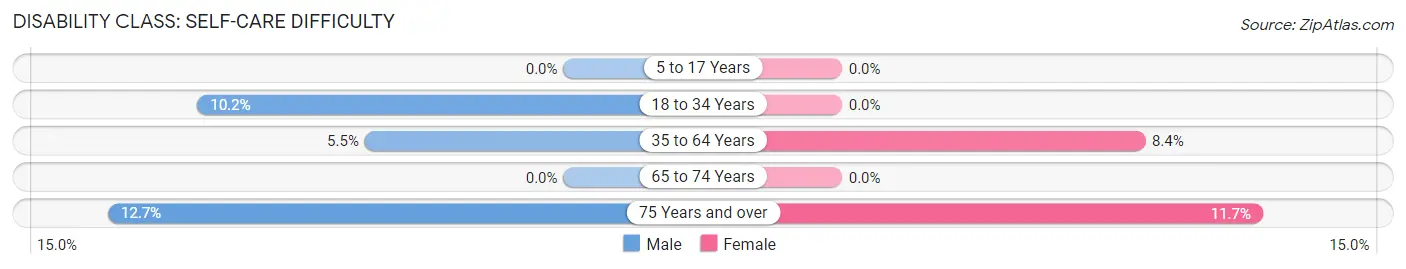
| Age Bracket | Male | Female |
| 5 to 17 Years | 0 (0.0%) | 0 (0.0%) |
| 18 to 34 Years | 38 (10.2%) | 0 (0.0%) |
| 35 to 64 Years | 29 (5.5%) | 34 (8.4%) |
| 65 to 74 Years | 0 (0.0%) | 0 (0.0%) |
| 75 Years and over | 9 (12.7%) | 15 (11.7%) |
Technology Access in New Cordell
Computing Device Access in New Cordell
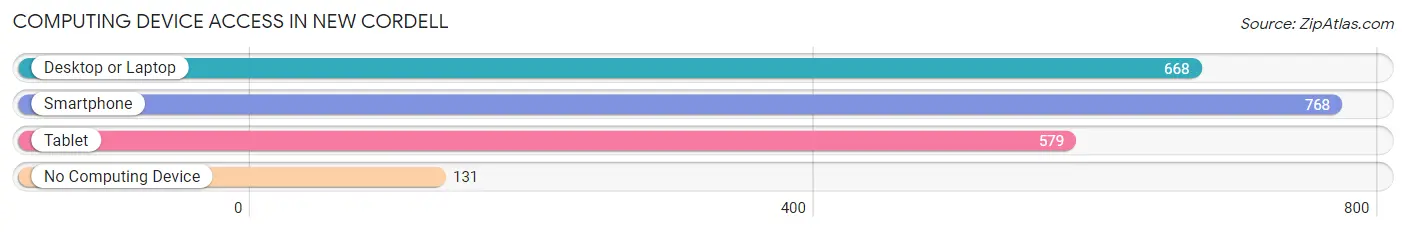
| Device Type | # Households | % Households |
| Desktop or Laptop | 668 | 68.9% |
| Smartphone | 768 | 79.2% |
| Tablet | 579 | 59.7% |
| No Computing Device | 131 | 13.5% |
| Total | 970 | 100.0% |
Internet Access in New Cordell
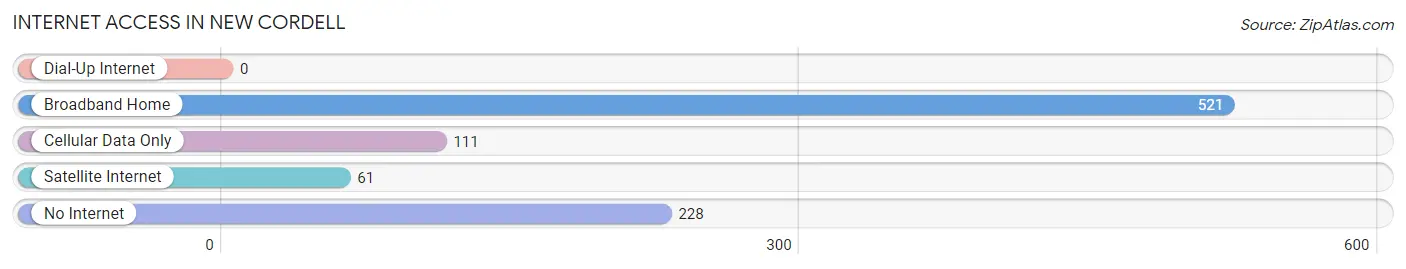
| Internet Type | # Households | % Households |
| Dial-Up Internet | 0 | 0.0% |
| Broadband Home | 521 | 53.7% |
| Cellular Data Only | 111 | 11.4% |
| Satellite Internet | 61 | 6.3% |
| No Internet | 228 | 23.5% |
| Total | 970 | 100.0% |
New Cordell Summary
Cordell, Oklahoma is a small city located in Washita County, Oklahoma. It is situated in the southwestern part of the state, approximately 80 miles west of Oklahoma City. The city was founded in 1891 and named after Cordell Hull, a former Secretary of State. As of the 2010 census, the population of Cordell was 2,743.
History
The area that is now Cordell was originally inhabited by the Kiowa and Comanche Native American tribes. In 1891, the town was founded by the Cordell Land and Townsite Company, which was owned by the Santa Fe Railroad. The town was named after Cordell Hull, a former Secretary of State.
In the early 1900s, Cordell was a thriving agricultural community. The town was home to several cotton gins, a flour mill, and a cottonseed oil mill. The town also had a number of stores, a hotel, and a bank.
In the 1920s, the town began to decline due to the Great Depression. Many of the businesses closed and the population decreased. However, the town was able to survive and in the 1940s, the economy began to improve.
In the 1950s, Cordell began to experience a population boom. The town was home to several oil and gas companies, which provided jobs for many of the residents. The town also had a number of manufacturing plants, which provided additional employment opportunities.
Geography
Cordell is located in southwestern Oklahoma, approximately 80 miles west of Oklahoma City. The town is situated in Washita County, which is part of the Anadarko Basin. The town is located at the intersection of U.S. Highway 183 and State Highway 152.
The town is situated on a flat plain, with an elevation of 1,400 feet. The climate is semi-arid, with hot summers and mild winters. The average annual precipitation is approximately 25 inches.
Economy
The economy of Cordell is largely based on agriculture and oil and gas production. The town is home to several oil and gas companies, which provide jobs for many of the residents. The town also has a number of manufacturing plants, which provide additional employment opportunities.
The town is also home to several retail stores, restaurants, and other businesses. The town is also home to a number of churches, schools, and other organizations.
Demographics
As of the 2010 census, the population of Cordell was 2,743. The racial makeup of the town was 79.3% White, 0.7% African American, 0.7% Native American, 0.2% Asian, 0.1% Pacific Islander, and 18.1% from other races. The median household income was $31,250 and the median family income was $37,500.
Conclusion
Cordell, Oklahoma is a small city located in Washita County, Oklahoma. It is situated in the southwestern part of the state, approximately 80 miles west of Oklahoma City. The city was founded in 1891 and named after Cordell Hull, a former Secretary of State. As of the 2010 census, the population of Cordell was 2,743. The economy of Cordell is largely based on agriculture and oil and gas production. The town is also home to several retail stores, restaurants, and other businesses. The racial makeup of the town was 79.3% White, 0.7% African American, 0.7% Native American, 0.2% Asian, 0.1% Pacific Islander, and 18.1% from other races. The median household income was $31,250 and the median family income was $37,500.
Common Questions
What is the Total Population of New Cordell?
Total Population of New Cordell is 2,769.
What is the Total Male Population of New Cordell?
Total Male Population of New Cordell is 1,544.
What is the Total Female Population of New Cordell?
Total Female Population of New Cordell is 1,225.
What is the Ratio of Males per 100 Females in New Cordell?
There are 126.04 Males per 100 Females in New Cordell.
What is the Ratio of Females per 100 Males in New Cordell?
There are 79.34 Females per 100 Males in New Cordell.
What is the Median Population Age in New Cordell?
Median Population Age in New Cordell is 36.4 Years.
What is the Average Family Size in New Cordell
Average Family Size in New Cordell is 3.5 People.
What is the Average Household Size in New Cordell
Average Household Size in New Cordell is 2.7 People.
What is Per Capita Income in New Cordell?
Per Capita income in New Cordell is $26,477.
What is the Median Family Income in New Cordell?
Median Family Income in New Cordell is $72,031.
What is the Median Household income in New Cordell?
Median Household Income in New Cordell is $68,295.
What is Income or Wage Gap in New Cordell?
Income or Wage Gap in New Cordell is 36.8%.
Women in New Cordell earn 63.2 cents for every dollar earned by a man.
What is Inequality or Gini Index in New Cordell?
Inequality or Gini Index in New Cordell is 0.36.
How Large is the Labor Force in New Cordell?
There are 1,266 People in the Labor Forcein in New Cordell.
What is the Percentage of People in the Labor Force in New Cordell?
59.2% of People are in the Labor Force in New Cordell.
What is the Unemployment Rate in New Cordell?
Unemployment Rate in New Cordell is 4.9%.