Mccurtain, OK
Mccurtain Map
Mccurtain Overview
420
TOTAL POPULATION
161
MALE POPULATION
259
FEMALE POPULATION
62.16
MALES / 100 FEMALES
160.87
FEMALES / 100 MALES
39.7
MEDIAN AGE
3.3
AVG FAMILY SIZE
2.1
AVG HOUSEHOLD SIZE
$14,254
PER CAPITA INCOME
$38,750
AVG FAMILY INCOME
$15,833
AVG HOUSEHOLD INCOME
0.61
INEQUALITY / GINI INDEX
145
LABOR FORCE [ PEOPLE ]
43.3%
PERCENT IN LABOR FORCE
4.8%
UNEMPLOYMENT RATE
Mccurtain Zip Codes
Mccurtain Area Codes
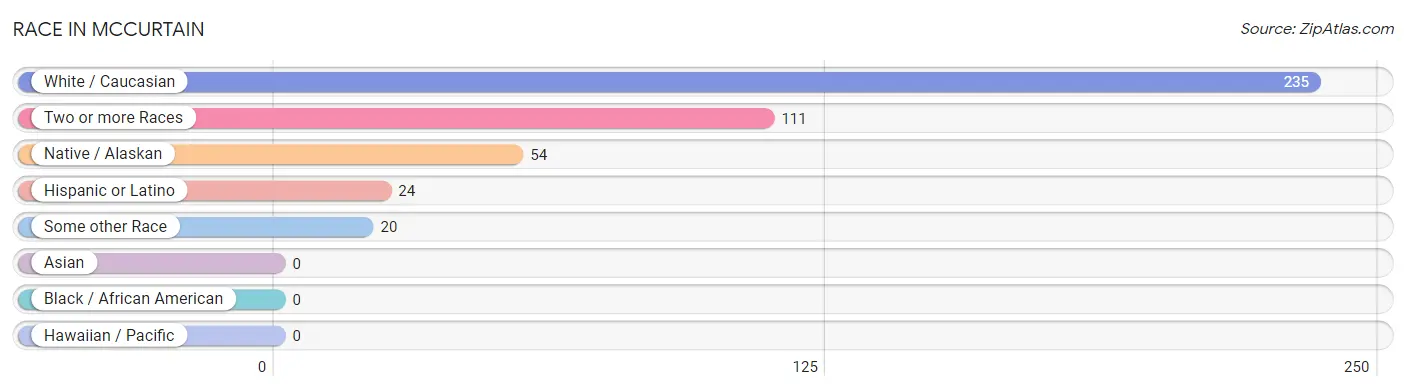
Race in Mccurtain
The most populous races in Mccurtain are White / Caucasian (235 | 55.9%), Two or more Races (111 | 26.4%), and Native / Alaskan (54 | 12.9%).
| Race | # Population | % Population |
| Asian | 0 | 0.0% |
| Black / African American | 0 | 0.0% |
| Hawaiian / Pacific | 0 | 0.0% |
| Hispanic or Latino | 24 | 5.7% |
| Native / Alaskan | 54 | 12.9% |
| White / Caucasian | 235 | 55.9% |
| Two or more Races | 111 | 26.4% |
| Some other Race | 20 | 4.8% |
| Total | 420 | 100.0% |
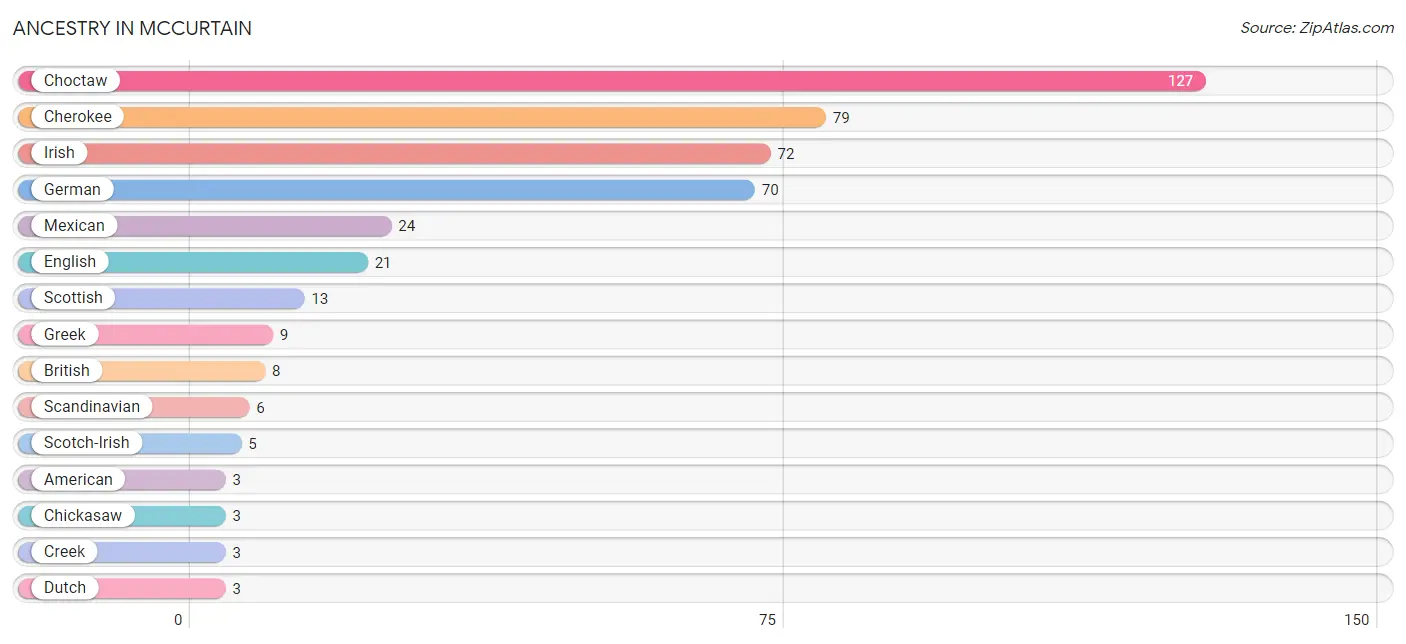
Ancestry in Mccurtain
The most populous ancestries reported in Mccurtain are Choctaw (127 | 30.2%), Cherokee (79 | 18.8%), Irish (72 | 17.1%), German (70 | 16.7%), and Mexican (24 | 5.7%), together accounting for 88.6% of all Mccurtain residents.
| Ancestry | # Population | % Population |
| American | 3 | 0.7% |
| British | 8 | 1.9% |
| Cherokee | 79 | 18.8% |
| Chickasaw | 3 | 0.7% |
| Choctaw | 127 | 30.2% |
| Creek | 3 | 0.7% |
| Dutch | 3 | 0.7% |
| Dutch West Indian | 2 | 0.5% |
| Eastern European | 1 | 0.2% |
| English | 21 | 5.0% |
| French | 1 | 0.2% |
| German | 70 | 16.7% |
| Greek | 9 | 2.1% |
| Irish | 72 | 17.1% |
| Italian | 1 | 0.2% |
| Mexican | 24 | 5.7% |
| Pennsylvania German | 1 | 0.2% |
| Scandinavian | 6 | 1.4% |
| Scotch-Irish | 5 | 1.2% |
| Scottish | 13 | 3.1% |
| Welsh | 2 | 0.5% | View All 21 Rows |
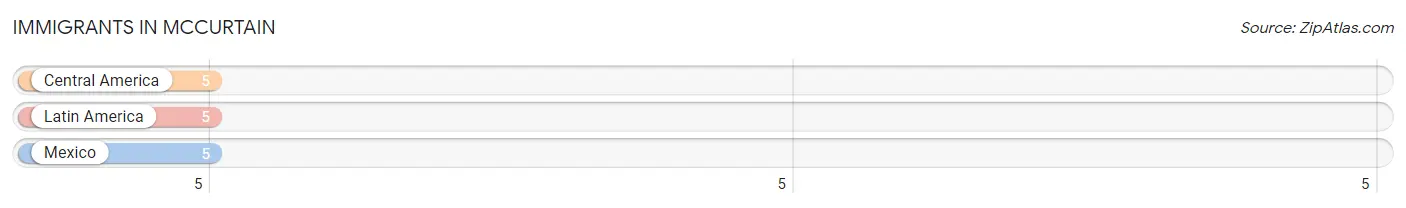
Immigrants in Mccurtain
The most numerous immigrant groups reported in Mccurtain came from Central America (5 | 1.2%), Latin America (5 | 1.2%), and Mexico (5 | 1.2%), together accounting for 3.6% of all Mccurtain residents.
| Immigration Origin | # Population | % Population |
| Central America | 5 | 1.2% |
| Latin America | 5 | 1.2% |
| Mexico | 5 | 1.2% | View All 3 Rows |
Sex and Age in Mccurtain
Sex and Age in Mccurtain
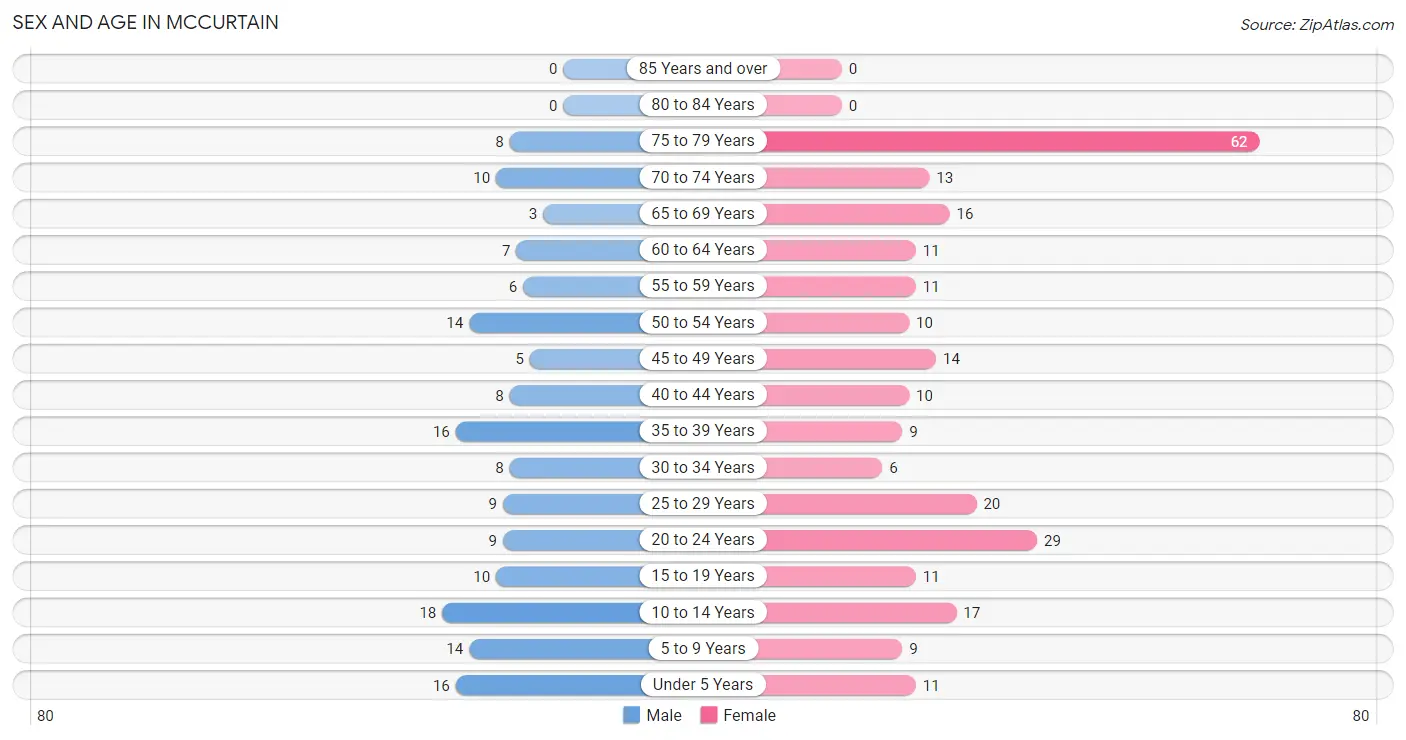
The most populous age groups in Mccurtain are 10 to 14 Years (18 | 11.2%) for men and 75 to 79 Years (62 | 23.9%) for women.
| Age Bracket | Male | Female |
| Under 5 Years | 16 (9.9%) | 11 (4.3%) |
| 5 to 9 Years | 14 (8.7%) | 9 (3.5%) |
| 10 to 14 Years | 18 (11.2%) | 17 (6.6%) |
| 15 to 19 Years | 10 (6.2%) | 11 (4.3%) |
| 20 to 24 Years | 9 (5.6%) | 29 (11.2%) |
| 25 to 29 Years | 9 (5.6%) | 20 (7.7%) |
| 30 to 34 Years | 8 (5.0%) | 6 (2.3%) |
| 35 to 39 Years | 16 (9.9%) | 9 (3.5%) |
| 40 to 44 Years | 8 (5.0%) | 10 (3.9%) |
| 45 to 49 Years | 5 (3.1%) | 14 (5.4%) |
| 50 to 54 Years | 14 (8.7%) | 10 (3.9%) |
| 55 to 59 Years | 6 (3.7%) | 11 (4.3%) |
| 60 to 64 Years | 7 (4.3%) | 11 (4.3%) |
| 65 to 69 Years | 3 (1.9%) | 16 (6.2%) |
| 70 to 74 Years | 10 (6.2%) | 13 (5.0%) |
| 75 to 79 Years | 8 (5.0%) | 62 (23.9%) |
| 80 to 84 Years | 0 (0.0%) | 0 (0.0%) |
| 85 Years and over | 0 (0.0%) | 0 (0.0%) |
| Total | 161 (100.0%) | 259 (100.0%) |
Families and Households in Mccurtain
Median Family Size in Mccurtain
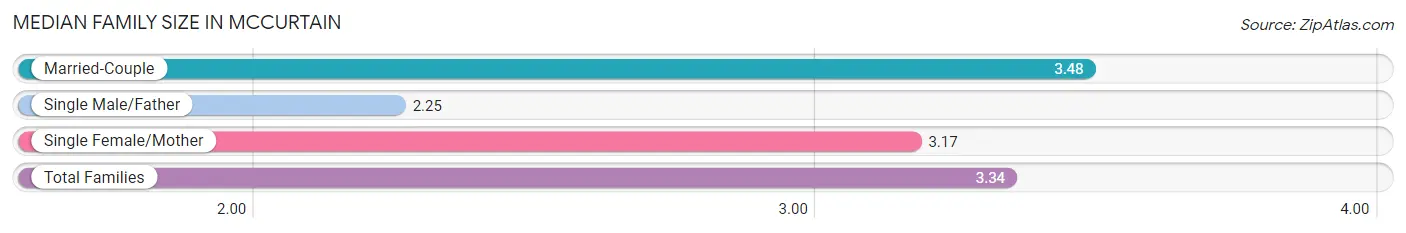
The median family size in Mccurtain is 3.34 persons per family, with married-couple families (61 | 69.3%) accounting for the largest median family size of 3.48 persons per family. On the other hand, single male/father families (4 | 4.5%) represent the smallest median family size with 2.25 persons per family.
| Family Type | # Families | Family Size |
| Married-Couple | 61 (69.3%) | 3.48 |
| Single Male/Father | 4 (4.5%) | 2.25 |
| Single Female/Mother | 23 (26.1%) | 3.17 |
| Total Families | 88 (100.0%) | 3.34 |
Median Household Size in Mccurtain
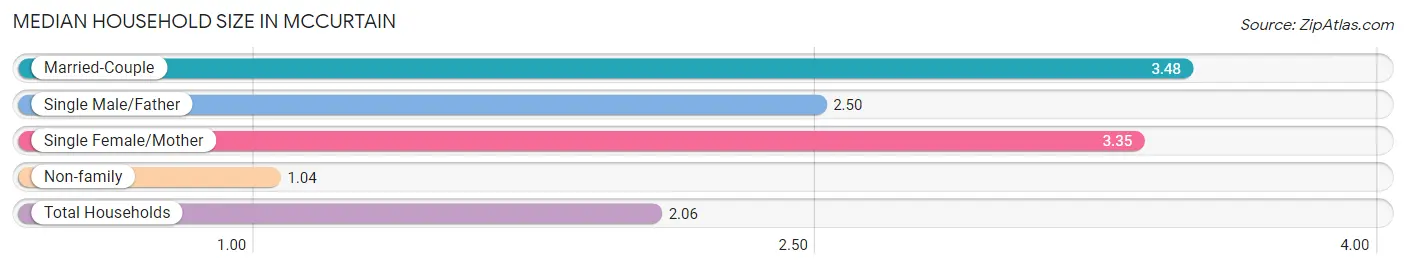
The median household size in Mccurtain is 2.06 persons per household, with married-couple households (61 | 29.9%) accounting for the largest median household size of 3.48 persons per household. non-family households (116 | 56.9%) represent the smallest median household size with 1.04 persons per household.
| Household Type | # Households | Household Size |
| Married-Couple | 61 (29.9%) | 3.48 |
| Single Male/Father | 4 (2.0%) | 2.50 |
| Single Female/Mother | 23 (11.3%) | 3.35 |
| Non-family | 116 (56.9%) | 1.04 |
| Total Households | 204 (100.0%) | 2.06 |
Household Size by Marriage Status in Mccurtain
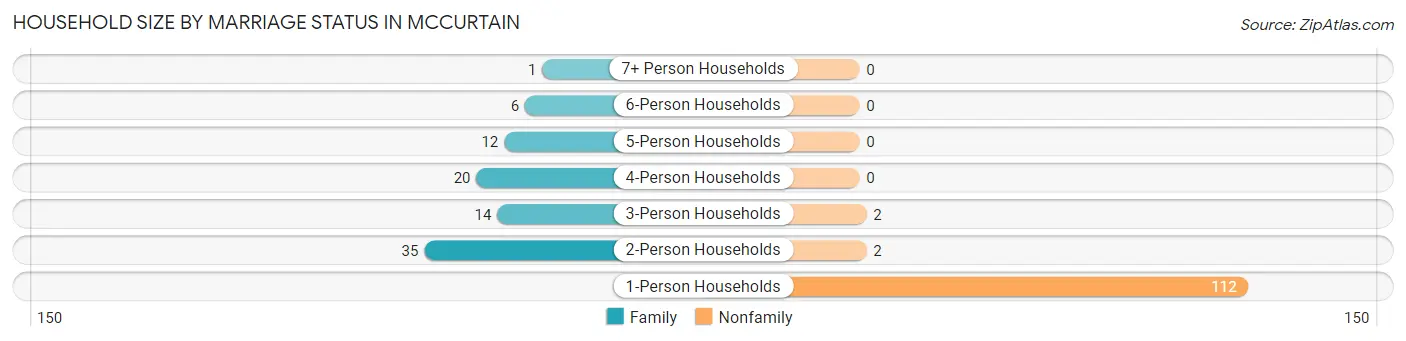
Out of a total of 204 households in Mccurtain, 88 (43.1%) are family households, while 116 (56.9%) are nonfamily households. The most numerous type of family households are 2-person households, comprising 35, and the most common type of nonfamily households are 1-person households, comprising 112.
| Household Size | Family Households | Nonfamily Households |
| 1-Person Households | - | 112 (54.9%) |
| 2-Person Households | 35 (17.2%) | 2 (1.0%) |
| 3-Person Households | 14 (6.9%) | 2 (1.0%) |
| 4-Person Households | 20 (9.8%) | 0 (0.0%) |
| 5-Person Households | 12 (5.9%) | 0 (0.0%) |
| 6-Person Households | 6 (2.9%) | 0 (0.0%) |
| 7+ Person Households | 1 (0.5%) | 0 (0.0%) |
| Total | 88 (43.1%) | 116 (56.9%) |
Female Fertility in Mccurtain
Fertility by Age in Mccurtain
Average fertility rate in Mccurtain is 69.0 births per 1,000 women. Women in the age bracket of 20 to 34 years have the highest fertility rate with 127.0 births per 1,000 women. Women in the age bracket of 20 to 34 years acount for 100.0% of all women with births.
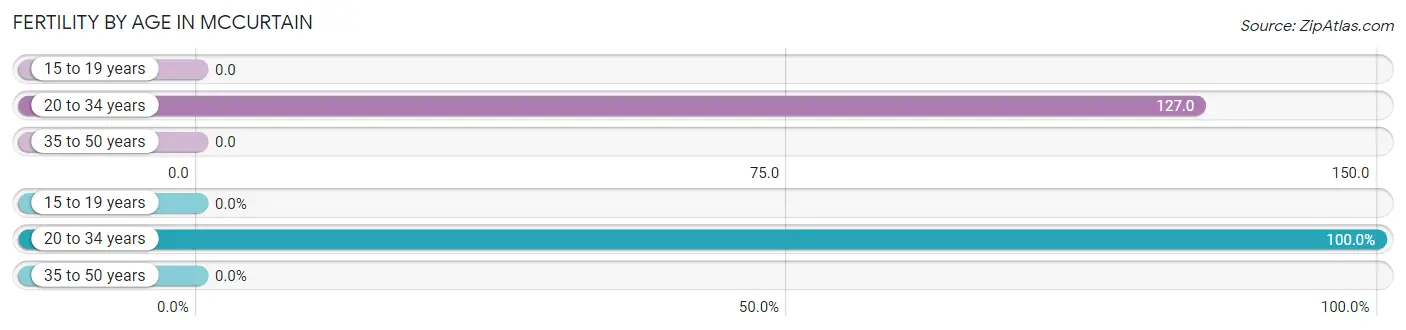
| Age Bracket | Women with Births | Births / 1,000 Women |
| 15 to 19 years | 0 (0.0%) | 0.0 |
| 20 to 34 years | 7 (100.0%) | 127.0 |
| 35 to 50 years | 0 (0.0%) | 0.0 |
| Total | 7 (100.0%) | 69.0 |
Fertility by Age by Marriage Status in Mccurtain
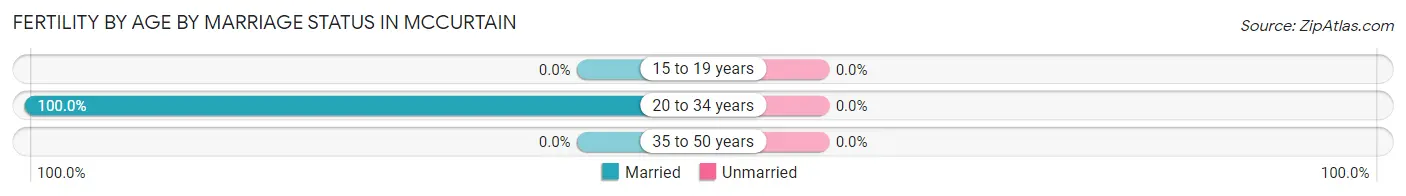
| Age Bracket | Married | Unmarried |
| 15 to 19 years | 0 (0.0%) | 0 (0.0%) |
| 20 to 34 years | 7 (100.0%) | 0 (0.0%) |
| 35 to 50 years | 0 (0.0%) | 0 (0.0%) |
| Total | 7 (100.0%) | 0 (0.0%) |
Fertility by Education in Mccurtain
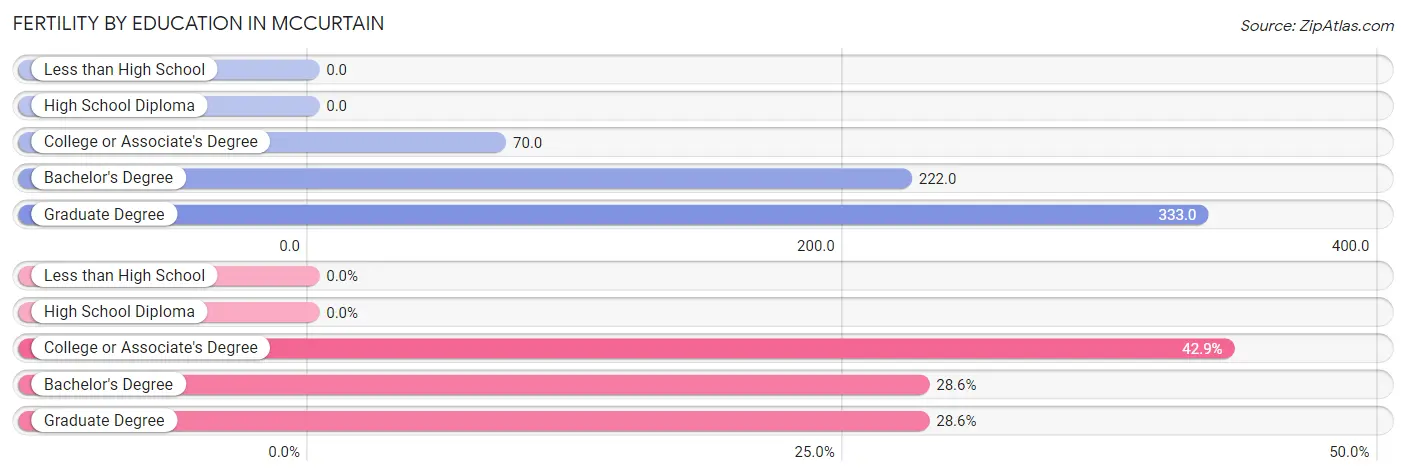
| Educational Attainment | Women with Births | Births / 1,000 Women |
| Less than High School | 0 (0.0%) | 0.0 |
| High School Diploma | 0 (0.0%) | 0.0 |
| College or Associate's Degree | 3 (42.9%) | 70.0 |
| Bachelor's Degree | 2 (28.6%) | 222.0 |
| Graduate Degree | 2 (28.6%) | 333.0 |
| Total | 7 (100.0%) | 69.0 |
Fertility by Education by Marriage Status in Mccurtain
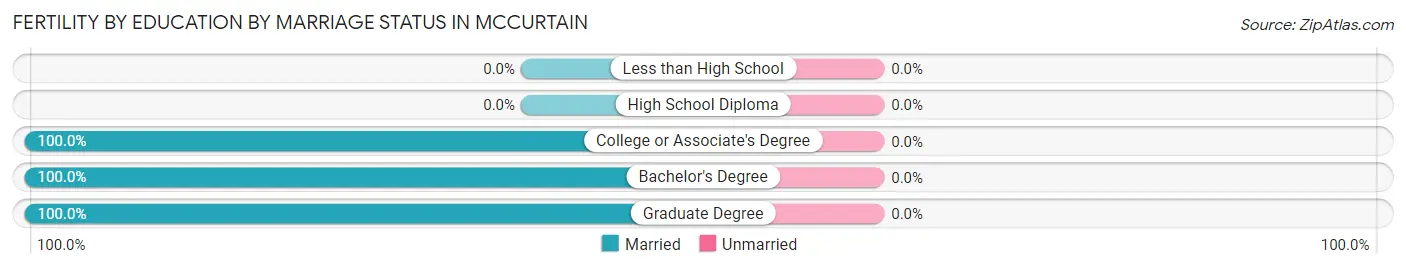
| Educational Attainment | Married | Unmarried |
| Less than High School | 0 (0.0%) | 0 (0.0%) |
| High School Diploma | 0 (0.0%) | 0 (0.0%) |
| College or Associate's Degree | 3 (100.0%) | 0 (0.0%) |
| Bachelor's Degree | 2 (100.0%) | 0 (0.0%) |
| Graduate Degree | 2 (100.0%) | 0 (0.0%) |
| Total | 7 (100.0%) | 0 (0.0%) |
Income in Mccurtain
Income Overview in Mccurtain
Per Capita Income in Mccurtain is $14,254, while median incomes of families and households are $38,750 and $15,833 respectively.
| Characteristic | Number | Measure |
| Per Capita Income | 420 | $14,254 |
| Median Family Income | 88 | $38,750 |
| Mean Family Income | 88 | $46,548 |
| Median Household Income | 204 | $15,833 |
| Mean Household Income | 204 | $27,316 |
| Income Deficit | 88 | $0 |
| Wage / Income Gap (%) | 420 | 0.00% |
| Wage / Income Gap ($) | 420 | 100.00¢ per $1 |
| Gini / Inequality Index | 420 | 0.61 |
Earnings by Sex in Mccurtain
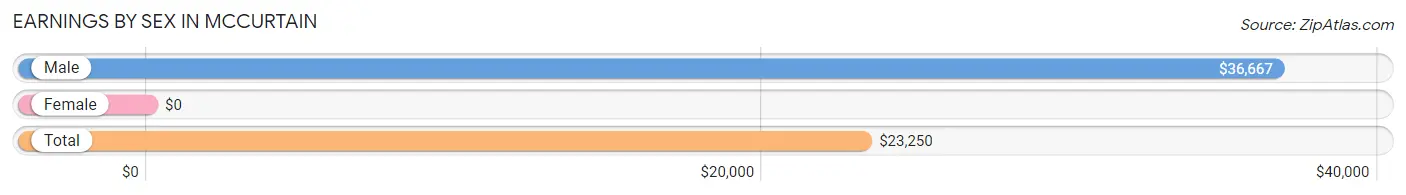
| Sex | Number | Average Earnings |
| Male | 66 (46.2%) | $36,667 |
| Female | 77 (53.8%) | $0 |
| Total | 143 (100.0%) | $23,250 |
Earnings by Sex by Income Bracket in Mccurtain
The most common earnings brackets in Mccurtain are $55,000 to $64,999 for men (14 | 21.2%) and $2,499 or less for women (29 | 37.7%).
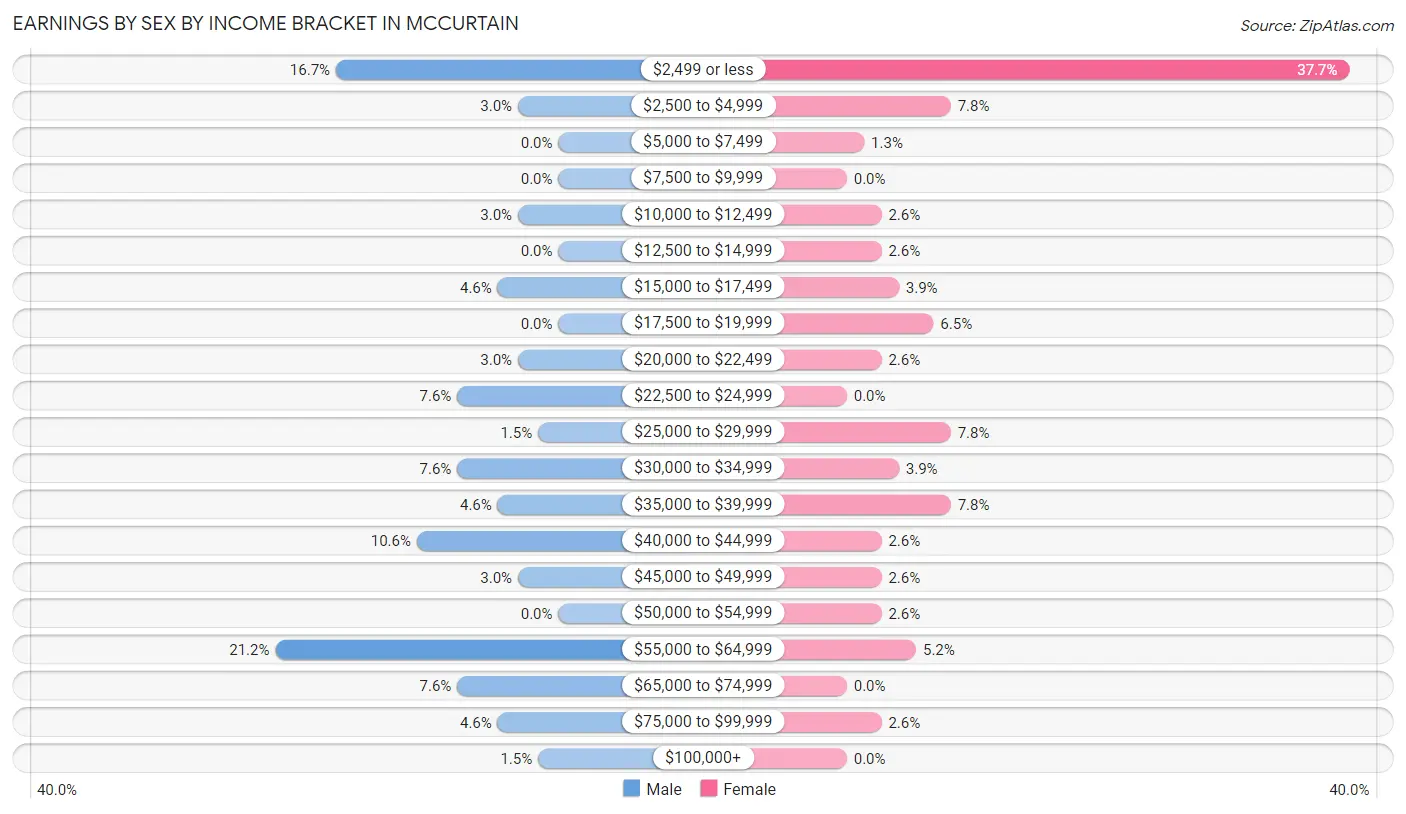
| Income | Male | Female |
| $2,499 or less | 11 (16.7%) | 29 (37.7%) |
| $2,500 to $4,999 | 2 (3.0%) | 6 (7.8%) |
| $5,000 to $7,499 | 0 (0.0%) | 1 (1.3%) |
| $7,500 to $9,999 | 0 (0.0%) | 0 (0.0%) |
| $10,000 to $12,499 | 2 (3.0%) | 2 (2.6%) |
| $12,500 to $14,999 | 0 (0.0%) | 2 (2.6%) |
| $15,000 to $17,499 | 3 (4.5%) | 3 (3.9%) |
| $17,500 to $19,999 | 0 (0.0%) | 5 (6.5%) |
| $20,000 to $22,499 | 2 (3.0%) | 2 (2.6%) |
| $22,500 to $24,999 | 5 (7.6%) | 0 (0.0%) |
| $25,000 to $29,999 | 1 (1.5%) | 6 (7.8%) |
| $30,000 to $34,999 | 5 (7.6%) | 3 (3.9%) |
| $35,000 to $39,999 | 3 (4.5%) | 6 (7.8%) |
| $40,000 to $44,999 | 7 (10.6%) | 2 (2.6%) |
| $45,000 to $49,999 | 2 (3.0%) | 2 (2.6%) |
| $50,000 to $54,999 | 0 (0.0%) | 2 (2.6%) |
| $55,000 to $64,999 | 14 (21.2%) | 4 (5.2%) |
| $65,000 to $74,999 | 5 (7.6%) | 0 (0.0%) |
| $75,000 to $99,999 | 3 (4.5%) | 2 (2.6%) |
| $100,000+ | 1 (1.5%) | 0 (0.0%) |
| Total | 66 (100.0%) | 77 (100.0%) |
Earnings by Sex by Educational Attainment in Mccurtain
Average earnings in Mccurtain are $35,417 for men and $26,250 for women, a difference of 25.9%. Men with an educational attainment of bachelor's degree enjoy the highest average annual earnings of $58,125, while those with high school diploma education earn the least with $23,500. Women with an educational attainment of graduate degree earn the most with the average annual earnings of $53,750, while those with graduate degree education have the smallest earnings of $53,750.
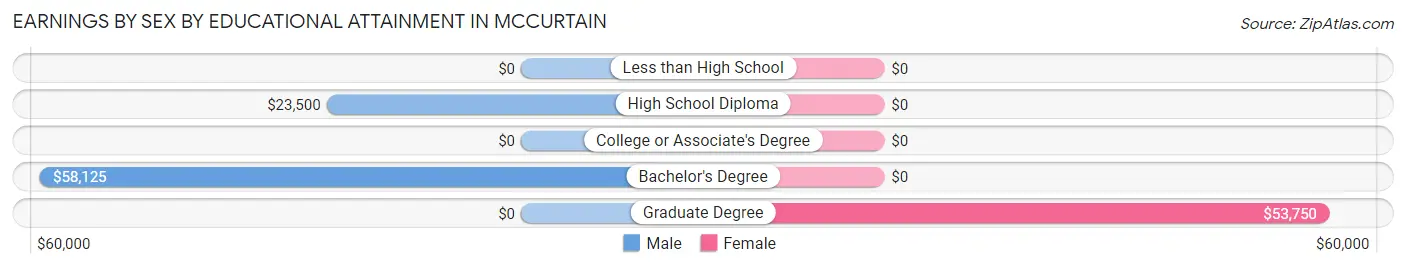
| Educational Attainment | Male Income | Female Income |
| Less than High School | - | - |
| High School Diploma | $23,500 | $0 |
| College or Associate's Degree | - | - |
| Bachelor's Degree | $58,125 | $0 |
| Graduate Degree | - | - |
| Total | $35,417 | $26,250 |
Family Income in Mccurtain
Family Income Brackets in Mccurtain
According to the Mccurtain family income data, there are 18 families falling into the $35,000 to $49,999 income range, which is the most common income bracket and makes up 20.4% of all families.
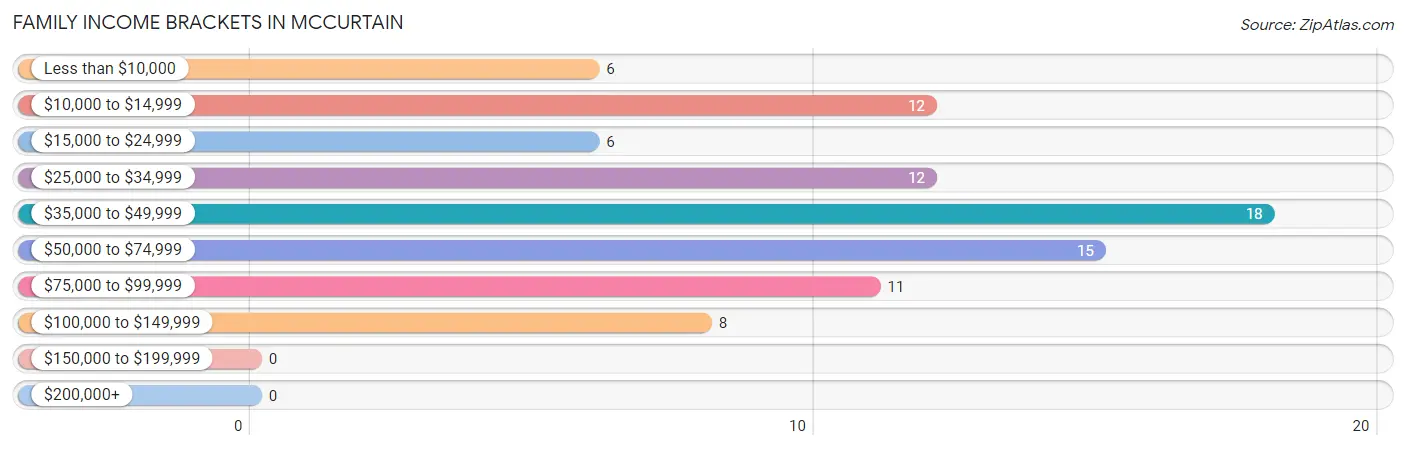
| Income Bracket | # Families | % Families |
| Less than $10,000 | 6 | 6.8% |
| $10,000 to $14,999 | 12 | 13.6% |
| $15,000 to $24,999 | 6 | 6.8% |
| $25,000 to $34,999 | 12 | 13.6% |
| $35,000 to $49,999 | 18 | 20.5% |
| $50,000 to $74,999 | 15 | 17.0% |
| $75,000 to $99,999 | 11 | 12.5% |
| $100,000 to $149,999 | 8 | 9.1% |
| $150,000 to $199,999 | 0 | 0.0% |
| $200,000+ | 0 | 0.0% |
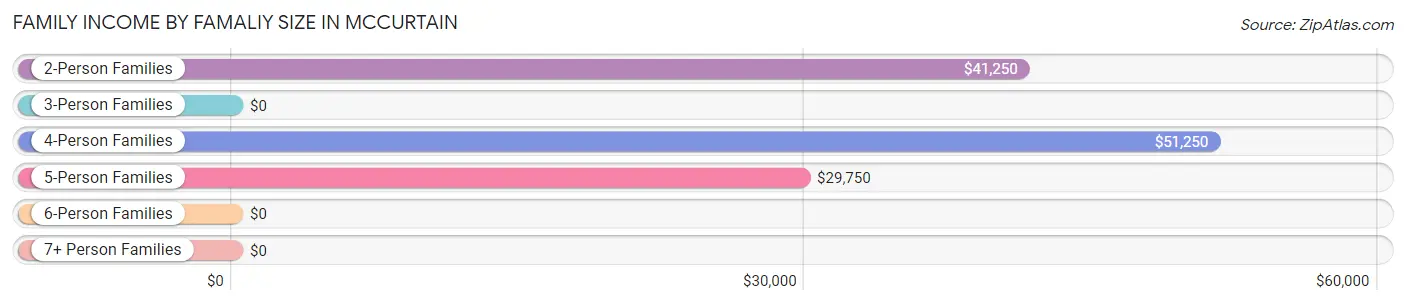
Family Income by Famaliy Size in Mccurtain
4-person families (18 | 20.4%) account for the highest median family income in Mccurtain with $51,250 per family, while 2-person families (36 | 40.9%) have the highest median income of $20,625 per family member.
| Income Bracket | # Families | Median Income |
| 2-Person Families | 36 (40.9%) | $41,250 |
| 3-Person Families | 15 (17.1%) | $0 |
| 4-Person Families | 18 (20.4%) | $51,250 |
| 5-Person Families | 15 (17.1%) | $29,750 |
| 6-Person Families | 3 (3.4%) | $0 |
| 7+ Person Families | 1 (1.1%) | $0 |
| Total | 88 (100.0%) | $38,750 |
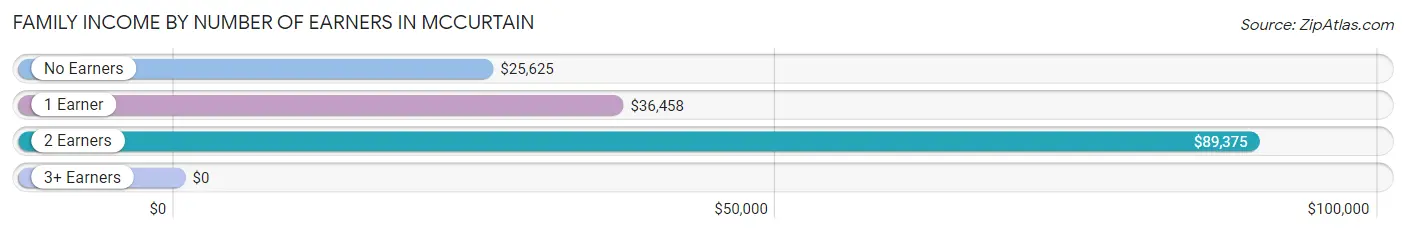
Family Income by Number of Earners in Mccurtain
| Number of Earners | # Families | Median Income |
| No Earners | 23 (26.1%) | $25,625 |
| 1 Earner | 45 (51.1%) | $36,458 |
| 2 Earners | 18 (20.4%) | $89,375 |
| 3+ Earners | 2 (2.3%) | $0 |
| Total | 88 (100.0%) | $38,750 |
Household Income in Mccurtain
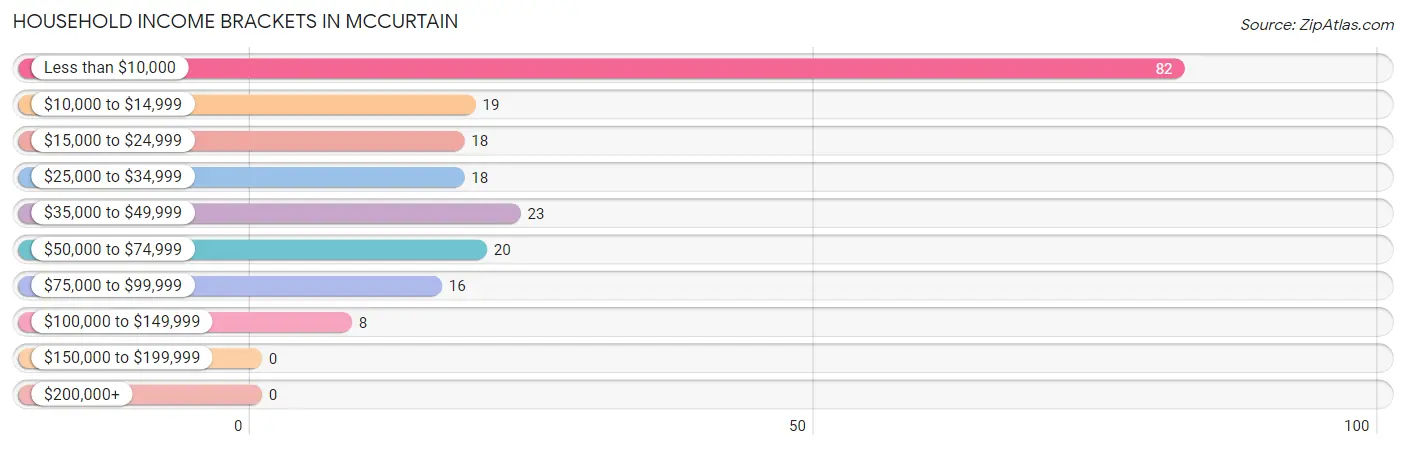
Household Income Brackets in Mccurtain
With 82 households falling in the category, the less than $10,000 income range is the most frequent in Mccurtain, accounting for 40.2% of all households.
| Income Bracket | # Households | % Households |
| Less than $10,000 | 82 | 40.2% |
| $10,000 to $14,999 | 19 | 9.3% |
| $15,000 to $24,999 | 18 | 8.8% |
| $25,000 to $34,999 | 18 | 8.8% |
| $35,000 to $49,999 | 23 | 11.3% |
| $50,000 to $74,999 | 20 | 9.8% |
| $75,000 to $99,999 | 16 | 7.8% |
| $100,000 to $149,999 | 8 | 3.9% |
| $150,000 to $199,999 | 0 | 0.0% |
| $200,000+ | 0 | 0.0% |
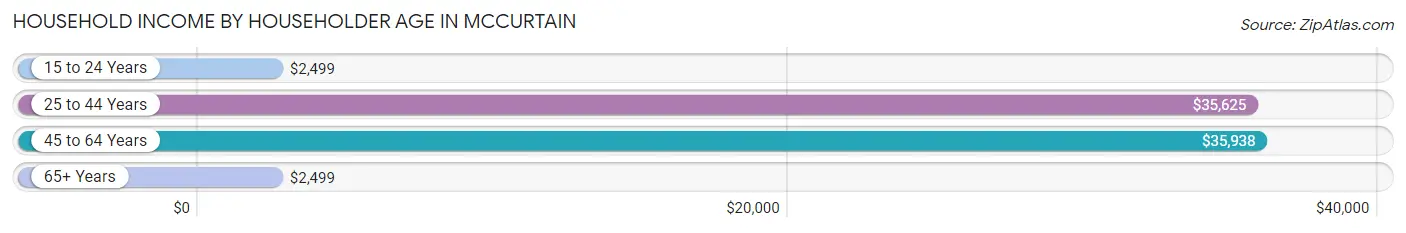
Household Income by Householder Age in Mccurtain
The median household income in Mccurtain is $15,833, with the highest median household income of $35,938 found in the 45 to 64 years age bracket for the primary householder. A total of 35 households (17.2%) fall into this category. Meanwhile, the 15 to 24 years age bracket for the primary householder has the lowest median household income of $2,499, with 28 households (13.7%) in this group.
| Income Bracket | # Households | Median Income |
| 15 to 24 Years | 28 (13.7%) | $2,499 |
| 25 to 44 Years | 48 (23.5%) | $35,625 |
| 45 to 64 Years | 35 (17.2%) | $35,938 |
| 65+ Years | 93 (45.6%) | $2,499 |
| Total | 204 (100.0%) | $15,833 |
Poverty in Mccurtain
Income Below Poverty by Sex and Age in Mccurtain
With 41.9% poverty level for males and 58.3% for females among the residents of Mccurtain, under 5 year old males and 6 to 11 year old females are the most vulnerable to poverty, with 13 males (86.7%) and 15 females (88.2%) in their respective age groups living below the poverty level.
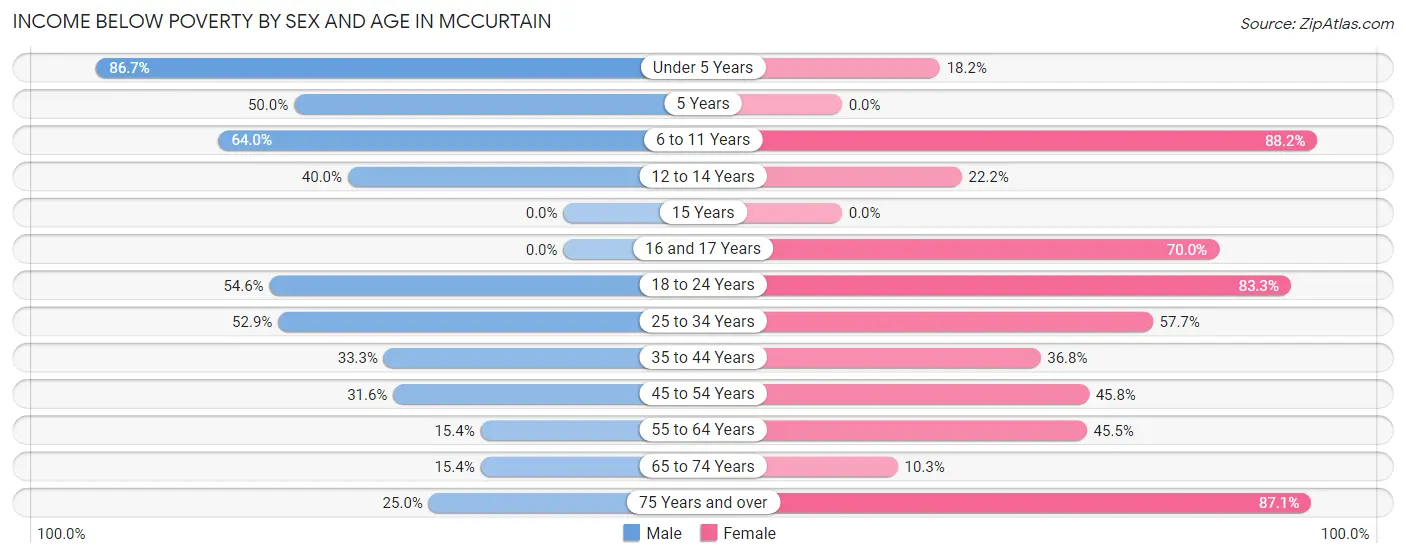
| Age Bracket | Male | Female |
| Under 5 Years | 13 (86.7%) | 2 (18.2%) |
| 5 Years | 1 (50.0%) | 0 (0.0%) |
| 6 to 11 Years | 16 (64.0%) | 15 (88.2%) |
| 12 to 14 Years | 2 (40.0%) | 2 (22.2%) |
| 15 Years | 0 (0.0%) | 0 (0.0%) |
| 16 and 17 Years | 0 (0.0%) | 7 (70.0%) |
| 18 to 24 Years | 6 (54.5%) | 25 (83.3%) |
| 25 to 34 Years | 9 (52.9%) | 15 (57.7%) |
| 35 to 44 Years | 8 (33.3%) | 7 (36.8%) |
| 45 to 54 Years | 6 (31.6%) | 11 (45.8%) |
| 55 to 64 Years | 2 (15.4%) | 10 (45.5%) |
| 65 to 74 Years | 2 (15.4%) | 3 (10.3%) |
| 75 Years and over | 2 (25.0%) | 54 (87.1%) |
| Total | 67 (41.9%) | 151 (58.3%) |
Income Above Poverty by Sex and Age in Mccurtain
According to the poverty statistics in Mccurtain, males aged 16 and 17 years and females aged 65 to 74 years are the age groups that are most secure financially, with 100.0% of males and 89.7% of females in these age groups living above the poverty line.
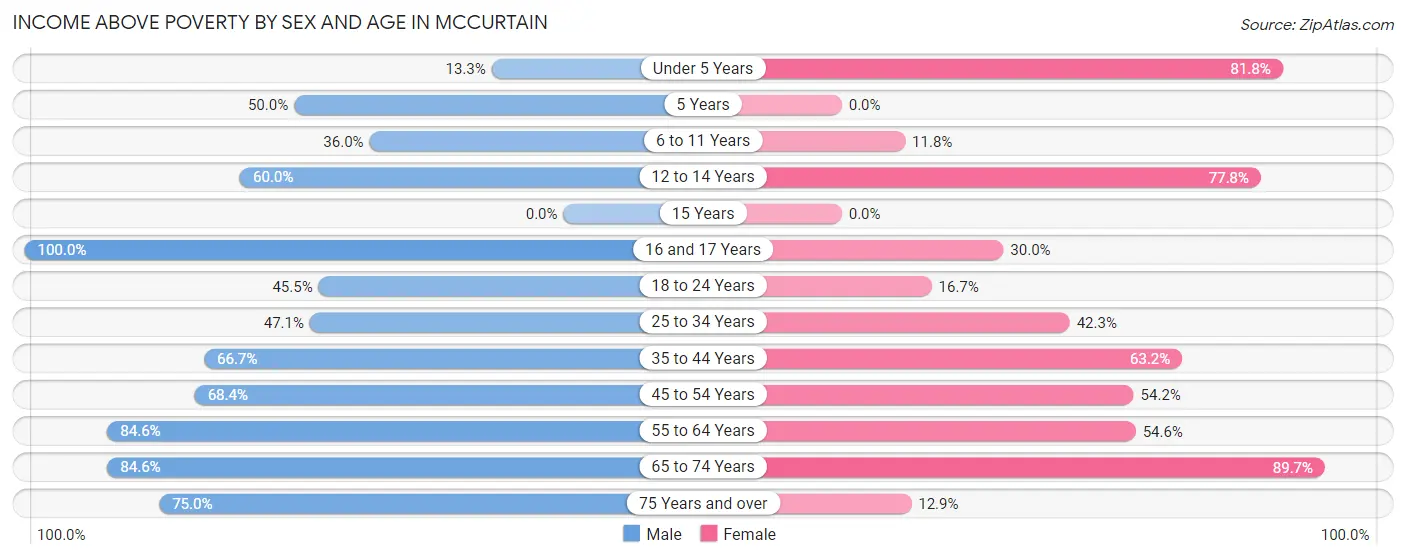
| Age Bracket | Male | Female |
| Under 5 Years | 2 (13.3%) | 9 (81.8%) |
| 5 Years | 1 (50.0%) | 0 (0.0%) |
| 6 to 11 Years | 9 (36.0%) | 2 (11.8%) |
| 12 to 14 Years | 3 (60.0%) | 7 (77.8%) |
| 15 Years | 0 (0.0%) | 0 (0.0%) |
| 16 and 17 Years | 8 (100.0%) | 3 (30.0%) |
| 18 to 24 Years | 5 (45.5%) | 5 (16.7%) |
| 25 to 34 Years | 8 (47.1%) | 11 (42.3%) |
| 35 to 44 Years | 16 (66.7%) | 12 (63.2%) |
| 45 to 54 Years | 13 (68.4%) | 13 (54.2%) |
| 55 to 64 Years | 11 (84.6%) | 12 (54.5%) |
| 65 to 74 Years | 11 (84.6%) | 26 (89.7%) |
| 75 Years and over | 6 (75.0%) | 8 (12.9%) |
| Total | 93 (58.1%) | 108 (41.7%) |
Income Below Poverty Among Married-Couple Families in Mccurtain
The poverty statistics for married-couple families in Mccurtain show that 24.6% or 15 of the total 61 families live below the poverty line. Families with 5 or more children have the highest poverty rate of 100.0%, comprising of 1 families. On the other hand, families with no children have the lowest poverty rate of 13.8%, which includes 4 families.
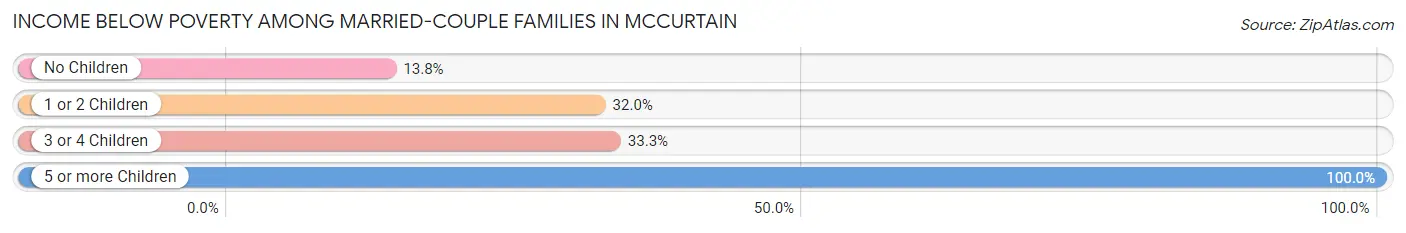
| Children | Above Poverty | Below Poverty |
| No Children | 25 (86.2%) | 4 (13.8%) |
| 1 or 2 Children | 17 (68.0%) | 8 (32.0%) |
| 3 or 4 Children | 4 (66.7%) | 2 (33.3%) |
| 5 or more Children | 0 (0.0%) | 1 (100.0%) |
| Total | 46 (75.4%) | 15 (24.6%) |
Income Below Poverty Among Single-Parent Households in Mccurtain
According to the poverty data in Mccurtain, 75.0% or 3 single-father households and 60.9% or 14 single-mother households are living below the poverty line. Among single-father households, those with no children have the highest poverty rate, with 3 households (75.0%) experiencing poverty. Likewise, among single-mother households, those with 3 or 4 children have the highest poverty rate, with 8 households (100.0%) falling below the poverty line.
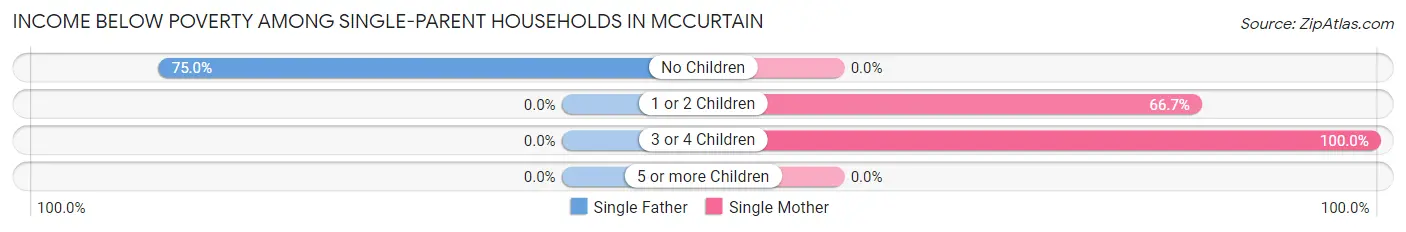
| Children | Single Father | Single Mother |
| No Children | 3 (75.0%) | 0 (0.0%) |
| 1 or 2 Children | 0 (0.0%) | 6 (66.7%) |
| 3 or 4 Children | 0 (0.0%) | 8 (100.0%) |
| 5 or more Children | 0 (0.0%) | 0 (0.0%) |
| Total | 3 (75.0%) | 14 (60.9%) |
Income Below Poverty Among Married-Couple vs Single-Parent Households in Mccurtain
The poverty data for Mccurtain shows that 15 of the married-couple family households (24.6%) and 17 of the single-parent households (63.0%) are living below the poverty level. Within the married-couple family households, those with 5 or more children have the highest poverty rate, with 1 households (100.0%) falling below the poverty line. Among the single-parent households, those with 3 or 4 children have the highest poverty rate, with 8 household (100.0%) living below poverty.
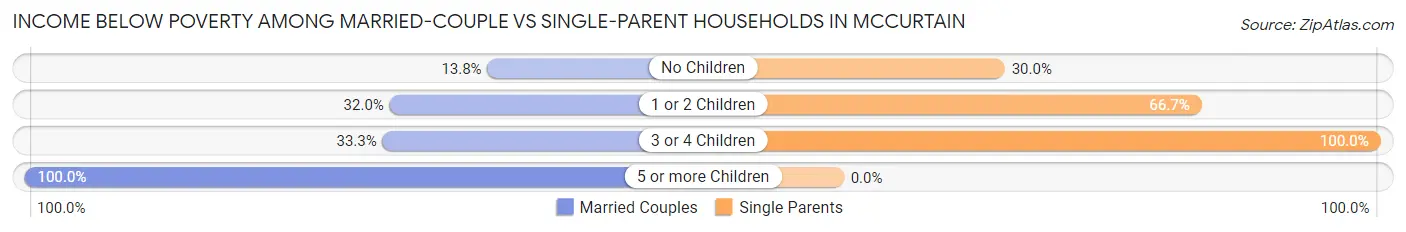
| Children | Married-Couple Families | Single-Parent Households |
| No Children | 4 (13.8%) | 3 (30.0%) |
| 1 or 2 Children | 8 (32.0%) | 6 (66.7%) |
| 3 or 4 Children | 2 (33.3%) | 8 (100.0%) |
| 5 or more Children | 1 (100.0%) | 0 (0.0%) |
| Total | 15 (24.6%) | 17 (63.0%) |
Employment Characteristics in Mccurtain
Employment by Class of Employer in Mccurtain
Among the 134 employed individuals in Mccurtain, private company employees (71 | 53.0%), self-employed (not incorporated) (40 | 29.8%), and local government employees (9 | 6.7%) make up the most common classes of employment.
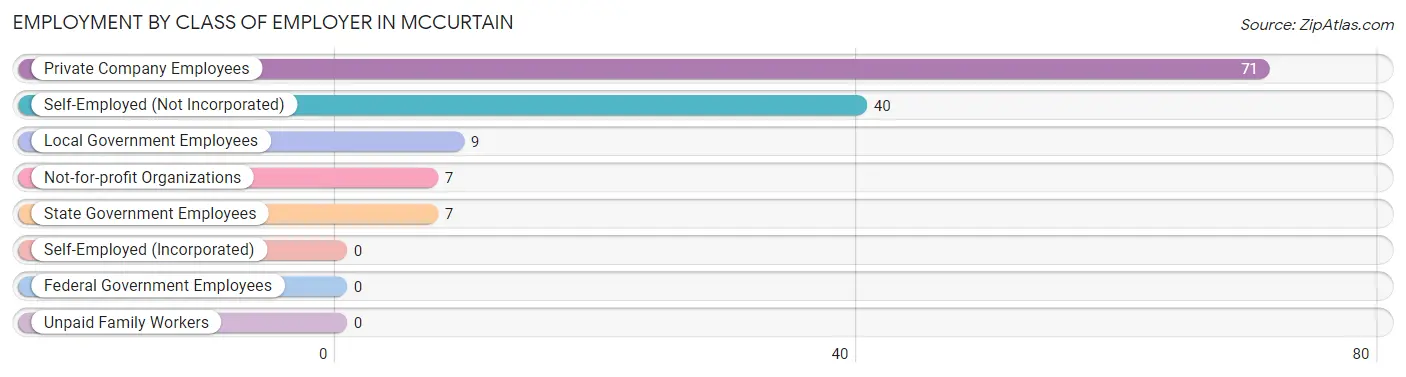
| Employer Class | # Employees | % Employees |
| Private Company Employees | 71 | 53.0% |
| Self-Employed (Incorporated) | 0 | 0.0% |
| Self-Employed (Not Incorporated) | 40 | 29.8% |
| Not-for-profit Organizations | 7 | 5.2% |
| Local Government Employees | 9 | 6.7% |
| State Government Employees | 7 | 5.2% |
| Federal Government Employees | 0 | 0.0% |
| Unpaid Family Workers | 0 | 0.0% |
| Total | 134 | 100.0% |
Employment Status by Age in Mccurtain
According to the labor force statistics for Mccurtain, out of the total population over 16 years of age (335), 43.3% or 145 individuals are in the labor force, with 4.8% or 7 of them unemployed. The age group with the highest labor force participation rate is 20 to 24 years, with 81.6% or 31 individuals in the labor force. Within the labor force, the 45 to 54 years age range has the highest percentage of unemployed individuals, with 28.0% or 7 of them being unemployed.
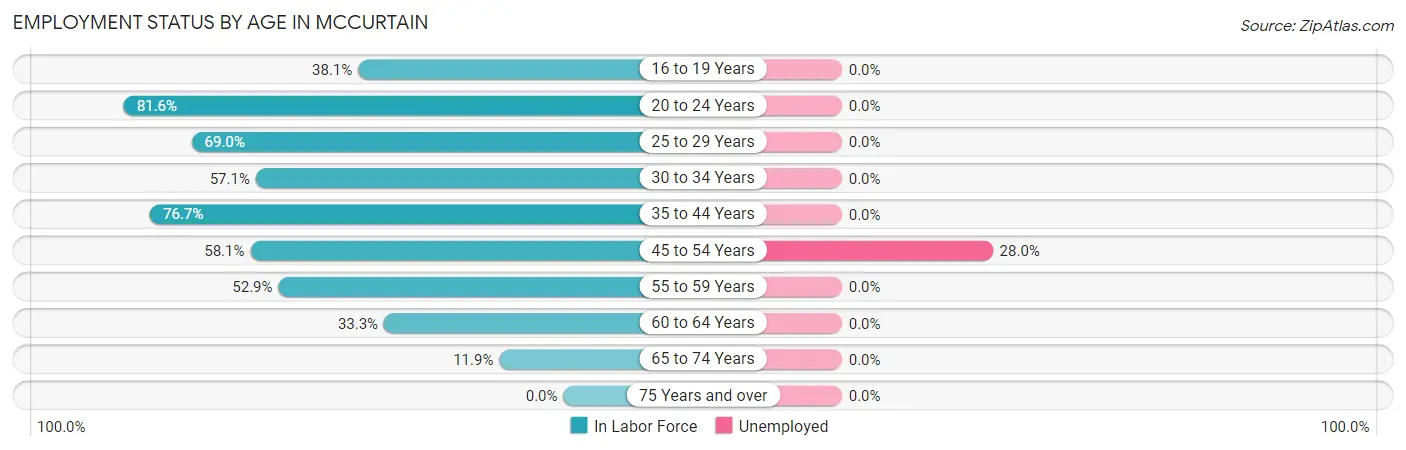
| Age Bracket | In Labor Force | Unemployed |
| 16 to 19 Years | 8 (38.1%) | 0 (0.0%) |
| 20 to 24 Years | 31 (81.6%) | 0 (0.0%) |
| 25 to 29 Years | 20 (69.0%) | 0 (0.0%) |
| 30 to 34 Years | 8 (57.1%) | 0 (0.0%) |
| 35 to 44 Years | 33 (76.7%) | 0 (0.0%) |
| 45 to 54 Years | 25 (58.1%) | 7 (28.0%) |
| 55 to 59 Years | 9 (52.9%) | 0 (0.0%) |
| 60 to 64 Years | 6 (33.3%) | 0 (0.0%) |
| 65 to 74 Years | 5 (11.9%) | 0 (0.0%) |
| 75 Years and over | 0 (0.0%) | 0 (0.0%) |
| Total | 145 (43.3%) | 7 (4.8%) |
Employment Status by Educational Attainment in Mccurtain
According to labor force statistics for Mccurtain, 61.6% of individuals (101) out of the total population between 25 and 64 years of age (164) are in the labor force, with 6.9% or 7 of them being unemployed. The group with the highest labor force participation rate are those with the educational attainment of bachelor's degree or higher, with 72.0% or 18 individuals in the labor force. Within the labor force, individuals with high school diploma education have the highest percentage of unemployment, with 14.0% or 7 of them being unemployed.
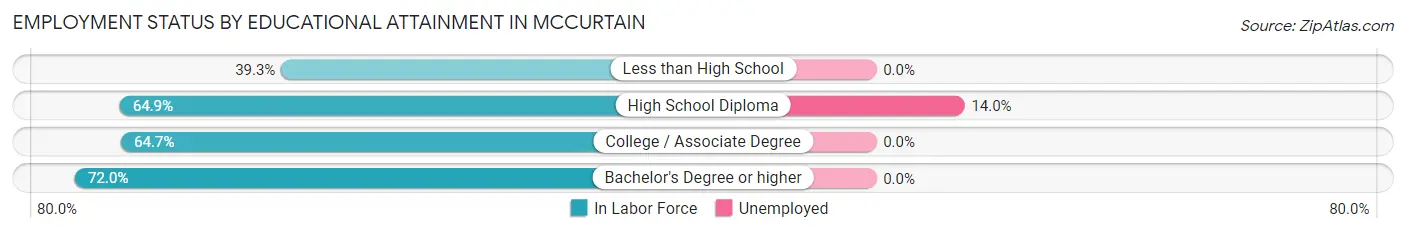
| Educational Attainment | In Labor Force | Unemployed |
| Less than High School | 11 (39.3%) | 0 (0.0%) |
| High School Diploma | 50 (64.9%) | 11 (14.0%) |
| College / Associate Degree | 22 (64.7%) | 0 (0.0%) |
| Bachelor's Degree or higher | 18 (72.0%) | 0 (0.0%) |
| Total | 101 (61.6%) | 11 (6.9%) |
Employment Occupations by Sex in Mccurtain
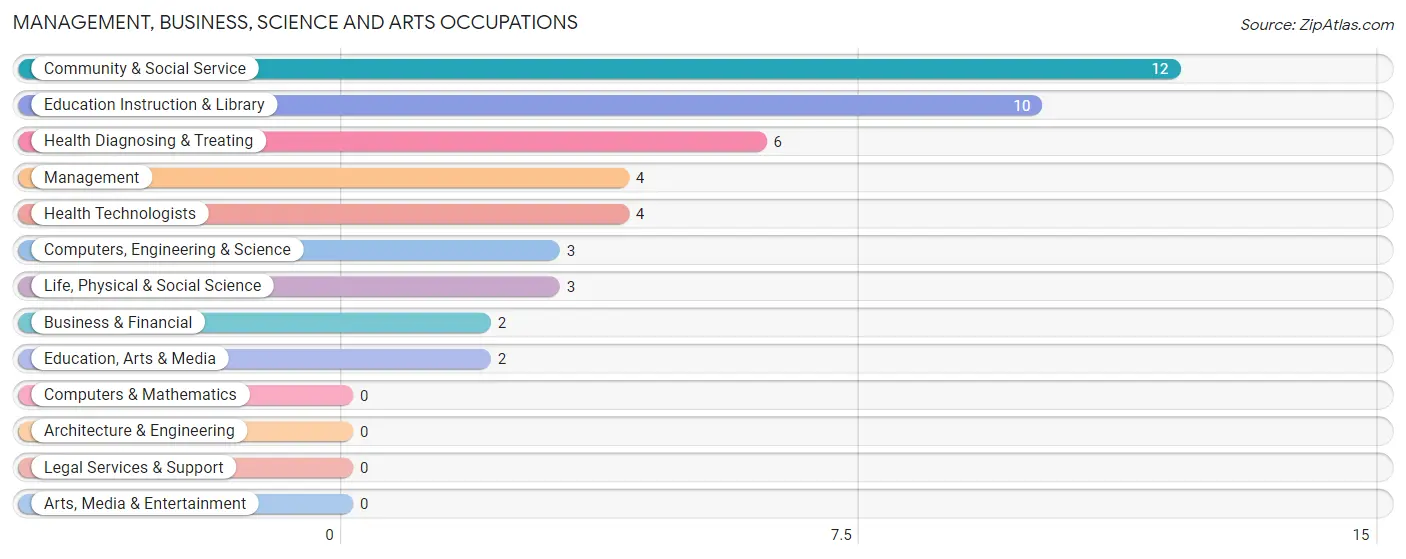
Management, Business, Science and Arts Occupations
The most common Management, Business, Science and Arts occupations in Mccurtain are Community & Social Service (12 | 8.7%), Education Instruction & Library (10 | 7.2%), Health Diagnosing & Treating (6 | 4.3%), Management (4 | 2.9%), and Health Technologists (4 | 2.9%).
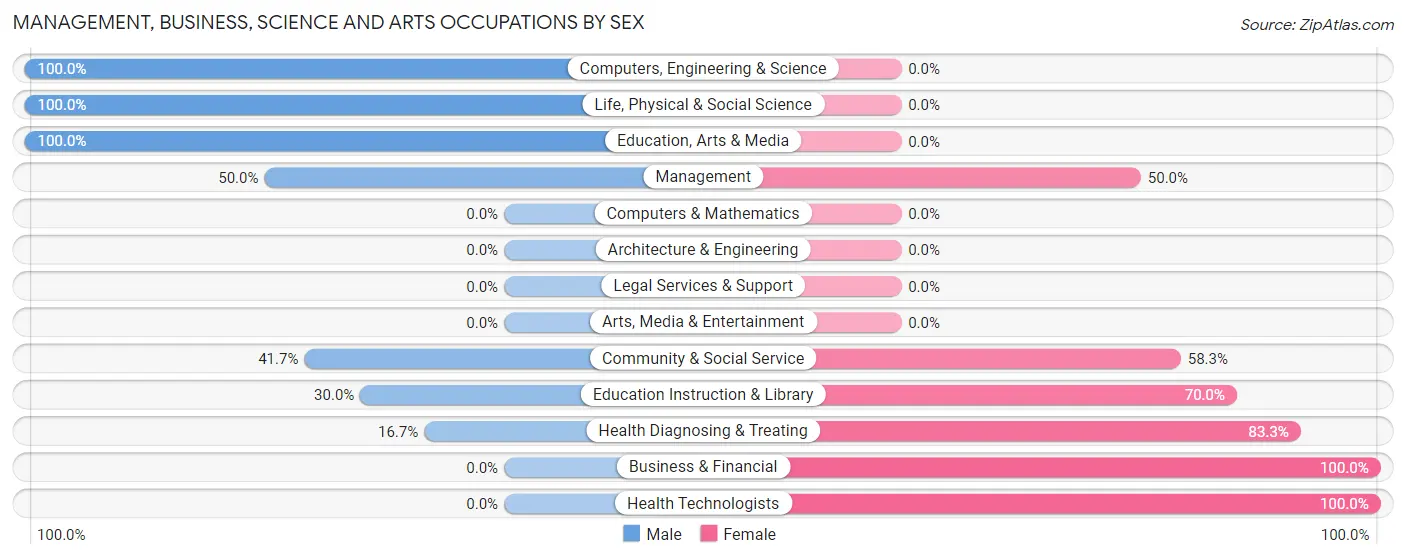
Management, Business, Science and Arts Occupations by Sex
Within the Management, Business, Science and Arts occupations in Mccurtain, the most male-oriented occupations are Computers, Engineering & Science (100.0%), Life, Physical & Social Science (100.0%), and Education, Arts & Media (100.0%), while the most female-oriented occupations are Business & Financial (100.0%), Health Technologists (100.0%), and Health Diagnosing & Treating (83.3%).
| Occupation | Male | Female |
| Management | 2 (50.0%) | 2 (50.0%) |
| Business & Financial | 0 (0.0%) | 2 (100.0%) |
| Computers, Engineering & Science | 3 (100.0%) | 0 (0.0%) |
| Computers & Mathematics | 0 (0.0%) | 0 (0.0%) |
| Architecture & Engineering | 0 (0.0%) | 0 (0.0%) |
| Life, Physical & Social Science | 3 (100.0%) | 0 (0.0%) |
| Community & Social Service | 5 (41.7%) | 7 (58.3%) |
| Education, Arts & Media | 2 (100.0%) | 0 (0.0%) |
| Legal Services & Support | 0 (0.0%) | 0 (0.0%) |
| Education Instruction & Library | 3 (30.0%) | 7 (70.0%) |
| Arts, Media & Entertainment | 0 (0.0%) | 0 (0.0%) |
| Health Diagnosing & Treating | 1 (16.7%) | 5 (83.3%) |
| Health Technologists | 0 (0.0%) | 4 (100.0%) |
| Total (Category) | 11 (40.7%) | 16 (59.3%) |
| Total (Overall) | 66 (47.8%) | 72 (52.2%) |
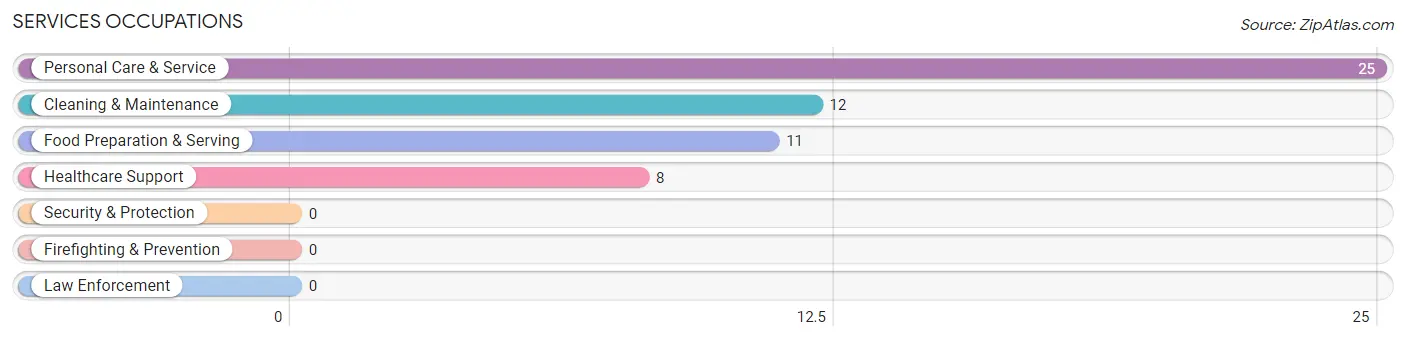
Services Occupations
The most common Services occupations in Mccurtain are Personal Care & Service (25 | 18.1%), Cleaning & Maintenance (12 | 8.7%), Food Preparation & Serving (11 | 8.0%), and Healthcare Support (8 | 5.8%).
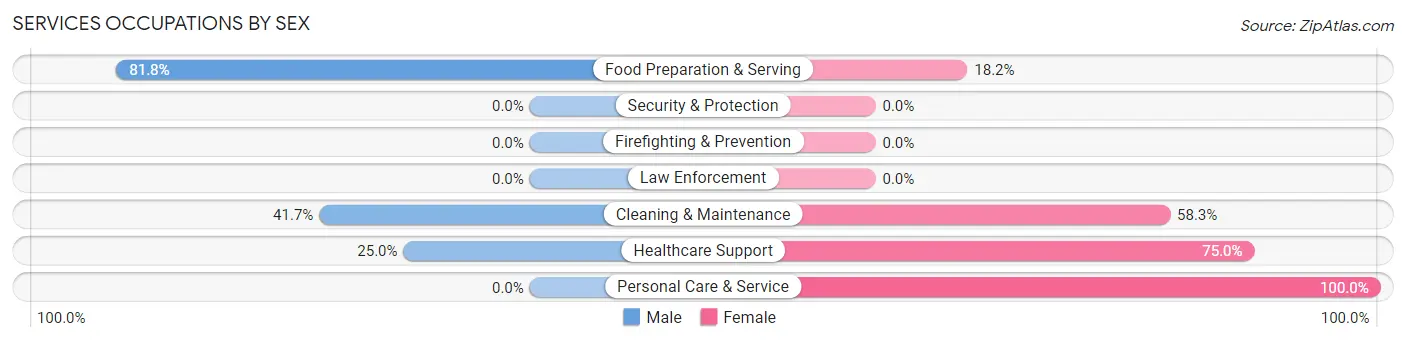
Services Occupations by Sex
Within the Services occupations in Mccurtain, the most male-oriented occupations are Food Preparation & Serving (81.8%), Cleaning & Maintenance (41.7%), and Healthcare Support (25.0%), while the most female-oriented occupations are Personal Care & Service (100.0%), Healthcare Support (75.0%), and Cleaning & Maintenance (58.3%).
| Occupation | Male | Female |
| Healthcare Support | 2 (25.0%) | 6 (75.0%) |
| Security & Protection | 0 (0.0%) | 0 (0.0%) |
| Firefighting & Prevention | 0 (0.0%) | 0 (0.0%) |
| Law Enforcement | 0 (0.0%) | 0 (0.0%) |
| Food Preparation & Serving | 9 (81.8%) | 2 (18.2%) |
| Cleaning & Maintenance | 5 (41.7%) | 7 (58.3%) |
| Personal Care & Service | 0 (0.0%) | 25 (100.0%) |
| Total (Category) | 16 (28.6%) | 40 (71.4%) |
| Total (Overall) | 66 (47.8%) | 72 (52.2%) |
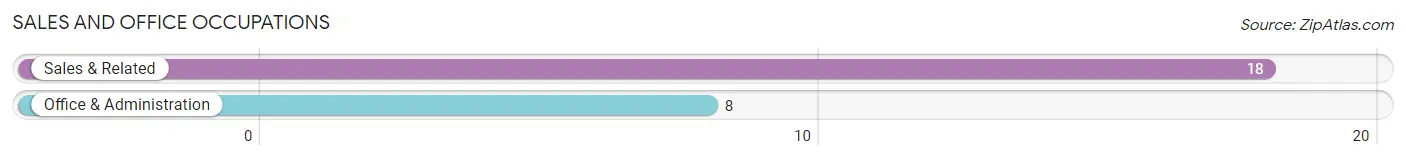
Sales and Office Occupations
The most common Sales and Office occupations in Mccurtain are Sales & Related (18 | 13.0%), and Office & Administration (8 | 5.8%).
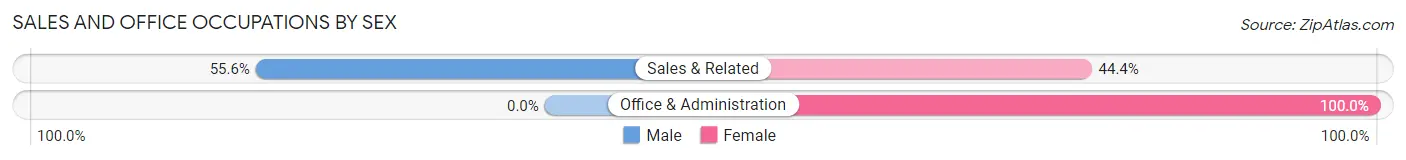
Sales and Office Occupations by Sex
| Occupation | Male | Female |
| Sales & Related | 10 (55.6%) | 8 (44.4%) |
| Office & Administration | 0 (0.0%) | 8 (100.0%) |
| Total (Category) | 10 (38.5%) | 16 (61.5%) |
| Total (Overall) | 66 (47.8%) | 72 (52.2%) |
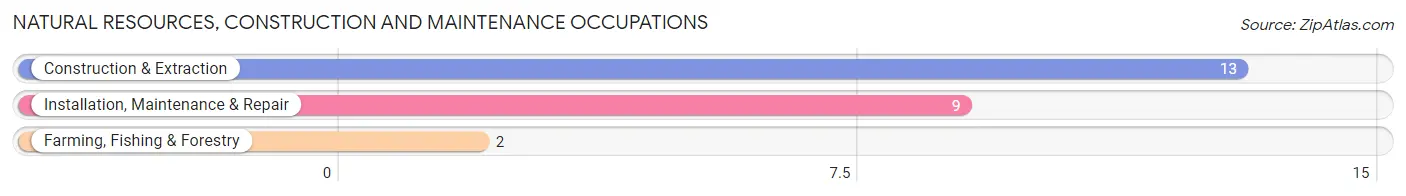
Natural Resources, Construction and Maintenance Occupations
The most common Natural Resources, Construction and Maintenance occupations in Mccurtain are Construction & Extraction (13 | 9.4%), Installation, Maintenance & Repair (9 | 6.5%), and Farming, Fishing & Forestry (2 | 1.5%).
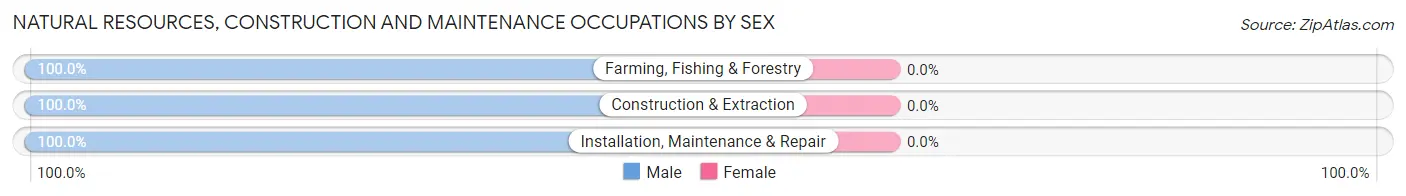
Natural Resources, Construction and Maintenance Occupations by Sex
| Occupation | Male | Female |
| Farming, Fishing & Forestry | 2 (100.0%) | 0 (0.0%) |
| Construction & Extraction | 13 (100.0%) | 0 (0.0%) |
| Installation, Maintenance & Repair | 9 (100.0%) | 0 (0.0%) |
| Total (Category) | 24 (100.0%) | 0 (0.0%) |
| Total (Overall) | 66 (47.8%) | 72 (52.2%) |
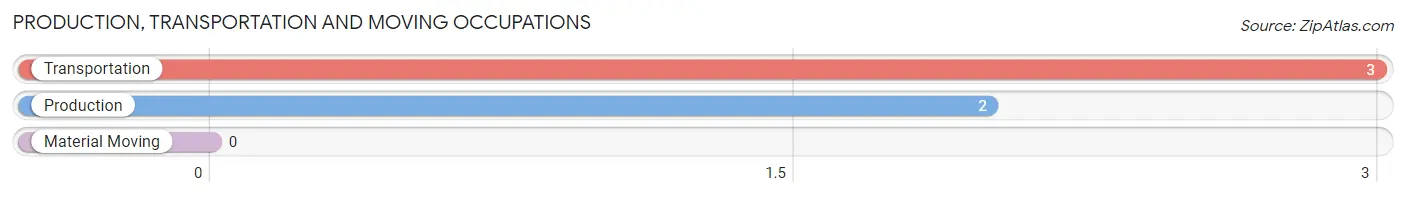
Production, Transportation and Moving Occupations
The most common Production, Transportation and Moving occupations in Mccurtain are Transportation (3 | 2.2%), and Production (2 | 1.5%).
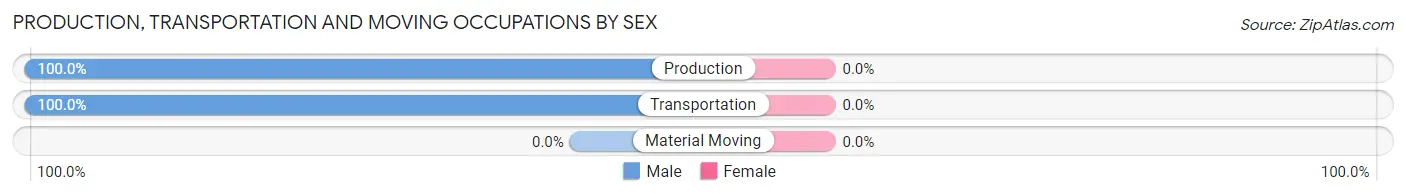
Production, Transportation and Moving Occupations by Sex
| Occupation | Male | Female |
| Production | 2 (100.0%) | 0 (0.0%) |
| Transportation | 3 (100.0%) | 0 (0.0%) |
| Material Moving | 0 (0.0%) | 0 (0.0%) |
| Total (Category) | 5 (100.0%) | 0 (0.0%) |
| Total (Overall) | 66 (47.8%) | 72 (52.2%) |
Employment Industries by Sex in Mccurtain
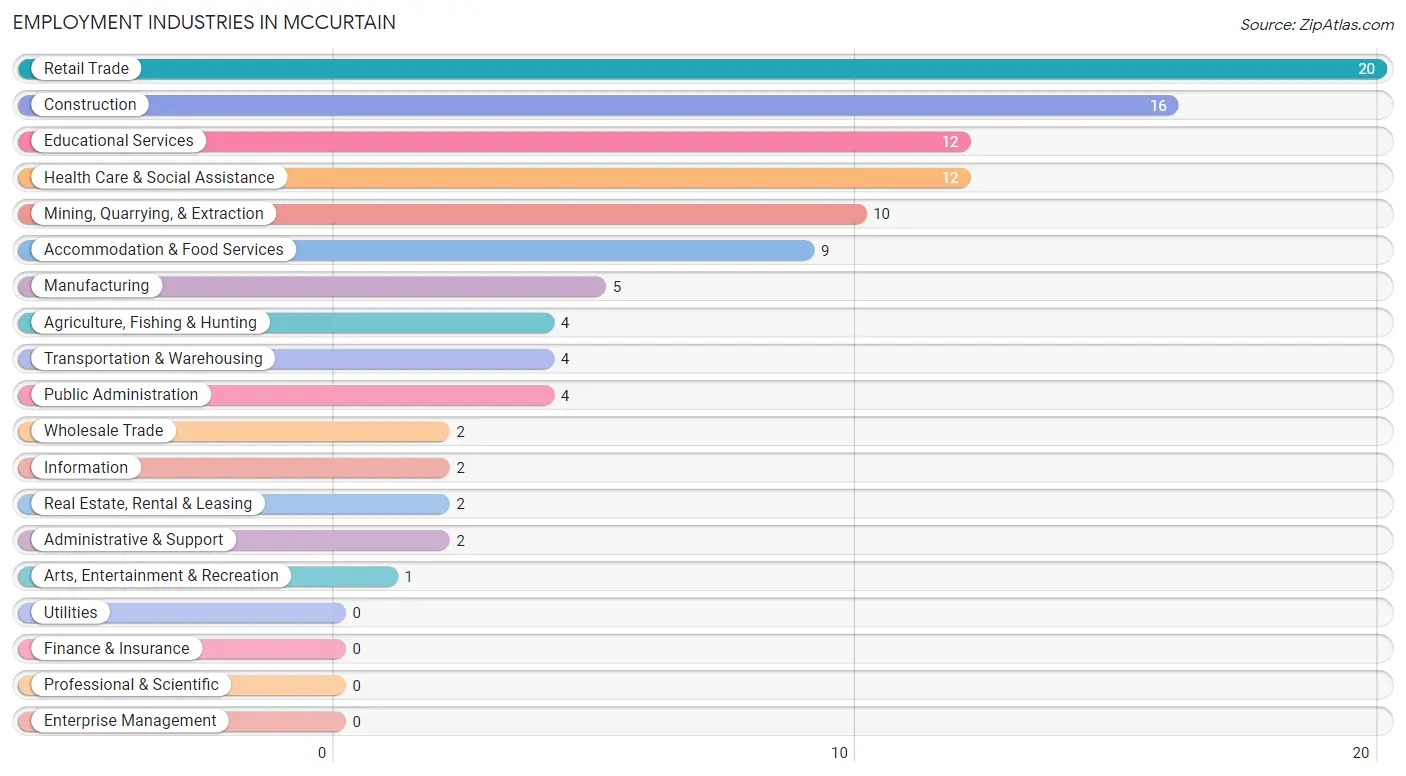
Employment Industries in Mccurtain
The major employment industries in Mccurtain include Retail Trade (20 | 14.5%), Construction (16 | 11.6%), Educational Services (12 | 8.7%), Health Care & Social Assistance (12 | 8.7%), and Mining, Quarrying, & Extraction (10 | 7.2%).
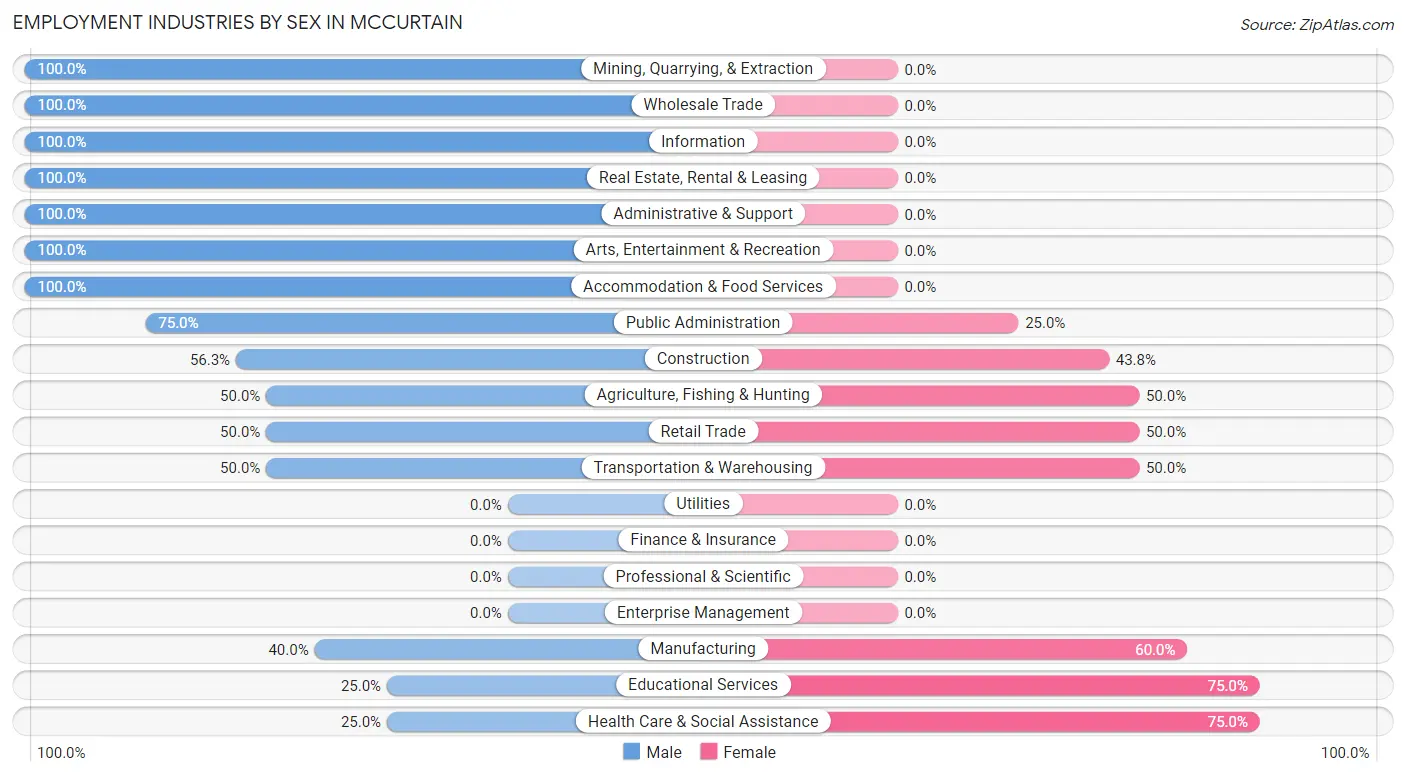
Employment Industries by Sex in Mccurtain
The Mccurtain industries that see more men than women are Mining, Quarrying, & Extraction (100.0%), Wholesale Trade (100.0%), and Information (100.0%), whereas the industries that tend to have a higher number of women are Educational Services (75.0%), Health Care & Social Assistance (75.0%), and Manufacturing (60.0%).
| Industry | Male | Female |
| Agriculture, Fishing & Hunting | 2 (50.0%) | 2 (50.0%) |
| Mining, Quarrying, & Extraction | 10 (100.0%) | 0 (0.0%) |
| Construction | 9 (56.2%) | 7 (43.8%) |
| Manufacturing | 2 (40.0%) | 3 (60.0%) |
| Wholesale Trade | 2 (100.0%) | 0 (0.0%) |
| Retail Trade | 10 (50.0%) | 10 (50.0%) |
| Transportation & Warehousing | 2 (50.0%) | 2 (50.0%) |
| Utilities | 0 (0.0%) | 0 (0.0%) |
| Information | 2 (100.0%) | 0 (0.0%) |
| Finance & Insurance | 0 (0.0%) | 0 (0.0%) |
| Real Estate, Rental & Leasing | 2 (100.0%) | 0 (0.0%) |
| Professional & Scientific | 0 (0.0%) | 0 (0.0%) |
| Enterprise Management | 0 (0.0%) | 0 (0.0%) |
| Administrative & Support | 2 (100.0%) | 0 (0.0%) |
| Educational Services | 3 (25.0%) | 9 (75.0%) |
| Health Care & Social Assistance | 3 (25.0%) | 9 (75.0%) |
| Arts, Entertainment & Recreation | 1 (100.0%) | 0 (0.0%) |
| Accommodation & Food Services | 9 (100.0%) | 0 (0.0%) |
| Public Administration | 3 (75.0%) | 1 (25.0%) |
| Total | 66 (47.8%) | 72 (52.2%) |
Education in Mccurtain
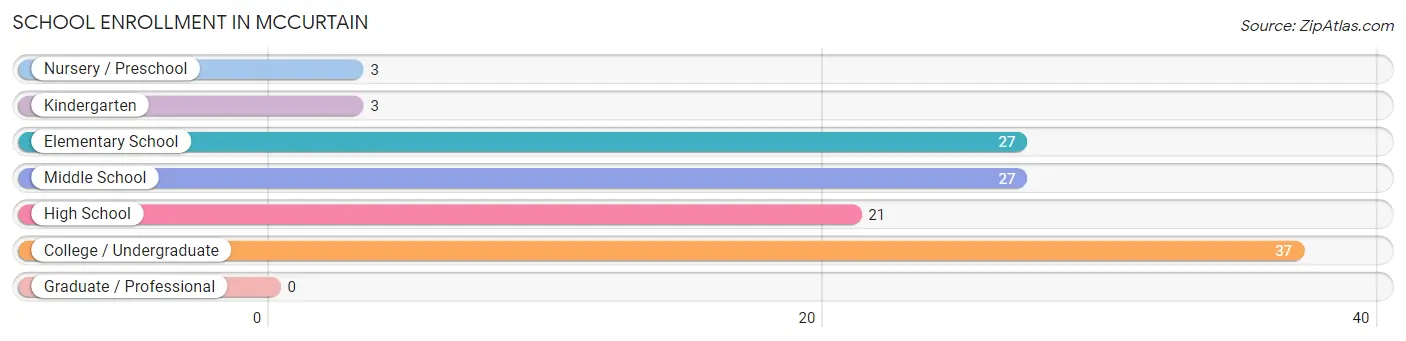
School Enrollment in Mccurtain
The most common levels of schooling among the 118 students in Mccurtain are college / undergraduate (37 | 31.4%), elementary school (27 | 22.9%), and middle school (27 | 22.9%).
| School Level | # Students | % Students |
| Nursery / Preschool | 3 | 2.5% |
| Kindergarten | 3 | 2.5% |
| Elementary School | 27 | 22.9% |
| Middle School | 27 | 22.9% |
| High School | 21 | 17.8% |
| College / Undergraduate | 37 | 31.4% |
| Graduate / Professional | 0 | 0.0% |
| Total | 118 | 100.0% |
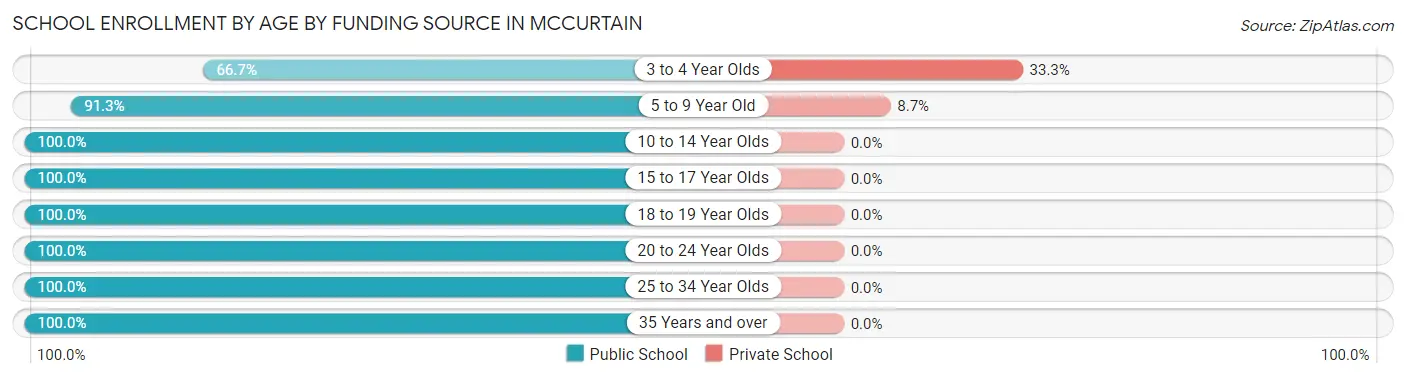
School Enrollment by Age by Funding Source in Mccurtain
Out of a total of 118 students who are enrolled in schools in Mccurtain, 3 (2.5%) attend a private institution, while the remaining 115 (97.5%) are enrolled in public schools. The age group of 3 to 4 year olds has the highest likelihood of being enrolled in private schools, with 1 (33.3% in the age bracket) enrolled. Conversely, the age group of 10 to 14 year olds has the lowest likelihood of being enrolled in a private school, with 35 (100.0% in the age bracket) attending a public institution.
| Age Bracket | Public School | Private School |
| 3 to 4 Year Olds | 2 (66.7%) | 1 (33.3%) |
| 5 to 9 Year Old | 21 (91.3%) | 2 (8.7%) |
| 10 to 14 Year Olds | 35 (100.0%) | 0 (0.0%) |
| 15 to 17 Year Olds | 18 (100.0%) | 0 (0.0%) |
| 18 to 19 Year Olds | 3 (100.0%) | 0 (0.0%) |
| 20 to 24 Year Olds | 30 (100.0%) | 0 (0.0%) |
| 25 to 34 Year Olds | 2 (100.0%) | 0 (0.0%) |
| 35 Years and over | 4 (100.0%) | 0 (0.0%) |
| Total | 115 (97.5%) | 3 (2.5%) |
Educational Attainment by Field of Study in Mccurtain
Education (11 | 32.4%), science & technology (6 | 17.6%), business (5 | 14.7%), social sciences (3 | 8.8%), and bio, nature & agricultural (2 | 5.9%) are the most common fields of study among 34 individuals in Mccurtain who have obtained a bachelor's degree or higher.
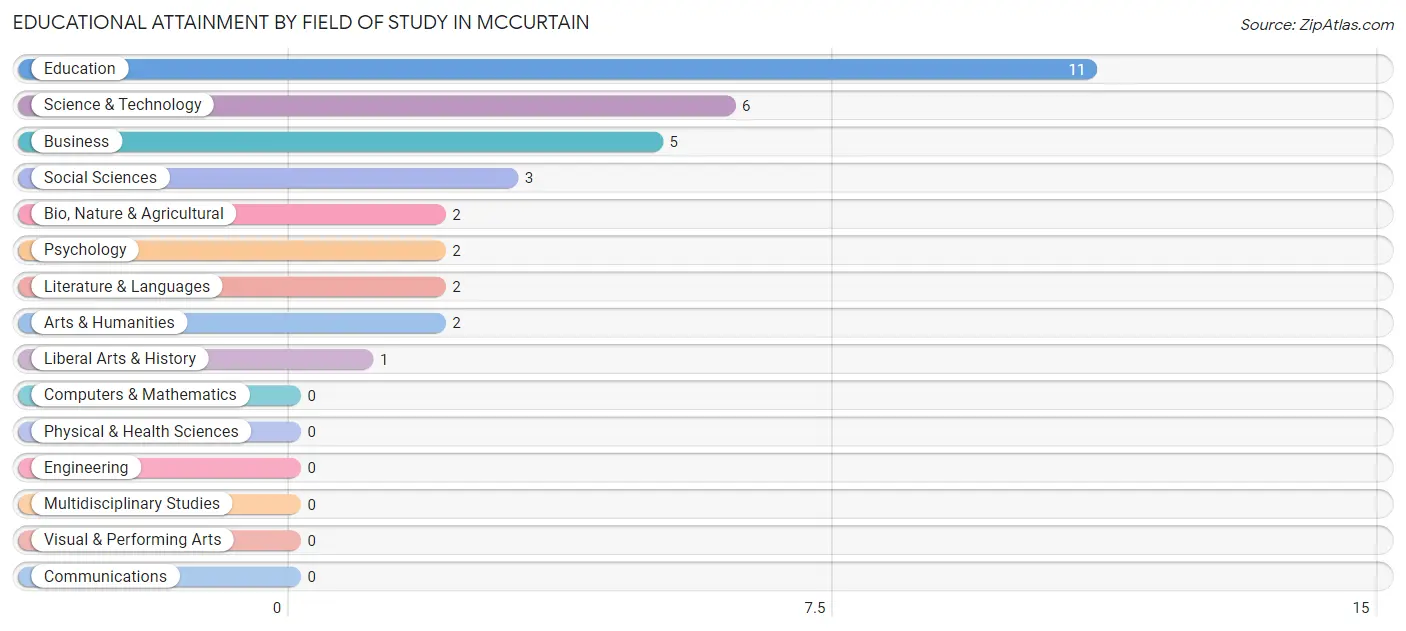
| Field of Study | # Graduates | % Graduates |
| Computers & Mathematics | 0 | 0.0% |
| Bio, Nature & Agricultural | 2 | 5.9% |
| Physical & Health Sciences | 0 | 0.0% |
| Psychology | 2 | 5.9% |
| Social Sciences | 3 | 8.8% |
| Engineering | 0 | 0.0% |
| Multidisciplinary Studies | 0 | 0.0% |
| Science & Technology | 6 | 17.6% |
| Business | 5 | 14.7% |
| Education | 11 | 32.4% |
| Literature & Languages | 2 | 5.9% |
| Liberal Arts & History | 1 | 2.9% |
| Visual & Performing Arts | 0 | 0.0% |
| Communications | 0 | 0.0% |
| Arts & Humanities | 2 | 5.9% |
| Total | 34 | 100.0% |
Transportation & Commute in Mccurtain
Vehicle Availability by Sex in Mccurtain
The most prevalent vehicle ownership categories in Mccurtain are males with 2 vehicles (27, accounting for 43.5%) and females with 2 vehicles (18, making up 37.5%).
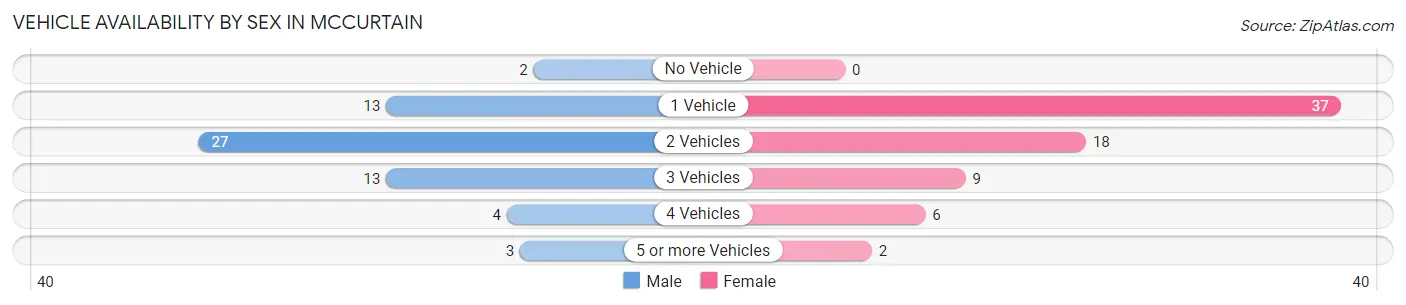
| Vehicles Available | Male | Female |
| No Vehicle | 2 (3.2%) | 0 (0.0%) |
| 1 Vehicle | 13 (21.0%) | 37 (51.4%) |
| 2 Vehicles | 27 (43.5%) | 18 (25.0%) |
| 3 Vehicles | 13 (21.0%) | 9 (12.5%) |
| 4 Vehicles | 4 (6.5%) | 6 (8.3%) |
| 5 or more Vehicles | 3 (4.8%) | 2 (2.8%) |
| Total | 62 (100.0%) | 72 (100.0%) |
Commute Time in Mccurtain
The most frequently occuring commute durations in Mccurtain are less than 5 minutes (35 commuters, 27.8%), 20 to 24 minutes (19 commuters, 15.1%), and 30 to 34 minutes (14 commuters, 11.1%).
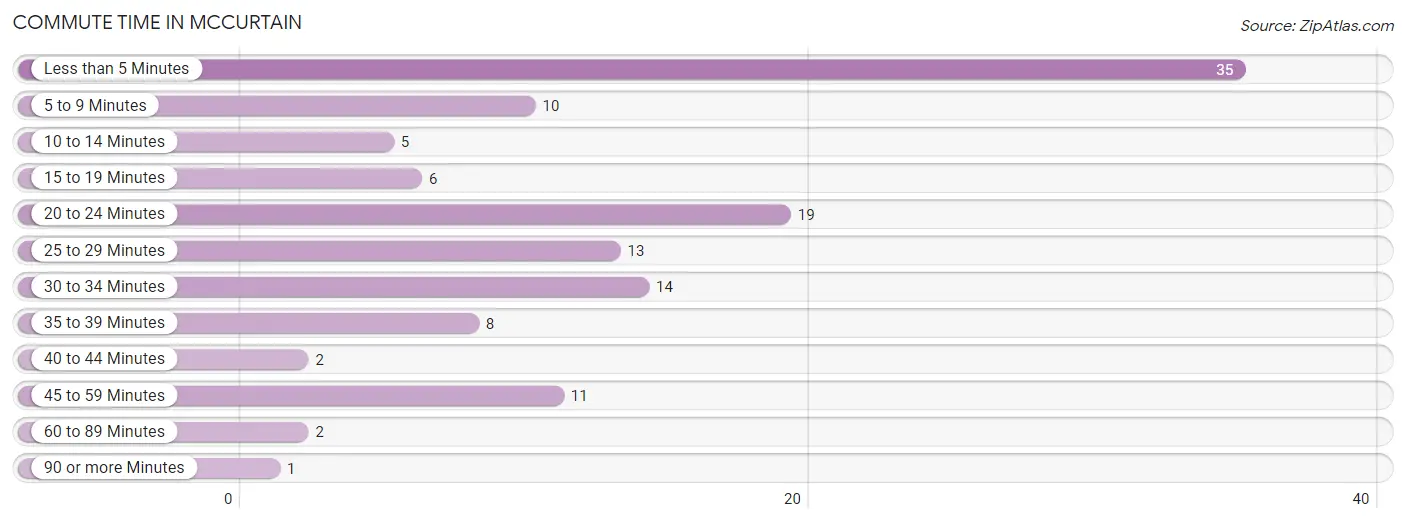
| Commute Time | # Commuters | % Commuters |
| Less than 5 Minutes | 35 | 27.8% |
| 5 to 9 Minutes | 10 | 7.9% |
| 10 to 14 Minutes | 5 | 4.0% |
| 15 to 19 Minutes | 6 | 4.8% |
| 20 to 24 Minutes | 19 | 15.1% |
| 25 to 29 Minutes | 13 | 10.3% |
| 30 to 34 Minutes | 14 | 11.1% |
| 35 to 39 Minutes | 8 | 6.4% |
| 40 to 44 Minutes | 2 | 1.6% |
| 45 to 59 Minutes | 11 | 8.7% |
| 60 to 89 Minutes | 2 | 1.6% |
| 90 or more Minutes | 1 | 0.8% |
Commute Time by Sex in Mccurtain
The most common commute times in Mccurtain are 30 to 34 minutes (11 commuters, 18.3%) for males and less than 5 minutes (31 commuters, 47.0%) for females.
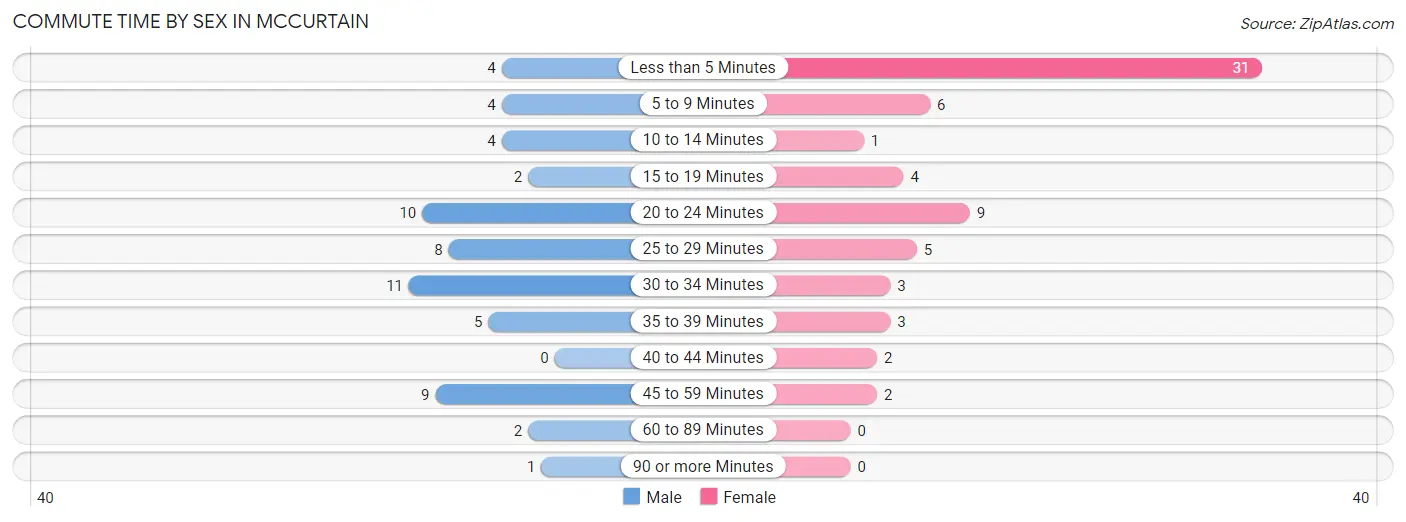
| Commute Time | Male | Female |
| Less than 5 Minutes | 4 (6.7%) | 31 (47.0%) |
| 5 to 9 Minutes | 4 (6.7%) | 6 (9.1%) |
| 10 to 14 Minutes | 4 (6.7%) | 1 (1.5%) |
| 15 to 19 Minutes | 2 (3.3%) | 4 (6.1%) |
| 20 to 24 Minutes | 10 (16.7%) | 9 (13.6%) |
| 25 to 29 Minutes | 8 (13.3%) | 5 (7.6%) |
| 30 to 34 Minutes | 11 (18.3%) | 3 (4.5%) |
| 35 to 39 Minutes | 5 (8.3%) | 3 (4.5%) |
| 40 to 44 Minutes | 0 (0.0%) | 2 (3.0%) |
| 45 to 59 Minutes | 9 (15.0%) | 2 (3.0%) |
| 60 to 89 Minutes | 2 (3.3%) | 0 (0.0%) |
| 90 or more Minutes | 1 (1.7%) | 0 (0.0%) |
Time of Departure to Work by Sex in Mccurtain
The most frequent times of departure to work in Mccurtain are 5:30 AM to 5:59 AM (13, 21.7%) for males and 9:00 AM to 9:59 AM (27, 40.9%) for females.
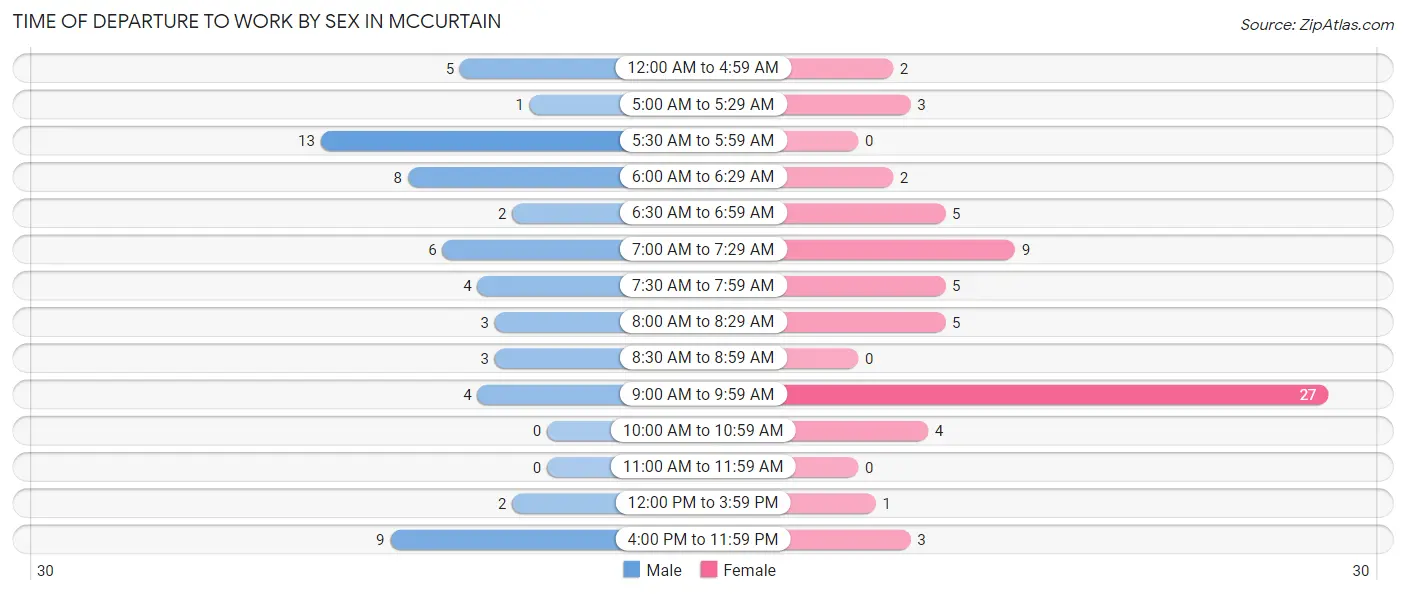
| Time of Departure | Male | Female |
| 12:00 AM to 4:59 AM | 5 (8.3%) | 2 (3.0%) |
| 5:00 AM to 5:29 AM | 1 (1.7%) | 3 (4.5%) |
| 5:30 AM to 5:59 AM | 13 (21.7%) | 0 (0.0%) |
| 6:00 AM to 6:29 AM | 8 (13.3%) | 2 (3.0%) |
| 6:30 AM to 6:59 AM | 2 (3.3%) | 5 (7.6%) |
| 7:00 AM to 7:29 AM | 6 (10.0%) | 9 (13.6%) |
| 7:30 AM to 7:59 AM | 4 (6.7%) | 5 (7.6%) |
| 8:00 AM to 8:29 AM | 3 (5.0%) | 5 (7.6%) |
| 8:30 AM to 8:59 AM | 3 (5.0%) | 0 (0.0%) |
| 9:00 AM to 9:59 AM | 4 (6.7%) | 27 (40.9%) |
| 10:00 AM to 10:59 AM | 0 (0.0%) | 4 (6.1%) |
| 11:00 AM to 11:59 AM | 0 (0.0%) | 0 (0.0%) |
| 12:00 PM to 3:59 PM | 2 (3.3%) | 1 (1.5%) |
| 4:00 PM to 11:59 PM | 9 (15.0%) | 3 (4.5%) |
| Total | 60 (100.0%) | 66 (100.0%) |
Housing Occupancy in Mccurtain
Occupancy by Ownership in Mccurtain
Of the total 204 dwellings in Mccurtain, owner-occupied units account for 171 (83.8%), while renter-occupied units make up 33 (16.2%).
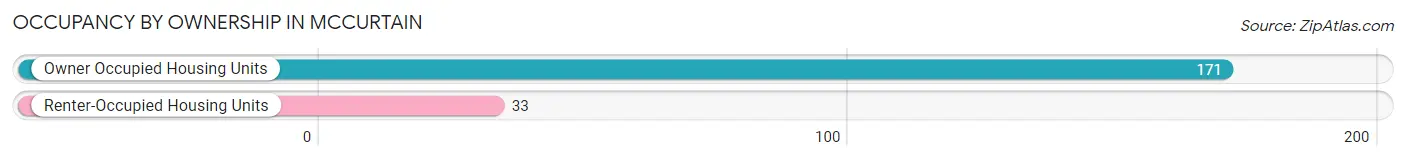
| Occupancy | # Housing Units | % Housing Units |
| Owner Occupied Housing Units | 171 | 83.8% |
| Renter-Occupied Housing Units | 33 | 16.2% |
| Total Occupied Housing Units | 204 | 100.0% |
Occupancy by Household Size in Mccurtain
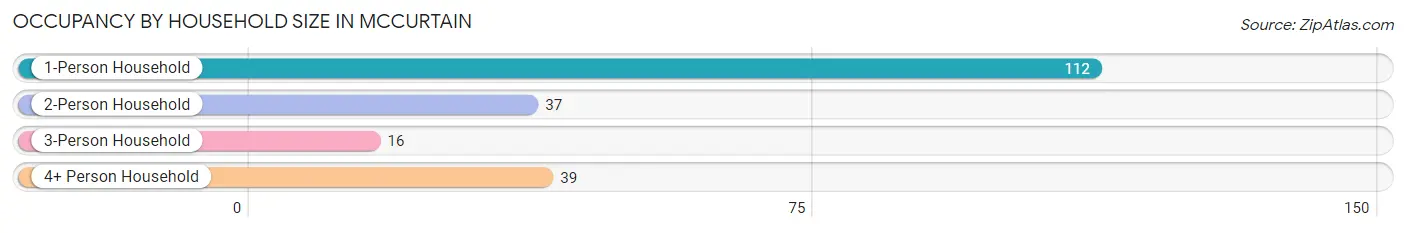
| Household Size | # Housing Units | % Housing Units |
| 1-Person Household | 112 | 54.9% |
| 2-Person Household | 37 | 18.1% |
| 3-Person Household | 16 | 7.8% |
| 4+ Person Household | 39 | 19.1% |
| Total Housing Units | 204 | 100.0% |
Occupancy by Ownership by Household Size in Mccurtain
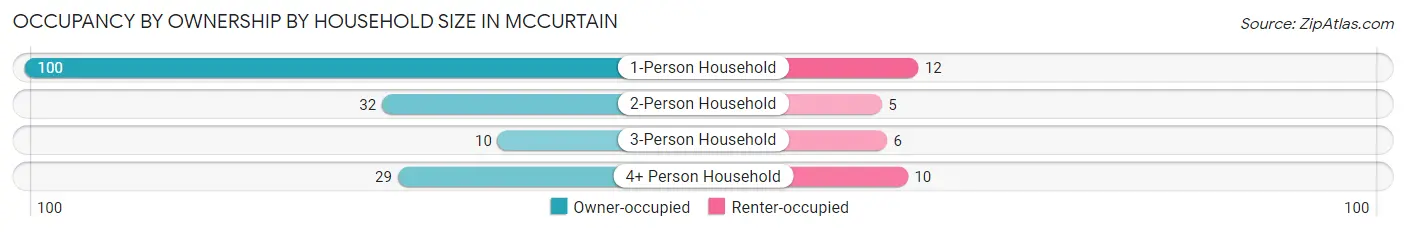
| Household Size | Owner-occupied | Renter-occupied |
| 1-Person Household | 100 (89.3%) | 12 (10.7%) |
| 2-Person Household | 32 (86.5%) | 5 (13.5%) |
| 3-Person Household | 10 (62.5%) | 6 (37.5%) |
| 4+ Person Household | 29 (74.4%) | 10 (25.6%) |
| Total Housing Units | 171 (83.8%) | 33 (16.2%) |
Occupancy by Educational Attainment in Mccurtain
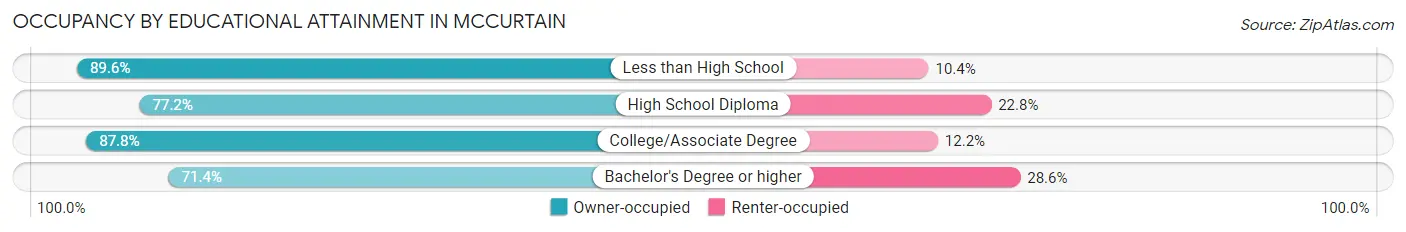
| Household Size | Owner-occupied | Renter-occupied |
| Less than High School | 69 (89.6%) | 8 (10.4%) |
| High School Diploma | 44 (77.2%) | 13 (22.8%) |
| College/Associate Degree | 43 (87.8%) | 6 (12.2%) |
| Bachelor's Degree or higher | 15 (71.4%) | 6 (28.6%) |
Occupancy by Age of Householder in Mccurtain
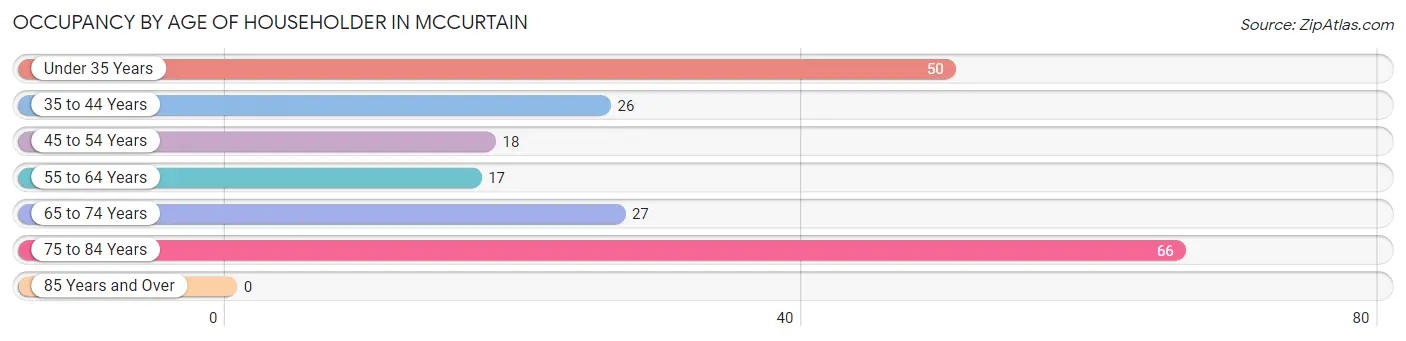
| Age Bracket | # Households | % Households |
| Under 35 Years | 50 | 24.5% |
| 35 to 44 Years | 26 | 12.8% |
| 45 to 54 Years | 18 | 8.8% |
| 55 to 64 Years | 17 | 8.3% |
| 65 to 74 Years | 27 | 13.2% |
| 75 to 84 Years | 66 | 32.4% |
| 85 Years and Over | 0 | 0.0% |
| Total | 204 | 100.0% |
Housing Finances in Mccurtain
Median Income by Occupancy in Mccurtain
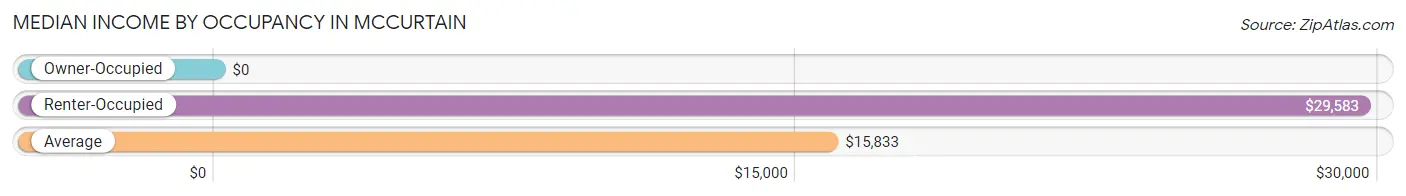
| Occupancy Type | # Households | Median Income |
| Owner-Occupied | 171 (83.8%) | $0 |
| Renter-Occupied | 33 (16.2%) | $29,583 |
| Average | 204 (100.0%) | $15,833 |
Occupancy by Householder Income Bracket in Mccurtain
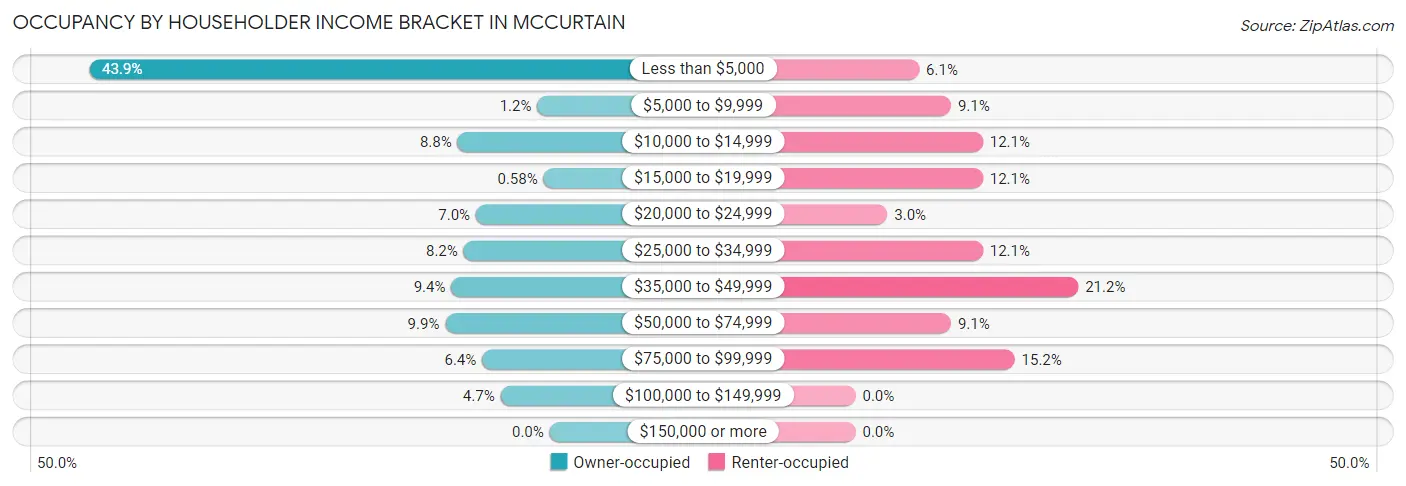
| Income Bracket | Owner-occupied | Renter-occupied |
| Less than $5,000 | 75 (43.9%) | 2 (6.1%) |
| $5,000 to $9,999 | 2 (1.2%) | 3 (9.1%) |
| $10,000 to $14,999 | 15 (8.8%) | 4 (12.1%) |
| $15,000 to $19,999 | 1 (0.6%) | 4 (12.1%) |
| $20,000 to $24,999 | 12 (7.0%) | 1 (3.0%) |
| $25,000 to $34,999 | 14 (8.2%) | 4 (12.1%) |
| $35,000 to $49,999 | 16 (9.4%) | 7 (21.2%) |
| $50,000 to $74,999 | 17 (9.9%) | 3 (9.1%) |
| $75,000 to $99,999 | 11 (6.4%) | 5 (15.1%) |
| $100,000 to $149,999 | 8 (4.7%) | 0 (0.0%) |
| $150,000 or more | 0 (0.0%) | 0 (0.0%) |
| Total | 171 (100.0%) | 33 (100.0%) |
Monthly Housing Cost Tiers in Mccurtain
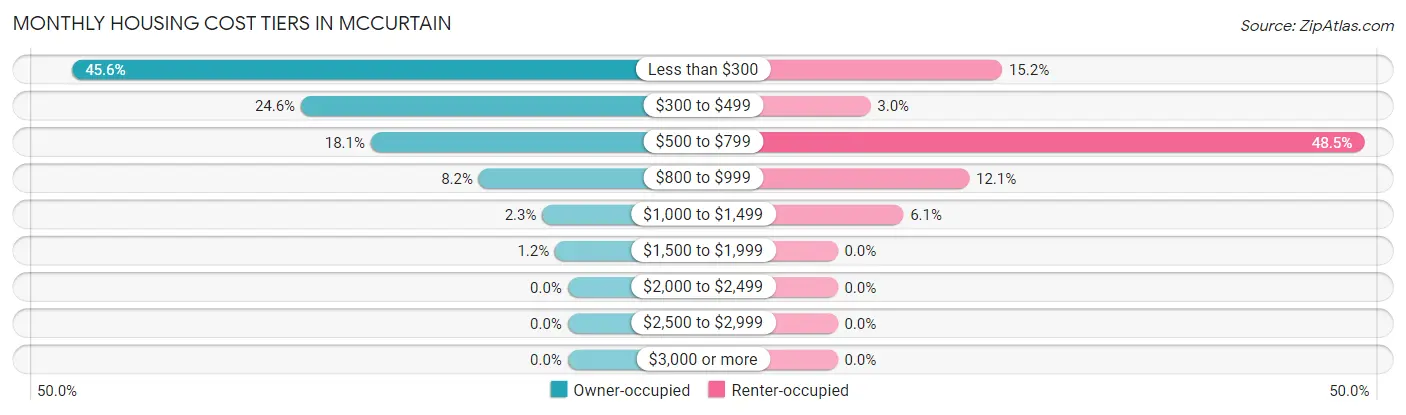
| Monthly Cost | Owner-occupied | Renter-occupied |
| Less than $300 | 78 (45.6%) | 5 (15.1%) |
| $300 to $499 | 42 (24.6%) | 1 (3.0%) |
| $500 to $799 | 31 (18.1%) | 16 (48.5%) |
| $800 to $999 | 14 (8.2%) | 4 (12.1%) |
| $1,000 to $1,499 | 4 (2.3%) | 2 (6.1%) |
| $1,500 to $1,999 | 2 (1.2%) | 0 (0.0%) |
| $2,000 to $2,499 | 0 (0.0%) | 0 (0.0%) |
| $2,500 to $2,999 | 0 (0.0%) | 0 (0.0%) |
| $3,000 or more | 0 (0.0%) | 0 (0.0%) |
| Total | 171 (100.0%) | 33 (100.0%) |
Physical Housing Characteristics in Mccurtain
Housing Structures in Mccurtain
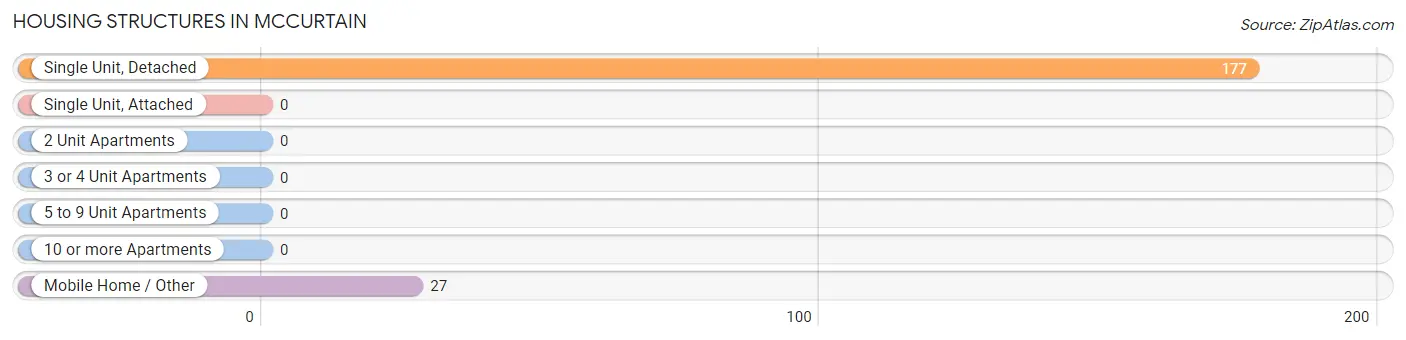
| Structure Type | # Housing Units | % Housing Units |
| Single Unit, Detached | 177 | 86.8% |
| Single Unit, Attached | 0 | 0.0% |
| 2 Unit Apartments | 0 | 0.0% |
| 3 or 4 Unit Apartments | 0 | 0.0% |
| 5 to 9 Unit Apartments | 0 | 0.0% |
| 10 or more Apartments | 0 | 0.0% |
| Mobile Home / Other | 27 | 13.2% |
| Total | 204 | 100.0% |
Housing Structures by Occupancy in Mccurtain
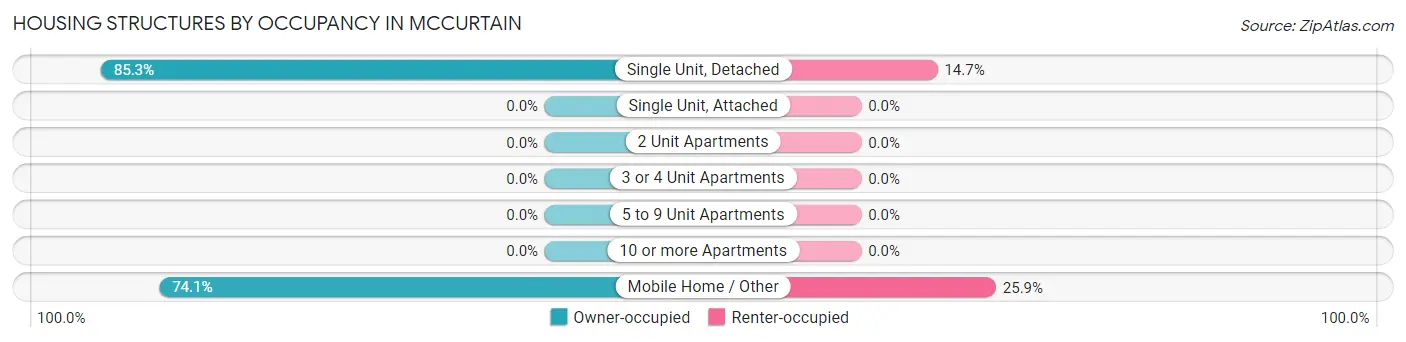
| Structure Type | Owner-occupied | Renter-occupied |
| Single Unit, Detached | 151 (85.3%) | 26 (14.7%) |
| Single Unit, Attached | 0 (0.0%) | 0 (0.0%) |
| 2 Unit Apartments | 0 (0.0%) | 0 (0.0%) |
| 3 or 4 Unit Apartments | 0 (0.0%) | 0 (0.0%) |
| 5 to 9 Unit Apartments | 0 (0.0%) | 0 (0.0%) |
| 10 or more Apartments | 0 (0.0%) | 0 (0.0%) |
| Mobile Home / Other | 20 (74.1%) | 7 (25.9%) |
| Total | 171 (83.8%) | 33 (16.2%) |
Housing Structures by Number of Rooms in Mccurtain
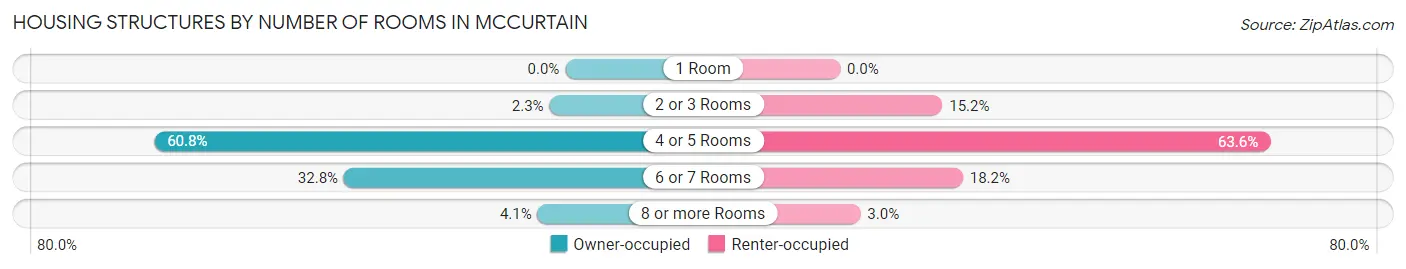
| Number of Rooms | Owner-occupied | Renter-occupied |
| 1 Room | 0 (0.0%) | 0 (0.0%) |
| 2 or 3 Rooms | 4 (2.3%) | 5 (15.1%) |
| 4 or 5 Rooms | 104 (60.8%) | 21 (63.6%) |
| 6 or 7 Rooms | 56 (32.8%) | 6 (18.2%) |
| 8 or more Rooms | 7 (4.1%) | 1 (3.0%) |
| Total | 171 (100.0%) | 33 (100.0%) |
Housing Structure by Heating Type in Mccurtain
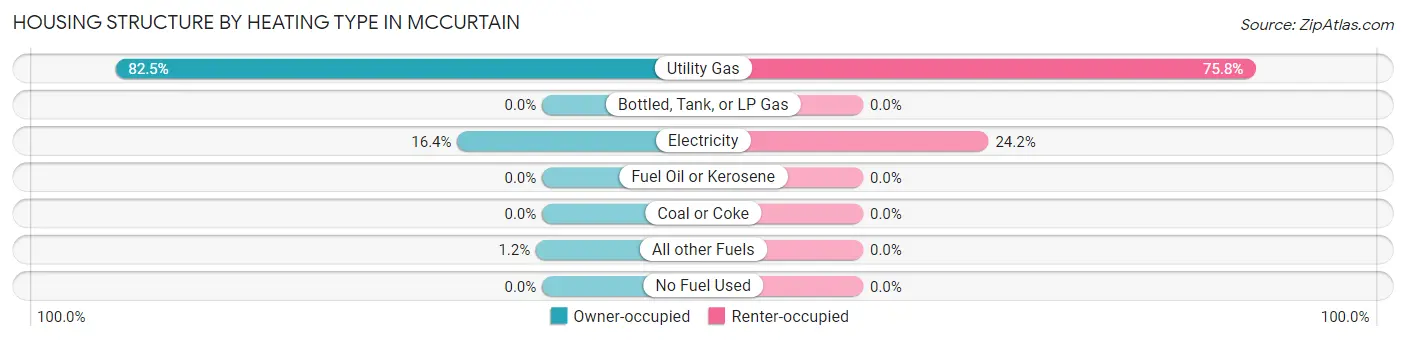
| Heating Type | Owner-occupied | Renter-occupied |
| Utility Gas | 141 (82.5%) | 25 (75.8%) |
| Bottled, Tank, or LP Gas | 0 (0.0%) | 0 (0.0%) |
| Electricity | 28 (16.4%) | 8 (24.2%) |
| Fuel Oil or Kerosene | 0 (0.0%) | 0 (0.0%) |
| Coal or Coke | 0 (0.0%) | 0 (0.0%) |
| All other Fuels | 2 (1.2%) | 0 (0.0%) |
| No Fuel Used | 0 (0.0%) | 0 (0.0%) |
| Total | 171 (100.0%) | 33 (100.0%) |
Household Vehicle Usage in Mccurtain
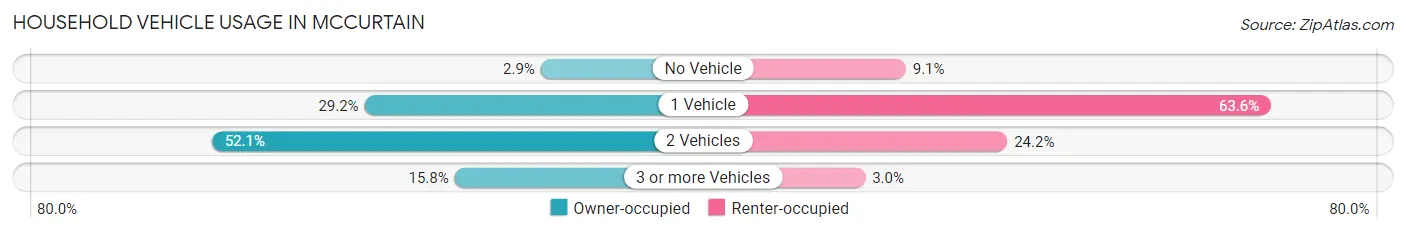
| Vehicles per Household | Owner-occupied | Renter-occupied |
| No Vehicle | 5 (2.9%) | 3 (9.1%) |
| 1 Vehicle | 50 (29.2%) | 21 (63.6%) |
| 2 Vehicles | 89 (52.0%) | 8 (24.2%) |
| 3 or more Vehicles | 27 (15.8%) | 1 (3.0%) |
| Total | 171 (100.0%) | 33 (100.0%) |
Real Estate & Mortgages in Mccurtain
Real Estate and Mortgage Overview in Mccurtain
| Characteristic | Without Mortgage | With Mortgage |
| Housing Units | 123 | 48 |
| Median Property Value | $47,900 | $0 |
| Median Household Income | - | - |
| Monthly Housing Costs | $233 | $0 |
| Real Estate Taxes | $199 | $1 |
Property Value by Mortgage Status in Mccurtain
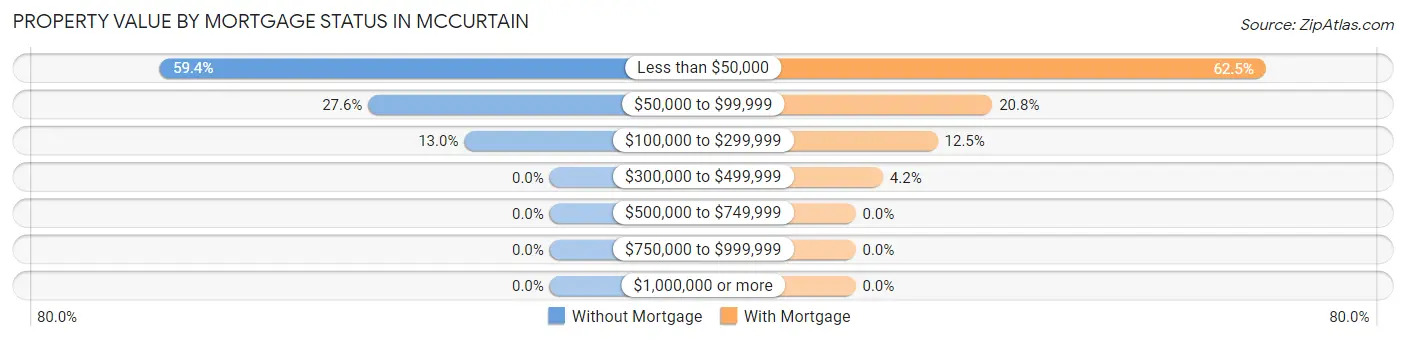
| Property Value | Without Mortgage | With Mortgage |
| Less than $50,000 | 73 (59.4%) | 30 (62.5%) |
| $50,000 to $99,999 | 34 (27.6%) | 10 (20.8%) |
| $100,000 to $299,999 | 16 (13.0%) | 6 (12.5%) |
| $300,000 to $499,999 | 0 (0.0%) | 2 (4.2%) |
| $500,000 to $749,999 | 0 (0.0%) | 0 (0.0%) |
| $750,000 to $999,999 | 0 (0.0%) | 0 (0.0%) |
| $1,000,000 or more | 0 (0.0%) | 0 (0.0%) |
| Total | 123 (100.0%) | 48 (100.0%) |
Household Income by Mortgage Status in Mccurtain
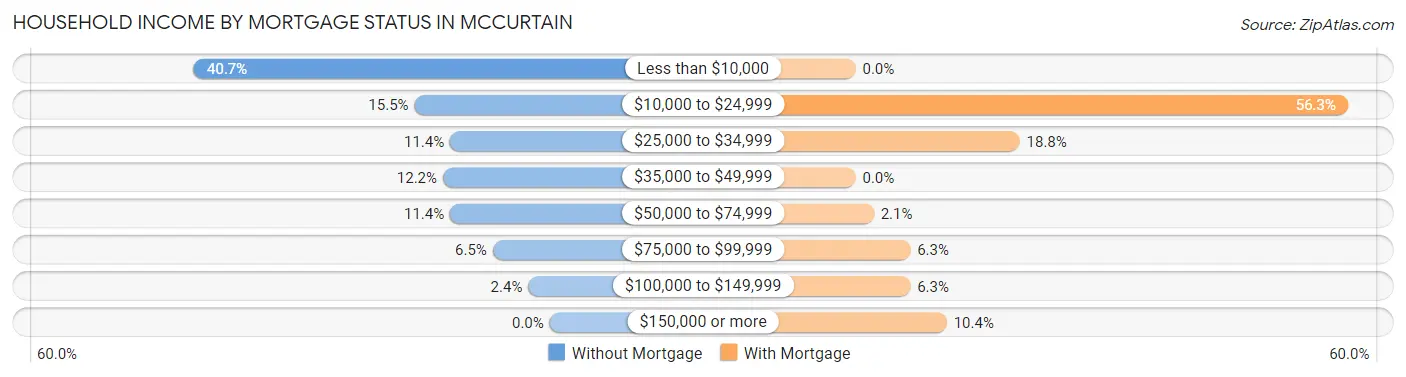
| Household Income | Without Mortgage | With Mortgage |
| Less than $10,000 | 50 (40.6%) | 0 (0.0%) |
| $10,000 to $24,999 | 19 (15.4%) | 27 (56.2%) |
| $25,000 to $34,999 | 14 (11.4%) | 9 (18.8%) |
| $35,000 to $49,999 | 15 (12.2%) | 0 (0.0%) |
| $50,000 to $74,999 | 14 (11.4%) | 1 (2.1%) |
| $75,000 to $99,999 | 8 (6.5%) | 3 (6.2%) |
| $100,000 to $149,999 | 3 (2.4%) | 3 (6.2%) |
| $150,000 or more | 0 (0.0%) | 5 (10.4%) |
| Total | 123 (100.0%) | 48 (100.0%) |
Property Value to Household Income Ratio in Mccurtain
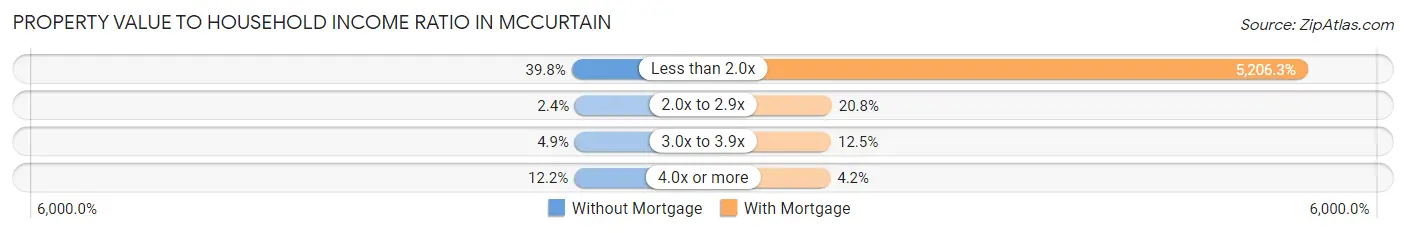
| Value-to-Income Ratio | Without Mortgage | With Mortgage |
| Less than 2.0x | 49 (39.8%) | 2,499 (5,206.2%) |
| 2.0x to 2.9x | 3 (2.4%) | 10 (20.8%) |
| 3.0x to 3.9x | 6 (4.9%) | 6 (12.5%) |
| 4.0x or more | 15 (12.2%) | 2 (4.2%) |
| Total | 123 (100.0%) | 48 (100.0%) |
Real Estate Taxes by Mortgage Status in Mccurtain
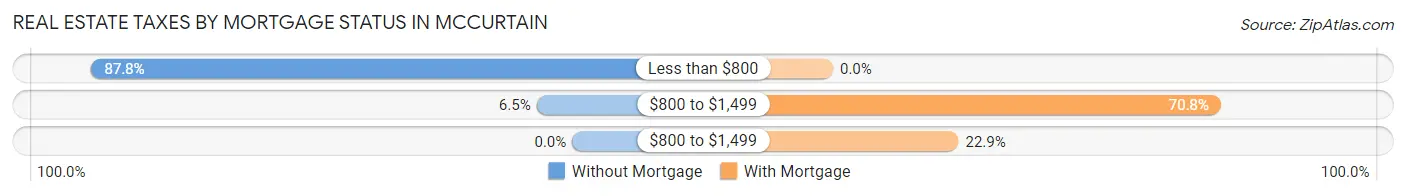
| Property Taxes | Without Mortgage | With Mortgage |
| Less than $800 | 108 (87.8%) | 0 (0.0%) |
| $800 to $1,499 | 8 (6.5%) | 34 (70.8%) |
| $800 to $1,499 | 0 (0.0%) | 11 (22.9%) |
| Total | 123 (100.0%) | 48 (100.0%) |
Health & Disability in Mccurtain
Health Insurance Coverage by Age in Mccurtain
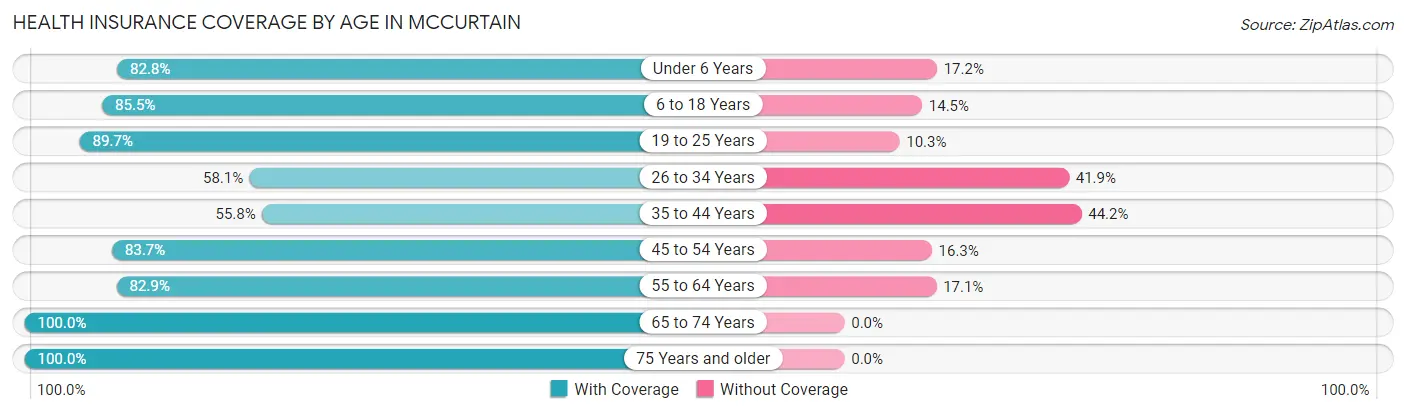
| Age Bracket | With Coverage | Without Coverage |
| Under 6 Years | 24 (82.8%) | 5 (17.2%) |
| 6 to 18 Years | 65 (85.5%) | 11 (14.5%) |
| 19 to 25 Years | 35 (89.7%) | 4 (10.3%) |
| 26 to 34 Years | 25 (58.1%) | 18 (41.9%) |
| 35 to 44 Years | 24 (55.8%) | 19 (44.2%) |
| 45 to 54 Years | 36 (83.7%) | 7 (16.3%) |
| 55 to 64 Years | 29 (82.9%) | 6 (17.1%) |
| 65 to 74 Years | 42 (100.0%) | 0 (0.0%) |
| 75 Years and older | 70 (100.0%) | 0 (0.0%) |
| Total | 350 (83.3%) | 70 (16.7%) |
Health Insurance Coverage by Citizenship Status in Mccurtain
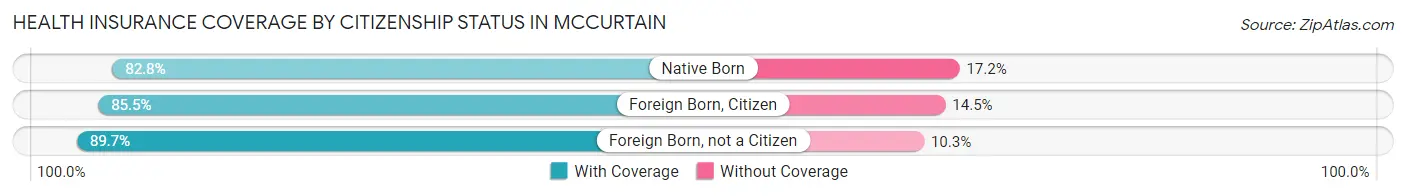
| Citizenship Status | With Coverage | Without Coverage |
| Native Born | 24 (82.8%) | 5 (17.2%) |
| Foreign Born, Citizen | 65 (85.5%) | 11 (14.5%) |
| Foreign Born, not a Citizen | 35 (89.7%) | 4 (10.3%) |
Health Insurance Coverage by Household Income in Mccurtain
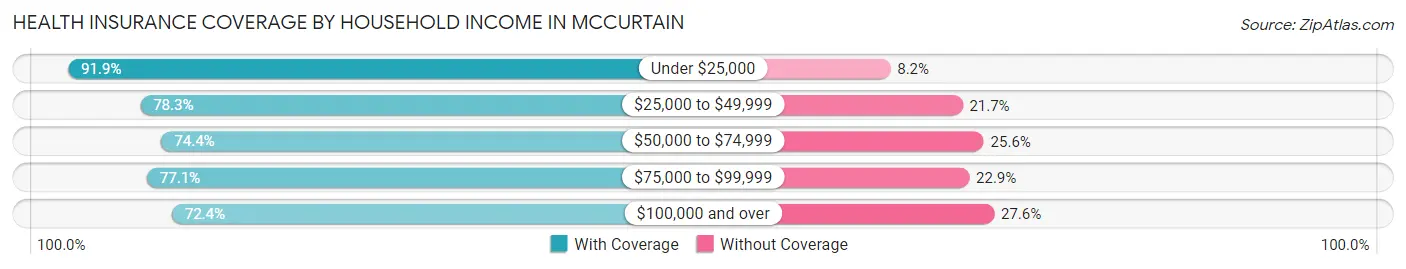
| Household Income | With Coverage | Without Coverage |
| Under $25,000 | 169 (91.8%) | 15 (8.2%) |
| $25,000 to $49,999 | 94 (78.3%) | 26 (21.7%) |
| $50,000 to $74,999 | 29 (74.4%) | 10 (25.6%) |
| $75,000 to $99,999 | 37 (77.1%) | 11 (22.9%) |
| $100,000 and over | 21 (72.4%) | 8 (27.6%) |
Public vs Private Health Insurance Coverage by Age in Mccurtain
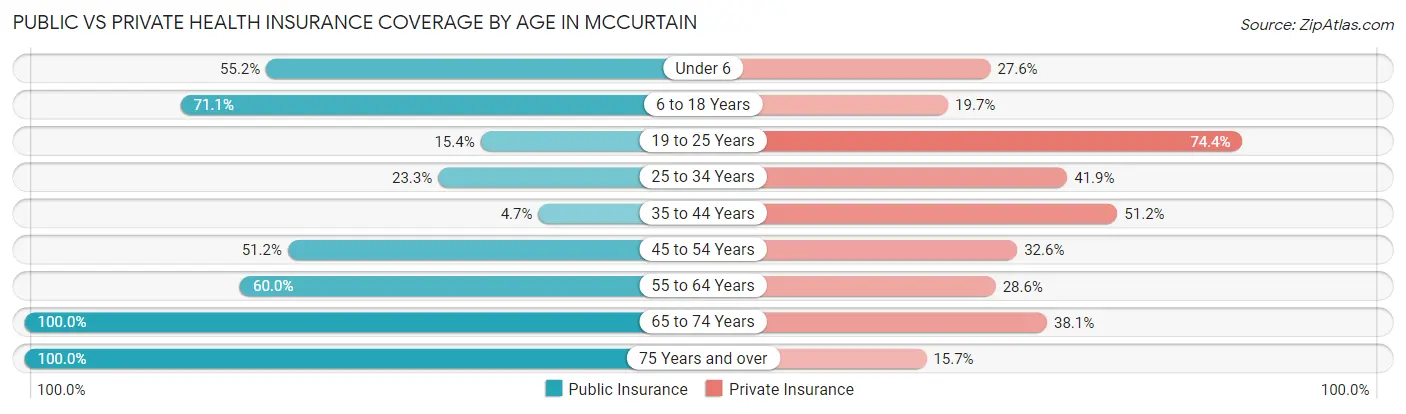
| Age Bracket | Public Insurance | Private Insurance |
| Under 6 | 16 (55.2%) | 8 (27.6%) |
| 6 to 18 Years | 54 (71.1%) | 15 (19.7%) |
| 19 to 25 Years | 6 (15.4%) | 29 (74.4%) |
| 25 to 34 Years | 10 (23.3%) | 18 (41.9%) |
| 35 to 44 Years | 2 (4.6%) | 22 (51.2%) |
| 45 to 54 Years | 22 (51.2%) | 14 (32.6%) |
| 55 to 64 Years | 21 (60.0%) | 10 (28.6%) |
| 65 to 74 Years | 42 (100.0%) | 16 (38.1%) |
| 75 Years and over | 70 (100.0%) | 11 (15.7%) |
| Total | 243 (57.9%) | 143 (34.1%) |
Disability Status by Sex by Age in Mccurtain
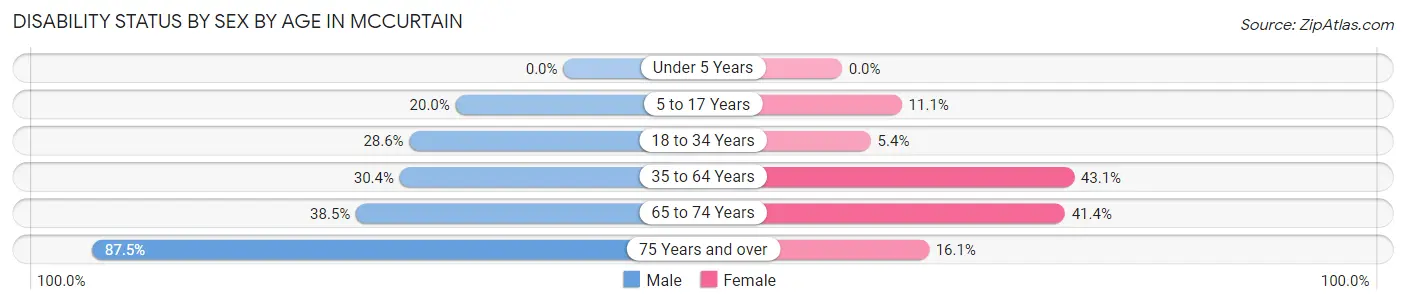
| Age Bracket | Male | Female |
| Under 5 Years | 0 (0.0%) | 0 (0.0%) |
| 5 to 17 Years | 8 (20.0%) | 4 (11.1%) |
| 18 to 34 Years | 8 (28.6%) | 3 (5.4%) |
| 35 to 64 Years | 17 (30.4%) | 28 (43.1%) |
| 65 to 74 Years | 5 (38.5%) | 12 (41.4%) |
| 75 Years and over | 7 (87.5%) | 10 (16.1%) |
Disability Class by Sex by Age in Mccurtain
Disability Class: Hearing Difficulty
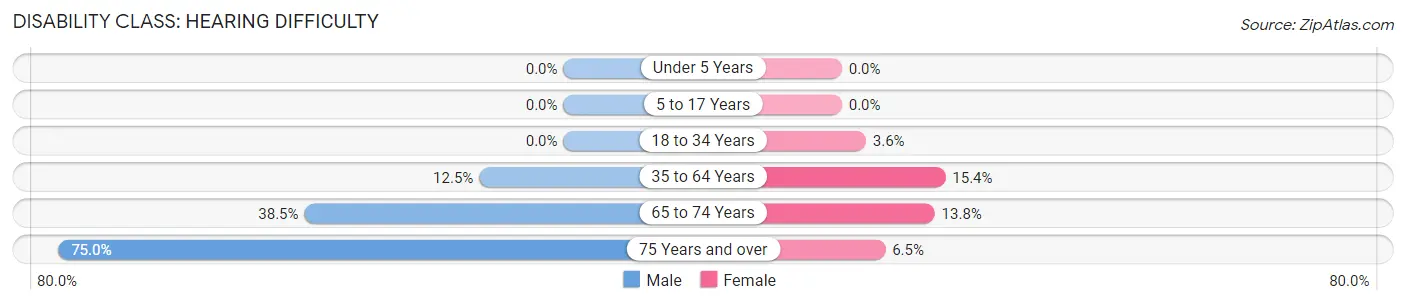
| Age Bracket | Male | Female |
| Under 5 Years | 0 (0.0%) | 0 (0.0%) |
| 5 to 17 Years | 0 (0.0%) | 0 (0.0%) |
| 18 to 34 Years | 0 (0.0%) | 2 (3.6%) |
| 35 to 64 Years | 7 (12.5%) | 10 (15.4%) |
| 65 to 74 Years | 5 (38.5%) | 4 (13.8%) |
| 75 Years and over | 6 (75.0%) | 4 (6.5%) |
Disability Class: Vision Difficulty
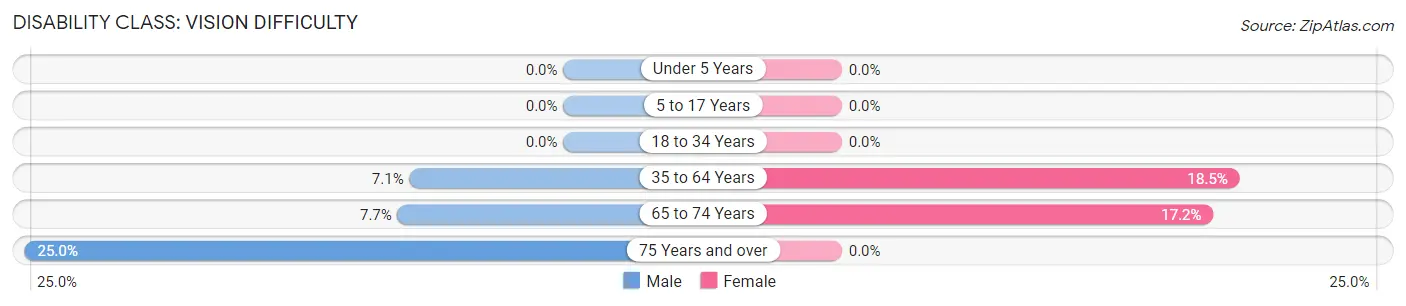
| Age Bracket | Male | Female |
| Under 5 Years | 0 (0.0%) | 0 (0.0%) |
| 5 to 17 Years | 0 (0.0%) | 0 (0.0%) |
| 18 to 34 Years | 0 (0.0%) | 0 (0.0%) |
| 35 to 64 Years | 4 (7.1%) | 12 (18.5%) |
| 65 to 74 Years | 1 (7.7%) | 5 (17.2%) |
| 75 Years and over | 2 (25.0%) | 0 (0.0%) |
Disability Class: Cognitive Difficulty
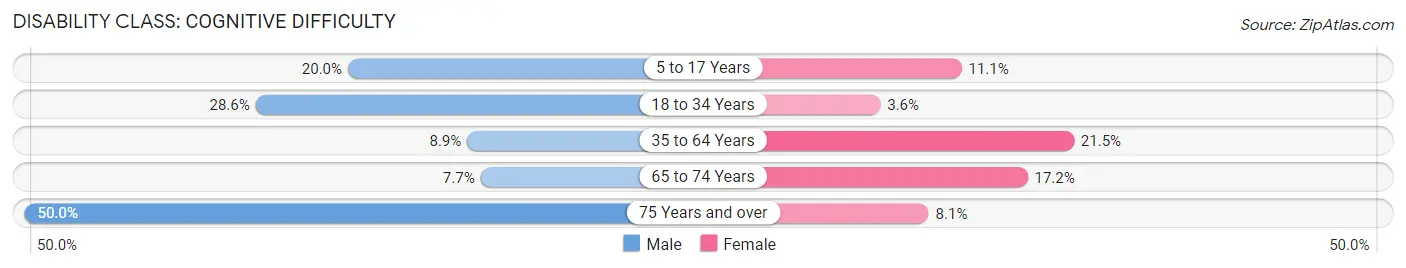
| Age Bracket | Male | Female |
| 5 to 17 Years | 8 (20.0%) | 4 (11.1%) |
| 18 to 34 Years | 8 (28.6%) | 2 (3.6%) |
| 35 to 64 Years | 5 (8.9%) | 14 (21.5%) |
| 65 to 74 Years | 1 (7.7%) | 5 (17.2%) |
| 75 Years and over | 4 (50.0%) | 5 (8.1%) |
Disability Class: Ambulatory Difficulty
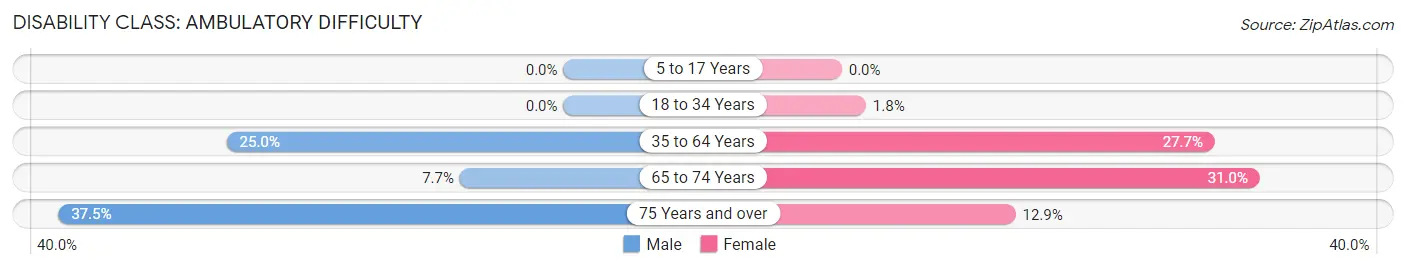
| Age Bracket | Male | Female |
| 5 to 17 Years | 0 (0.0%) | 0 (0.0%) |
| 18 to 34 Years | 0 (0.0%) | 1 (1.8%) |
| 35 to 64 Years | 14 (25.0%) | 18 (27.7%) |
| 65 to 74 Years | 1 (7.7%) | 9 (31.0%) |
| 75 Years and over | 3 (37.5%) | 8 (12.9%) |
Disability Class: Self-Care Difficulty
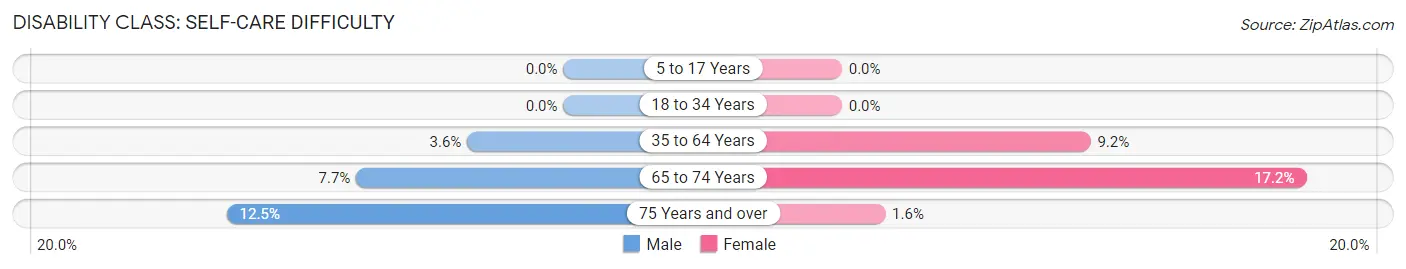
| Age Bracket | Male | Female |
| 5 to 17 Years | 0 (0.0%) | 0 (0.0%) |
| 18 to 34 Years | 0 (0.0%) | 0 (0.0%) |
| 35 to 64 Years | 2 (3.6%) | 6 (9.2%) |
| 65 to 74 Years | 1 (7.7%) | 5 (17.2%) |
| 75 Years and over | 1 (12.5%) | 1 (1.6%) |
Technology Access in Mccurtain
Computing Device Access in Mccurtain
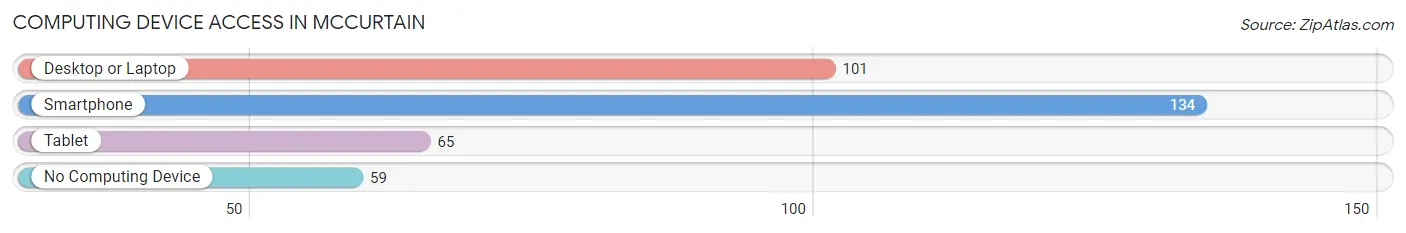
| Device Type | # Households | % Households |
| Desktop or Laptop | 101 | 49.5% |
| Smartphone | 134 | 65.7% |
| Tablet | 65 | 31.9% |
| No Computing Device | 59 | 28.9% |
| Total | 204 | 100.0% |
Internet Access in Mccurtain
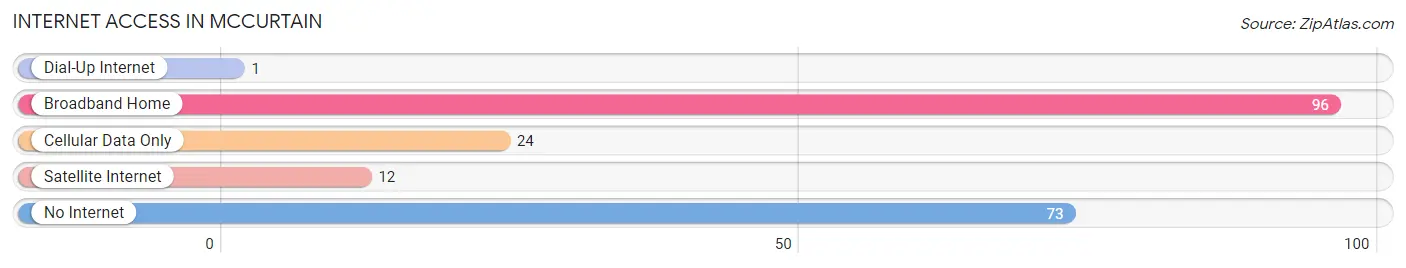
| Internet Type | # Households | % Households |
| Dial-Up Internet | 1 | 0.5% |
| Broadband Home | 96 | 47.1% |
| Cellular Data Only | 24 | 11.8% |
| Satellite Internet | 12 | 5.9% |
| No Internet | 73 | 35.8% |
| Total | 204 | 100.0% |
Mccurtain Summary
Mccurtain is a small town located in the southeastern corner of Oklahoma, near the Arkansas and Texas borders. It is the county seat of McCurtain County, and is part of the Idabel Micropolitan Statistical Area. The town was named after the McCurtain family, who were prominent Choctaw leaders in the late 19th century.
Geography
Mccurtain is located at the intersection of U.S. Highway 70 and State Highway 3, about 10 miles east of Idabel. The town is situated in a valley surrounded by the Ouachita Mountains. The area is known for its rolling hills, dense forests, and abundant wildlife. The town is located in a humid subtropical climate zone, with hot summers and mild winters.
Economy
Mccurtain’s economy is largely based on agriculture and timber production. The town is home to several large farms, as well as a number of small family-owned farms. The timber industry is also an important part of the local economy, with several sawmills and wood-processing plants located in the area.
In addition to agriculture and timber, Mccurtain is home to a variety of small businesses, including restaurants, retail stores, and service providers. The town is also home to a number of manufacturing plants, including a paper mill and a furniture factory.
Demographics
As of the 2010 census, Mccurtain had a population of 1,845. The racial makeup of the town was 79.3% White, 17.2% Native American, 0.7% African American, 0.3% Asian, and 2.5% from other races. The median household income was $25,972, and the median family income was $31,250.
The town is home to a large Native American population, with the Choctaw Nation of Oklahoma having a significant presence in the area. The town is also home to a number of churches, including Baptist, Methodist, and Pentecostal congregations.
Conclusion
Mccurtain is a small town located in the southeastern corner of Oklahoma, near the Arkansas and Texas borders. It is the county seat of McCurtain County, and is part of the Idabel Micropolitan Statistical Area. The town’s economy is largely based on agriculture and timber production, and it is home to a large Native American population. The town is also home to a variety of small businesses, churches, and manufacturing plants.
Common Questions
What is the Total Population of Mccurtain?
Total Population of Mccurtain is 420.
What is the Total Male Population of Mccurtain?
Total Male Population of Mccurtain is 161.
What is the Total Female Population of Mccurtain?
Total Female Population of Mccurtain is 259.
What is the Ratio of Males per 100 Females in Mccurtain?
There are 62.16 Males per 100 Females in Mccurtain.
What is the Ratio of Females per 100 Males in Mccurtain?
There are 160.87 Females per 100 Males in Mccurtain.
What is the Median Population Age in Mccurtain?
Median Population Age in Mccurtain is 39.7 Years.
What is the Average Family Size in Mccurtain
Average Family Size in Mccurtain is 3.3 People.
What is the Average Household Size in Mccurtain
Average Household Size in Mccurtain is 2.1 People.
What is Per Capita Income in Mccurtain?
Per Capita income in Mccurtain is $14,254.
What is the Median Family Income in Mccurtain?
Median Family Income in Mccurtain is $38,750.
What is the Median Household income in Mccurtain?
Median Household Income in Mccurtain is $15,833.
What is Inequality or Gini Index in Mccurtain?
Inequality or Gini Index in Mccurtain is 0.61.
How Large is the Labor Force in Mccurtain?
There are 145 People in the Labor Forcein in Mccurtain.
What is the Percentage of People in the Labor Force in Mccurtain?
43.3% of People are in the Labor Force in Mccurtain.
What is the Unemployment Rate in Mccurtain?
Unemployment Rate in Mccurtain is 4.8%.