Maysville, OK
Maysville Map
Maysville Overview
1,479
TOTAL POPULATION
626
MALE POPULATION
853
FEMALE POPULATION
73.39
MALES / 100 FEMALES
136.26
FEMALES / 100 MALES
40.7
MEDIAN AGE
2.3
AVG FAMILY SIZE
2.4
AVG HOUSEHOLD SIZE
$26,662
PER CAPITA INCOME
$56,508
AVG FAMILY INCOME
$56,344
AVG HOUSEHOLD INCOME
44.7%
WAGE / INCOME GAP [ % ]
55.3¢/ $1
WAGE / INCOME GAP [ $ ]
$16,818
FAMILY INCOME DEFICIT
0.35
INEQUALITY / GINI INDEX
543
LABOR FORCE [ PEOPLE ]
46.0%
PERCENT IN LABOR FORCE
0.7%
UNEMPLOYMENT RATE
Maysville Zip Codes
Maysville Area Codes
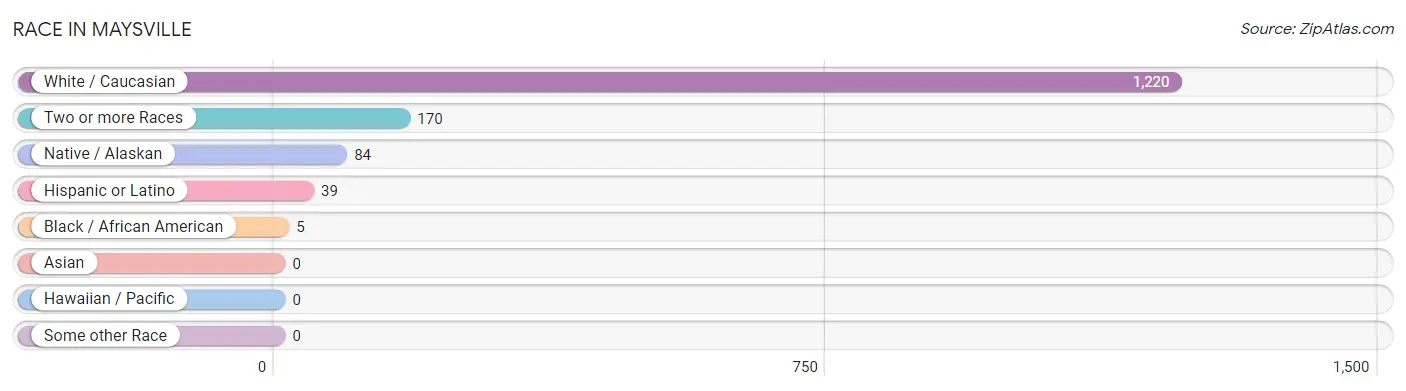
Race in Maysville
The most populous races in Maysville are White / Caucasian (1,220 | 82.5%), Two or more Races (170 | 11.5%), and Native / Alaskan (84 | 5.7%).
| Race | # Population | % Population |
| Asian | 0 | 0.0% |
| Black / African American | 5 | 0.3% |
| Hawaiian / Pacific | 0 | 0.0% |
| Hispanic or Latino | 39 | 2.6% |
| Native / Alaskan | 84 | 5.7% |
| White / Caucasian | 1,220 | 82.5% |
| Two or more Races | 170 | 11.5% |
| Some other Race | 0 | 0.0% |
| Total | 1,479 | 100.0% |
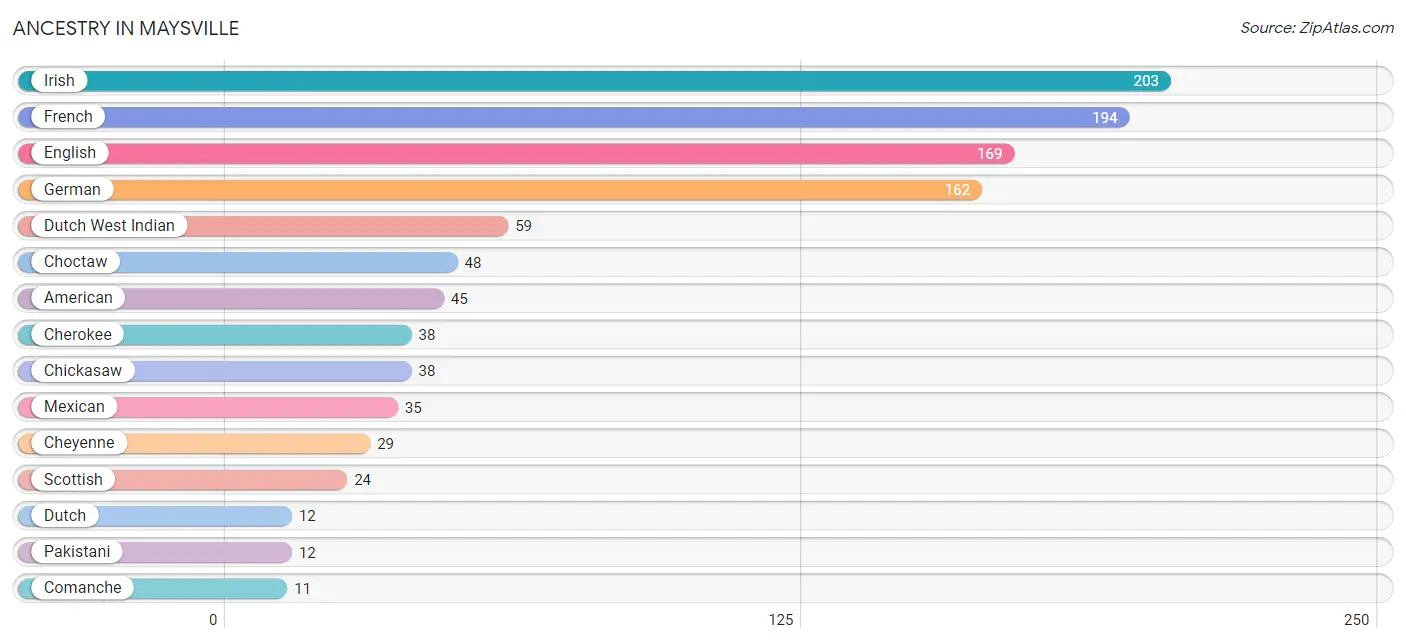
Ancestry in Maysville
The most populous ancestries reported in Maysville are Irish (203 | 13.7%), French (194 | 13.1%), English (169 | 11.4%), German (162 | 11.0%), and Dutch West Indian (59 | 4.0%), together accounting for 53.2% of all Maysville residents.
| Ancestry | # Population | % Population |
| American | 45 | 3.0% |
| Apache | 2 | 0.1% |
| Blackfeet | 2 | 0.1% |
| British | 3 | 0.2% |
| Cherokee | 38 | 2.6% |
| Cheyenne | 29 | 2.0% |
| Chickasaw | 38 | 2.6% |
| Choctaw | 48 | 3.3% |
| Comanche | 11 | 0.7% |
| Czechoslovakian | 5 | 0.3% |
| Dutch | 12 | 0.8% |
| Dutch West Indian | 59 | 4.0% |
| English | 169 | 11.4% |
| European | 8 | 0.5% |
| French | 194 | 13.1% |
| German | 162 | 11.0% |
| German Russian | 1 | 0.1% |
| Hungarian | 9 | 0.6% |
| Irish | 203 | 13.7% |
| Mexican | 35 | 2.4% |
| Pakistani | 12 | 0.8% |
| Potawatomi | 3 | 0.2% |
| Puerto Rican | 3 | 0.2% |
| Scotch-Irish | 2 | 0.1% |
| Scottish | 24 | 1.6% |
| Spaniard | 1 | 0.1% |
| Swedish | 3 | 0.2% |
| Welsh | 1 | 0.1% | View All 28 Rows |
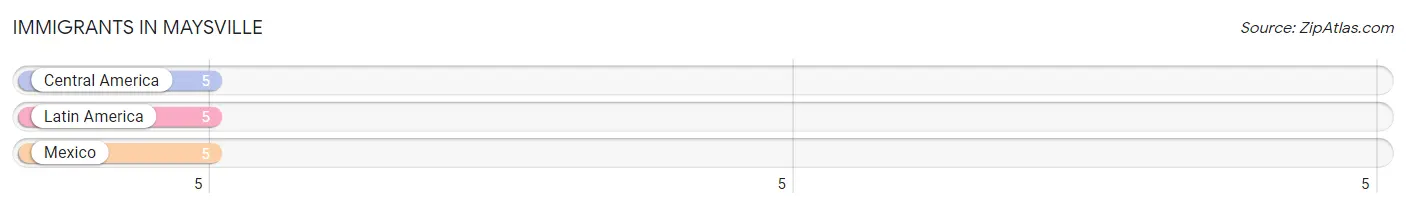
Immigrants in Maysville
The most numerous immigrant groups reported in Maysville came from Central America (5 | 0.3%), Latin America (5 | 0.3%), and Mexico (5 | 0.3%), together accounting for 1.0% of all Maysville residents.
| Immigration Origin | # Population | % Population |
| Central America | 5 | 0.3% |
| Latin America | 5 | 0.3% |
| Mexico | 5 | 0.3% | View All 3 Rows |
Sex and Age in Maysville
Sex and Age in Maysville
The most populous age groups in Maysville are 35 to 39 Years (89 | 14.2%) for men and 75 to 79 Years (183 | 21.4%) for women.
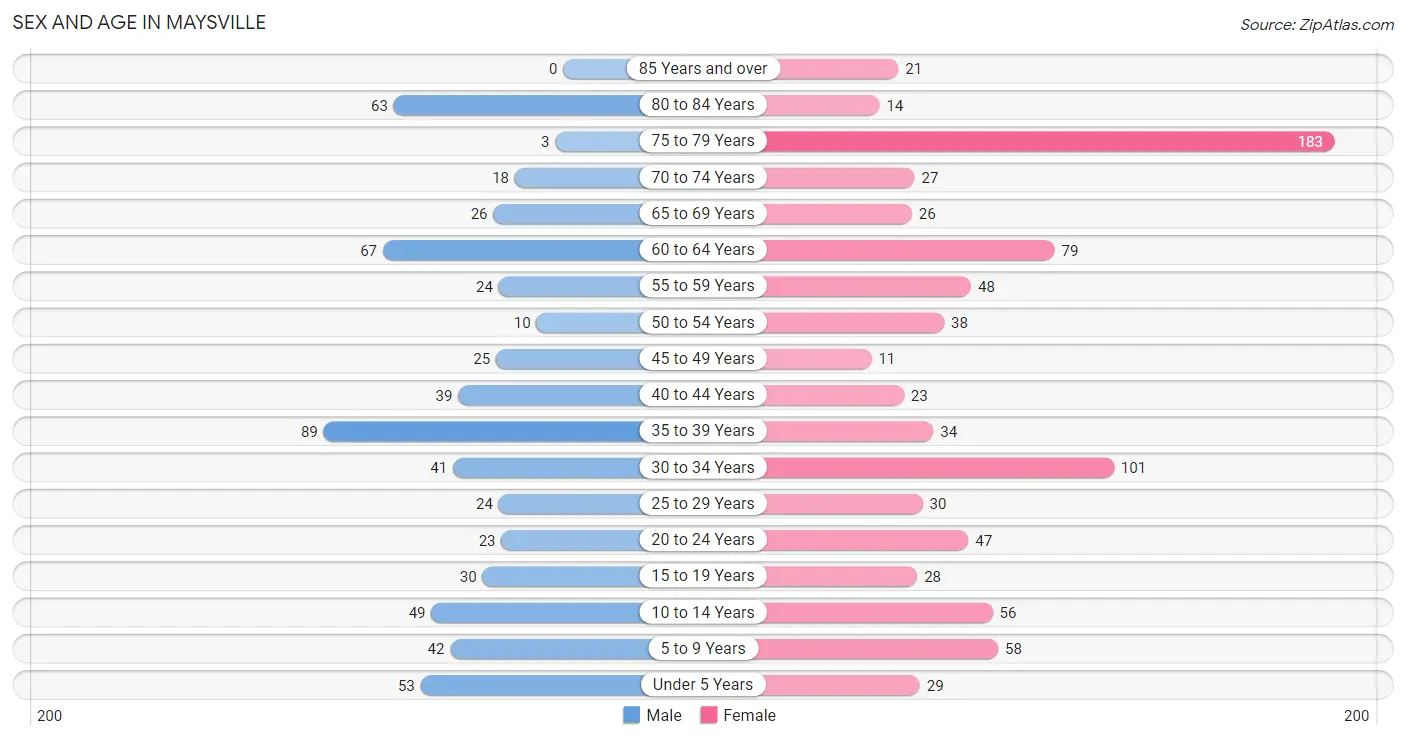
| Age Bracket | Male | Female |
| Under 5 Years | 53 (8.5%) | 29 (3.4%) |
| 5 to 9 Years | 42 (6.7%) | 58 (6.8%) |
| 10 to 14 Years | 49 (7.8%) | 56 (6.6%) |
| 15 to 19 Years | 30 (4.8%) | 28 (3.3%) |
| 20 to 24 Years | 23 (3.7%) | 47 (5.5%) |
| 25 to 29 Years | 24 (3.8%) | 30 (3.5%) |
| 30 to 34 Years | 41 (6.6%) | 101 (11.8%) |
| 35 to 39 Years | 89 (14.2%) | 34 (4.0%) |
| 40 to 44 Years | 39 (6.2%) | 23 (2.7%) |
| 45 to 49 Years | 25 (4.0%) | 11 (1.3%) |
| 50 to 54 Years | 10 (1.6%) | 38 (4.4%) |
| 55 to 59 Years | 24 (3.8%) | 48 (5.6%) |
| 60 to 64 Years | 67 (10.7%) | 79 (9.3%) |
| 65 to 69 Years | 26 (4.2%) | 26 (3.0%) |
| 70 to 74 Years | 18 (2.9%) | 27 (3.2%) |
| 75 to 79 Years | 3 (0.5%) | 183 (21.4%) |
| 80 to 84 Years | 63 (10.1%) | 14 (1.6%) |
| 85 Years and over | 0 (0.0%) | 21 (2.5%) |
| Total | 626 (100.0%) | 853 (100.0%) |
Families and Households in Maysville
Median Family Size in Maysville
The median family size in Maysville is 2.29 persons per family, with single female/mother families (107 | 20.6%) accounting for the largest median family size of 2.94 persons per family. On the other hand, married-couple families (379 | 72.9%) represent the smallest median family size with 2.08 persons per family.
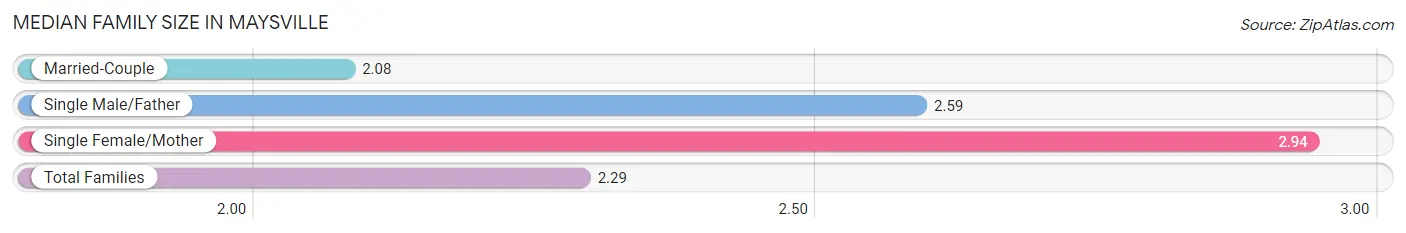
| Family Type | # Families | Family Size |
| Married-Couple | 379 (72.9%) | 2.08 |
| Single Male/Father | 34 (6.5%) | 2.59 |
| Single Female/Mother | 107 (20.6%) | 2.94 |
| Total Families | 520 (100.0%) | 2.29 |
Median Household Size in Maysville
The median household size in Maysville is 2.36 persons per household, with single female/mother households (107 | 17.0%) accounting for the largest median household size of 3.65 persons per household. non-family households (108 | 17.2%) represent the smallest median household size with 1.66 persons per household.
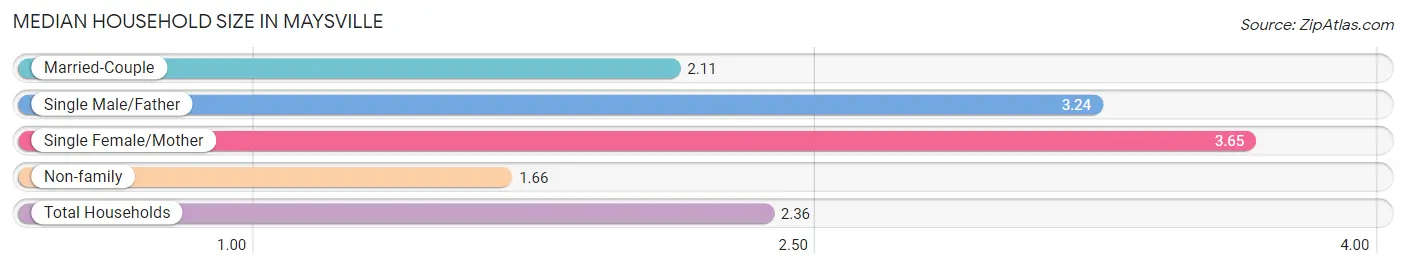
| Household Type | # Households | Household Size |
| Married-Couple | 379 (60.4%) | 2.11 |
| Single Male/Father | 34 (5.4%) | 3.24 |
| Single Female/Mother | 107 (17.0%) | 3.65 |
| Non-family | 108 (17.2%) | 1.66 |
| Total Households | 628 (100.0%) | 2.36 |
Household Size by Marriage Status in Maysville
Out of a total of 628 households in Maysville, 520 (82.8%) are family households, while 108 (17.2%) are nonfamily households. The most numerous type of family households are 2-person households, comprising 357, and the most common type of nonfamily households are 1-person households, comprising 70.
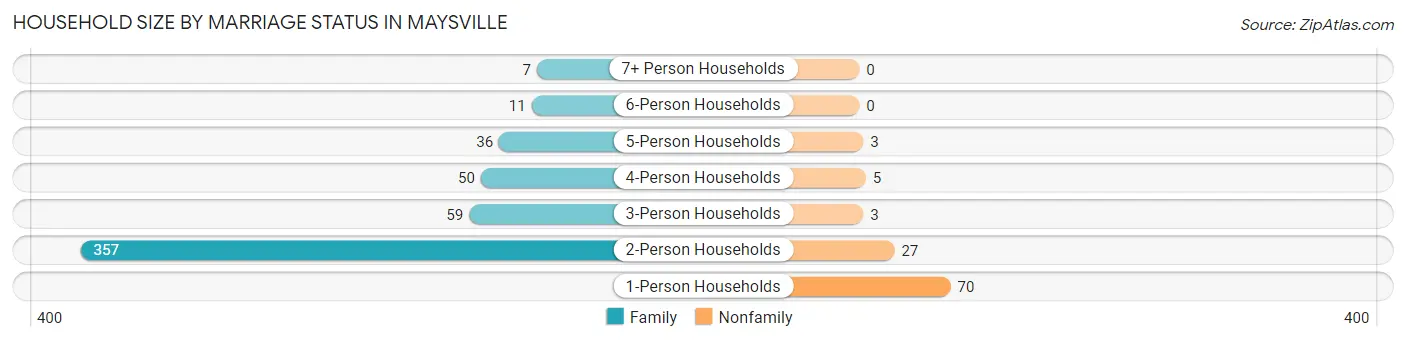
| Household Size | Family Households | Nonfamily Households |
| 1-Person Households | - | 70 (11.2%) |
| 2-Person Households | 357 (56.9%) | 27 (4.3%) |
| 3-Person Households | 59 (9.4%) | 3 (0.5%) |
| 4-Person Households | 50 (8.0%) | 5 (0.8%) |
| 5-Person Households | 36 (5.7%) | 3 (0.5%) |
| 6-Person Households | 11 (1.8%) | 0 (0.0%) |
| 7+ Person Households | 7 (1.1%) | 0 (0.0%) |
| Total | 520 (82.8%) | 108 (17.2%) |
Female Fertility in Maysville
Fertility by Age in Maysville
Average fertility rate in Maysville is 112.0 births per 1,000 women. Women in the age bracket of 20 to 34 years have the highest fertility rate with 135.0 births per 1,000 women. Women in the age bracket of 20 to 34 years acount for 77.4% of all women with births.
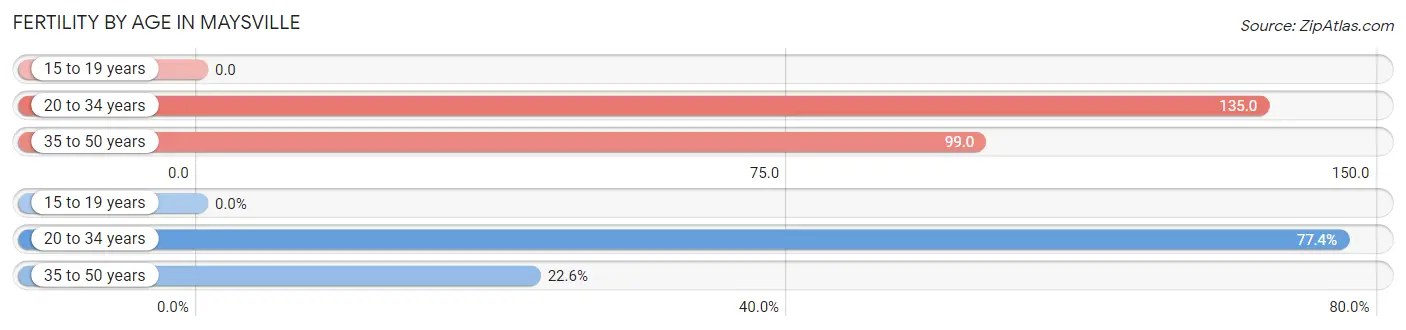
| Age Bracket | Women with Births | Births / 1,000 Women |
| 15 to 19 years | 0 (0.0%) | 0.0 |
| 20 to 34 years | 24 (77.4%) | 135.0 |
| 35 to 50 years | 7 (22.6%) | 99.0 |
| Total | 31 (100.0%) | 112.0 |
Fertility by Age by Marriage Status in Maysville
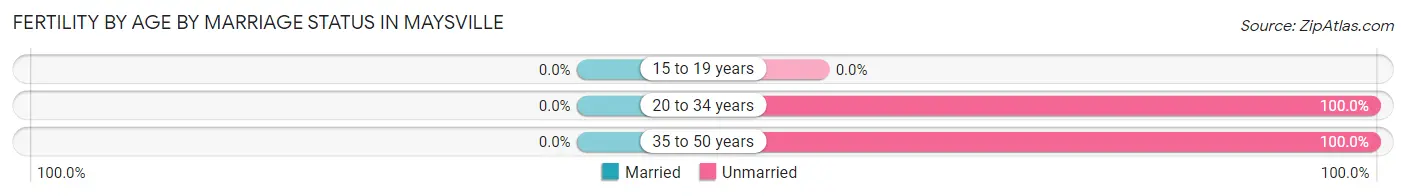
| Age Bracket | Married | Unmarried |
| 15 to 19 years | 0 (0.0%) | 0 (0.0%) |
| 20 to 34 years | 0 (0.0%) | 24 (100.0%) |
| 35 to 50 years | 0 (0.0%) | 7 (100.0%) |
| Total | 0 (0.0%) | 31 (100.0%) |
Fertility by Education in Maysville
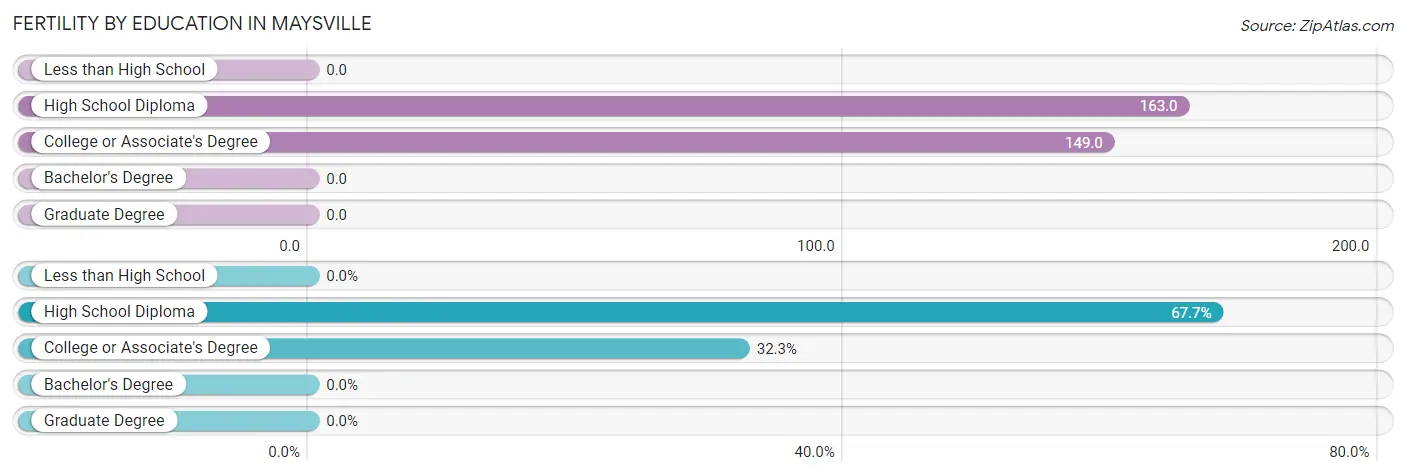
| Educational Attainment | Women with Births | Births / 1,000 Women |
| Less than High School | 0 (0.0%) | 0.0 |
| High School Diploma | 21 (67.7%) | 163.0 |
| College or Associate's Degree | 10 (32.3%) | 149.0 |
| Bachelor's Degree | 0 (0.0%) | 0.0 |
| Graduate Degree | 0 (0.0%) | 0.0 |
| Total | 31 (100.0%) | 112.0 |
Fertility by Education by Marriage Status in Maysville
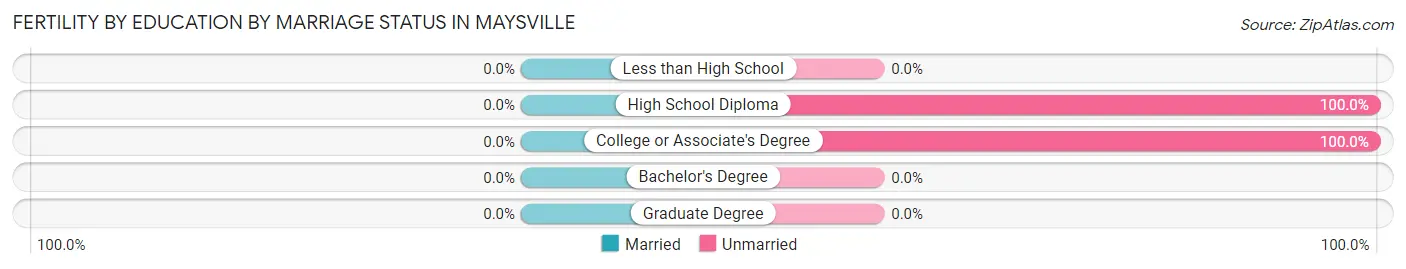
| Educational Attainment | Married | Unmarried |
| Less than High School | 0 (0.0%) | 0 (0.0%) |
| High School Diploma | 0 (0.0%) | 21 (100.0%) |
| College or Associate's Degree | 0 (0.0%) | 10 (100.0%) |
| Bachelor's Degree | 0 (0.0%) | 0 (0.0%) |
| Graduate Degree | 0 (0.0%) | 0 (0.0%) |
| Total | 0 (0.0%) | 31 (100.0%) |
Income in Maysville
Income Overview in Maysville
Per Capita Income in Maysville is $26,662, while median incomes of families and households are $56,508 and $56,344 respectively.
| Characteristic | Number | Measure |
| Per Capita Income | 1,479 | $26,662 |
| Median Family Income | 520 | $56,508 |
| Mean Family Income | 520 | $69,423 |
| Median Household Income | 628 | $56,344 |
| Mean Household Income | 628 | $67,850 |
| Income Deficit | 520 | $16,818 |
| Wage / Income Gap (%) | 1,479 | 44.66% |
| Wage / Income Gap ($) | 1,479 | 55.34¢ per $1 |
| Gini / Inequality Index | 1,479 | 0.35 |
Earnings by Sex in Maysville
Average Earnings in Maysville are $37,266, $46,786 for men and $25,893 for women, a difference of 44.7%.
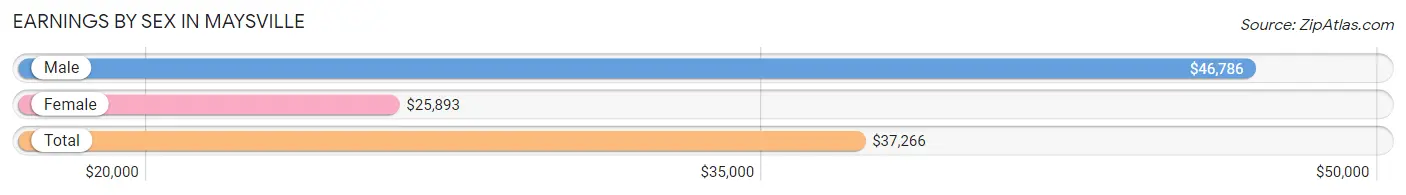
| Sex | Number | Average Earnings |
| Male | 310 (54.9%) | $46,786 |
| Female | 255 (45.1%) | $25,893 |
| Total | 565 (100.0%) | $37,266 |
Earnings by Sex by Income Bracket in Maysville
The most common earnings brackets in Maysville are $100,000+ for men (66 | 21.3%) and $12,500 to $14,999 for women (51 | 20.0%).
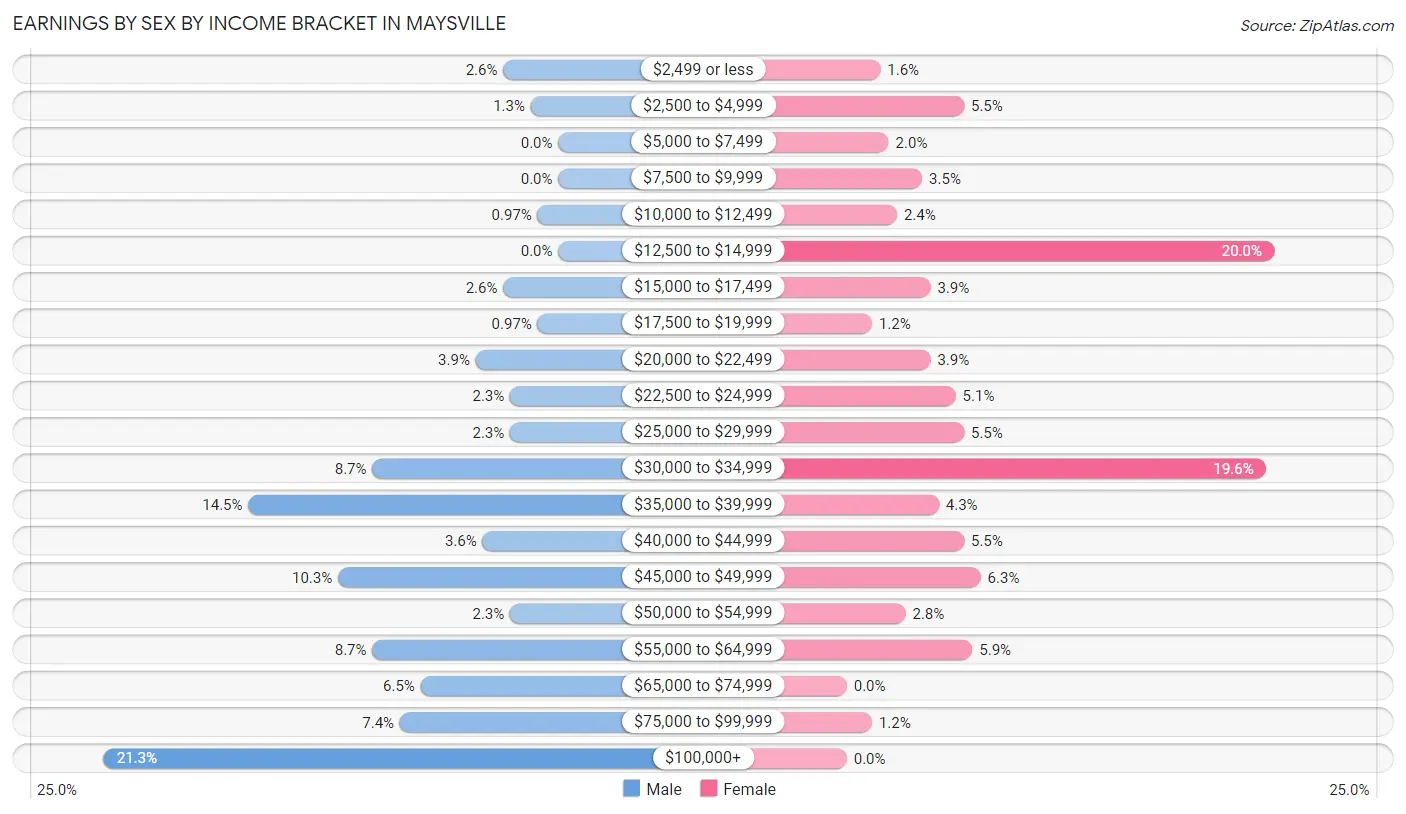
| Income | Male | Female |
| $2,499 or less | 8 (2.6%) | 4 (1.6%) |
| $2,500 to $4,999 | 4 (1.3%) | 14 (5.5%) |
| $5,000 to $7,499 | 0 (0.0%) | 5 (2.0%) |
| $7,500 to $9,999 | 0 (0.0%) | 9 (3.5%) |
| $10,000 to $12,499 | 3 (1.0%) | 6 (2.4%) |
| $12,500 to $14,999 | 0 (0.0%) | 51 (20.0%) |
| $15,000 to $17,499 | 8 (2.6%) | 10 (3.9%) |
| $17,500 to $19,999 | 3 (1.0%) | 3 (1.2%) |
| $20,000 to $22,499 | 12 (3.9%) | 10 (3.9%) |
| $22,500 to $24,999 | 7 (2.3%) | 13 (5.1%) |
| $25,000 to $29,999 | 7 (2.3%) | 14 (5.5%) |
| $30,000 to $34,999 | 27 (8.7%) | 50 (19.6%) |
| $35,000 to $39,999 | 45 (14.5%) | 11 (4.3%) |
| $40,000 to $44,999 | 11 (3.5%) | 14 (5.5%) |
| $45,000 to $49,999 | 32 (10.3%) | 16 (6.3%) |
| $50,000 to $54,999 | 7 (2.3%) | 7 (2.8%) |
| $55,000 to $64,999 | 27 (8.7%) | 15 (5.9%) |
| $65,000 to $74,999 | 20 (6.5%) | 0 (0.0%) |
| $75,000 to $99,999 | 23 (7.4%) | 3 (1.2%) |
| $100,000+ | 66 (21.3%) | 0 (0.0%) |
| Total | 310 (100.0%) | 255 (100.0%) |
Earnings by Sex by Educational Attainment in Maysville
Average earnings in Maysville are $51,250 for men and $29,643 for women, a difference of 42.2%. Men with an educational attainment of less than high school enjoy the highest average annual earnings of $165,640, while those with high school diploma education earn the least with $40,625. Women with an educational attainment of college or associate's degree earn the most with the average annual earnings of $33,947, while those with high school diploma education have the smallest earnings of $23,125.
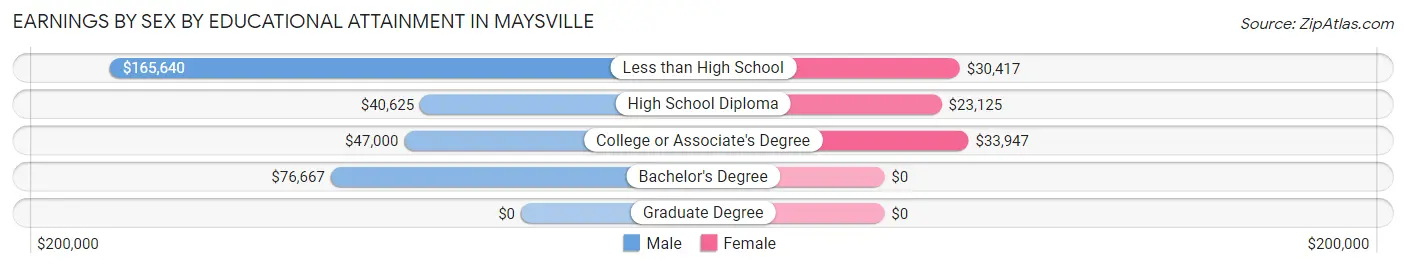
| Educational Attainment | Male Income | Female Income |
| Less than High School | $165,640 | $30,417 |
| High School Diploma | $40,625 | $23,125 |
| College or Associate's Degree | $47,000 | $33,947 |
| Bachelor's Degree | $76,667 | $0 |
| Graduate Degree | - | - |
| Total | $51,250 | $29,643 |
Family Income in Maysville
Family Income Brackets in Maysville
According to the Maysville family income data, there are 237 families falling into the $50,000 to $74,999 income range, which is the most common income bracket and makes up 45.6% of all families. Conversely, the $200,000+ income bracket is the least frequent group with only 2 families (0.4%) belonging to this category.
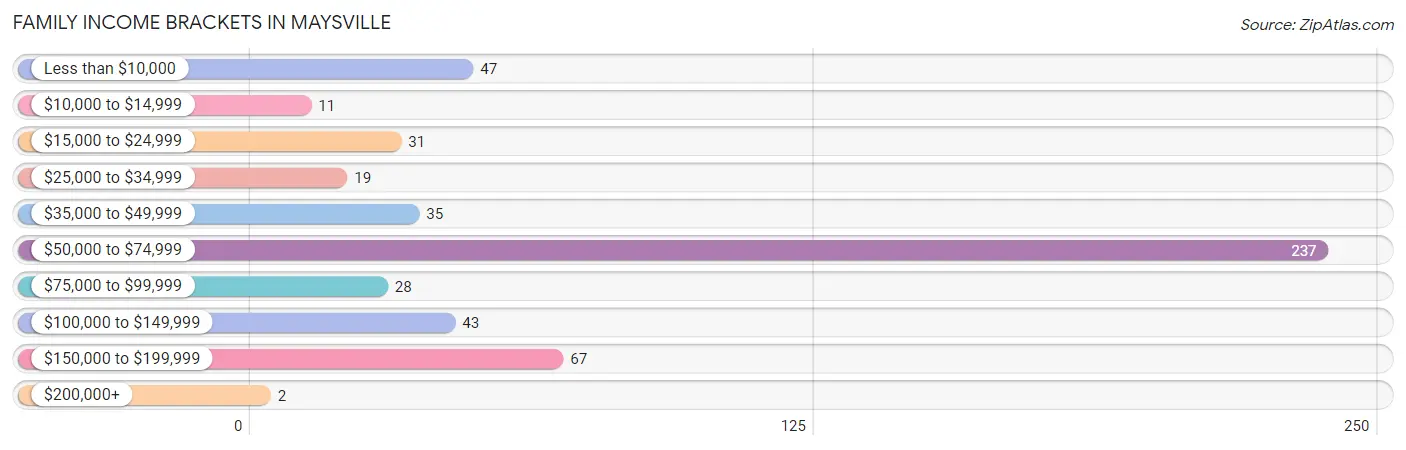
| Income Bracket | # Families | % Families |
| Less than $10,000 | 47 | 9.0% |
| $10,000 to $14,999 | 11 | 2.1% |
| $15,000 to $24,999 | 31 | 6.0% |
| $25,000 to $34,999 | 19 | 3.7% |
| $35,000 to $49,999 | 35 | 6.7% |
| $50,000 to $74,999 | 237 | 45.6% |
| $75,000 to $99,999 | 28 | 5.4% |
| $100,000 to $149,999 | 43 | 8.3% |
| $150,000 to $199,999 | 67 | 12.9% |
| $200,000+ | 2 | 0.4% |
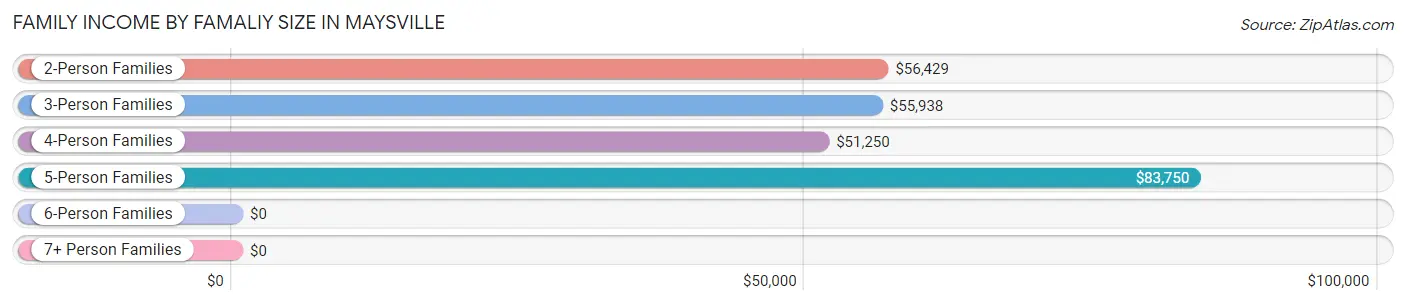
Family Income by Famaliy Size in Maysville
5-person families (26 | 5.0%) account for the highest median family income in Maysville with $83,750 per family, while 2-person families (376 | 72.3%) have the highest median income of $28,214 per family member.
| Income Bracket | # Families | Median Income |
| 2-Person Families | 376 (72.3%) | $56,429 |
| 3-Person Families | 71 (13.7%) | $55,938 |
| 4-Person Families | 39 (7.5%) | $51,250 |
| 5-Person Families | 26 (5.0%) | $83,750 |
| 6-Person Families | 6 (1.1%) | $0 |
| 7+ Person Families | 2 (0.4%) | $0 |
| Total | 520 (100.0%) | $56,508 |
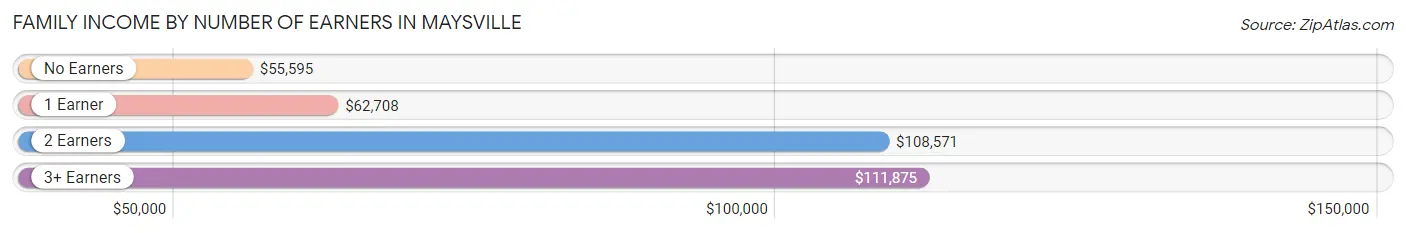
Family Income by Number of Earners in Maysville
The median family income in Maysville is $56,508, with families comprising 3+ earners (12) having the highest median family income of $111,875, while families with no earners (260) have the lowest median family income of $55,595, accounting for 2.3% and 50.0% of families, respectively.
| Number of Earners | # Families | Median Income |
| No Earners | 260 (50.0%) | $55,595 |
| 1 Earner | 118 (22.7%) | $62,708 |
| 2 Earners | 130 (25.0%) | $108,571 |
| 3+ Earners | 12 (2.3%) | $111,875 |
| Total | 520 (100.0%) | $56,508 |
Household Income in Maysville
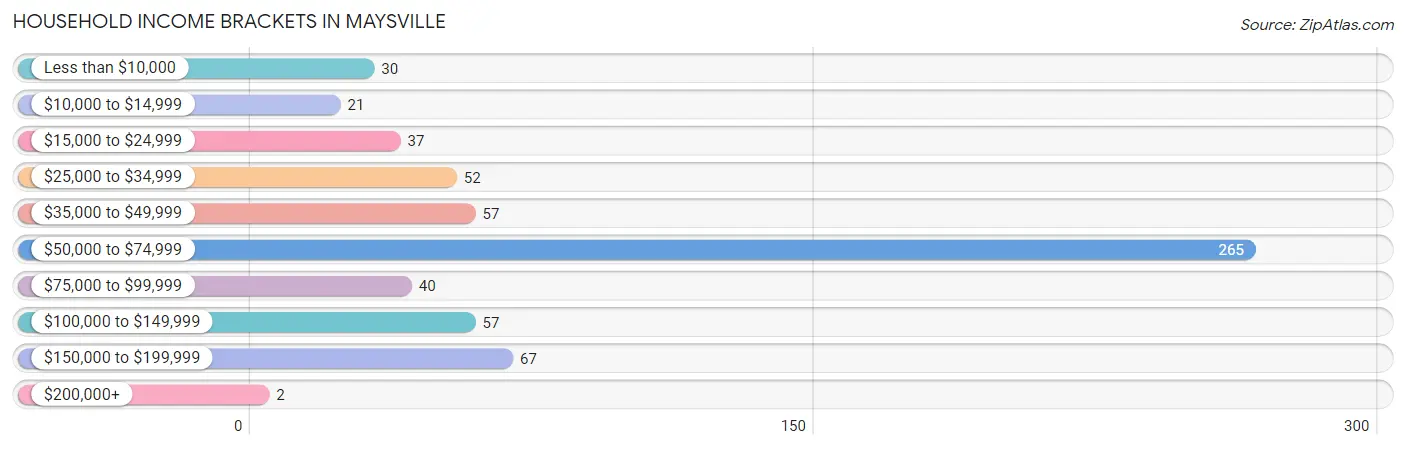
Household Income Brackets in Maysville
With 265 households falling in the category, the $50,000 to $74,999 income range is the most frequent in Maysville, accounting for 42.2% of all households. In contrast, only 2 households (0.3%) fall into the $200,000+ income bracket, making it the least populous group.
| Income Bracket | # Households | % Households |
| Less than $10,000 | 30 | 4.8% |
| $10,000 to $14,999 | 21 | 3.3% |
| $15,000 to $24,999 | 37 | 5.9% |
| $25,000 to $34,999 | 52 | 8.3% |
| $35,000 to $49,999 | 57 | 9.1% |
| $50,000 to $74,999 | 265 | 42.2% |
| $75,000 to $99,999 | 40 | 6.4% |
| $100,000 to $149,999 | 57 | 9.1% |
| $150,000 to $199,999 | 67 | 10.7% |
| $200,000+ | 2 | 0.3% |
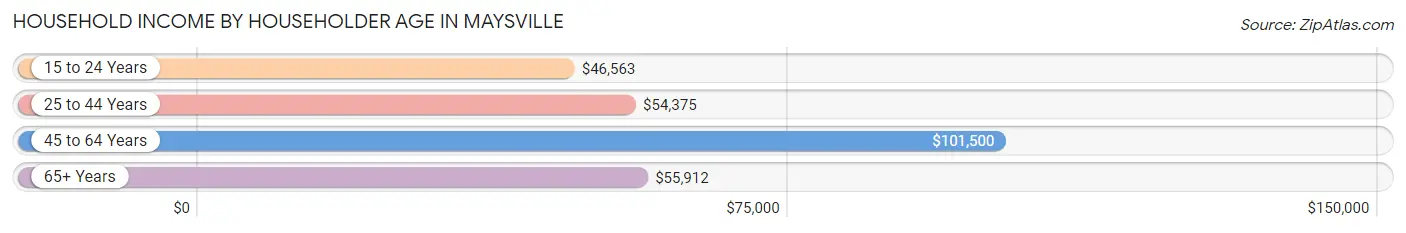
Household Income by Householder Age in Maysville
The median household income in Maysville is $56,344, with the highest median household income of $101,500 found in the 45 to 64 years age bracket for the primary householder. A total of 168 households (26.8%) fall into this category. Meanwhile, the 15 to 24 years age bracket for the primary householder has the lowest median household income of $46,563, with 22 households (3.5%) in this group.
| Income Bracket | # Households | Median Income |
| 15 to 24 Years | 22 (3.5%) | $46,563 |
| 25 to 44 Years | 172 (27.4%) | $54,375 |
| 45 to 64 Years | 168 (26.8%) | $101,500 |
| 65+ Years | 266 (42.4%) | $55,912 |
| Total | 628 (100.0%) | $56,344 |
Poverty in Maysville
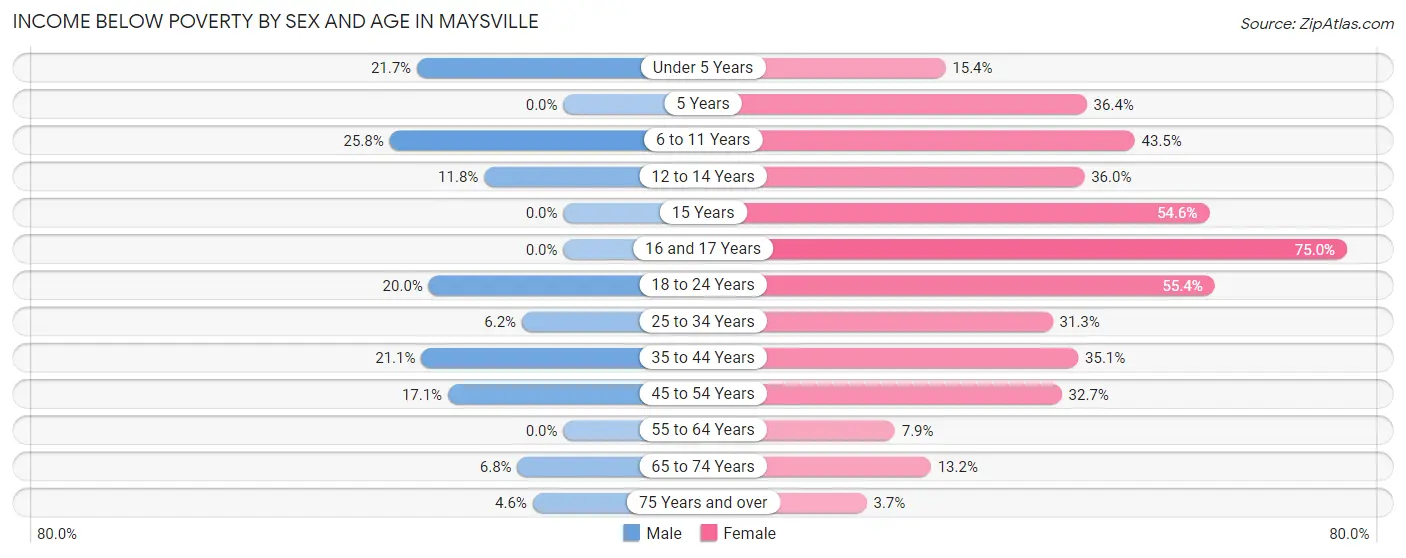
Income Below Poverty by Sex and Age in Maysville
With 13.0% poverty level for males and 22.8% for females among the residents of Maysville, 6 to 11 year old males and 16 and 17 year old females are the most vulnerable to poverty, with 16 males (25.8%) and 6 females (75.0%) in their respective age groups living below the poverty level.
| Age Bracket | Male | Female |
| Under 5 Years | 10 (21.7%) | 4 (15.4%) |
| 5 Years | 0 (0.0%) | 4 (36.4%) |
| 6 to 11 Years | 16 (25.8%) | 30 (43.5%) |
| 12 to 14 Years | 2 (11.8%) | 9 (36.0%) |
| 15 Years | 0 (0.0%) | 6 (54.5%) |
| 16 and 17 Years | 0 (0.0%) | 6 (75.0%) |
| 18 to 24 Years | 8 (20.0%) | 31 (55.4%) |
| 25 to 34 Years | 4 (6.1%) | 41 (31.3%) |
| 35 to 44 Years | 27 (21.1%) | 20 (35.1%) |
| 45 to 54 Years | 6 (17.1%) | 16 (32.7%) |
| 55 to 64 Years | 0 (0.0%) | 10 (7.9%) |
| 65 to 74 Years | 3 (6.8%) | 7 (13.2%) |
| 75 Years and over | 3 (4.5%) | 8 (3.7%) |
| Total | 79 (13.0%) | 192 (22.8%) |
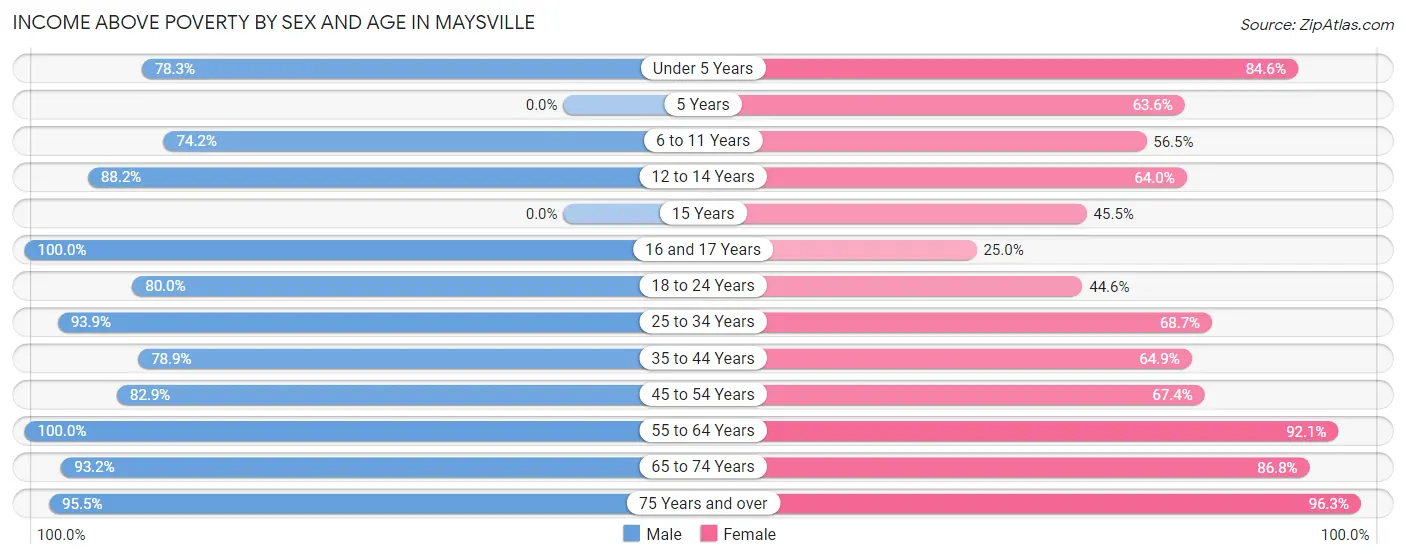
Income Above Poverty by Sex and Age in Maysville
According to the poverty statistics in Maysville, males aged 16 and 17 years and females aged 75 years and over are the age groups that are most secure financially, with 100.0% of males and 96.3% of females in these age groups living above the poverty line.
| Age Bracket | Male | Female |
| Under 5 Years | 36 (78.3%) | 22 (84.6%) |
| 5 Years | 0 (0.0%) | 7 (63.6%) |
| 6 to 11 Years | 46 (74.2%) | 39 (56.5%) |
| 12 to 14 Years | 15 (88.2%) | 16 (64.0%) |
| 15 Years | 0 (0.0%) | 5 (45.5%) |
| 16 and 17 Years | 13 (100.0%) | 2 (25.0%) |
| 18 to 24 Years | 32 (80.0%) | 25 (44.6%) |
| 25 to 34 Years | 61 (93.9%) | 90 (68.7%) |
| 35 to 44 Years | 101 (78.9%) | 37 (64.9%) |
| 45 to 54 Years | 29 (82.9%) | 33 (67.3%) |
| 55 to 64 Years | 91 (100.0%) | 117 (92.1%) |
| 65 to 74 Years | 41 (93.2%) | 46 (86.8%) |
| 75 Years and over | 63 (95.5%) | 210 (96.3%) |
| Total | 528 (87.0%) | 649 (77.2%) |
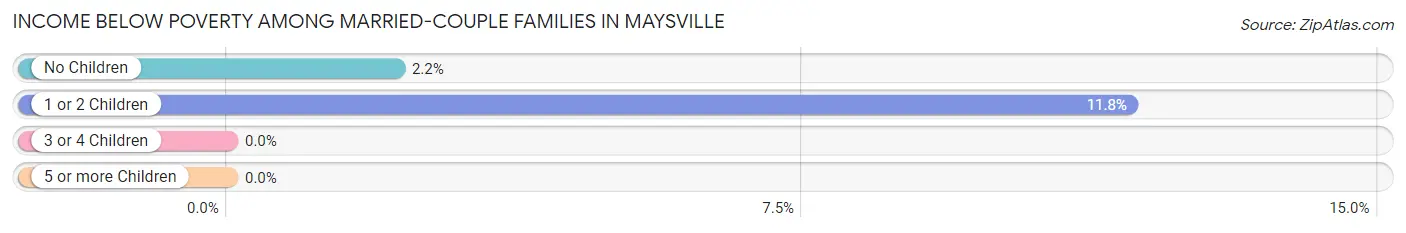
Income Below Poverty Among Married-Couple Families in Maysville
The poverty statistics for married-couple families in Maysville show that 2.9% or 11 of the total 379 families live below the poverty line. Families with 1 or 2 children have the highest poverty rate of 11.8%, comprising of 4 families. On the other hand, families with 3 or 4 children have the lowest poverty rate of 0.0%, which includes 0 families.
| Children | Above Poverty | Below Poverty |
| No Children | 314 (97.8%) | 7 (2.2%) |
| 1 or 2 Children | 30 (88.2%) | 4 (11.8%) |
| 3 or 4 Children | 24 (100.0%) | 0 (0.0%) |
| 5 or more Children | 0 (0.0%) | 0 (0.0%) |
| Total | 368 (97.1%) | 11 (2.9%) |
Income Below Poverty Among Single-Parent Households in Maysville
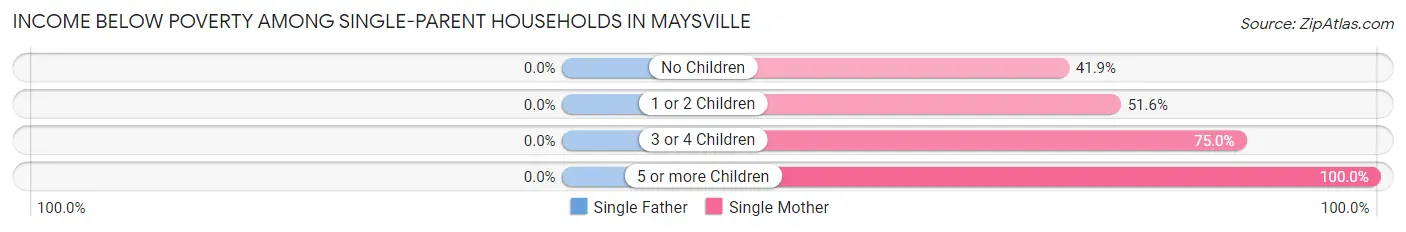
| Children | Single Father | Single Mother |
| No Children | 0 (0.0%) | 13 (41.9%) |
| 1 or 2 Children | 0 (0.0%) | 32 (51.6%) |
| 3 or 4 Children | 0 (0.0%) | 9 (75.0%) |
| 5 or more Children | 0 (0.0%) | 2 (100.0%) |
| Total | 0 (0.0%) | 56 (52.3%) |
Income Below Poverty Among Married-Couple vs Single-Parent Households in Maysville
The poverty data for Maysville shows that 11 of the married-couple family households (2.9%) and 56 of the single-parent households (39.7%) are living below the poverty level. Within the married-couple family households, those with 1 or 2 children have the highest poverty rate, with 4 households (11.8%) falling below the poverty line. Among the single-parent households, those with 5 or more children have the highest poverty rate, with 2 household (100.0%) living below poverty.
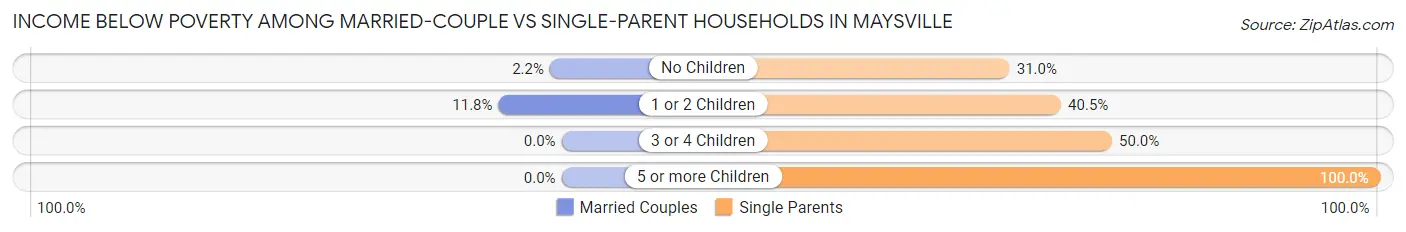
| Children | Married-Couple Families | Single-Parent Households |
| No Children | 7 (2.2%) | 13 (30.9%) |
| 1 or 2 Children | 4 (11.8%) | 32 (40.5%) |
| 3 or 4 Children | 0 (0.0%) | 9 (50.0%) |
| 5 or more Children | 0 (0.0%) | 2 (100.0%) |
| Total | 11 (2.9%) | 56 (39.7%) |
Employment Characteristics in Maysville
Employment by Class of Employer in Maysville
Among the 539 employed individuals in Maysville, private company employees (411 | 76.2%), self-employed (not incorporated) (61 | 11.3%), and state government employees (21 | 3.9%) make up the most common classes of employment.
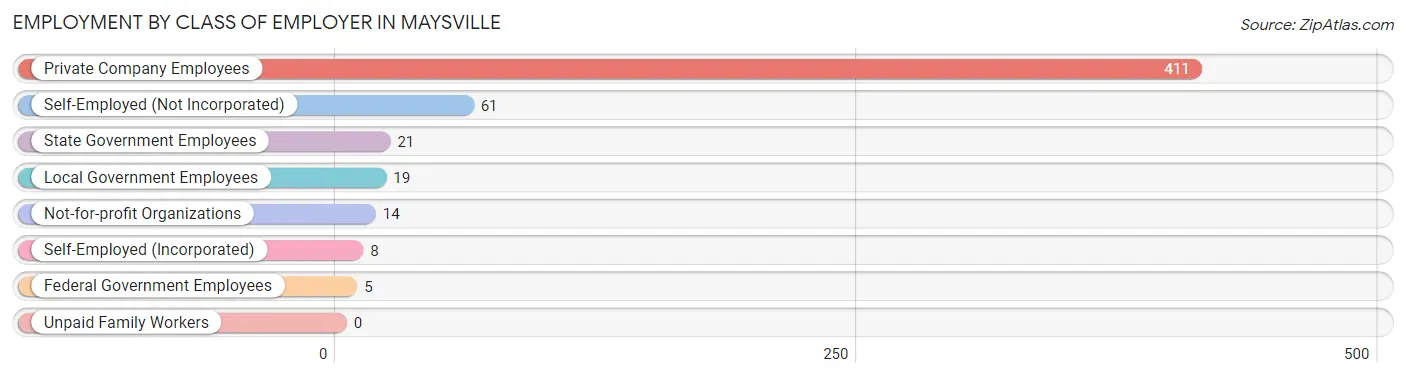
| Employer Class | # Employees | % Employees |
| Private Company Employees | 411 | 76.2% |
| Self-Employed (Incorporated) | 8 | 1.5% |
| Self-Employed (Not Incorporated) | 61 | 11.3% |
| Not-for-profit Organizations | 14 | 2.6% |
| Local Government Employees | 19 | 3.5% |
| State Government Employees | 21 | 3.9% |
| Federal Government Employees | 5 | 0.9% |
| Unpaid Family Workers | 0 | 0.0% |
| Total | 539 | 100.0% |
Employment Status by Age in Maysville
According to the labor force statistics for Maysville, out of the total population over 16 years of age (1,181), 46.0% or 543 individuals are in the labor force, with 0.7% or 4 of them unemployed. The age group with the highest labor force participation rate is 60 to 64 years, with 82.2% or 120 individuals in the labor force. Within the labor force, the 35 to 44 years age range has the highest percentage of unemployed individuals, with 2.4% or 3 of them being unemployed.
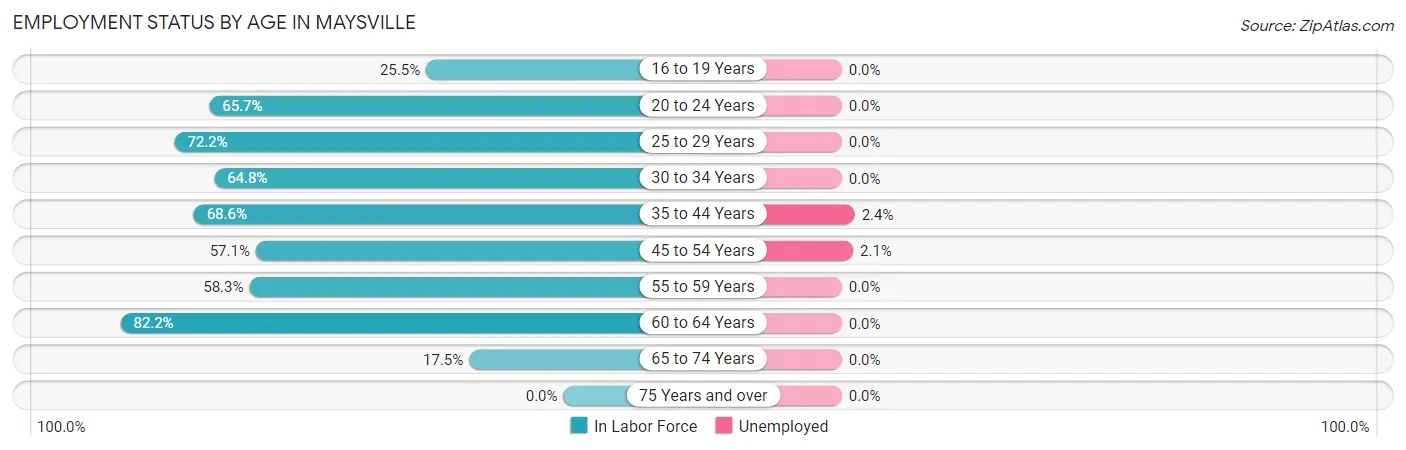
| Age Bracket | In Labor Force | Unemployed |
| 16 to 19 Years | 12 (25.5%) | 0 (0.0%) |
| 20 to 24 Years | 46 (65.7%) | 0 (0.0%) |
| 25 to 29 Years | 39 (72.2%) | 0 (0.0%) |
| 30 to 34 Years | 92 (64.8%) | 0 (0.0%) |
| 35 to 44 Years | 127 (68.6%) | 3 (2.4%) |
| 45 to 54 Years | 48 (57.1%) | 1 (2.1%) |
| 55 to 59 Years | 42 (58.3%) | 0 (0.0%) |
| 60 to 64 Years | 120 (82.2%) | 0 (0.0%) |
| 65 to 74 Years | 17 (17.5%) | 0 (0.0%) |
| 75 Years and over | 0 (0.0%) | 0 (0.0%) |
| Total | 543 (46.0%) | 4 (0.7%) |
Employment Status by Educational Attainment in Maysville
According to labor force statistics for Maysville, 68.5% of individuals (468) out of the total population between 25 and 64 years of age (683) are in the labor force, with 0.9% or 4 of them being unemployed. The group with the highest labor force participation rate are those with the educational attainment of bachelor's degree or higher, with 78.4% or 40 individuals in the labor force. Within the labor force, individuals with high school diploma education have the highest percentage of unemployment, with 1.6% or 4 of them being unemployed.
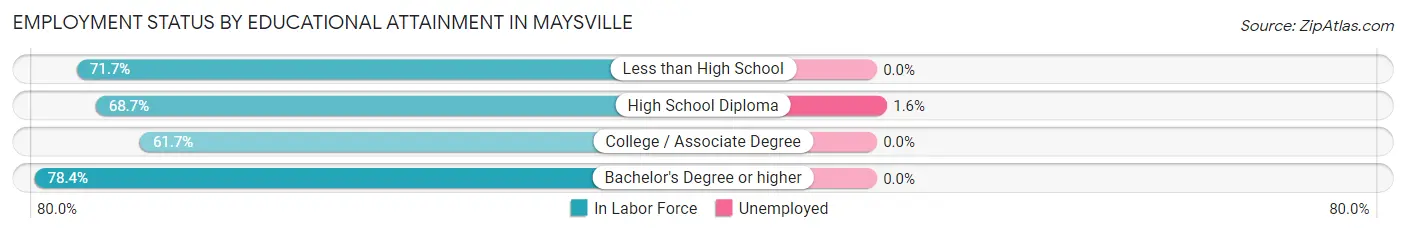
| Educational Attainment | In Labor Force | Unemployed |
| Less than High School | 86 (71.7%) | 0 (0.0%) |
| High School Diploma | 255 (68.7%) | 6 (1.6%) |
| College / Associate Degree | 87 (61.7%) | 0 (0.0%) |
| Bachelor's Degree or higher | 40 (78.4%) | 0 (0.0%) |
| Total | 468 (68.5%) | 6 (0.9%) |
Employment Occupations by Sex in Maysville
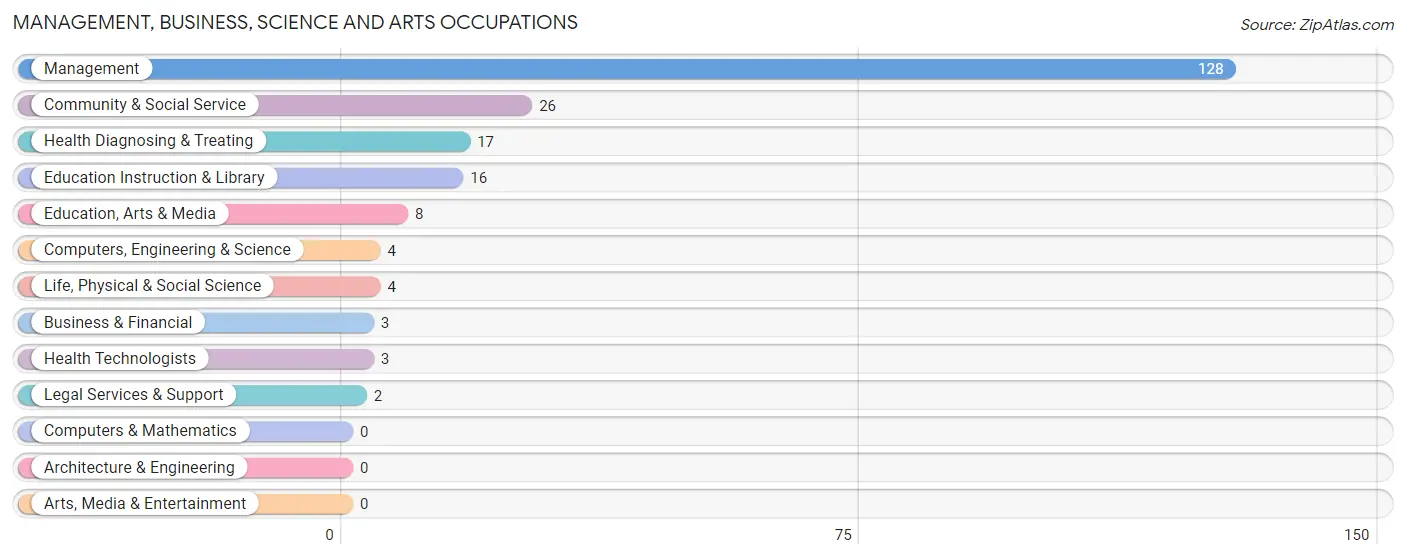
Management, Business, Science and Arts Occupations
The most common Management, Business, Science and Arts occupations in Maysville are Management (128 | 23.7%), Community & Social Service (26 | 4.8%), Health Diagnosing & Treating (17 | 3.2%), Education Instruction & Library (16 | 3.0%), and Education, Arts & Media (8 | 1.5%).
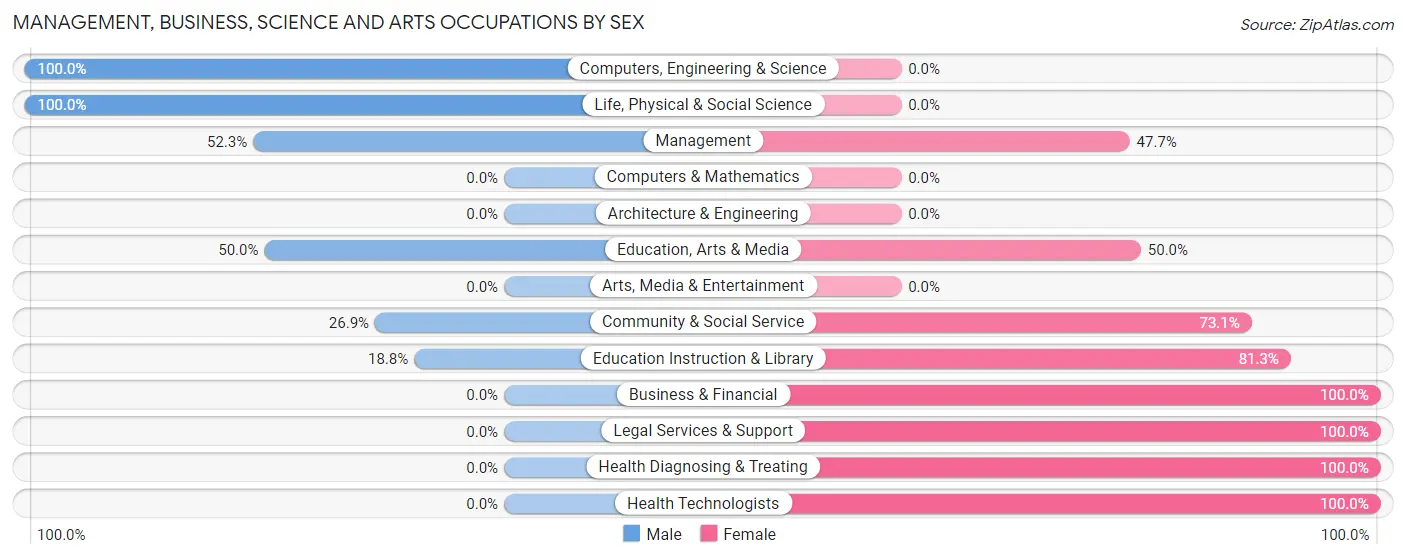
Management, Business, Science and Arts Occupations by Sex
Within the Management, Business, Science and Arts occupations in Maysville, the most male-oriented occupations are Computers, Engineering & Science (100.0%), Life, Physical & Social Science (100.0%), and Management (52.3%), while the most female-oriented occupations are Business & Financial (100.0%), Legal Services & Support (100.0%), and Health Diagnosing & Treating (100.0%).
| Occupation | Male | Female |
| Management | 67 (52.3%) | 61 (47.7%) |
| Business & Financial | 0 (0.0%) | 3 (100.0%) |
| Computers, Engineering & Science | 4 (100.0%) | 0 (0.0%) |
| Computers & Mathematics | 0 (0.0%) | 0 (0.0%) |
| Architecture & Engineering | 0 (0.0%) | 0 (0.0%) |
| Life, Physical & Social Science | 4 (100.0%) | 0 (0.0%) |
| Community & Social Service | 7 (26.9%) | 19 (73.1%) |
| Education, Arts & Media | 4 (50.0%) | 4 (50.0%) |
| Legal Services & Support | 0 (0.0%) | 2 (100.0%) |
| Education Instruction & Library | 3 (18.8%) | 13 (81.2%) |
| Arts, Media & Entertainment | 0 (0.0%) | 0 (0.0%) |
| Health Diagnosing & Treating | 0 (0.0%) | 17 (100.0%) |
| Health Technologists | 0 (0.0%) | 3 (100.0%) |
| Total (Category) | 78 (43.8%) | 100 (56.2%) |
| Total (Overall) | 302 (56.0%) | 237 (44.0%) |
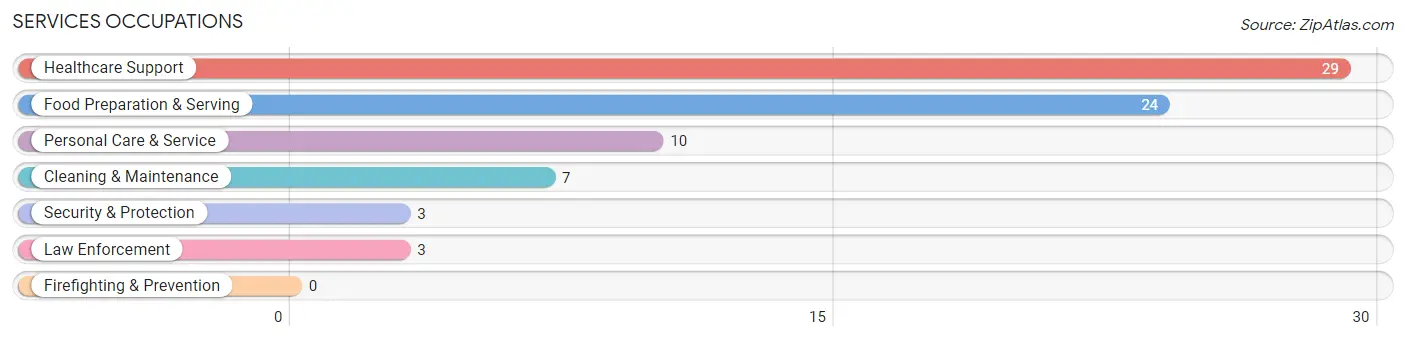
Services Occupations
The most common Services occupations in Maysville are Healthcare Support (29 | 5.4%), Food Preparation & Serving (24 | 4.4%), Personal Care & Service (10 | 1.9%), Cleaning & Maintenance (7 | 1.3%), and Security & Protection (3 | 0.6%).
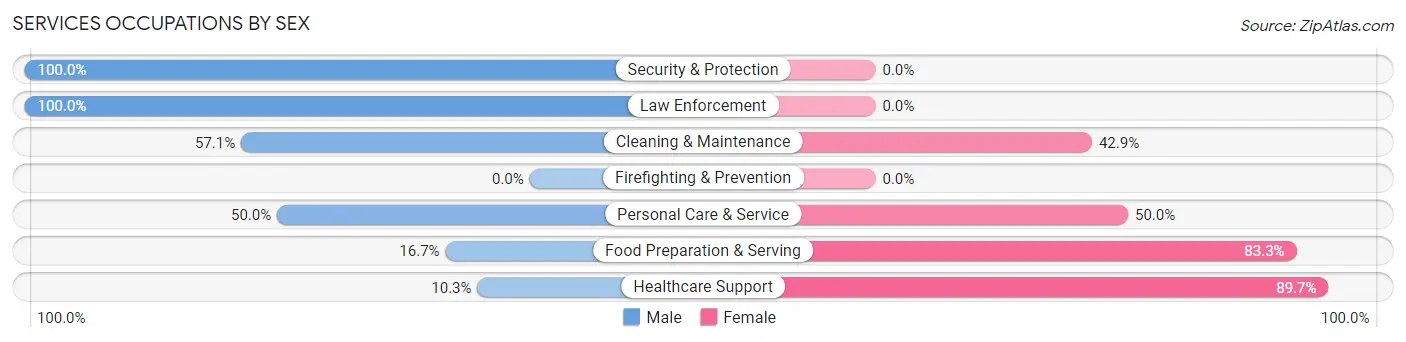
Services Occupations by Sex
Within the Services occupations in Maysville, the most male-oriented occupations are Security & Protection (100.0%), Law Enforcement (100.0%), and Cleaning & Maintenance (57.1%), while the most female-oriented occupations are Healthcare Support (89.7%), Food Preparation & Serving (83.3%), and Personal Care & Service (50.0%).
| Occupation | Male | Female |
| Healthcare Support | 3 (10.3%) | 26 (89.7%) |
| Security & Protection | 3 (100.0%) | 0 (0.0%) |
| Firefighting & Prevention | 0 (0.0%) | 0 (0.0%) |
| Law Enforcement | 3 (100.0%) | 0 (0.0%) |
| Food Preparation & Serving | 4 (16.7%) | 20 (83.3%) |
| Cleaning & Maintenance | 4 (57.1%) | 3 (42.9%) |
| Personal Care & Service | 5 (50.0%) | 5 (50.0%) |
| Total (Category) | 19 (26.0%) | 54 (74.0%) |
| Total (Overall) | 302 (56.0%) | 237 (44.0%) |
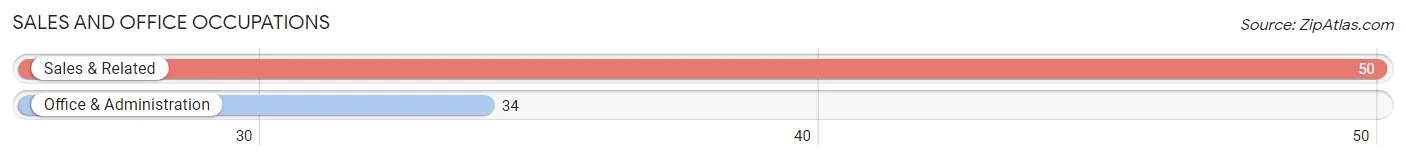
Sales and Office Occupations
The most common Sales and Office occupations in Maysville are Sales & Related (50 | 9.3%), and Office & Administration (34 | 6.3%).
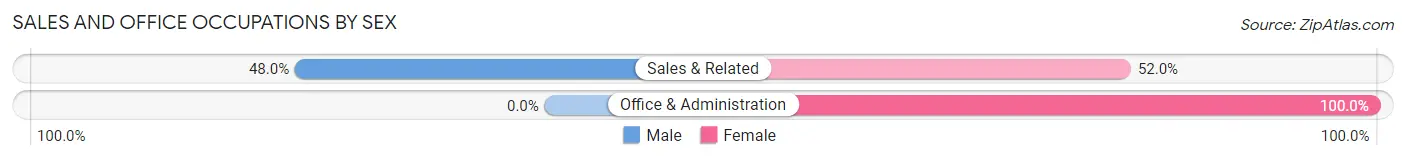
Sales and Office Occupations by Sex
| Occupation | Male | Female |
| Sales & Related | 24 (48.0%) | 26 (52.0%) |
| Office & Administration | 0 (0.0%) | 34 (100.0%) |
| Total (Category) | 24 (28.6%) | 60 (71.4%) |
| Total (Overall) | 302 (56.0%) | 237 (44.0%) |
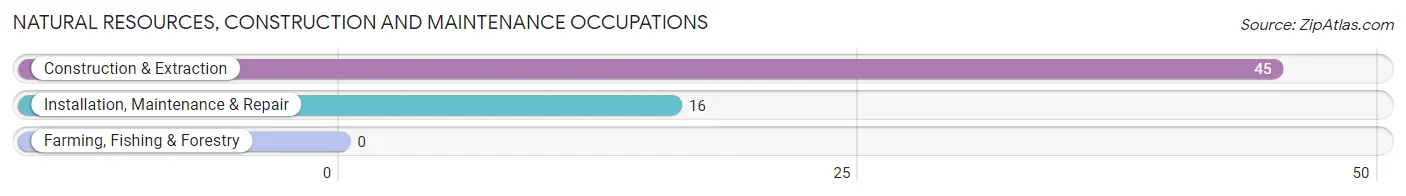
Natural Resources, Construction and Maintenance Occupations
The most common Natural Resources, Construction and Maintenance occupations in Maysville are Construction & Extraction (45 | 8.4%), and Installation, Maintenance & Repair (16 | 3.0%).
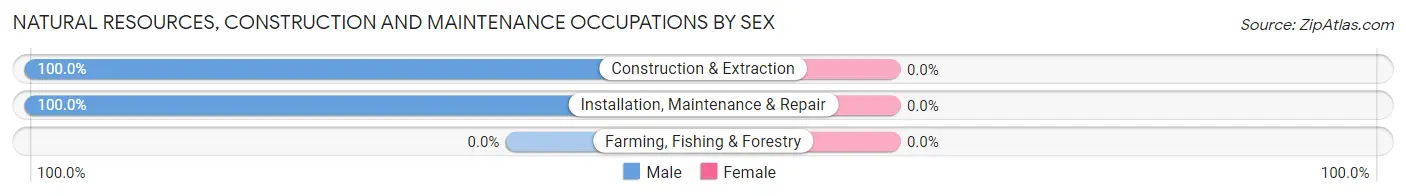
Natural Resources, Construction and Maintenance Occupations by Sex
| Occupation | Male | Female |
| Farming, Fishing & Forestry | 0 (0.0%) | 0 (0.0%) |
| Construction & Extraction | 45 (100.0%) | 0 (0.0%) |
| Installation, Maintenance & Repair | 16 (100.0%) | 0 (0.0%) |
| Total (Category) | 61 (100.0%) | 0 (0.0%) |
| Total (Overall) | 302 (56.0%) | 237 (44.0%) |
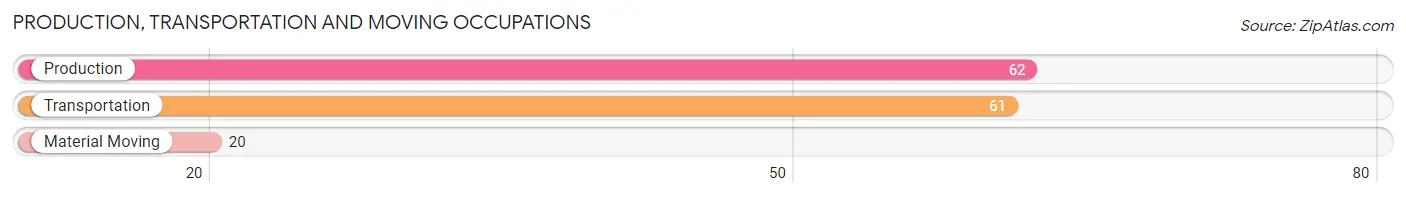
Production, Transportation and Moving Occupations
The most common Production, Transportation and Moving occupations in Maysville are Production (62 | 11.5%), Transportation (61 | 11.3%), and Material Moving (20 | 3.7%).
Production, Transportation and Moving Occupations by Sex
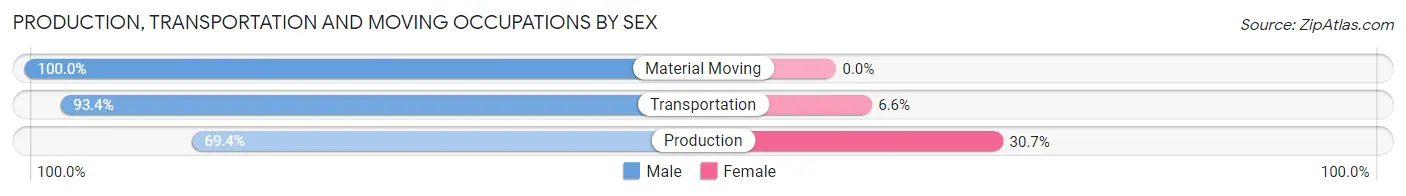
| Occupation | Male | Female |
| Production | 43 (69.4%) | 19 (30.6%) |
| Transportation | 57 (93.4%) | 4 (6.6%) |
| Material Moving | 20 (100.0%) | 0 (0.0%) |
| Total (Category) | 120 (83.9%) | 23 (16.1%) |
| Total (Overall) | 302 (56.0%) | 237 (44.0%) |
Employment Industries by Sex in Maysville
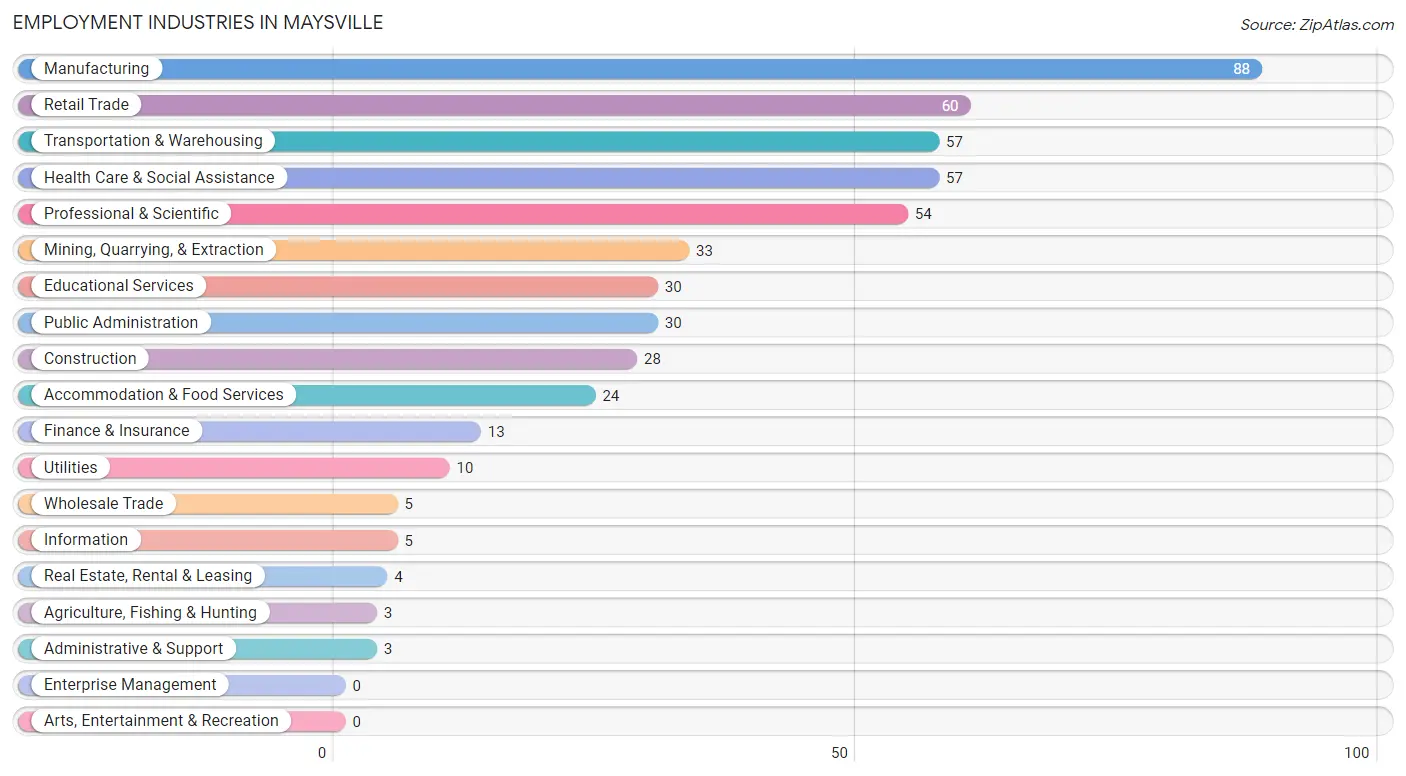
Employment Industries in Maysville
The major employment industries in Maysville include Manufacturing (88 | 16.3%), Retail Trade (60 | 11.1%), Transportation & Warehousing (57 | 10.6%), Health Care & Social Assistance (57 | 10.6%), and Professional & Scientific (54 | 10.0%).
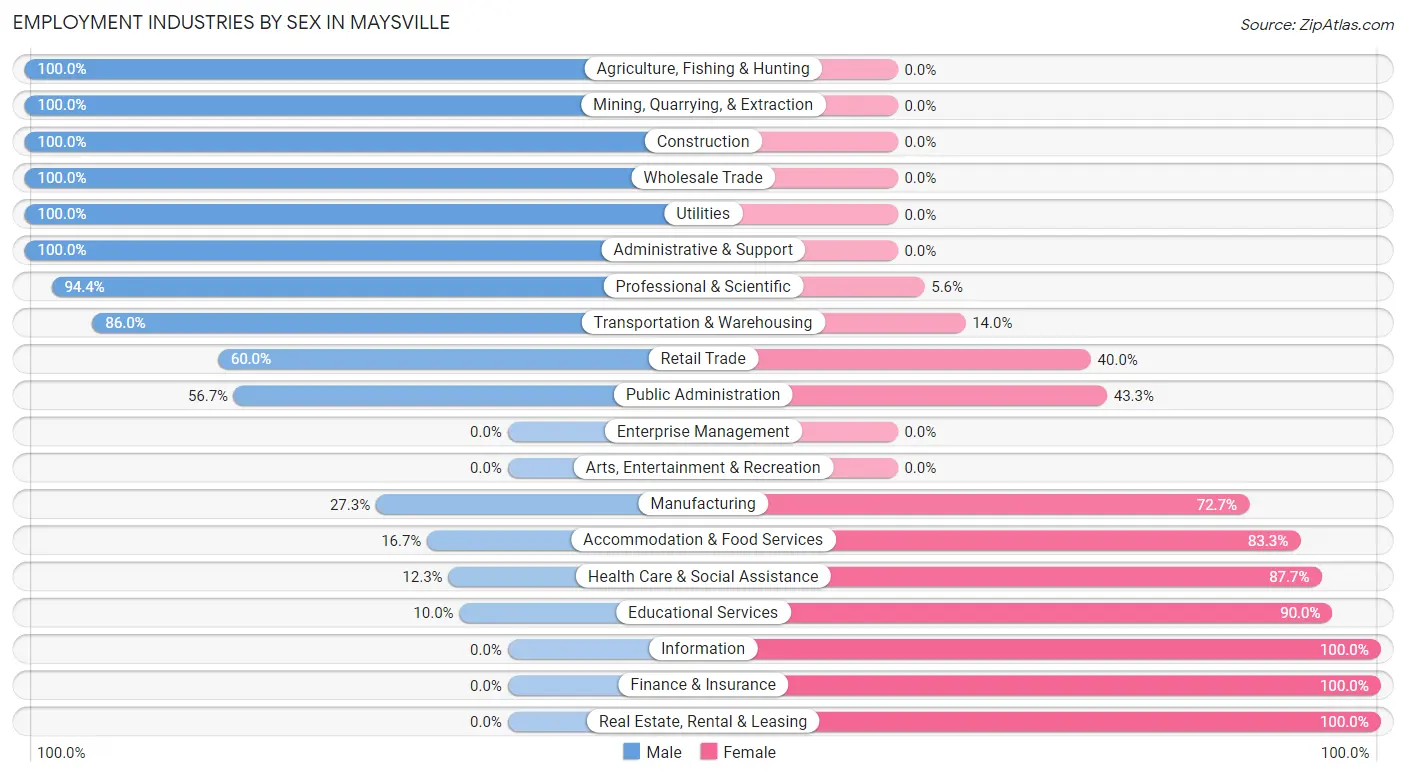
Employment Industries by Sex in Maysville
The Maysville industries that see more men than women are Agriculture, Fishing & Hunting (100.0%), Mining, Quarrying, & Extraction (100.0%), and Construction (100.0%), whereas the industries that tend to have a higher number of women are Information (100.0%), Finance & Insurance (100.0%), and Real Estate, Rental & Leasing (100.0%).
| Industry | Male | Female |
| Agriculture, Fishing & Hunting | 3 (100.0%) | 0 (0.0%) |
| Mining, Quarrying, & Extraction | 33 (100.0%) | 0 (0.0%) |
| Construction | 28 (100.0%) | 0 (0.0%) |
| Manufacturing | 24 (27.3%) | 64 (72.7%) |
| Wholesale Trade | 5 (100.0%) | 0 (0.0%) |
| Retail Trade | 36 (60.0%) | 24 (40.0%) |
| Transportation & Warehousing | 49 (86.0%) | 8 (14.0%) |
| Utilities | 10 (100.0%) | 0 (0.0%) |
| Information | 0 (0.0%) | 5 (100.0%) |
| Finance & Insurance | 0 (0.0%) | 13 (100.0%) |
| Real Estate, Rental & Leasing | 0 (0.0%) | 4 (100.0%) |
| Professional & Scientific | 51 (94.4%) | 3 (5.6%) |
| Enterprise Management | 0 (0.0%) | 0 (0.0%) |
| Administrative & Support | 3 (100.0%) | 0 (0.0%) |
| Educational Services | 3 (10.0%) | 27 (90.0%) |
| Health Care & Social Assistance | 7 (12.3%) | 50 (87.7%) |
| Arts, Entertainment & Recreation | 0 (0.0%) | 0 (0.0%) |
| Accommodation & Food Services | 4 (16.7%) | 20 (83.3%) |
| Public Administration | 17 (56.7%) | 13 (43.3%) |
| Total | 302 (56.0%) | 237 (44.0%) |
Education in Maysville
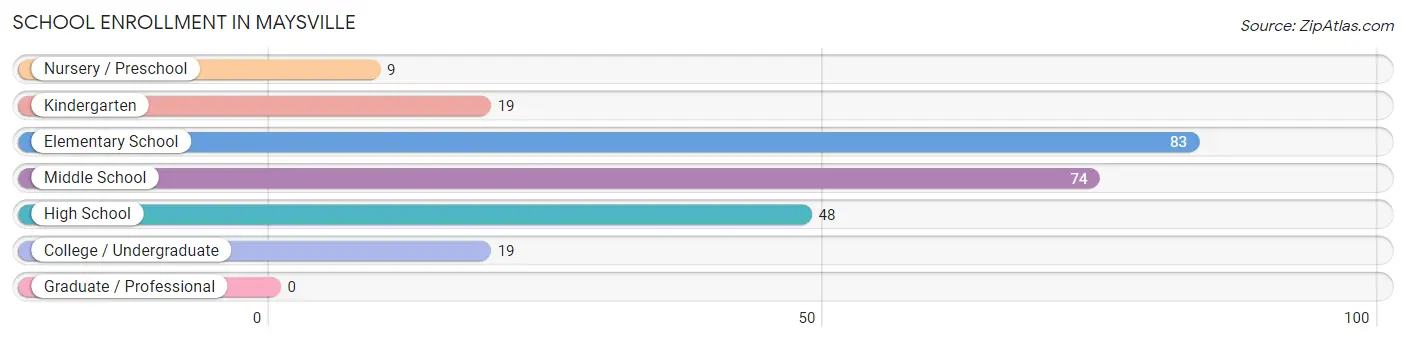
School Enrollment in Maysville
The most common levels of schooling among the 252 students in Maysville are elementary school (83 | 32.9%), middle school (74 | 29.4%), and high school (48 | 19.1%).
| School Level | # Students | % Students |
| Nursery / Preschool | 9 | 3.6% |
| Kindergarten | 19 | 7.5% |
| Elementary School | 83 | 32.9% |
| Middle School | 74 | 29.4% |
| High School | 48 | 19.1% |
| College / Undergraduate | 19 | 7.5% |
| Graduate / Professional | 0 | 0.0% |
| Total | 252 | 100.0% |
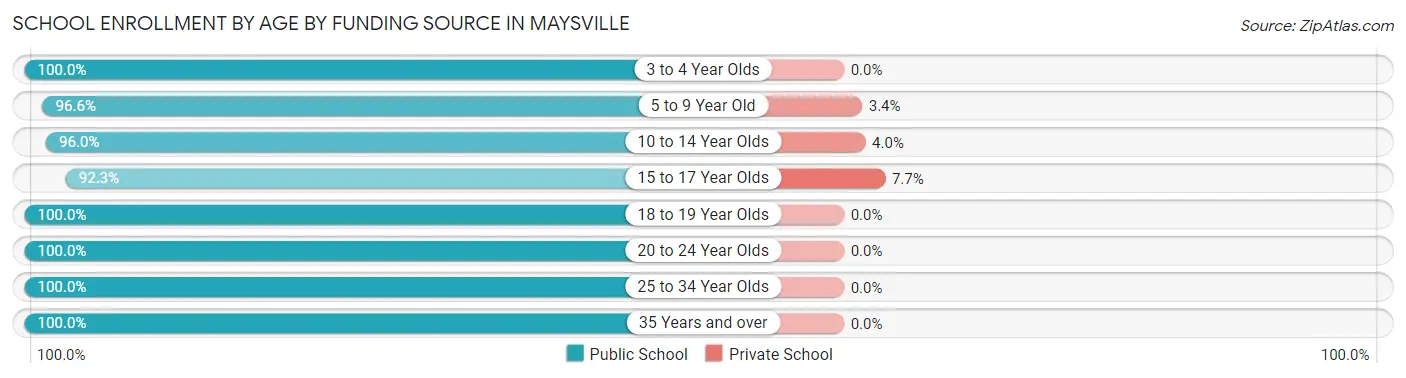
School Enrollment by Age by Funding Source in Maysville
Out of a total of 252 students who are enrolled in schools in Maysville, 9 (3.6%) attend a private institution, while the remaining 243 (96.4%) are enrolled in public schools. The age group of 15 to 17 year olds has the highest likelihood of being enrolled in private schools, with 2 (7.7% in the age bracket) enrolled. Conversely, the age group of 3 to 4 year olds has the lowest likelihood of being enrolled in a private school, with 5 (100.0% in the age bracket) attending a public institution.
| Age Bracket | Public School | Private School |
| 3 to 4 Year Olds | 5 (100.0%) | 0 (0.0%) |
| 5 to 9 Year Old | 86 (96.6%) | 3 (3.4%) |
| 10 to 14 Year Olds | 96 (96.0%) | 4 (4.0%) |
| 15 to 17 Year Olds | 24 (92.3%) | 2 (7.7%) |
| 18 to 19 Year Olds | 11 (100.0%) | 0 (0.0%) |
| 20 to 24 Year Olds | 8 (100.0%) | 0 (0.0%) |
| 25 to 34 Year Olds | 10 (100.0%) | 0 (0.0%) |
| 35 Years and over | 3 (100.0%) | 0 (0.0%) |
| Total | 243 (96.4%) | 9 (3.6%) |
Educational Attainment by Field of Study in Maysville
Education (22 | 32.4%), business (16 | 23.5%), arts & humanities (9 | 13.2%), liberal arts & history (7 | 10.3%), and science & technology (6 | 8.8%) are the most common fields of study among 68 individuals in Maysville who have obtained a bachelor's degree or higher.
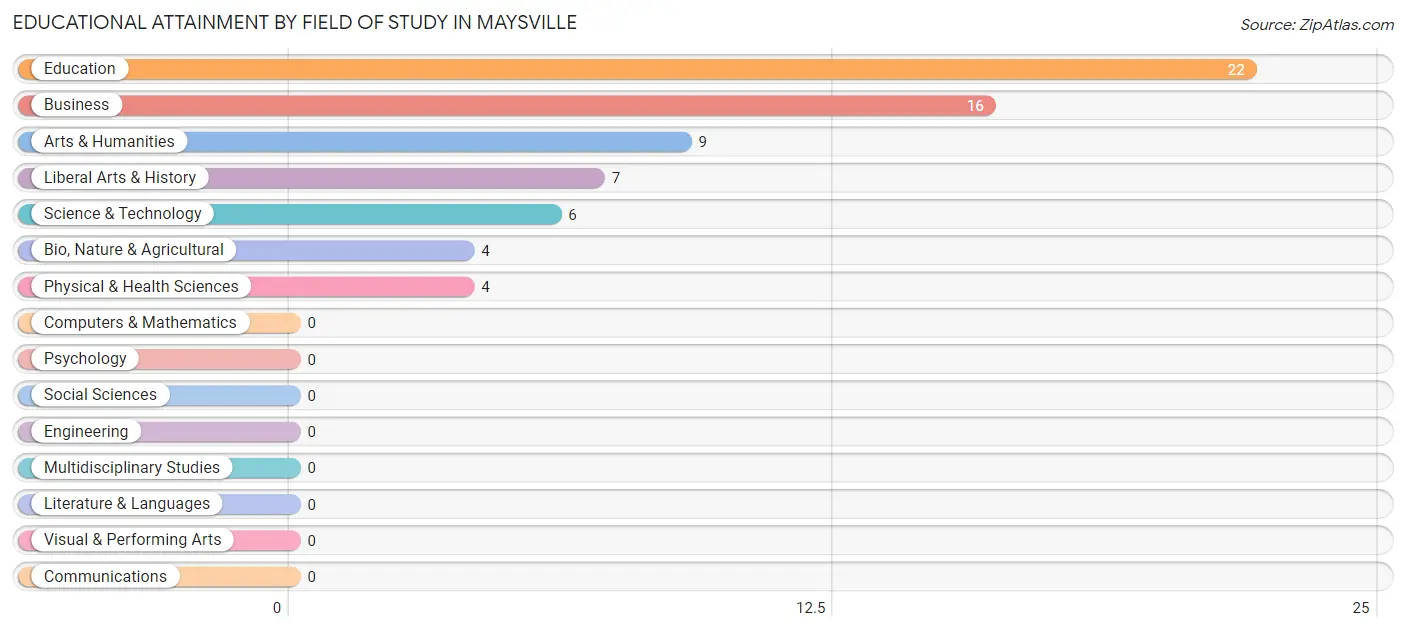
| Field of Study | # Graduates | % Graduates |
| Computers & Mathematics | 0 | 0.0% |
| Bio, Nature & Agricultural | 4 | 5.9% |
| Physical & Health Sciences | 4 | 5.9% |
| Psychology | 0 | 0.0% |
| Social Sciences | 0 | 0.0% |
| Engineering | 0 | 0.0% |
| Multidisciplinary Studies | 0 | 0.0% |
| Science & Technology | 6 | 8.8% |
| Business | 16 | 23.5% |
| Education | 22 | 32.4% |
| Literature & Languages | 0 | 0.0% |
| Liberal Arts & History | 7 | 10.3% |
| Visual & Performing Arts | 0 | 0.0% |
| Communications | 0 | 0.0% |
| Arts & Humanities | 9 | 13.2% |
| Total | 68 | 100.0% |
Transportation & Commute in Maysville
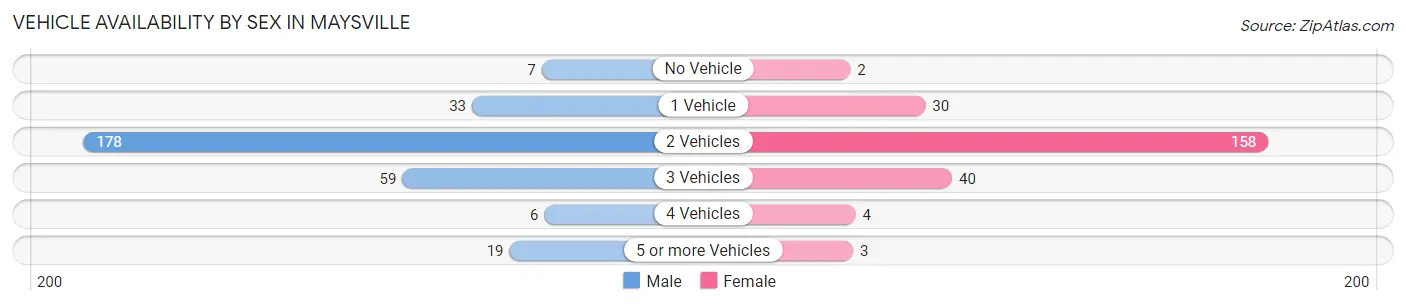
Vehicle Availability by Sex in Maysville
The most prevalent vehicle ownership categories in Maysville are males with 2 vehicles (178, accounting for 58.9%) and females with 2 vehicles (158, making up 75.1%).
| Vehicles Available | Male | Female |
| No Vehicle | 7 (2.3%) | 2 (0.8%) |
| 1 Vehicle | 33 (10.9%) | 30 (12.7%) |
| 2 Vehicles | 178 (58.9%) | 158 (66.7%) |
| 3 Vehicles | 59 (19.5%) | 40 (16.9%) |
| 4 Vehicles | 6 (2.0%) | 4 (1.7%) |
| 5 or more Vehicles | 19 (6.3%) | 3 (1.3%) |
| Total | 302 (100.0%) | 237 (100.0%) |
Commute Time in Maysville
The most frequently occuring commute durations in Maysville are 15 to 19 minutes (103 commuters, 24.0%), 20 to 24 minutes (73 commuters, 17.0%), and 60 to 89 minutes (60 commuters, 14.0%).
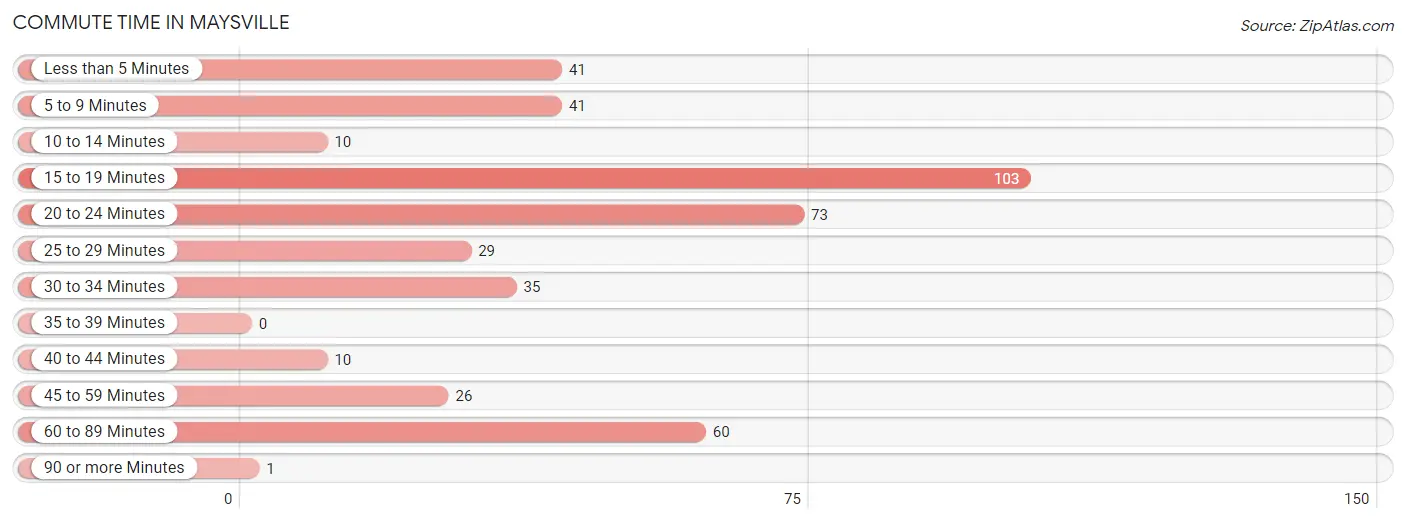
| Commute Time | # Commuters | % Commuters |
| Less than 5 Minutes | 41 | 9.6% |
| 5 to 9 Minutes | 41 | 9.6% |
| 10 to 14 Minutes | 10 | 2.3% |
| 15 to 19 Minutes | 103 | 24.0% |
| 20 to 24 Minutes | 73 | 17.0% |
| 25 to 29 Minutes | 29 | 6.8% |
| 30 to 34 Minutes | 35 | 8.2% |
| 35 to 39 Minutes | 0 | 0.0% |
| 40 to 44 Minutes | 10 | 2.3% |
| 45 to 59 Minutes | 26 | 6.1% |
| 60 to 89 Minutes | 60 | 14.0% |
| 90 or more Minutes | 1 | 0.2% |
Commute Time by Sex in Maysville
The most common commute times in Maysville are 60 to 89 minutes (53 commuters, 21.9%) for males and 15 to 19 minutes (54 commuters, 28.9%) for females.
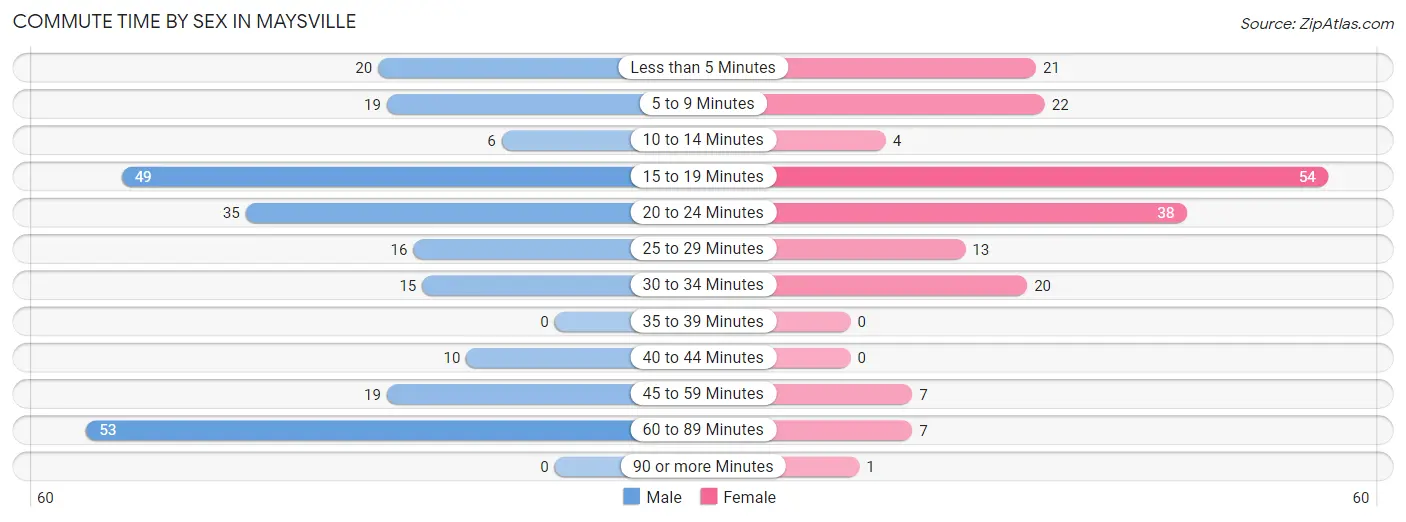
| Commute Time | Male | Female |
| Less than 5 Minutes | 20 (8.3%) | 21 (11.2%) |
| 5 to 9 Minutes | 19 (7.9%) | 22 (11.8%) |
| 10 to 14 Minutes | 6 (2.5%) | 4 (2.1%) |
| 15 to 19 Minutes | 49 (20.3%) | 54 (28.9%) |
| 20 to 24 Minutes | 35 (14.5%) | 38 (20.3%) |
| 25 to 29 Minutes | 16 (6.6%) | 13 (7.0%) |
| 30 to 34 Minutes | 15 (6.2%) | 20 (10.7%) |
| 35 to 39 Minutes | 0 (0.0%) | 0 (0.0%) |
| 40 to 44 Minutes | 10 (4.1%) | 0 (0.0%) |
| 45 to 59 Minutes | 19 (7.9%) | 7 (3.7%) |
| 60 to 89 Minutes | 53 (21.9%) | 7 (3.7%) |
| 90 or more Minutes | 0 (0.0%) | 1 (0.5%) |
Time of Departure to Work by Sex in Maysville
The most frequent times of departure to work in Maysville are 6:00 AM to 6:29 AM (56, 23.1%) for males and 7:00 AM to 7:29 AM (41, 21.9%) for females.
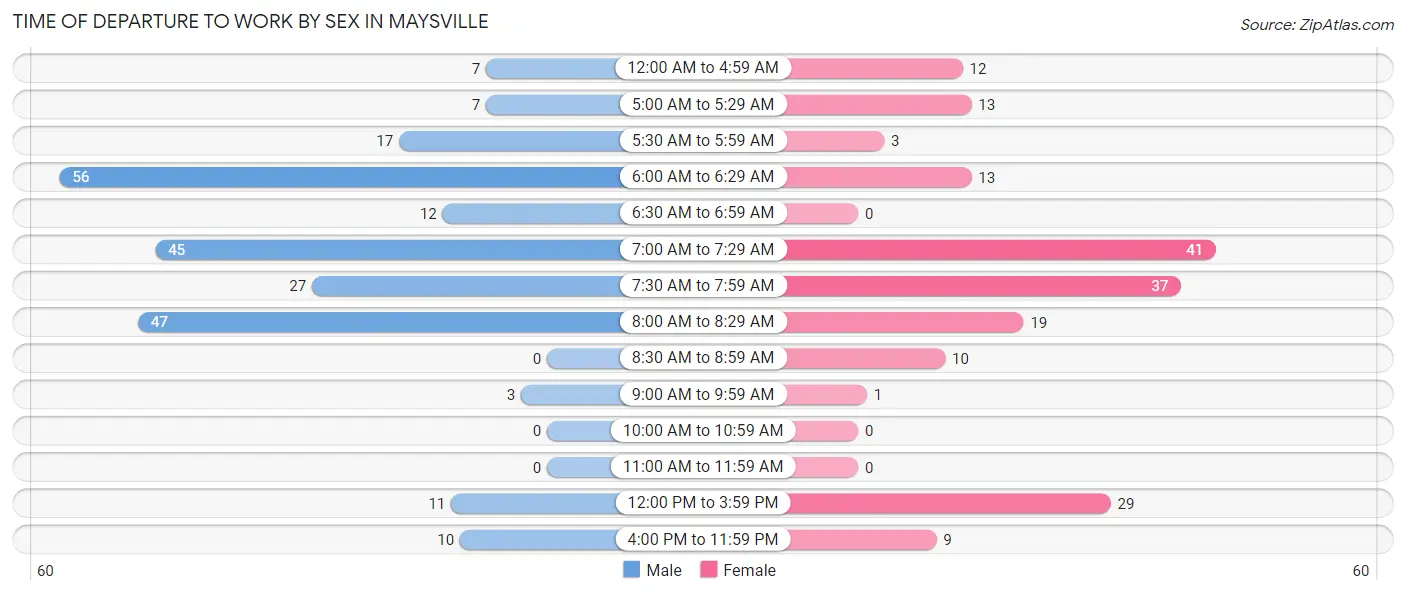
| Time of Departure | Male | Female |
| 12:00 AM to 4:59 AM | 7 (2.9%) | 12 (6.4%) |
| 5:00 AM to 5:29 AM | 7 (2.9%) | 13 (7.0%) |
| 5:30 AM to 5:59 AM | 17 (7.0%) | 3 (1.6%) |
| 6:00 AM to 6:29 AM | 56 (23.1%) | 13 (7.0%) |
| 6:30 AM to 6:59 AM | 12 (5.0%) | 0 (0.0%) |
| 7:00 AM to 7:29 AM | 45 (18.6%) | 41 (21.9%) |
| 7:30 AM to 7:59 AM | 27 (11.2%) | 37 (19.8%) |
| 8:00 AM to 8:29 AM | 47 (19.4%) | 19 (10.2%) |
| 8:30 AM to 8:59 AM | 0 (0.0%) | 10 (5.3%) |
| 9:00 AM to 9:59 AM | 3 (1.2%) | 1 (0.5%) |
| 10:00 AM to 10:59 AM | 0 (0.0%) | 0 (0.0%) |
| 11:00 AM to 11:59 AM | 0 (0.0%) | 0 (0.0%) |
| 12:00 PM to 3:59 PM | 11 (4.5%) | 29 (15.5%) |
| 4:00 PM to 11:59 PM | 10 (4.1%) | 9 (4.8%) |
| Total | 242 (100.0%) | 187 (100.0%) |
Housing Occupancy in Maysville
Occupancy by Ownership in Maysville
Of the total 628 dwellings in Maysville, owner-occupied units account for 488 (77.7%), while renter-occupied units make up 140 (22.3%).
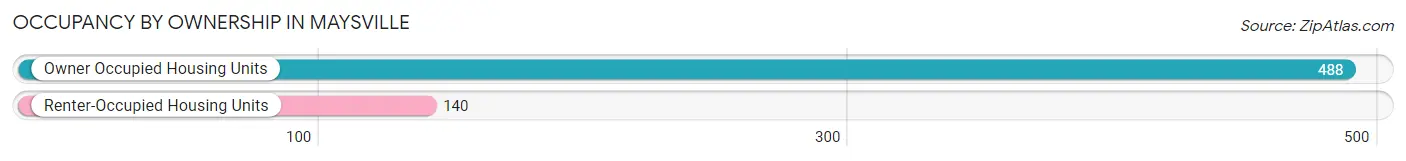
| Occupancy | # Housing Units | % Housing Units |
| Owner Occupied Housing Units | 488 | 77.7% |
| Renter-Occupied Housing Units | 140 | 22.3% |
| Total Occupied Housing Units | 628 | 100.0% |
Occupancy by Household Size in Maysville
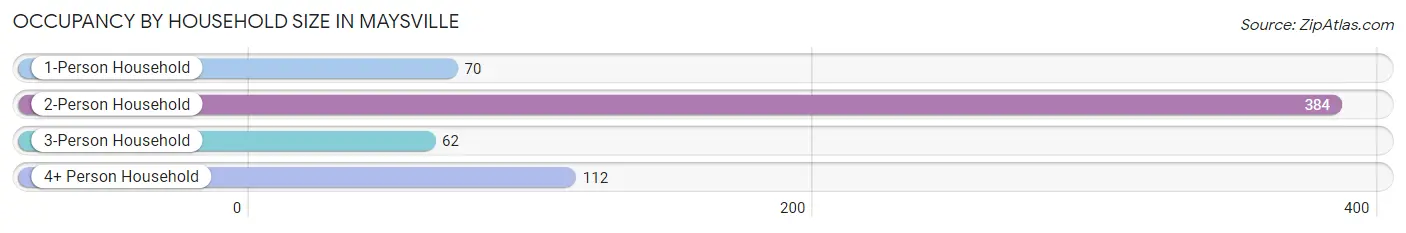
| Household Size | # Housing Units | % Housing Units |
| 1-Person Household | 70 | 11.2% |
| 2-Person Household | 384 | 61.2% |
| 3-Person Household | 62 | 9.9% |
| 4+ Person Household | 112 | 17.8% |
| Total Housing Units | 628 | 100.0% |
Occupancy by Ownership by Household Size in Maysville
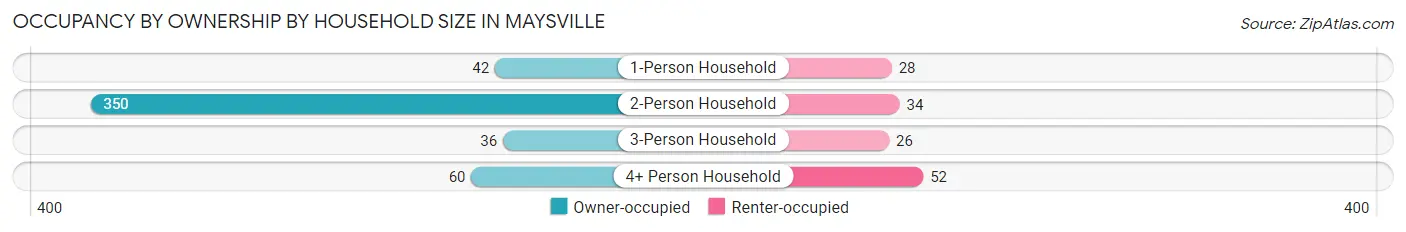
| Household Size | Owner-occupied | Renter-occupied |
| 1-Person Household | 42 (60.0%) | 28 (40.0%) |
| 2-Person Household | 350 (91.1%) | 34 (8.8%) |
| 3-Person Household | 36 (58.1%) | 26 (41.9%) |
| 4+ Person Household | 60 (53.6%) | 52 (46.4%) |
| Total Housing Units | 488 (77.7%) | 140 (22.3%) |
Occupancy by Educational Attainment in Maysville
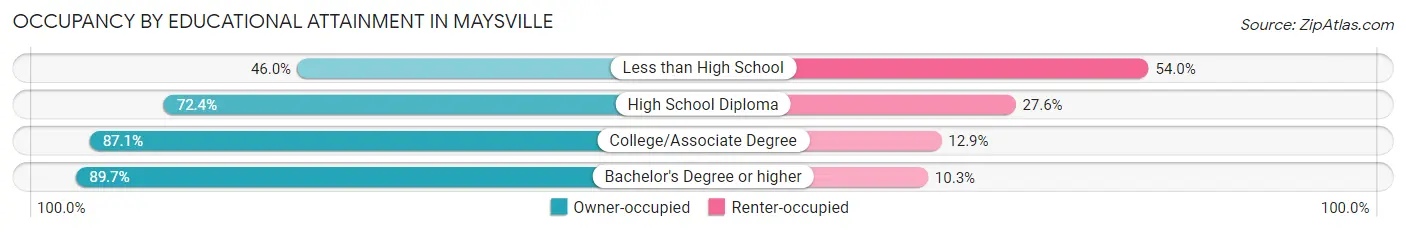
| Household Size | Owner-occupied | Renter-occupied |
| Less than High School | 23 (46.0%) | 27 (54.0%) |
| High School Diploma | 194 (72.4%) | 74 (27.6%) |
| College/Associate Degree | 236 (87.1%) | 35 (12.9%) |
| Bachelor's Degree or higher | 35 (89.7%) | 4 (10.3%) |
Occupancy by Age of Householder in Maysville
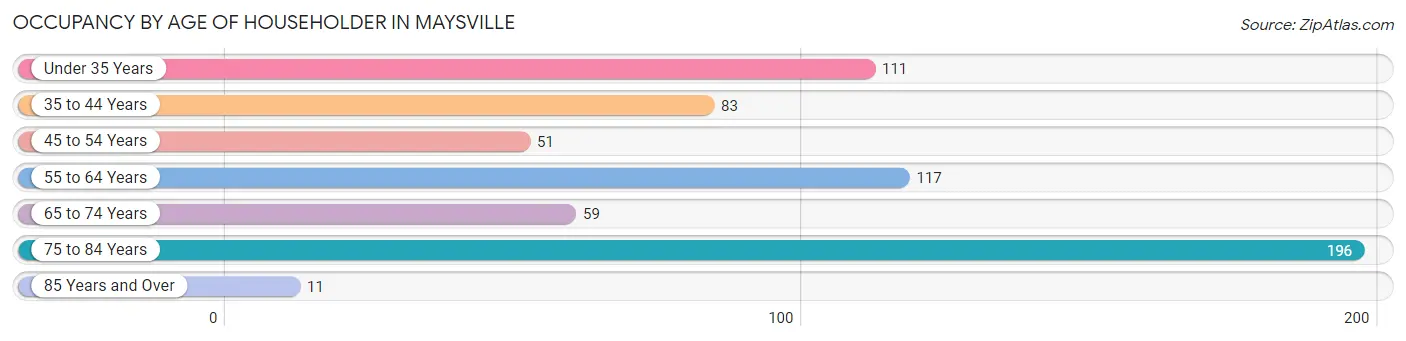
| Age Bracket | # Households | % Households |
| Under 35 Years | 111 | 17.7% |
| 35 to 44 Years | 83 | 13.2% |
| 45 to 54 Years | 51 | 8.1% |
| 55 to 64 Years | 117 | 18.6% |
| 65 to 74 Years | 59 | 9.4% |
| 75 to 84 Years | 196 | 31.2% |
| 85 Years and Over | 11 | 1.8% |
| Total | 628 | 100.0% |
Housing Finances in Maysville
Median Income by Occupancy in Maysville
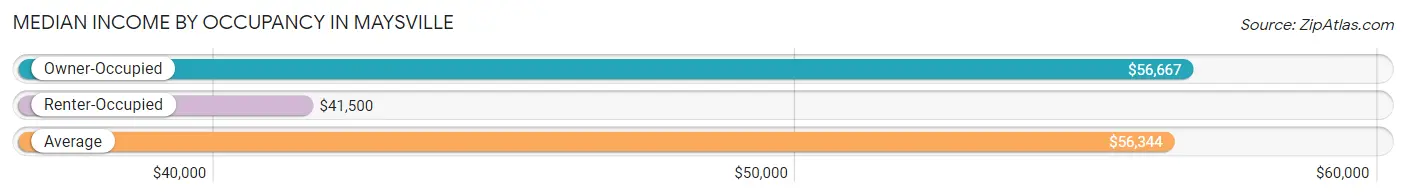
| Occupancy Type | # Households | Median Income |
| Owner-Occupied | 488 (77.7%) | $56,667 |
| Renter-Occupied | 140 (22.3%) | $41,500 |
| Average | 628 (100.0%) | $56,344 |
Occupancy by Householder Income Bracket in Maysville
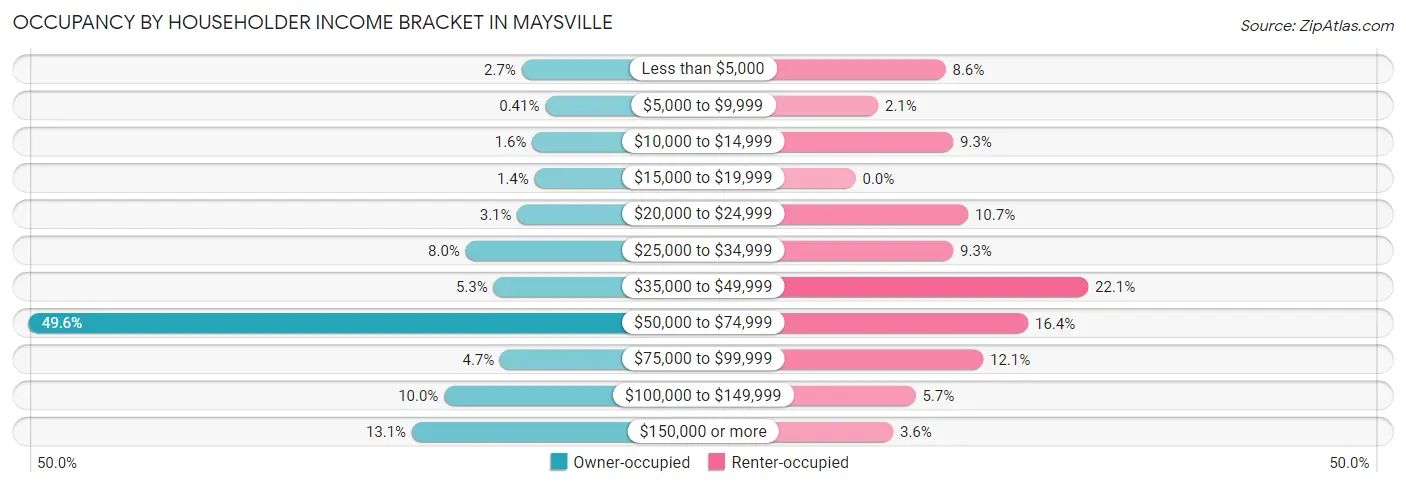
| Income Bracket | Owner-occupied | Renter-occupied |
| Less than $5,000 | 13 (2.7%) | 12 (8.6%) |
| $5,000 to $9,999 | 2 (0.4%) | 3 (2.1%) |
| $10,000 to $14,999 | 8 (1.6%) | 13 (9.3%) |
| $15,000 to $19,999 | 7 (1.4%) | 0 (0.0%) |
| $20,000 to $24,999 | 15 (3.1%) | 15 (10.7%) |
| $25,000 to $34,999 | 39 (8.0%) | 13 (9.3%) |
| $35,000 to $49,999 | 26 (5.3%) | 31 (22.1%) |
| $50,000 to $74,999 | 242 (49.6%) | 23 (16.4%) |
| $75,000 to $99,999 | 23 (4.7%) | 17 (12.1%) |
| $100,000 to $149,999 | 49 (10.0%) | 8 (5.7%) |
| $150,000 or more | 64 (13.1%) | 5 (3.6%) |
| Total | 488 (100.0%) | 140 (100.0%) |
Monthly Housing Cost Tiers in Maysville
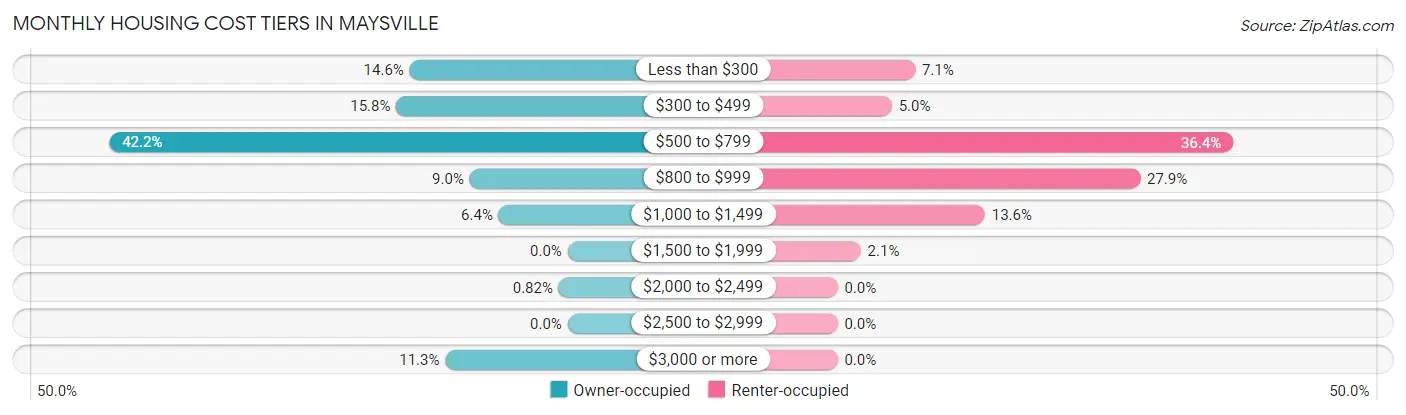
| Monthly Cost | Owner-occupied | Renter-occupied |
| Less than $300 | 71 (14.5%) | 10 (7.1%) |
| $300 to $499 | 77 (15.8%) | 7 (5.0%) |
| $500 to $799 | 206 (42.2%) | 51 (36.4%) |
| $800 to $999 | 44 (9.0%) | 39 (27.9%) |
| $1,000 to $1,499 | 31 (6.4%) | 19 (13.6%) |
| $1,500 to $1,999 | 0 (0.0%) | 3 (2.1%) |
| $2,000 to $2,499 | 4 (0.8%) | 0 (0.0%) |
| $2,500 to $2,999 | 0 (0.0%) | 0 (0.0%) |
| $3,000 or more | 55 (11.3%) | 0 (0.0%) |
| Total | 488 (100.0%) | 140 (100.0%) |
Physical Housing Characteristics in Maysville
Housing Structures in Maysville
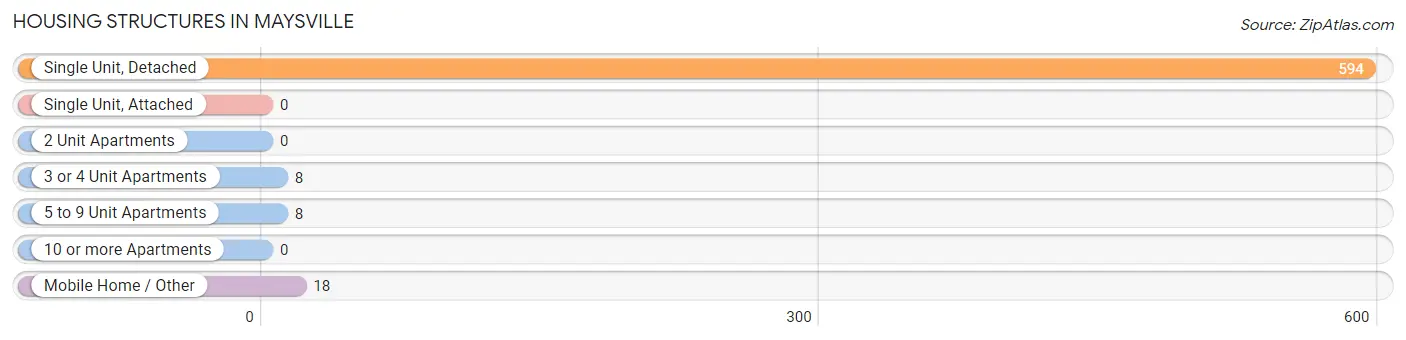
| Structure Type | # Housing Units | % Housing Units |
| Single Unit, Detached | 594 | 94.6% |
| Single Unit, Attached | 0 | 0.0% |
| 2 Unit Apartments | 0 | 0.0% |
| 3 or 4 Unit Apartments | 8 | 1.3% |
| 5 to 9 Unit Apartments | 8 | 1.3% |
| 10 or more Apartments | 0 | 0.0% |
| Mobile Home / Other | 18 | 2.9% |
| Total | 628 | 100.0% |
Housing Structures by Occupancy in Maysville
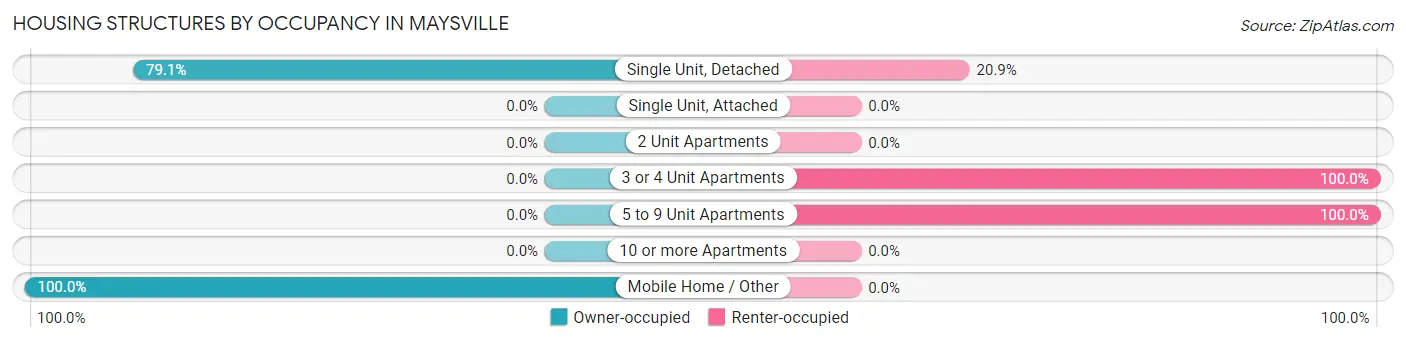
| Structure Type | Owner-occupied | Renter-occupied |
| Single Unit, Detached | 470 (79.1%) | 124 (20.9%) |
| Single Unit, Attached | 0 (0.0%) | 0 (0.0%) |
| 2 Unit Apartments | 0 (0.0%) | 0 (0.0%) |
| 3 or 4 Unit Apartments | 0 (0.0%) | 8 (100.0%) |
| 5 to 9 Unit Apartments | 0 (0.0%) | 8 (100.0%) |
| 10 or more Apartments | 0 (0.0%) | 0 (0.0%) |
| Mobile Home / Other | 18 (100.0%) | 0 (0.0%) |
| Total | 488 (77.7%) | 140 (22.3%) |
Housing Structures by Number of Rooms in Maysville
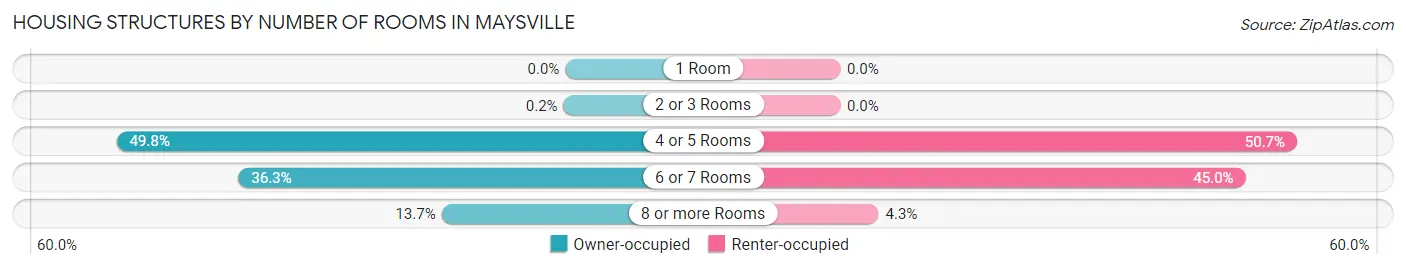
| Number of Rooms | Owner-occupied | Renter-occupied |
| 1 Room | 0 (0.0%) | 0 (0.0%) |
| 2 or 3 Rooms | 1 (0.2%) | 0 (0.0%) |
| 4 or 5 Rooms | 243 (49.8%) | 71 (50.7%) |
| 6 or 7 Rooms | 177 (36.3%) | 63 (45.0%) |
| 8 or more Rooms | 67 (13.7%) | 6 (4.3%) |
| Total | 488 (100.0%) | 140 (100.0%) |
Housing Structure by Heating Type in Maysville
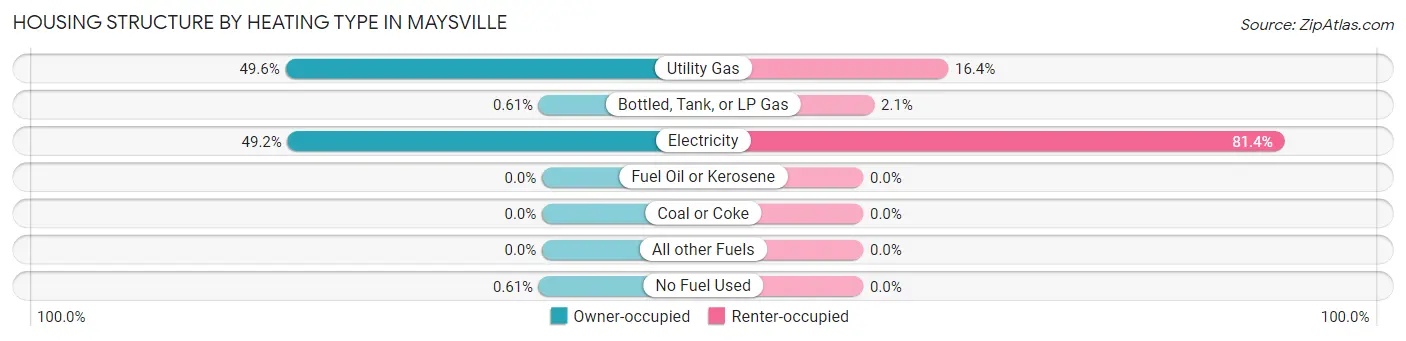
| Heating Type | Owner-occupied | Renter-occupied |
| Utility Gas | 242 (49.6%) | 23 (16.4%) |
| Bottled, Tank, or LP Gas | 3 (0.6%) | 3 (2.1%) |
| Electricity | 240 (49.2%) | 114 (81.4%) |
| Fuel Oil or Kerosene | 0 (0.0%) | 0 (0.0%) |
| Coal or Coke | 0 (0.0%) | 0 (0.0%) |
| All other Fuels | 0 (0.0%) | 0 (0.0%) |
| No Fuel Used | 3 (0.6%) | 0 (0.0%) |
| Total | 488 (100.0%) | 140 (100.0%) |
Household Vehicle Usage in Maysville
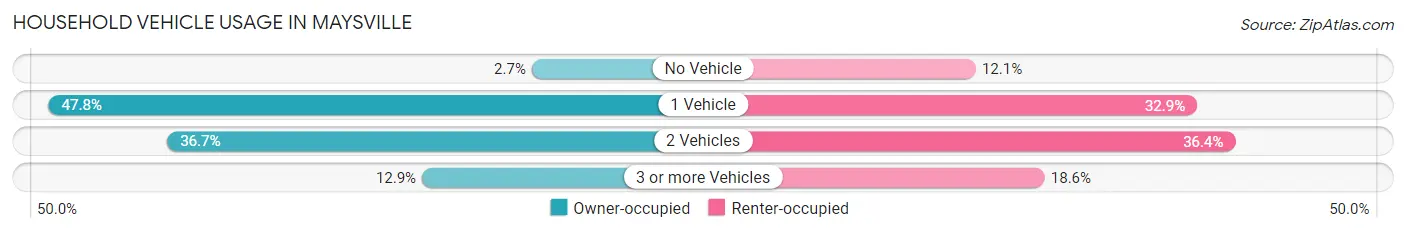
| Vehicles per Household | Owner-occupied | Renter-occupied |
| No Vehicle | 13 (2.7%) | 17 (12.1%) |
| 1 Vehicle | 233 (47.7%) | 46 (32.9%) |
| 2 Vehicles | 179 (36.7%) | 51 (36.4%) |
| 3 or more Vehicles | 63 (12.9%) | 26 (18.6%) |
| Total | 488 (100.0%) | 140 (100.0%) |
Real Estate & Mortgages in Maysville
Real Estate and Mortgage Overview in Maysville
| Characteristic | Without Mortgage | With Mortgage |
| Housing Units | 340 | 148 |
| Median Property Value | $128,400 | $108,300 |
| Median Household Income | $55,934 | $53 |
| Monthly Housing Costs | $516 | $46 |
| Real Estate Taxes | $1,049 | $0 |
Property Value by Mortgage Status in Maysville
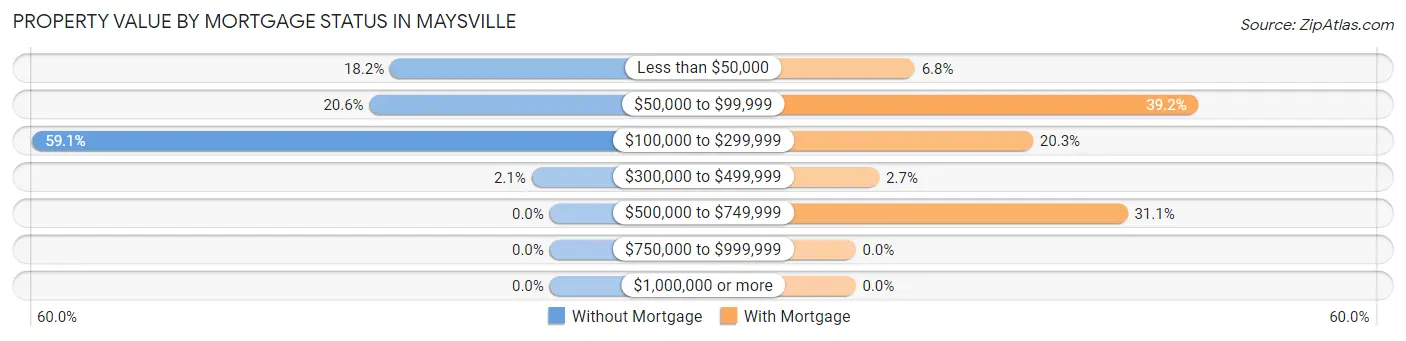
| Property Value | Without Mortgage | With Mortgage |
| Less than $50,000 | 62 (18.2%) | 10 (6.8%) |
| $50,000 to $99,999 | 70 (20.6%) | 58 (39.2%) |
| $100,000 to $299,999 | 201 (59.1%) | 30 (20.3%) |
| $300,000 to $499,999 | 7 (2.1%) | 4 (2.7%) |
| $500,000 to $749,999 | 0 (0.0%) | 46 (31.1%) |
| $750,000 to $999,999 | 0 (0.0%) | 0 (0.0%) |
| $1,000,000 or more | 0 (0.0%) | 0 (0.0%) |
| Total | 340 (100.0%) | 148 (100.0%) |
Household Income by Mortgage Status in Maysville
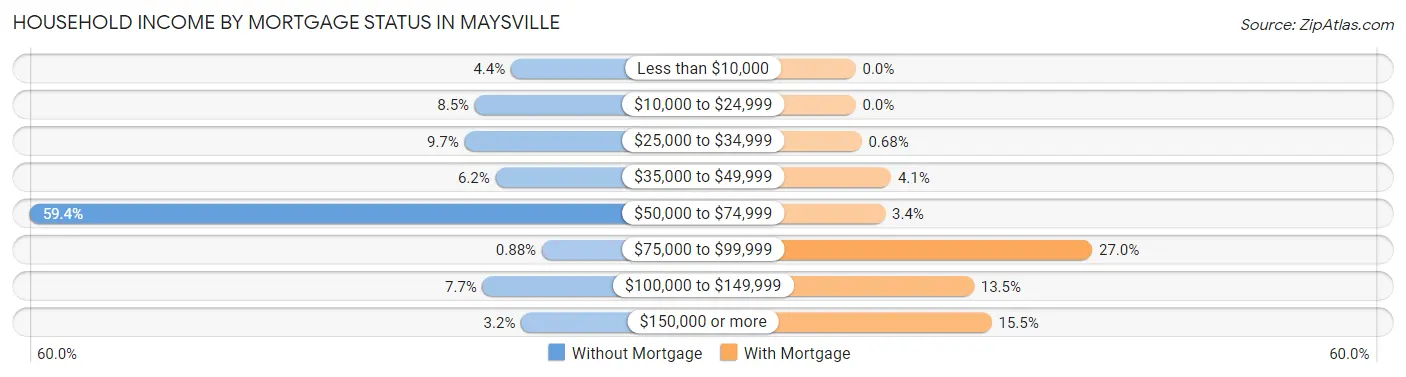
| Household Income | Without Mortgage | With Mortgage |
| Less than $10,000 | 15 (4.4%) | 0 (0.0%) |
| $10,000 to $24,999 | 29 (8.5%) | 0 (0.0%) |
| $25,000 to $34,999 | 33 (9.7%) | 1 (0.7%) |
| $35,000 to $49,999 | 21 (6.2%) | 6 (4.1%) |
| $50,000 to $74,999 | 202 (59.4%) | 5 (3.4%) |
| $75,000 to $99,999 | 3 (0.9%) | 40 (27.0%) |
| $100,000 to $149,999 | 26 (7.6%) | 20 (13.5%) |
| $150,000 or more | 11 (3.2%) | 23 (15.5%) |
| Total | 340 (100.0%) | 148 (100.0%) |
Property Value to Household Income Ratio in Maysville
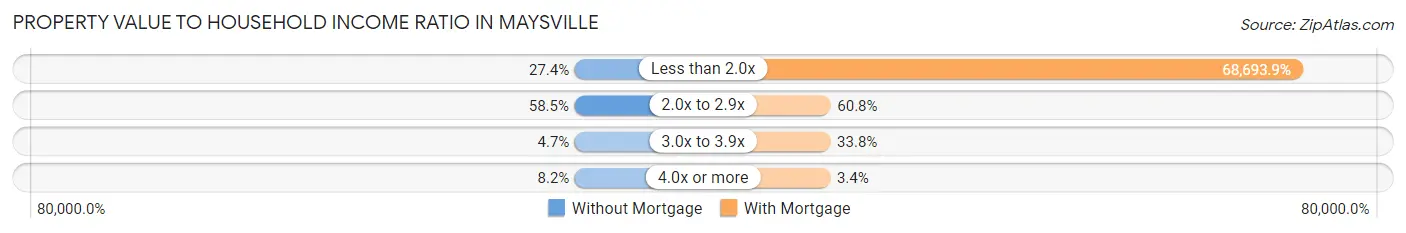
| Value-to-Income Ratio | Without Mortgage | With Mortgage |
| Less than 2.0x | 93 (27.4%) | 101,667 (68,693.9%) |
| 2.0x to 2.9x | 199 (58.5%) | 90 (60.8%) |
| 3.0x to 3.9x | 16 (4.7%) | 50 (33.8%) |
| 4.0x or more | 28 (8.2%) | 5 (3.4%) |
| Total | 340 (100.0%) | 148 (100.0%) |
Real Estate Taxes by Mortgage Status in Maysville
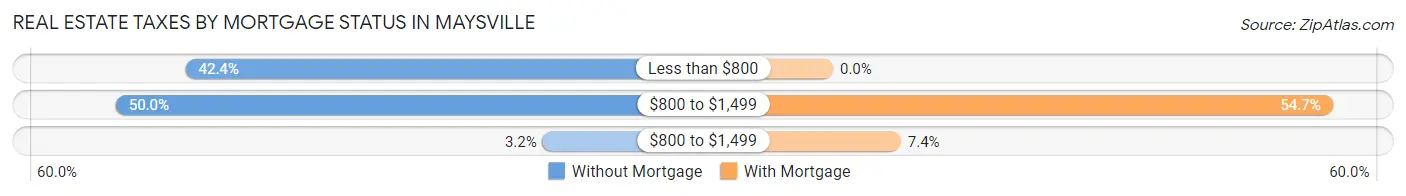
| Property Taxes | Without Mortgage | With Mortgage |
| Less than $800 | 144 (42.3%) | 0 (0.0%) |
| $800 to $1,499 | 170 (50.0%) | 81 (54.7%) |
| $800 to $1,499 | 11 (3.2%) | 11 (7.4%) |
| Total | 340 (100.0%) | 148 (100.0%) |
Health & Disability in Maysville
Health Insurance Coverage by Age in Maysville
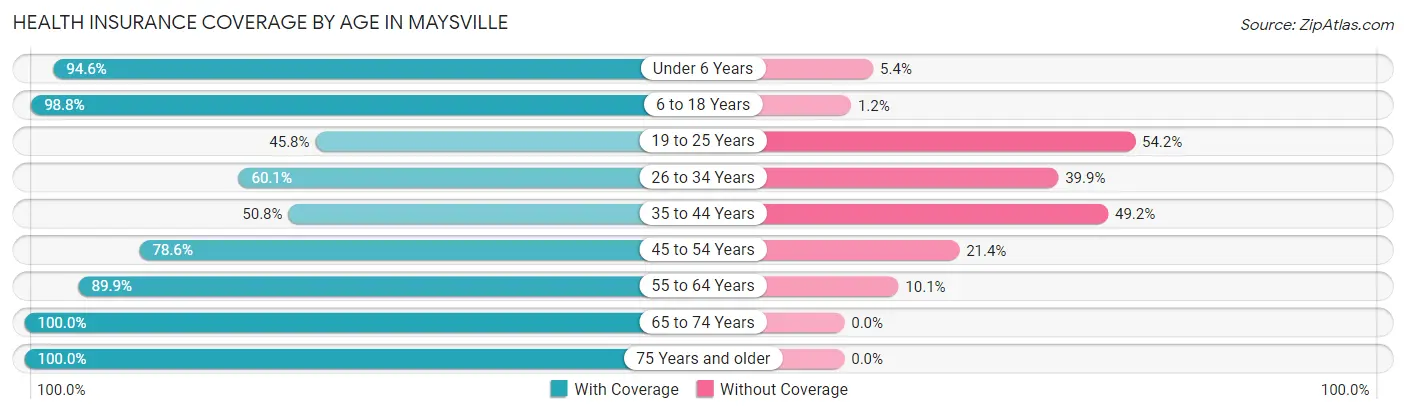
| Age Bracket | With Coverage | Without Coverage |
| Under 6 Years | 88 (94.6%) | 5 (5.4%) |
| 6 to 18 Years | 239 (98.8%) | 3 (1.2%) |
| 19 to 25 Years | 38 (45.8%) | 45 (54.2%) |
| 26 to 34 Years | 116 (60.1%) | 77 (39.9%) |
| 35 to 44 Years | 94 (50.8%) | 91 (49.2%) |
| 45 to 54 Years | 66 (78.6%) | 18 (21.4%) |
| 55 to 64 Years | 196 (89.9%) | 22 (10.1%) |
| 65 to 74 Years | 97 (100.0%) | 0 (0.0%) |
| 75 Years and older | 284 (100.0%) | 0 (0.0%) |
| Total | 1,218 (82.4%) | 261 (17.6%) |
Health Insurance Coverage by Citizenship Status in Maysville
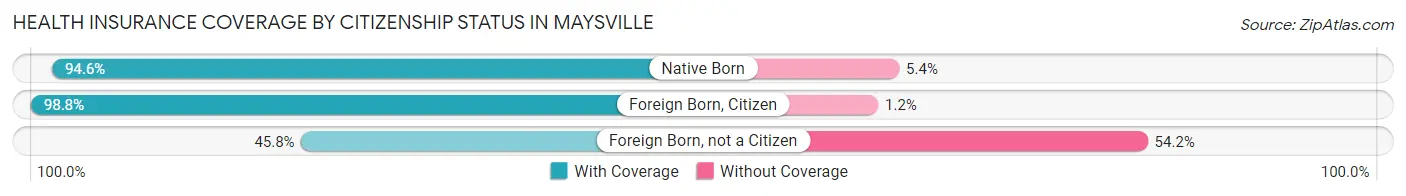
| Citizenship Status | With Coverage | Without Coverage |
| Native Born | 88 (94.6%) | 5 (5.4%) |
| Foreign Born, Citizen | 239 (98.8%) | 3 (1.2%) |
| Foreign Born, not a Citizen | 38 (45.8%) | 45 (54.2%) |
Health Insurance Coverage by Household Income in Maysville
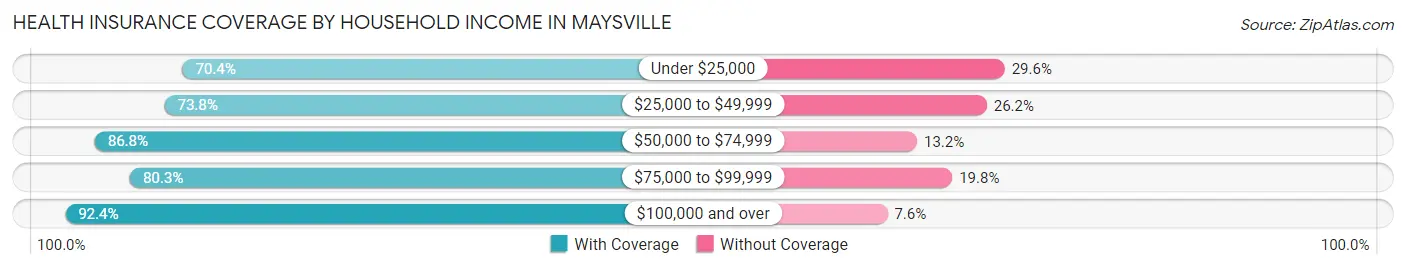
| Household Income | With Coverage | Without Coverage |
| Under $25,000 | 138 (70.4%) | 58 (29.6%) |
| $25,000 to $49,999 | 239 (73.8%) | 85 (26.2%) |
| $50,000 to $74,999 | 396 (86.8%) | 60 (13.2%) |
| $75,000 to $99,999 | 130 (80.2%) | 32 (19.8%) |
| $100,000 and over | 315 (92.4%) | 26 (7.6%) |
Public vs Private Health Insurance Coverage by Age in Maysville
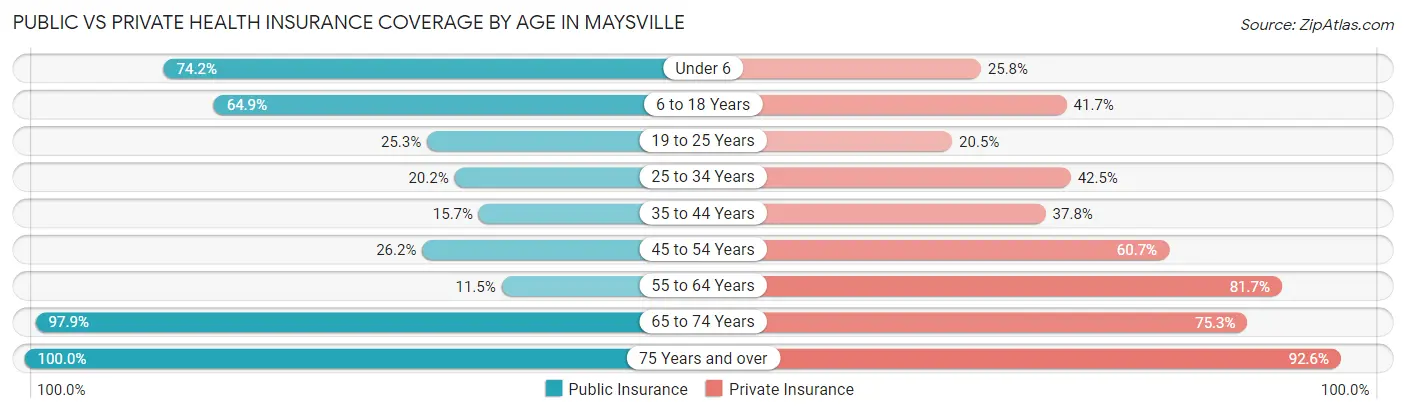
| Age Bracket | Public Insurance | Private Insurance |
| Under 6 | 69 (74.2%) | 24 (25.8%) |
| 6 to 18 Years | 157 (64.9%) | 101 (41.7%) |
| 19 to 25 Years | 21 (25.3%) | 17 (20.5%) |
| 25 to 34 Years | 39 (20.2%) | 82 (42.5%) |
| 35 to 44 Years | 29 (15.7%) | 70 (37.8%) |
| 45 to 54 Years | 22 (26.2%) | 51 (60.7%) |
| 55 to 64 Years | 25 (11.5%) | 178 (81.7%) |
| 65 to 74 Years | 95 (97.9%) | 73 (75.3%) |
| 75 Years and over | 284 (100.0%) | 263 (92.6%) |
| Total | 741 (50.1%) | 859 (58.1%) |
Disability Status by Sex by Age in Maysville
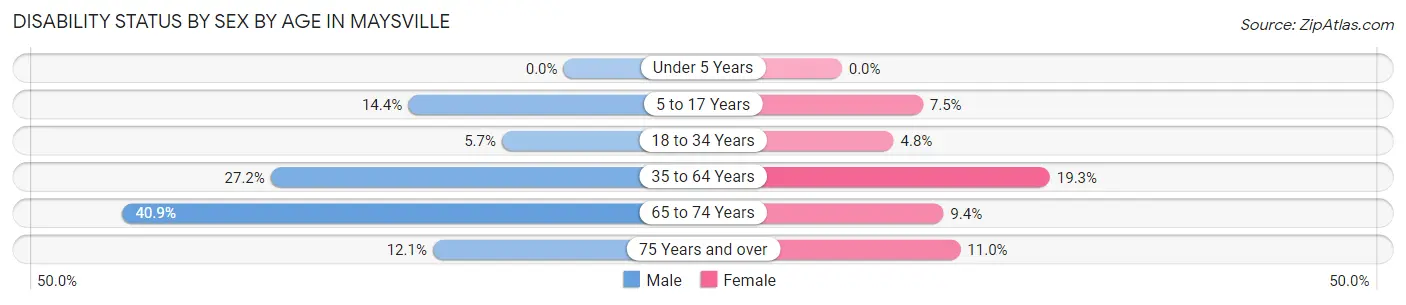
| Age Bracket | Male | Female |
| Under 5 Years | 0 (0.0%) | 0 (0.0%) |
| 5 to 17 Years | 15 (14.4%) | 10 (7.5%) |
| 18 to 34 Years | 6 (5.7%) | 9 (4.8%) |
| 35 to 64 Years | 69 (27.2%) | 45 (19.3%) |
| 65 to 74 Years | 18 (40.9%) | 5 (9.4%) |
| 75 Years and over | 8 (12.1%) | 24 (11.0%) |
Disability Class by Sex by Age in Maysville
Disability Class: Hearing Difficulty
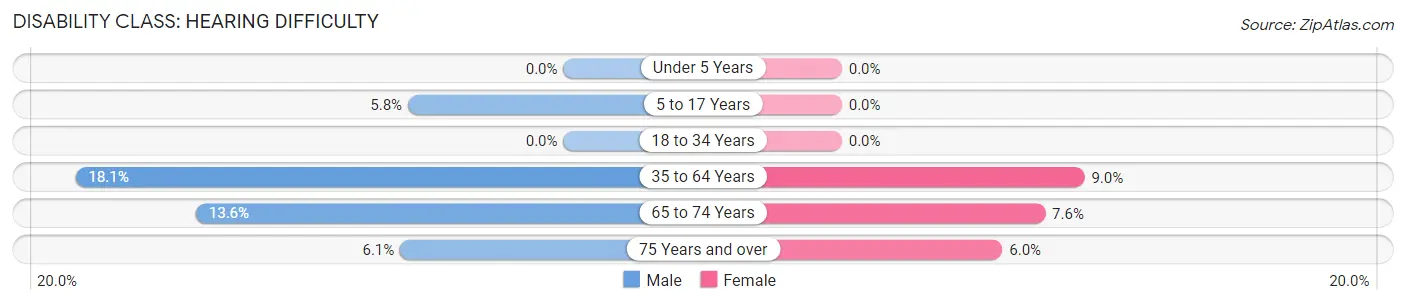
| Age Bracket | Male | Female |
| Under 5 Years | 0 (0.0%) | 0 (0.0%) |
| 5 to 17 Years | 6 (5.8%) | 0 (0.0%) |
| 18 to 34 Years | 0 (0.0%) | 0 (0.0%) |
| 35 to 64 Years | 46 (18.1%) | 21 (9.0%) |
| 65 to 74 Years | 6 (13.6%) | 4 (7.5%) |
| 75 Years and over | 4 (6.1%) | 13 (6.0%) |
Disability Class: Vision Difficulty
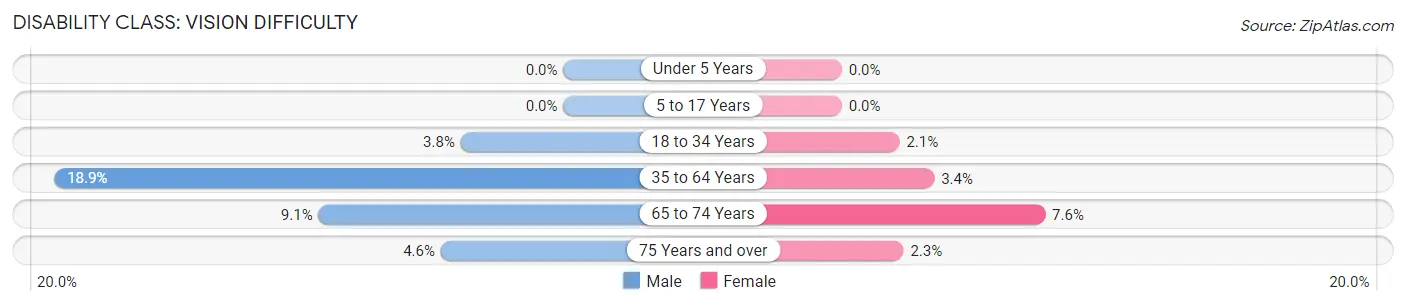
| Age Bracket | Male | Female |
| Under 5 Years | 0 (0.0%) | 0 (0.0%) |
| 5 to 17 Years | 0 (0.0%) | 0 (0.0%) |
| 18 to 34 Years | 4 (3.8%) | 4 (2.1%) |
| 35 to 64 Years | 48 (18.9%) | 8 (3.4%) |
| 65 to 74 Years | 4 (9.1%) | 4 (7.5%) |
| 75 Years and over | 3 (4.5%) | 5 (2.3%) |
Disability Class: Cognitive Difficulty
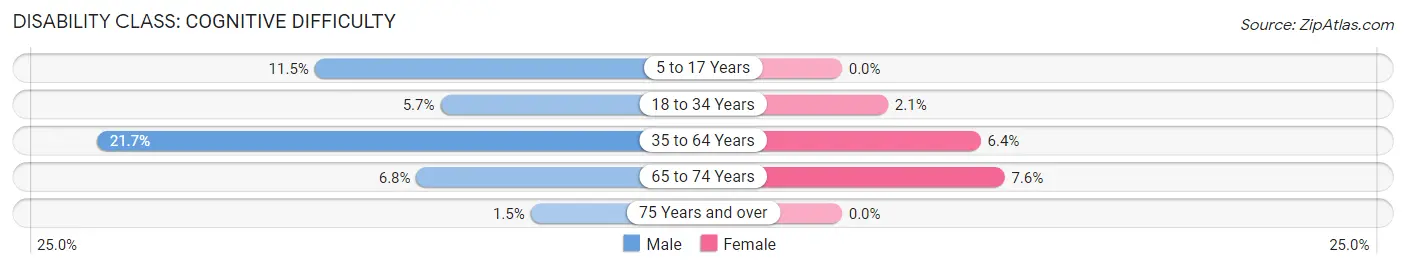
| Age Bracket | Male | Female |
| 5 to 17 Years | 12 (11.5%) | 0 (0.0%) |
| 18 to 34 Years | 6 (5.7%) | 4 (2.1%) |
| 35 to 64 Years | 55 (21.6%) | 15 (6.4%) |
| 65 to 74 Years | 3 (6.8%) | 4 (7.5%) |
| 75 Years and over | 1 (1.5%) | 0 (0.0%) |
Disability Class: Ambulatory Difficulty
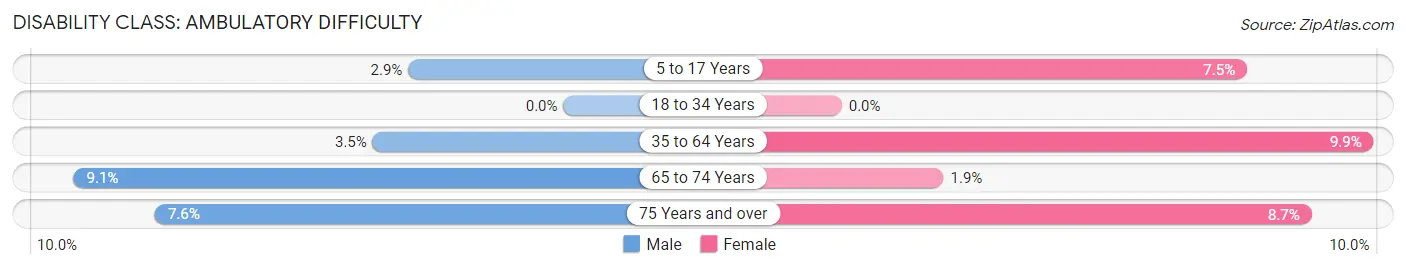
| Age Bracket | Male | Female |
| 5 to 17 Years | 3 (2.9%) | 10 (7.5%) |
| 18 to 34 Years | 0 (0.0%) | 0 (0.0%) |
| 35 to 64 Years | 9 (3.5%) | 23 (9.9%) |
| 65 to 74 Years | 4 (9.1%) | 1 (1.9%) |
| 75 Years and over | 5 (7.6%) | 19 (8.7%) |
Disability Class: Self-Care Difficulty
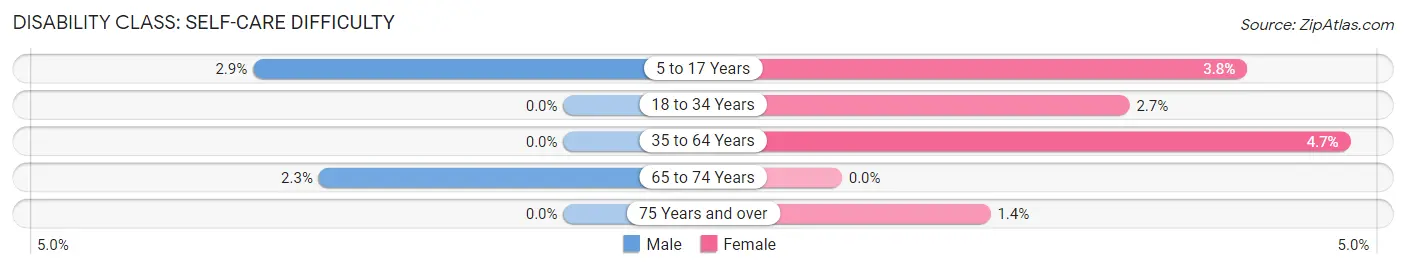
| Age Bracket | Male | Female |
| 5 to 17 Years | 3 (2.9%) | 5 (3.8%) |
| 18 to 34 Years | 0 (0.0%) | 5 (2.7%) |
| 35 to 64 Years | 0 (0.0%) | 11 (4.7%) |
| 65 to 74 Years | 1 (2.3%) | 0 (0.0%) |
| 75 Years and over | 0 (0.0%) | 3 (1.4%) |
Technology Access in Maysville
Computing Device Access in Maysville
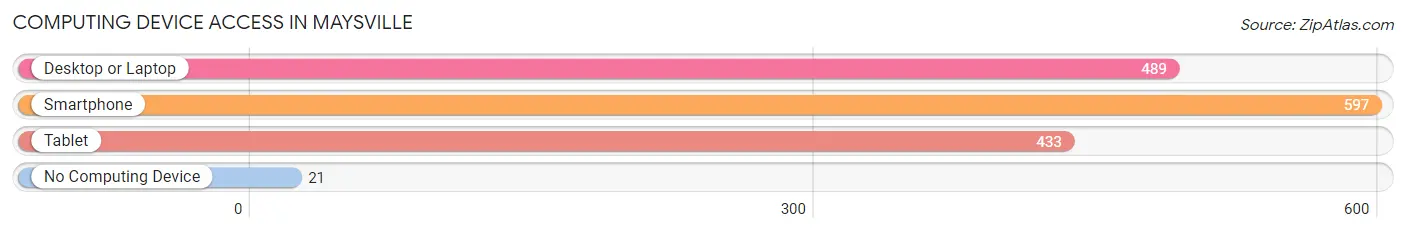
| Device Type | # Households | % Households |
| Desktop or Laptop | 489 | 77.9% |
| Smartphone | 597 | 95.1% |
| Tablet | 433 | 69.0% |
| No Computing Device | 21 | 3.3% |
| Total | 628 | 100.0% |
Internet Access in Maysville
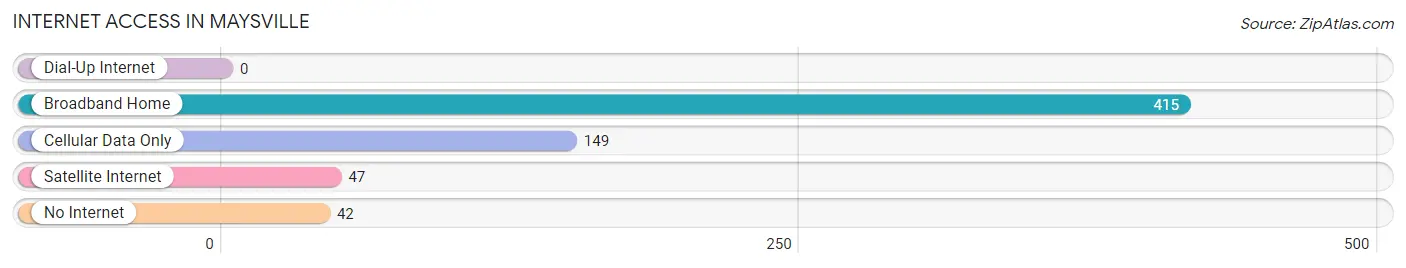
| Internet Type | # Households | % Households |
| Dial-Up Internet | 0 | 0.0% |
| Broadband Home | 415 | 66.1% |
| Cellular Data Only | 149 | 23.7% |
| Satellite Internet | 47 | 7.5% |
| No Internet | 42 | 6.7% |
| Total | 628 | 100.0% |
Maysville Summary
Maysville is a small town located in the northeastern corner of Oklahoma, in the foothills of the Ozark Mountains. It is situated in the county of LeFlore, and is part of the Fort Smith metropolitan area. The town has a population of just over 1,000 people, and is known for its rural charm and friendly atmosphere.
History
Maysville was founded in 1887 by a group of settlers from Arkansas. The town was named after the first postmaster, William Mays. The town was originally a farming community, and the main crops grown were cotton, corn, and wheat. The town also had a sawmill and a gristmill.
In the early 1900s, the town began to grow and develop. The first school was built in 1910, and the first bank opened in 1912. The town also had a newspaper, the Maysville News, which was published from 1912 to 1925.
In the 1920s, the town began to experience a period of growth and prosperity. The population increased from 500 to 1,000, and the town had several businesses, including a hotel, a movie theater, and a grocery store.
In the 1950s, the town began to decline. The population decreased, and many of the businesses closed. The town was also affected by the Great Depression and the Dust Bowl.
Geography
Maysville is located in the northeastern corner of Oklahoma, in the foothills of the Ozark Mountains. The town is situated in the county of LeFlore, and is part of the Fort Smith metropolitan area. The town is located at the intersection of US Highway 59 and State Highway 82.
The town is surrounded by rolling hills and forests. The nearest major city is Fort Smith, which is about 40 miles away. The nearest airport is the Fort Smith Regional Airport, which is about 30 miles away.
Economy
Maysville’s economy is largely based on agriculture. The main crops grown in the area are cotton, corn, and wheat. The town also has several small businesses, including a grocery store, a hardware store, and a restaurant.
The town is also home to a few manufacturing companies, including a furniture factory and a plastics factory. The town also has a few small tourist attractions, including a museum and a historic district.
Demographics
As of the 2010 census, the population of Maysville was 1,072. The racial makeup of the town was 95.3% White, 0.7% African American, 0.7% Native American, 0.3% Asian, 0.1% Pacific Islander, and 2.0% from other races. The median household income was $30,938, and the median family income was $37,500.
Conclusion
Maysville is a small town located in the northeastern corner of Oklahoma, in the foothills of the Ozark Mountains. The town has a population of just over 1,000 people, and is known for its rural charm and friendly atmosphere. The town’s economy is largely based on agriculture, and the main crops grown in the area are cotton, corn, and wheat. The town also has several small businesses, including a grocery store, a hardware store, and a restaurant. The racial makeup of the town is 95.3% White, 0.7% African American, 0.7% Native American, 0.3% Asian, 0.1% Pacific Islander, and 2.0% from other races. The median household income was $30,938, and the median family income was $37,500.
Common Questions
What is the Total Population of Maysville?
Total Population of Maysville is 1,479.
What is the Total Male Population of Maysville?
Total Male Population of Maysville is 626.
What is the Total Female Population of Maysville?
Total Female Population of Maysville is 853.
What is the Ratio of Males per 100 Females in Maysville?
There are 73.39 Males per 100 Females in Maysville.
What is the Ratio of Females per 100 Males in Maysville?
There are 136.26 Females per 100 Males in Maysville.
What is the Median Population Age in Maysville?
Median Population Age in Maysville is 40.7 Years.
What is the Average Family Size in Maysville
Average Family Size in Maysville is 2.3 People.
What is the Average Household Size in Maysville
Average Household Size in Maysville is 2.4 People.
What is Per Capita Income in Maysville?
Per Capita income in Maysville is $26,662.
What is the Median Family Income in Maysville?
Median Family Income in Maysville is $56,508.
What is the Median Household income in Maysville?
Median Household Income in Maysville is $56,344.
What is Income or Wage Gap in Maysville?
Income or Wage Gap in Maysville is 44.7%.
Women in Maysville earn 55.3 cents for every dollar earned by a man.
What is Family Income Deficit in Maysville?
Family Income Deficit in Maysville is $16,818.
Families that are below poverty line in Maysville earn $16,818 less on average than the poverty threshold level.
What is Inequality or Gini Index in Maysville?
Inequality or Gini Index in Maysville is 0.35.
How Large is the Labor Force in Maysville?
There are 543 People in the Labor Forcein in Maysville.
What is the Percentage of People in the Labor Force in Maysville?
46.0% of People are in the Labor Force in Maysville.
What is the Unemployment Rate in Maysville?
Unemployment Rate in Maysville is 0.7%.