Wagoner County, OK
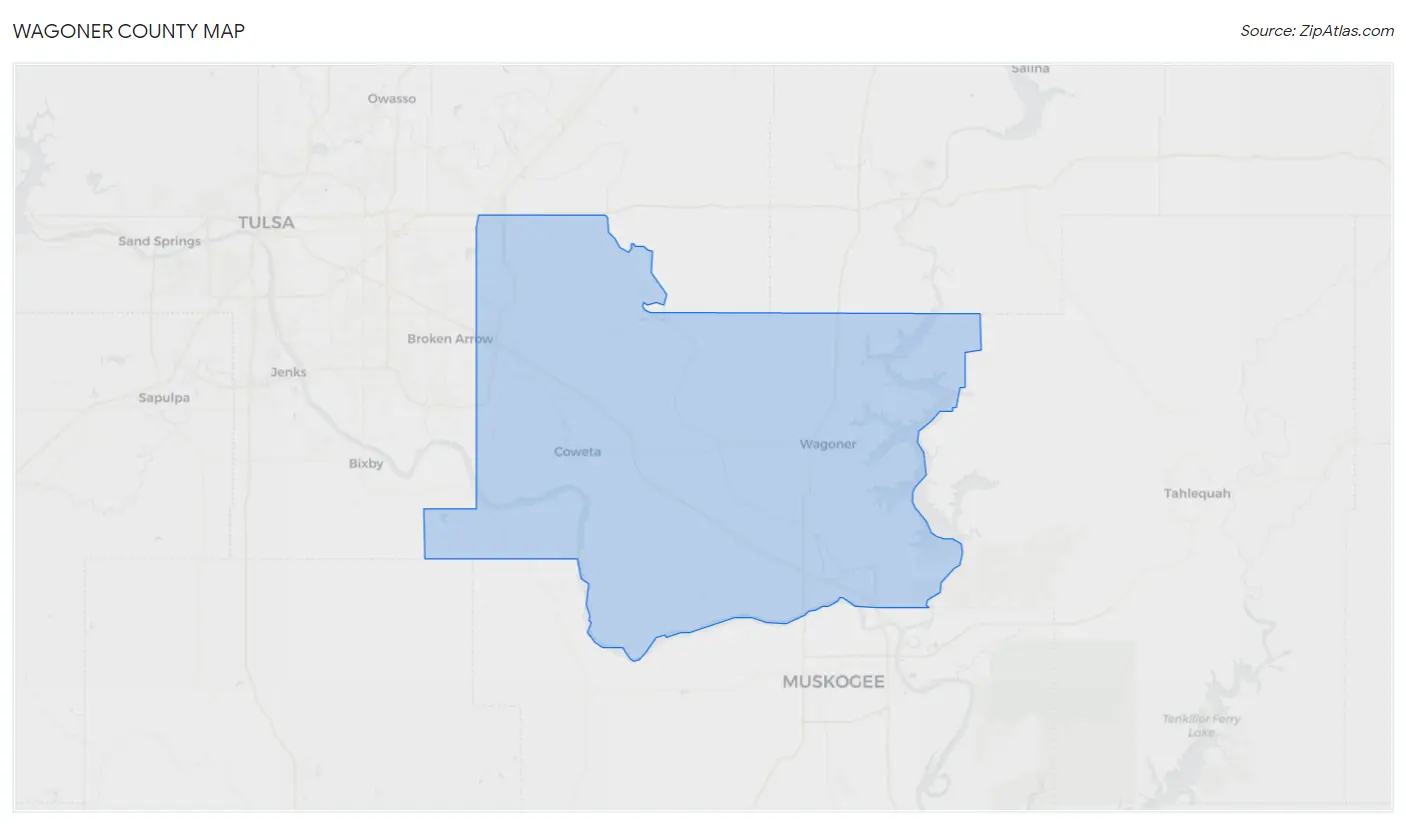
Wagoner County Map
Wagoner County Overview
82,269
TOTAL POPULATION
41,011
MALE POPULATION
41,258
FEMALE POPULATION
99.40
MALES / 100 FEMALES
100.60
FEMALES / 100 MALES
38.9
MEDIAN AGE
3.2
AVG FAMILY SIZE
2.7
AVG HOUSEHOLD SIZE
$35,675
PER CAPITA INCOME
$90,327
AVG FAMILY INCOME
$75,082
AVG HOUSEHOLD INCOME
31.5%
WAGE / INCOME GAP [ % ]
68.5¢/ $1
WAGE / INCOME GAP [ $ ]
$11,239
FAMILY INCOME DEFICIT
0.40
INEQUALITY / GINI INDEX
41,033
LABOR FORCE [ PEOPLE ]
63.3%
PERCENT IN LABOR FORCE
4.9%
UNEMPLOYMENT RATE
Wagoner County Area Codes
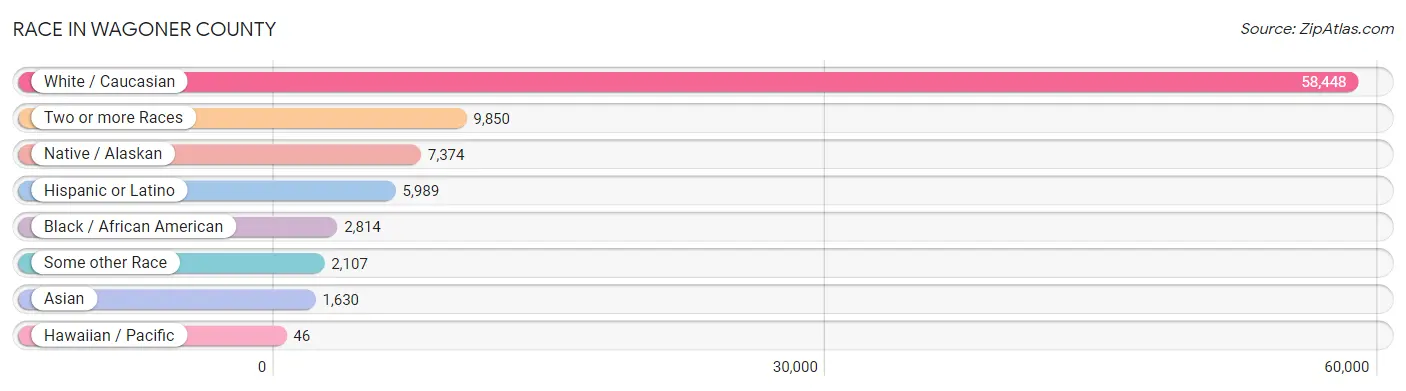
Race in Wagoner County
The most populous races in Wagoner County are White / Caucasian (58,448 | 71.0%), Two or more Races (9,850 | 12.0%), and Native / Alaskan (7,374 | 9.0%).
| Race | # Population | % Population |
| Asian | 1,630 | 2.0% |
| Black / African American | 2,814 | 3.4% |
| Hawaiian / Pacific | 46 | 0.1% |
| Hispanic or Latino | 5,989 | 7.3% |
| Native / Alaskan | 7,374 | 9.0% |
| White / Caucasian | 58,448 | 71.0% |
| Two or more Races | 9,850 | 12.0% |
| Some other Race | 2,107 | 2.6% |
| Total | 82,269 | 100.0% |
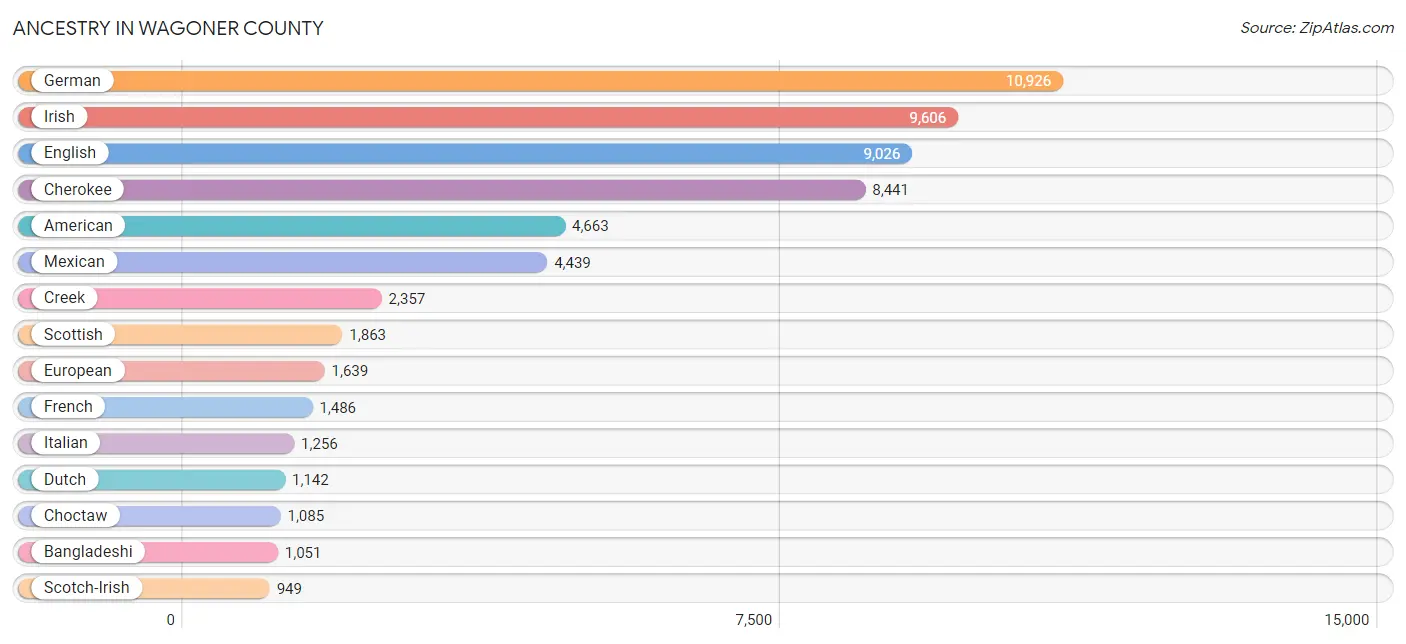
Ancestry in Wagoner County
The most populous ancestries reported in Wagoner County are German (10,926 | 13.3%), Irish (9,606 | 11.7%), English (9,026 | 11.0%), Cherokee (8,441 | 10.3%), and American (4,663 | 5.7%), together accounting for 51.9% of all Wagoner County residents.
| Ancestry | # Population | % Population |
| African | 160 | 0.2% |
| Alaska Native | 11 | 0.0% |
| American | 4,663 | 5.7% |
| Apache | 71 | 0.1% |
| Arab | 116 | 0.1% |
| Argentinean | 20 | 0.0% |
| Armenian | 12 | 0.0% |
| Australian | 60 | 0.1% |
| Austrian | 48 | 0.1% |
| Bahamian | 20 | 0.0% |
| Bangladeshi | 1,051 | 1.3% |
| Belgian | 37 | 0.0% |
| Bhutanese | 110 | 0.1% |
| Blackfeet | 46 | 0.1% |
| Bolivian | 23 | 0.0% |
| Brazilian | 26 | 0.0% |
| British | 423 | 0.5% |
| Burmese | 185 | 0.2% |
| Cajun | 112 | 0.1% |
| Canadian | 97 | 0.1% |
| Cape Verdean | 6 | 0.0% |
| Celtic | 2 | 0.0% |
| Central American | 386 | 0.5% |
| Cherokee | 8,441 | 10.3% |
| Cheyenne | 27 | 0.0% |
| Chickasaw | 119 | 0.1% |
| Chippewa | 23 | 0.0% |
| Choctaw | 1,085 | 1.3% |
| Colombian | 95 | 0.1% |
| Comanche | 3 | 0.0% |
| Costa Rican | 14 | 0.0% |
| Creek | 2,357 | 2.9% |
| Croatian | 18 | 0.0% |
| Crow | 19 | 0.0% |
| Cuban | 105 | 0.1% |
| Czech | 184 | 0.2% |
| Czechoslovakian | 20 | 0.0% |
| Danish | 146 | 0.2% |
| Delaware | 35 | 0.0% |
| Dominican | 50 | 0.1% |
| Dutch | 1,142 | 1.4% |
| Dutch West Indian | 221 | 0.3% |
| Eastern European | 169 | 0.2% |
| Ecuadorian | 22 | 0.0% |
| Egyptian | 25 | 0.0% |
| English | 9,026 | 11.0% |
| Ethiopian | 18 | 0.0% |
| European | 1,639 | 2.0% |
| Fijian | 4 | 0.0% |
| Finnish | 69 | 0.1% |
| French | 1,486 | 1.8% |
| French Canadian | 101 | 0.1% |
| German | 10,926 | 13.3% |
| Greek | 221 | 0.3% |
| Guatemalan | 62 | 0.1% |
| Haitian | 9 | 0.0% |
| Honduran | 117 | 0.1% |
| Hungarian | 81 | 0.1% |
| Icelander | 11 | 0.0% |
| Indian (Asian) | 146 | 0.2% |
| Indonesian | 37 | 0.0% |
| Iranian | 14 | 0.0% |
| Irish | 9,606 | 11.7% |
| Iroquois | 72 | 0.1% |
| Italian | 1,256 | 1.5% |
| Jamaican | 8 | 0.0% |
| Japanese | 21 | 0.0% |
| Jordanian | 4 | 0.0% |
| Kiowa | 7 | 0.0% |
| Korean | 166 | 0.2% |
| Lebanese | 64 | 0.1% |
| Lithuanian | 49 | 0.1% |
| Malaysian | 18 | 0.0% |
| Maltese | 26 | 0.0% |
| Mexican | 4,439 | 5.4% |
| Mexican American Indian | 102 | 0.1% |
| Native Hawaiian | 115 | 0.1% |
| Navajo | 14 | 0.0% |
| Nicaraguan | 9 | 0.0% |
| Nigerian | 149 | 0.2% |
| Northern European | 193 | 0.2% |
| Norwegian | 547 | 0.7% |
| Osage | 435 | 0.5% |
| Ottawa | 4 | 0.0% |
| Pakistani | 11 | 0.0% |
| Pennsylvania German | 13 | 0.0% |
| Peruvian | 47 | 0.1% |
| Polish | 674 | 0.8% |
| Portuguese | 158 | 0.2% |
| Potawatomi | 157 | 0.2% |
| Puerto Rican | 237 | 0.3% |
| Romanian | 35 | 0.0% |
| Russian | 324 | 0.4% |
| Salvadoran | 184 | 0.2% |
| Samoan | 11 | 0.0% |
| Scandinavian | 240 | 0.3% |
| Scotch-Irish | 949 | 1.1% |
| Scottish | 1,863 | 2.3% |
| Seminole | 105 | 0.1% |
| Shoshone | 69 | 0.1% |
| Sioux | 72 | 0.1% |
| Slovak | 7 | 0.0% |
| Slovene | 45 | 0.1% |
| South American | 265 | 0.3% |
| Spaniard | 106 | 0.1% |
| Spanish | 153 | 0.2% |
| Sri Lankan | 70 | 0.1% |
| Subsaharan African | 380 | 0.5% |
| Swedish | 658 | 0.8% |
| Swiss | 152 | 0.2% |
| Thai | 160 | 0.2% |
| Turkish | 32 | 0.0% |
| Ugandan | 35 | 0.0% |
| Ukrainian | 87 | 0.1% |
| Uruguayan | 5 | 0.0% |
| Venezuelan | 53 | 0.1% |
| Welsh | 411 | 0.5% |
| West Indian | 50 | 0.1% |
| Yugoslavian | 9 | 0.0% | View All 119 Rows |
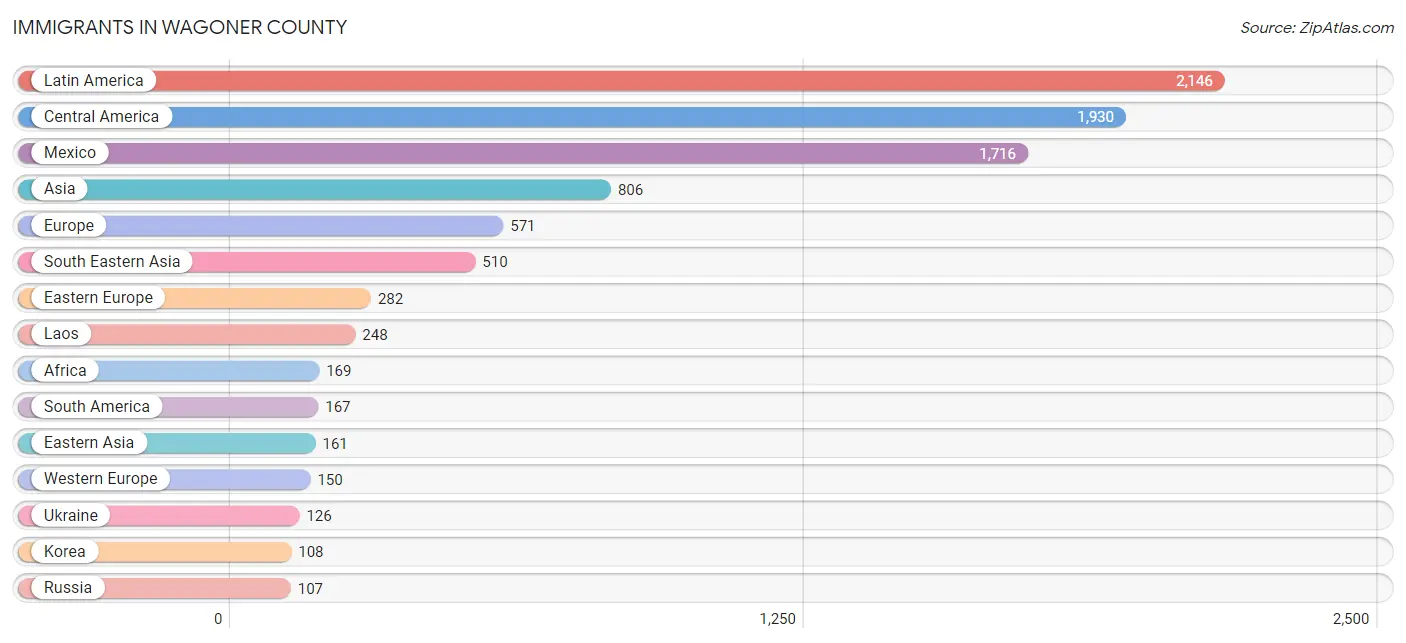
Immigrants in Wagoner County
The most numerous immigrant groups reported in Wagoner County came from Latin America (2,146 | 2.6%), Central America (1,930 | 2.4%), Mexico (1,716 | 2.1%), Asia (806 | 1.0%), and Europe (571 | 0.7%), together accounting for 8.7% of all Wagoner County residents.
| Immigration Origin | # Population | % Population |
| Africa | 169 | 0.2% |
| Asia | 806 | 1.0% |
| Australia | 8 | 0.0% |
| Bahamas | 18 | 0.0% |
| Barbados | 4 | 0.0% |
| Belarus | 3 | 0.0% |
| Bolivia | 11 | 0.0% |
| Brazil | 16 | 0.0% |
| Cambodia | 18 | 0.0% |
| Cameroon | 47 | 0.1% |
| Canada | 79 | 0.1% |
| Caribbean | 49 | 0.1% |
| Central America | 1,930 | 2.4% |
| China | 46 | 0.1% |
| Colombia | 25 | 0.0% |
| Costa Rica | 14 | 0.0% |
| Czechoslovakia | 6 | 0.0% |
| Dominican Republic | 18 | 0.0% |
| Eastern Africa | 38 | 0.1% |
| Eastern Asia | 161 | 0.2% |
| Eastern Europe | 282 | 0.3% |
| Ecuador | 22 | 0.0% |
| El Salvador | 83 | 0.1% |
| England | 28 | 0.0% |
| Eritrea | 13 | 0.0% |
| Ethiopia | 5 | 0.0% |
| Europe | 571 | 0.7% |
| France | 58 | 0.1% |
| Germany | 92 | 0.1% |
| Guatemala | 9 | 0.0% |
| Haiti | 9 | 0.0% |
| Honduras | 99 | 0.1% |
| Hong Kong | 4 | 0.0% |
| India | 4 | 0.0% |
| Ireland | 1 | 0.0% |
| Italy | 4 | 0.0% |
| Japan | 7 | 0.0% |
| Jordan | 4 | 0.0% |
| Korea | 108 | 0.1% |
| Laos | 248 | 0.3% |
| Latin America | 2,146 | 2.6% |
| Lebanon | 6 | 0.0% |
| Mexico | 1,716 | 2.1% |
| Middle Africa | 47 | 0.1% |
| Moldova | 34 | 0.0% |
| Nicaragua | 9 | 0.0% |
| Nigeria | 77 | 0.1% |
| Northern Africa | 7 | 0.0% |
| Northern Europe | 94 | 0.1% |
| Norway | 10 | 0.0% |
| Oceania | 8 | 0.0% |
| Pakistan | 72 | 0.1% |
| Peru | 25 | 0.0% |
| Philippines | 72 | 0.1% |
| Poland | 6 | 0.0% |
| Portugal | 15 | 0.0% |
| Russia | 107 | 0.1% |
| South America | 167 | 0.2% |
| South Central Asia | 96 | 0.1% |
| South Eastern Asia | 510 | 0.6% |
| Southern Europe | 45 | 0.1% |
| Spain | 26 | 0.0% |
| Sri Lanka | 14 | 0.0% |
| Thailand | 96 | 0.1% |
| Turkey | 19 | 0.0% |
| Uganda | 8 | 0.0% |
| Ukraine | 126 | 0.2% |
| Uruguay | 5 | 0.0% |
| Venezuela | 63 | 0.1% |
| Vietnam | 39 | 0.1% |
| Western Africa | 77 | 0.1% |
| Western Asia | 39 | 0.1% |
| Western Europe | 150 | 0.2% | View All 73 Rows |
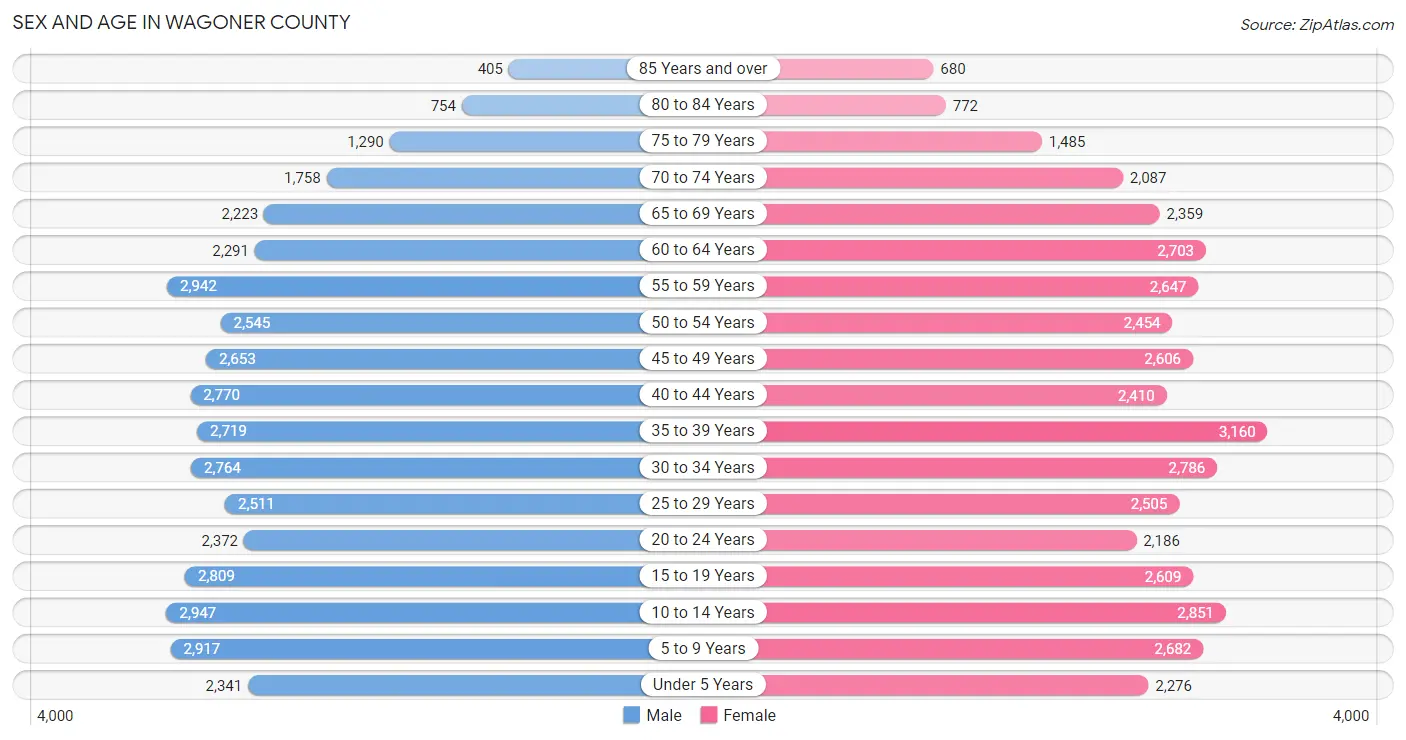
Sex and Age in Wagoner County
Sex and Age in Wagoner County
The most populous age groups in Wagoner County are 10 to 14 Years (2,947 | 7.2%) for men and 35 to 39 Years (3,160 | 7.7%) for women.
| Age Bracket | Male | Female |
| Under 5 Years | 2,341 (5.7%) | 2,276 (5.5%) |
| 5 to 9 Years | 2,917 (7.1%) | 2,682 (6.5%) |
| 10 to 14 Years | 2,947 (7.2%) | 2,851 (6.9%) |
| 15 to 19 Years | 2,809 (6.9%) | 2,609 (6.3%) |
| 20 to 24 Years | 2,372 (5.8%) | 2,186 (5.3%) |
| 25 to 29 Years | 2,511 (6.1%) | 2,505 (6.1%) |
| 30 to 34 Years | 2,764 (6.7%) | 2,786 (6.8%) |
| 35 to 39 Years | 2,719 (6.6%) | 3,160 (7.7%) |
| 40 to 44 Years | 2,770 (6.8%) | 2,410 (5.8%) |
| 45 to 49 Years | 2,653 (6.5%) | 2,606 (6.3%) |
| 50 to 54 Years | 2,545 (6.2%) | 2,454 (5.9%) |
| 55 to 59 Years | 2,942 (7.2%) | 2,647 (6.4%) |
| 60 to 64 Years | 2,291 (5.6%) | 2,703 (6.6%) |
| 65 to 69 Years | 2,223 (5.4%) | 2,359 (5.7%) |
| 70 to 74 Years | 1,758 (4.3%) | 2,087 (5.1%) |
| 75 to 79 Years | 1,290 (3.2%) | 1,485 (3.6%) |
| 80 to 84 Years | 754 (1.8%) | 772 (1.9%) |
| 85 Years and over | 405 (1.0%) | 680 (1.7%) |
| Total | 41,011 (100.0%) | 41,258 (100.0%) |
Families and Households in Wagoner County
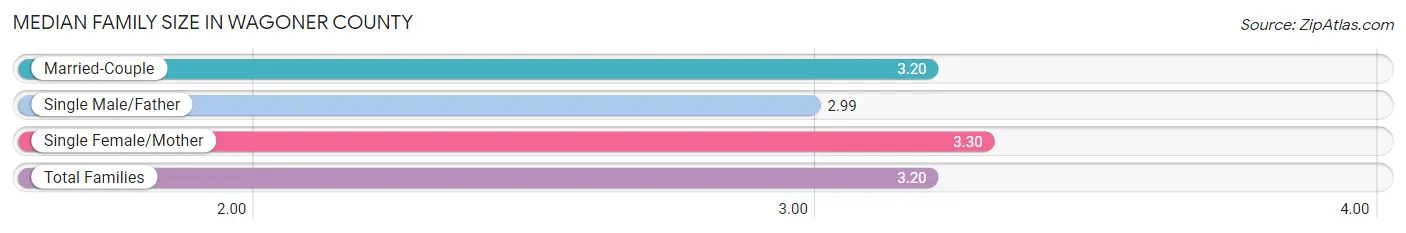
Median Family Size in Wagoner County
The median family size in Wagoner County is 3.20 persons per family, with single female/mother families (2,988 | 13.6%) accounting for the largest median family size of 3.3 persons per family. On the other hand, single male/father families (1,378 | 6.3%) represent the smallest median family size with 2.99 persons per family.
| Family Type | # Families | Family Size |
| Married-Couple | 17,573 (80.1%) | 3.20 |
| Single Male/Father | 1,378 (6.3%) | 2.99 |
| Single Female/Mother | 2,988 (13.6%) | 3.30 |
| Total Families | 21,939 (100.0%) | 3.20 |
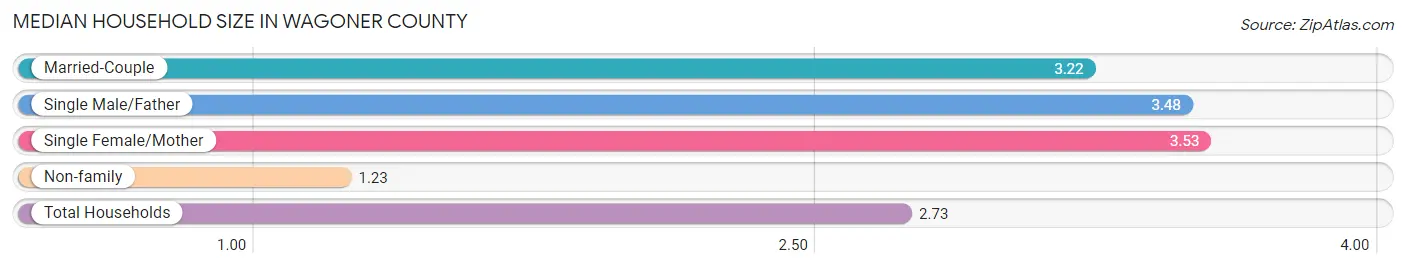
Median Household Size in Wagoner County
The median household size in Wagoner County is 2.73 persons per household, with single female/mother households (2,988 | 9.9%) accounting for the largest median household size of 3.53 persons per household. non-family households (8,147 | 27.1%) represent the smallest median household size with 1.23 persons per household.
| Household Type | # Households | Household Size |
| Married-Couple | 17,573 (58.4%) | 3.22 |
| Single Male/Father | 1,378 (4.6%) | 3.48 |
| Single Female/Mother | 2,988 (9.9%) | 3.53 |
| Non-family | 8,147 (27.1%) | 1.23 |
| Total Households | 30,086 (100.0%) | 2.73 |
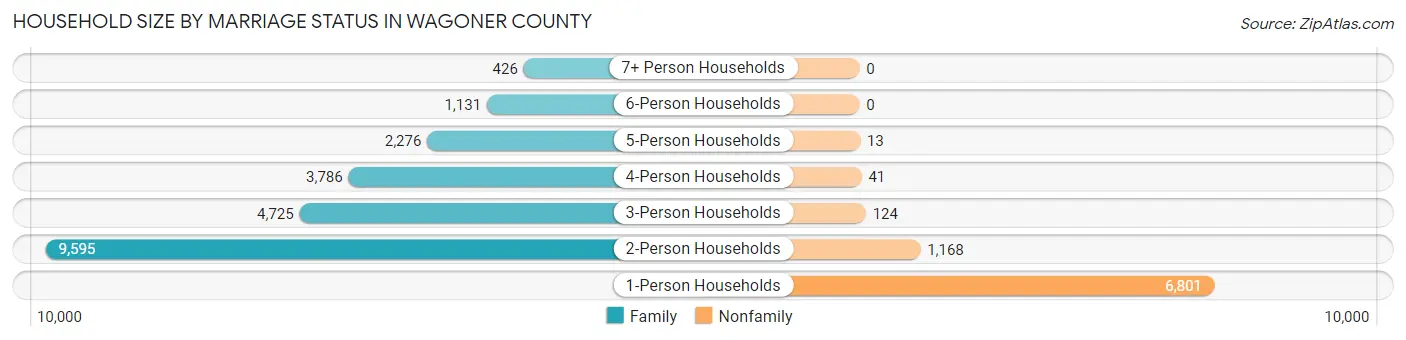
Household Size by Marriage Status in Wagoner County
Out of a total of 30,086 households in Wagoner County, 21,939 (72.9%) are family households, while 8,147 (27.1%) are nonfamily households. The most numerous type of family households are 2-person households, comprising 9,595, and the most common type of nonfamily households are 1-person households, comprising 6,801.
| Household Size | Family Households | Nonfamily Households |
| 1-Person Households | - | 6,801 (22.6%) |
| 2-Person Households | 9,595 (31.9%) | 1,168 (3.9%) |
| 3-Person Households | 4,725 (15.7%) | 124 (0.4%) |
| 4-Person Households | 3,786 (12.6%) | 41 (0.1%) |
| 5-Person Households | 2,276 (7.6%) | 13 (0.0%) |
| 6-Person Households | 1,131 (3.8%) | 0 (0.0%) |
| 7+ Person Households | 426 (1.4%) | 0 (0.0%) |
| Total | 21,939 (72.9%) | 8,147 (27.1%) |
Female Fertility in Wagoner County
Fertility by Age in Wagoner County
Average fertility rate in Wagoner County is 67.0 births per 1,000 women. Women in the age bracket of 20 to 34 years have the highest fertility rate with 122.0 births per 1,000 women. Women in the age bracket of 20 to 34 years acount for 72.3% of all women with births.
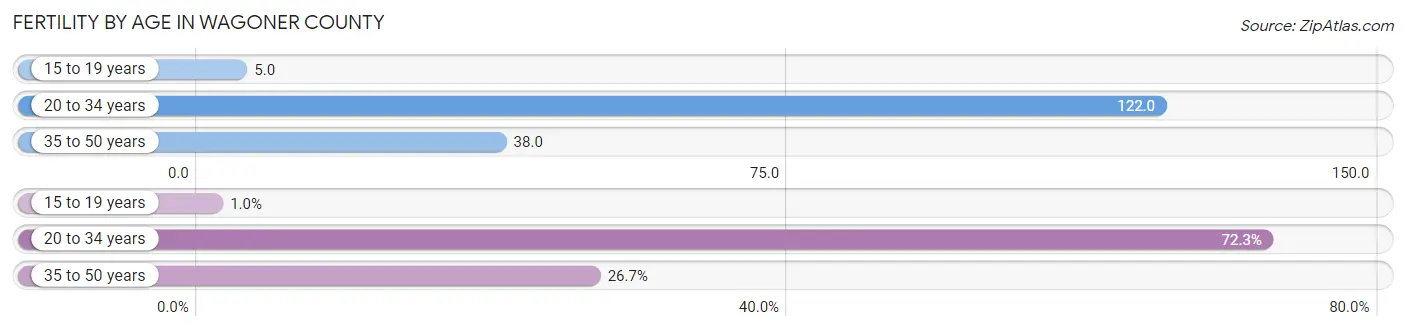
| Age Bracket | Women with Births | Births / 1,000 Women |
| 15 to 19 years | 13 (1.0%) | 5.0 |
| 20 to 34 years | 909 (72.3%) | 122.0 |
| 35 to 50 years | 335 (26.7%) | 38.0 |
| Total | 1,257 (100.0%) | 67.0 |
Fertility by Age by Marriage Status in Wagoner County
82.9% of women with births (1,257) in Wagoner County are married. The highest percentage of unmarried women with births falls into 15 to 19 years age bracket with 46.2% of them unmarried at the time of birth, while the lowest percentage of unmarried women with births belong to 20 to 34 years age bracket with 12.3% of them unmarried.
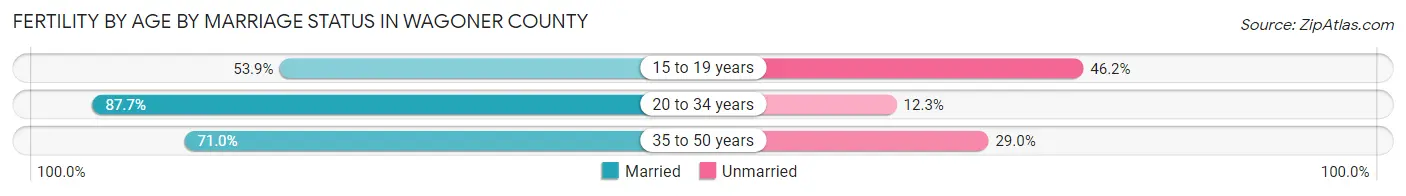
| Age Bracket | Married | Unmarried |
| 15 to 19 years | 7 (53.8%) | 6 (46.2%) |
| 20 to 34 years | 797 (87.7%) | 112 (12.3%) |
| 35 to 50 years | 238 (71.0%) | 97 (29.0%) |
| Total | 1,042 (82.9%) | 215 (17.1%) |
Fertility by Education in Wagoner County
Average fertility rate in Wagoner County is 67.0 births per 1,000 women. Women with the education attainment of graduate degree have the highest fertility rate of 137.0 births per 1,000 women, while women with the education attainment of less than high school have the lowest fertility at 13.0 births per 1,000 women. Women with the education attainment of college or associate's degree represent 34.0% of all women with births.
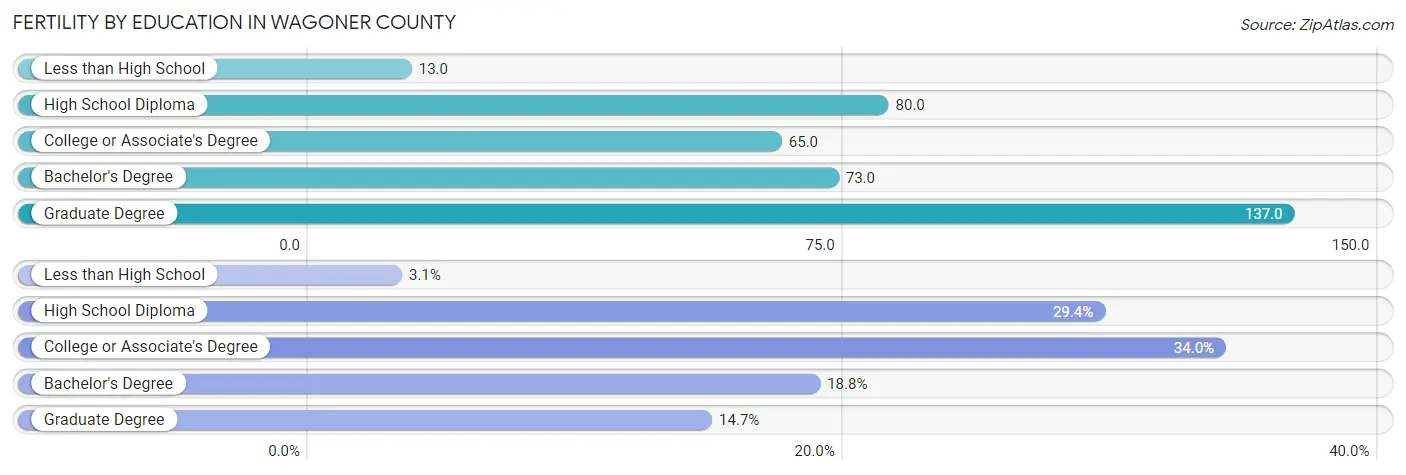
| Educational Attainment | Women with Births | Births / 1,000 Women |
| Less than High School | 39 (3.1%) | 13.0 |
| High School Diploma | 370 (29.4%) | 80.0 |
| College or Associate's Degree | 427 (34.0%) | 65.0 |
| Bachelor's Degree | 236 (18.8%) | 73.0 |
| Graduate Degree | 185 (14.7%) | 137.0 |
| Total | 1,257 (100.0%) | 67.0 |
Fertility by Education by Marriage Status in Wagoner County
17.1% of women with births in Wagoner County are unmarried. Women with the educational attainment of graduate degree are most likely to be married with 100.0% of them married at childbirth, while women with the educational attainment of less than high school are least likely to be married with 41.0% of them unmarried at childbirth.
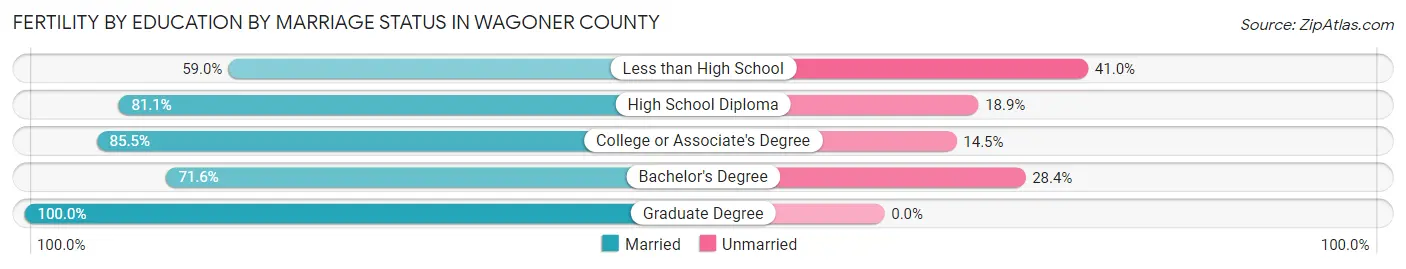
| Educational Attainment | Married | Unmarried |
| Less than High School | 23 (59.0%) | 16 (41.0%) |
| High School Diploma | 300 (81.1%) | 70 (18.9%) |
| College or Associate's Degree | 365 (85.5%) | 62 (14.5%) |
| Bachelor's Degree | 169 (71.6%) | 67 (28.4%) |
| Graduate Degree | 185 (100.0%) | 0 (0.0%) |
| Total | 1,042 (82.9%) | 215 (17.1%) |
Income in Wagoner County
Income Overview in Wagoner County
Per Capita Income in Wagoner County is $35,675, while median incomes of families and households are $90,327 and $75,082 respectively.
| Characteristic | Number | Measure |
| Per Capita Income | 82,269 | $35,675 |
| Median Family Income | 21,939 | $90,327 |
| Mean Family Income | 21,939 | $106,994 |
| Median Household Income | 30,086 | $75,082 |
| Mean Household Income | 30,086 | $93,296 |
| Income Deficit | 21,939 | $11,239 |
| Wage / Income Gap (%) | 82,269 | 31.51% |
| Wage / Income Gap ($) | 82,269 | 68.49¢ per $1 |
| Gini / Inequality Index | 82,269 | 0.40 |
Earnings by Sex in Wagoner County
Average Earnings in Wagoner County are $42,791, $50,664 for men and $34,701 for women, a difference of 31.5%.
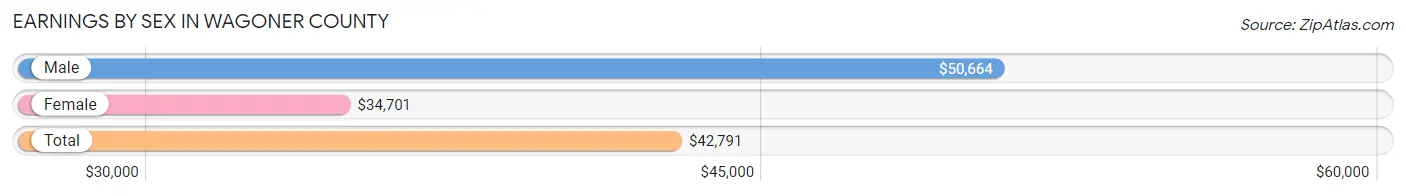
| Sex | Number | Average Earnings |
| Male | 23,270 (54.1%) | $50,664 |
| Female | 19,702 (45.9%) | $34,701 |
| Total | 42,972 (100.0%) | $42,791 |
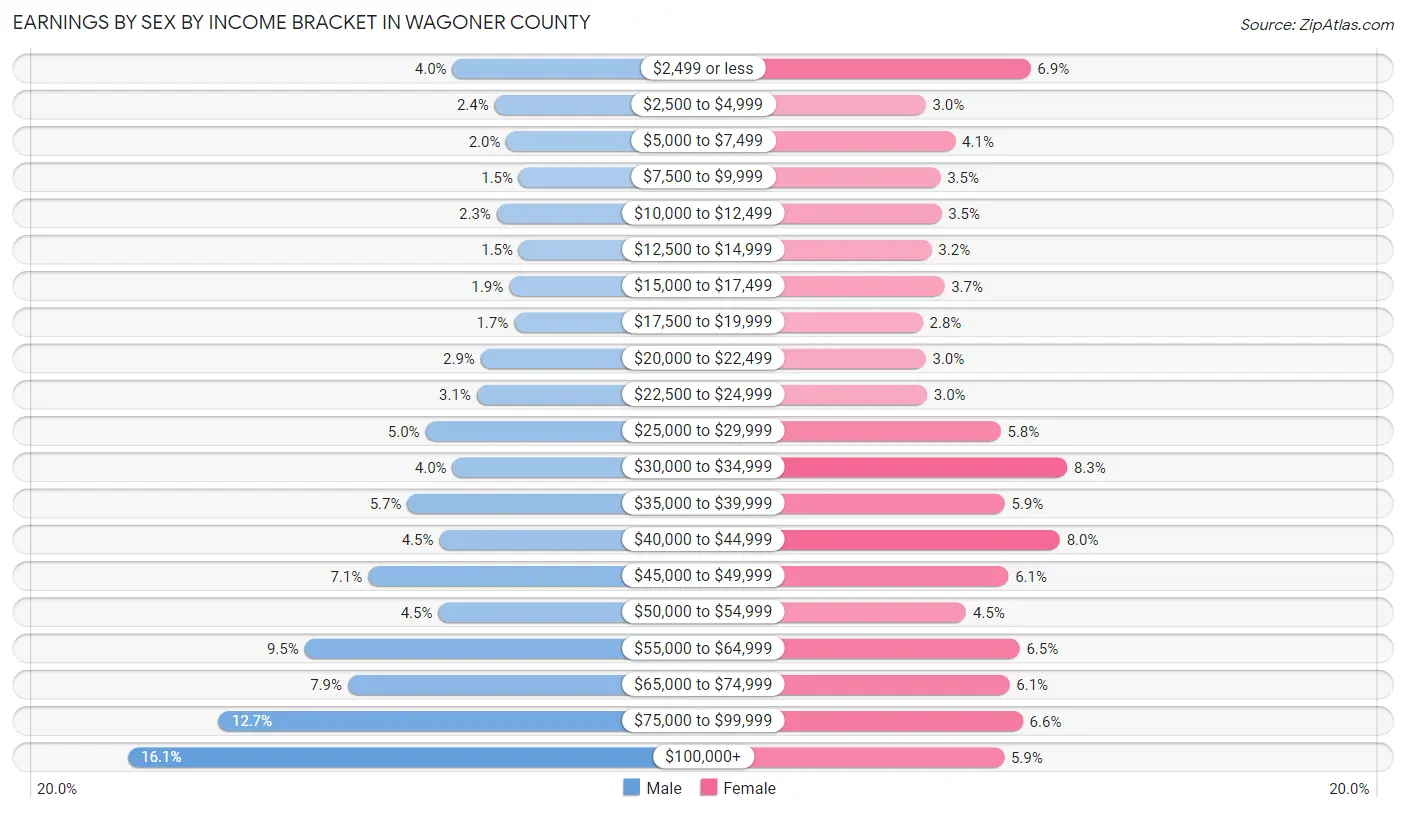
Earnings by Sex by Income Bracket in Wagoner County
The most common earnings brackets in Wagoner County are $100,000+ for men (3,752 | 16.1%) and $30,000 to $34,999 for women (1,626 | 8.3%).
| Income | Male | Female |
| $2,499 or less | 924 (4.0%) | 1,356 (6.9%) |
| $2,500 to $4,999 | 557 (2.4%) | 582 (2.9%) |
| $5,000 to $7,499 | 454 (1.9%) | 800 (4.1%) |
| $7,500 to $9,999 | 345 (1.5%) | 689 (3.5%) |
| $10,000 to $12,499 | 537 (2.3%) | 698 (3.5%) |
| $12,500 to $14,999 | 344 (1.5%) | 625 (3.2%) |
| $15,000 to $17,499 | 431 (1.8%) | 719 (3.6%) |
| $17,500 to $19,999 | 387 (1.7%) | 559 (2.8%) |
| $20,000 to $22,499 | 678 (2.9%) | 581 (2.9%) |
| $22,500 to $24,999 | 711 (3.1%) | 591 (3.0%) |
| $25,000 to $29,999 | 1,159 (5.0%) | 1,134 (5.8%) |
| $30,000 to $34,999 | 924 (4.0%) | 1,626 (8.3%) |
| $35,000 to $39,999 | 1,317 (5.7%) | 1,165 (5.9%) |
| $40,000 to $44,999 | 1,037 (4.5%) | 1,573 (8.0%) |
| $45,000 to $49,999 | 1,658 (7.1%) | 1,191 (6.0%) |
| $50,000 to $54,999 | 1,046 (4.5%) | 880 (4.5%) |
| $55,000 to $64,999 | 2,213 (9.5%) | 1,274 (6.5%) |
| $65,000 to $74,999 | 1,835 (7.9%) | 1,200 (6.1%) |
| $75,000 to $99,999 | 2,961 (12.7%) | 1,299 (6.6%) |
| $100,000+ | 3,752 (16.1%) | 1,160 (5.9%) |
| Total | 23,270 (100.0%) | 19,702 (100.0%) |
Earnings by Sex by Educational Attainment in Wagoner County
Average earnings in Wagoner County are $57,116 for men and $39,605 for women, a difference of 30.7%. Men with an educational attainment of graduate degree enjoy the highest average annual earnings of $89,750, while those with less than high school education earn the least with $40,063. Women with an educational attainment of graduate degree earn the most with the average annual earnings of $64,821, while those with less than high school education have the smallest earnings of $24,000.
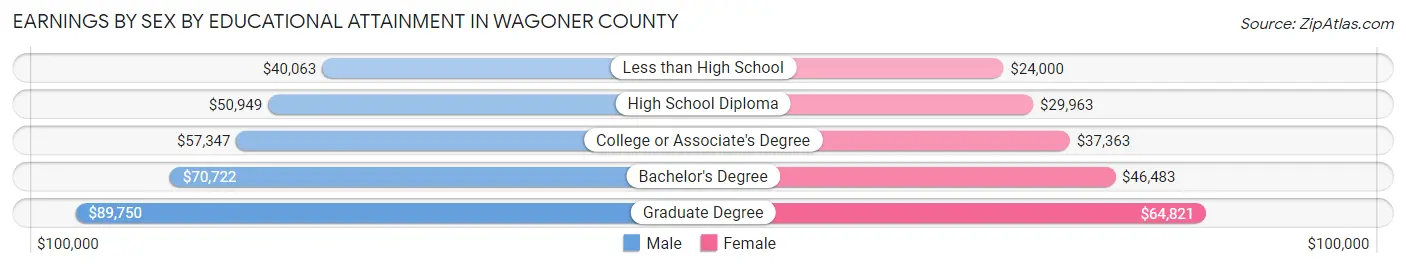
| Educational Attainment | Male Income | Female Income |
| Less than High School | $40,063 | $24,000 |
| High School Diploma | $50,949 | $29,963 |
| College or Associate's Degree | $57,347 | $37,363 |
| Bachelor's Degree | $70,722 | $46,483 |
| Graduate Degree | $89,750 | $64,821 |
| Total | $57,116 | $39,605 |
Family Income in Wagoner County
Family Income Brackets in Wagoner County
According to the Wagoner County family income data, there are 5,441 families falling into the $100,000 to $149,999 income range, which is the most common income bracket and makes up 24.8% of all families. Conversely, the $10,000 to $14,999 income bracket is the least frequent group with only 241 families (1.1%) belonging to this category.
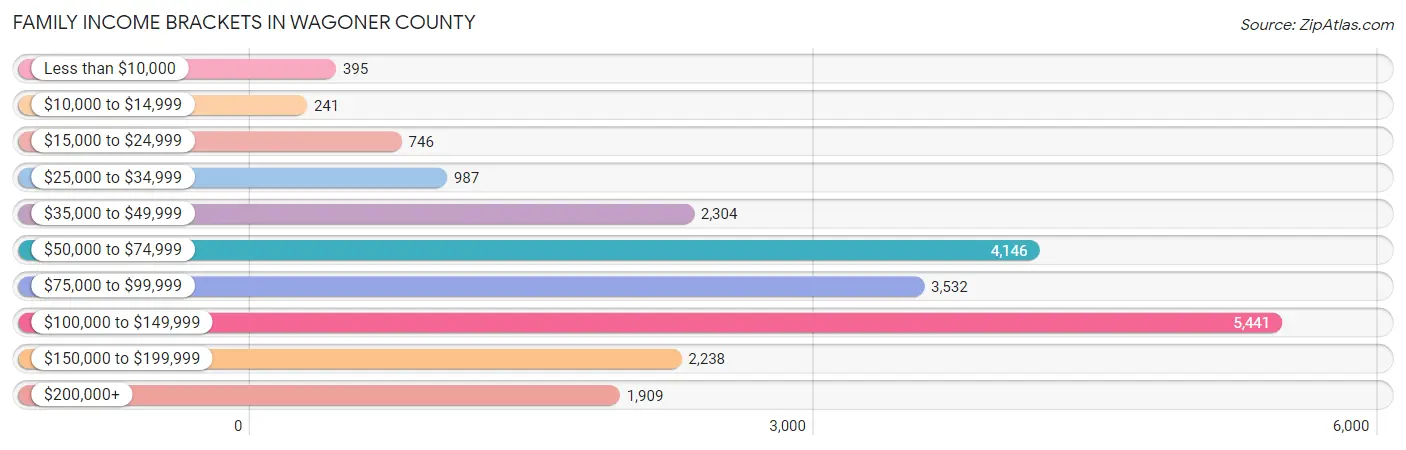
| Income Bracket | # Families | % Families |
| Less than $10,000 | 395 | 1.8% |
| $10,000 to $14,999 | 241 | 1.1% |
| $15,000 to $24,999 | 746 | 3.4% |
| $25,000 to $34,999 | 987 | 4.5% |
| $35,000 to $49,999 | 2,304 | 10.5% |
| $50,000 to $74,999 | 4,146 | 18.9% |
| $75,000 to $99,999 | 3,532 | 16.1% |
| $100,000 to $149,999 | 5,441 | 24.8% |
| $150,000 to $199,999 | 2,238 | 10.2% |
| $200,000+ | 1,909 | 8.7% |
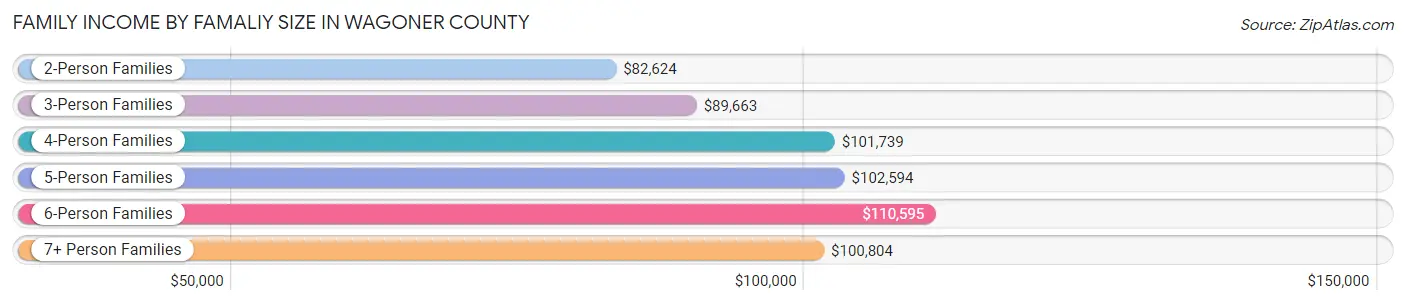
Family Income by Famaliy Size in Wagoner County
6-person families (900 | 4.1%) account for the highest median family income in Wagoner County with $110,595 per family, while 2-person families (10,153 | 46.3%) have the highest median income of $41,312 per family member.
| Income Bracket | # Families | Median Income |
| 2-Person Families | 10,153 (46.3%) | $82,624 |
| 3-Person Families | 4,570 (20.8%) | $89,663 |
| 4-Person Families | 3,666 (16.7%) | $101,739 |
| 5-Person Families | 2,251 (10.3%) | $102,594 |
| 6-Person Families | 900 (4.1%) | $110,595 |
| 7+ Person Families | 399 (1.8%) | $100,804 |
| Total | 21,939 (100.0%) | $90,327 |
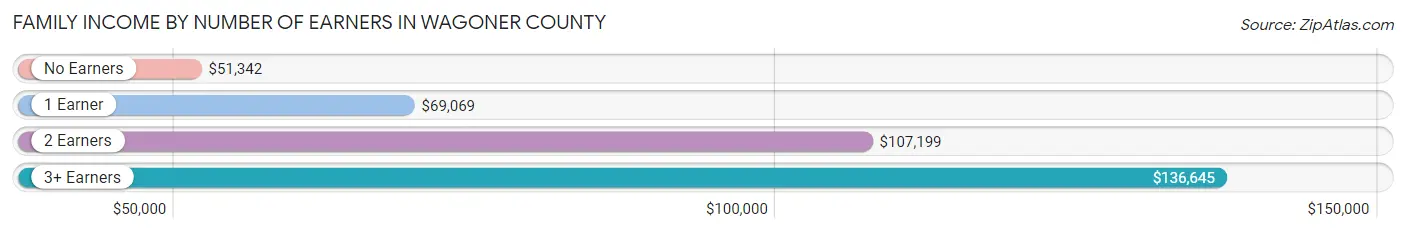
Family Income by Number of Earners in Wagoner County
The median family income in Wagoner County is $90,327, with families comprising 3+ earners (2,549) having the highest median family income of $136,645, while families with no earners (3,183) have the lowest median family income of $51,342, accounting for 11.6% and 14.5% of families, respectively.
| Number of Earners | # Families | Median Income |
| No Earners | 3,183 (14.5%) | $51,342 |
| 1 Earner | 6,991 (31.9%) | $69,069 |
| 2 Earners | 9,216 (42.0%) | $107,199 |
| 3+ Earners | 2,549 (11.6%) | $136,645 |
| Total | 21,939 (100.0%) | $90,327 |
Household Income in Wagoner County
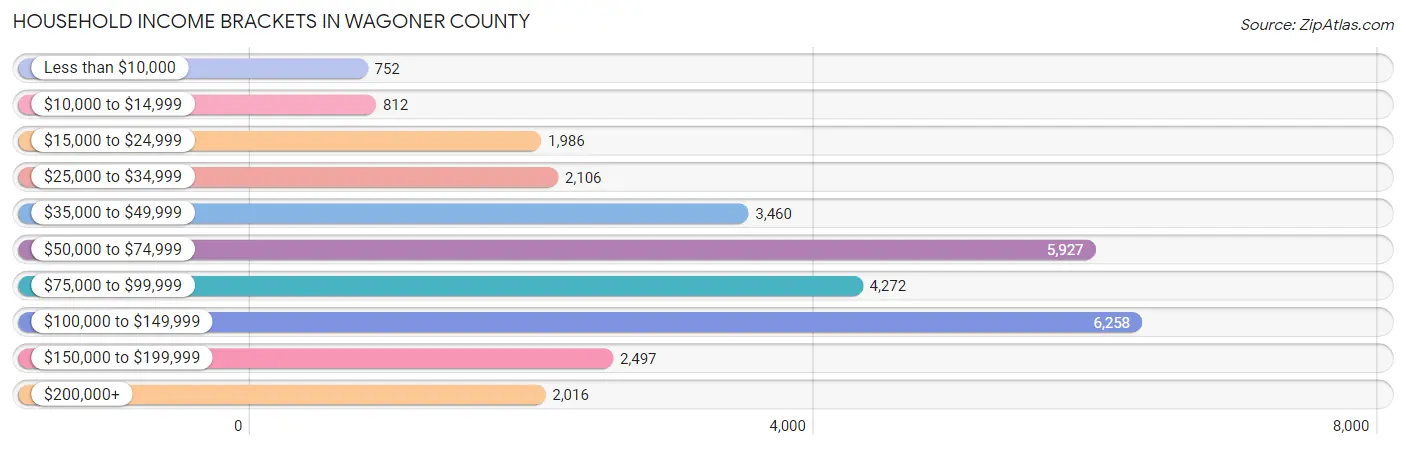
Household Income Brackets in Wagoner County
With 6,258 households falling in the category, the $100,000 to $149,999 income range is the most frequent in Wagoner County, accounting for 20.8% of all households. In contrast, only 752 households (2.5%) fall into the less than $10,000 income bracket, making it the least populous group.
| Income Bracket | # Households | % Households |
| Less than $10,000 | 752 | 2.5% |
| $10,000 to $14,999 | 812 | 2.7% |
| $15,000 to $24,999 | 1,986 | 6.6% |
| $25,000 to $34,999 | 2,106 | 7.0% |
| $35,000 to $49,999 | 3,460 | 11.5% |
| $50,000 to $74,999 | 5,927 | 19.7% |
| $75,000 to $99,999 | 4,272 | 14.2% |
| $100,000 to $149,999 | 6,258 | 20.8% |
| $150,000 to $199,999 | 2,497 | 8.3% |
| $200,000+ | 2,016 | 6.7% |
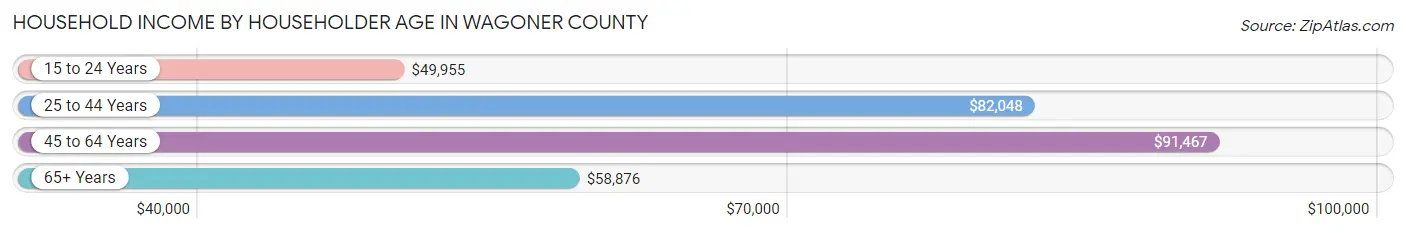
Household Income by Householder Age in Wagoner County
The median household income in Wagoner County is $75,082, with the highest median household income of $91,467 found in the 45 to 64 years age bracket for the primary householder. A total of 10,955 households (36.4%) fall into this category. Meanwhile, the 15 to 24 years age bracket for the primary householder has the lowest median household income of $49,955, with 801 households (2.7%) in this group.
| Income Bracket | # Households | Median Income |
| 15 to 24 Years | 801 (2.7%) | $49,955 |
| 25 to 44 Years | 9,751 (32.4%) | $82,048 |
| 45 to 64 Years | 10,955 (36.4%) | $91,467 |
| 65+ Years | 8,579 (28.5%) | $58,876 |
| Total | 30,086 (100.0%) | $75,082 |
Poverty in Wagoner County
Income Below Poverty by Sex and Age in Wagoner County
With 8.0% poverty level for males and 10.3% for females among the residents of Wagoner County, 12 to 14 year old males and 18 to 24 year old females are the most vulnerable to poverty, with 288 males (16.4%) and 463 females (15.0%) in their respective age groups living below the poverty level.
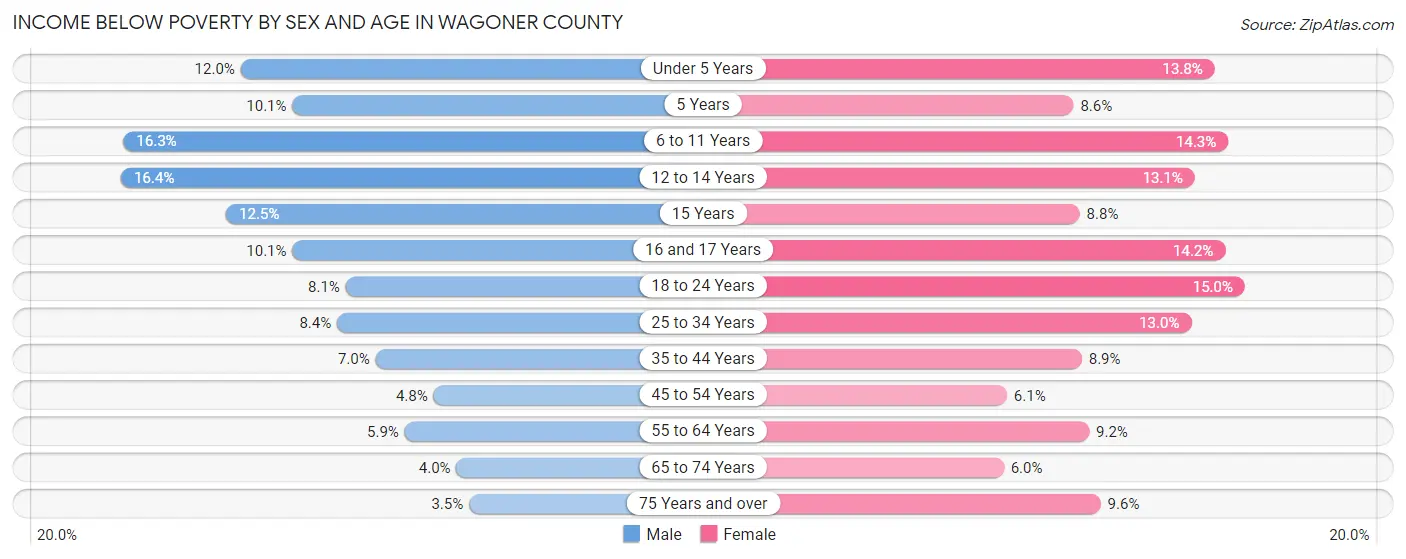
| Age Bracket | Male | Female |
| Under 5 Years | 274 (12.0%) | 309 (13.8%) |
| 5 Years | 62 (10.1%) | 45 (8.6%) |
| 6 to 11 Years | 557 (16.3%) | 472 (14.3%) |
| 12 to 14 Years | 288 (16.4%) | 211 (13.1%) |
| 15 Years | 97 (12.5%) | 58 (8.8%) |
| 16 and 17 Years | 103 (10.1%) | 148 (14.2%) |
| 18 to 24 Years | 273 (8.1%) | 463 (15.0%) |
| 25 to 34 Years | 441 (8.4%) | 685 (13.0%) |
| 35 to 44 Years | 381 (7.0%) | 496 (8.9%) |
| 45 to 54 Years | 250 (4.8%) | 310 (6.1%) |
| 55 to 64 Years | 307 (5.9%) | 491 (9.2%) |
| 65 to 74 Years | 158 (4.0%) | 265 (6.0%) |
| 75 Years and over | 85 (3.5%) | 275 (9.6%) |
| Total | 3,276 (8.0%) | 4,228 (10.3%) |
Income Above Poverty by Sex and Age in Wagoner County
According to the poverty statistics in Wagoner County, males aged 75 years and over and females aged 65 to 74 years are the age groups that are most secure financially, with 96.5% of males and 94.0% of females in these age groups living above the poverty line.
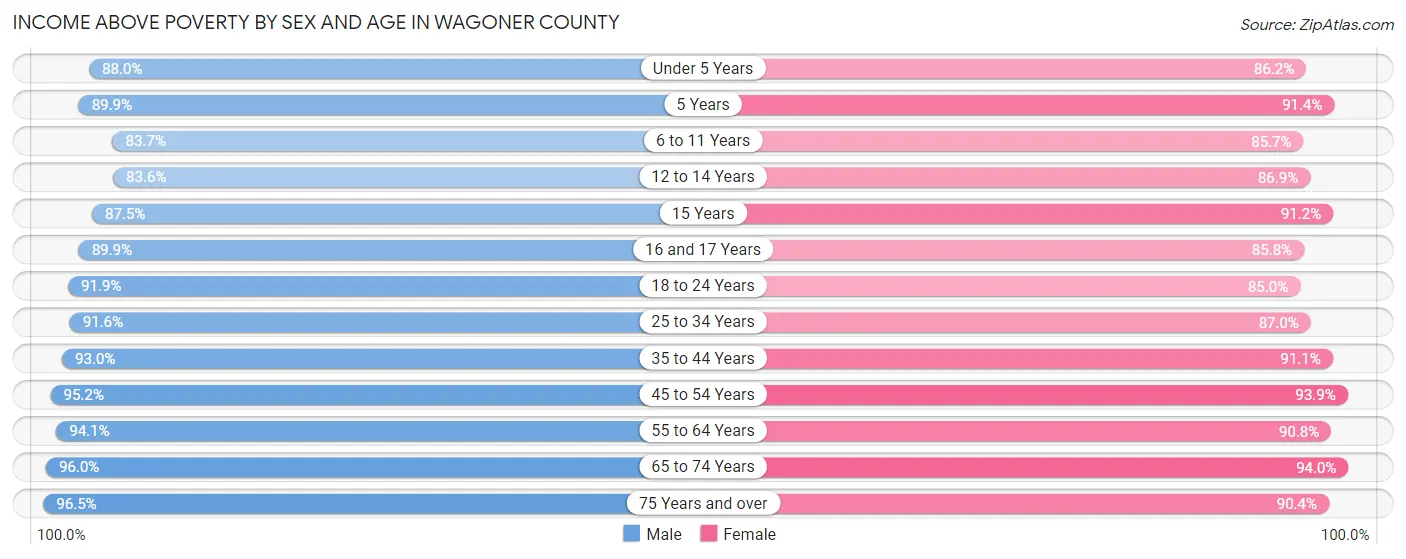
| Age Bracket | Male | Female |
| Under 5 Years | 2,014 (88.0%) | 1,924 (86.2%) |
| 5 Years | 554 (89.9%) | 478 (91.4%) |
| 6 to 11 Years | 2,853 (83.7%) | 2,820 (85.7%) |
| 12 to 14 Years | 1,466 (83.6%) | 1,400 (86.9%) |
| 15 Years | 678 (87.5%) | 599 (91.2%) |
| 16 and 17 Years | 921 (89.9%) | 892 (85.8%) |
| 18 to 24 Years | 3,105 (91.9%) | 2,631 (85.0%) |
| 25 to 34 Years | 4,811 (91.6%) | 4,597 (87.0%) |
| 35 to 44 Years | 5,087 (93.0%) | 5,070 (91.1%) |
| 45 to 54 Years | 4,939 (95.2%) | 4,745 (93.9%) |
| 55 to 64 Years | 4,907 (94.1%) | 4,859 (90.8%) |
| 65 to 74 Years | 3,823 (96.0%) | 4,147 (94.0%) |
| 75 Years and over | 2,342 (96.5%) | 2,586 (90.4%) |
| Total | 37,500 (92.0%) | 36,748 (89.7%) |
Income Below Poverty Among Married-Couple Families in Wagoner County
The poverty statistics for married-couple families in Wagoner County show that 3.6% or 642 of the total 17,573 families live below the poverty line. Families with 5 or more children have the highest poverty rate of 21.0%, comprising of 34 families. On the other hand, families with no children have the lowest poverty rate of 2.3%, which includes 236 families.
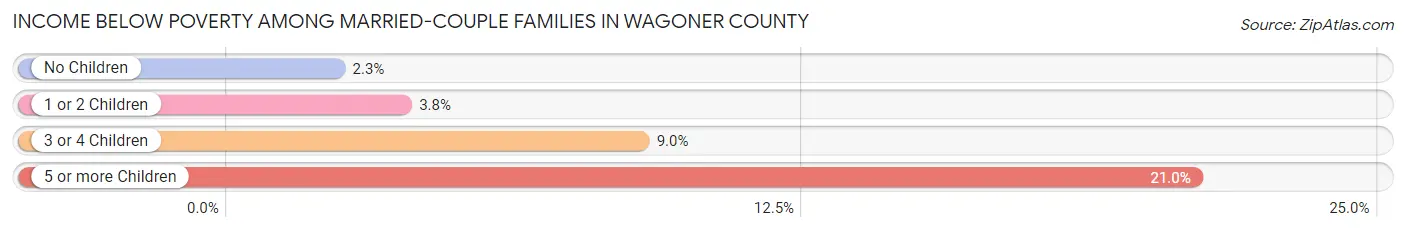
| Children | Above Poverty | Below Poverty |
| No Children | 9,860 (97.7%) | 236 (2.3%) |
| 1 or 2 Children | 5,277 (96.2%) | 208 (3.8%) |
| 3 or 4 Children | 1,666 (91.0%) | 164 (9.0%) |
| 5 or more Children | 128 (79.0%) | 34 (21.0%) |
| Total | 16,931 (96.4%) | 642 (3.6%) |
Income Below Poverty Among Single-Parent Households in Wagoner County
According to the poverty data in Wagoner County, 8.4% or 115 single-father households and 19.9% or 595 single-mother households are living below the poverty line. Among single-father households, those with 3 or 4 children have the highest poverty rate, with 32 households (18.0%) experiencing poverty. Likewise, among single-mother households, those with 5 or more children have the highest poverty rate, with 49 households (92.4%) falling below the poverty line.
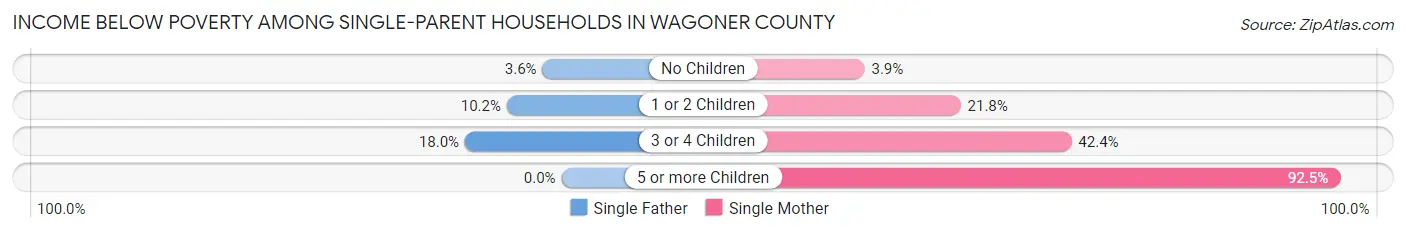
| Children | Single Father | Single Mother |
| No Children | 21 (3.5%) | 38 (3.9%) |
| 1 or 2 Children | 62 (10.2%) | 340 (21.8%) |
| 3 or 4 Children | 32 (18.0%) | 168 (42.4%) |
| 5 or more Children | 0 (0.0%) | 49 (92.4%) |
| Total | 115 (8.4%) | 595 (19.9%) |
Income Below Poverty Among Married-Couple vs Single-Parent Households in Wagoner County
The poverty data for Wagoner County shows that 642 of the married-couple family households (3.6%) and 710 of the single-parent households (16.3%) are living below the poverty level. Within the married-couple family households, those with 5 or more children have the highest poverty rate, with 34 households (21.0%) falling below the poverty line. Among the single-parent households, those with 5 or more children have the highest poverty rate, with 49 household (92.4%) living below poverty.
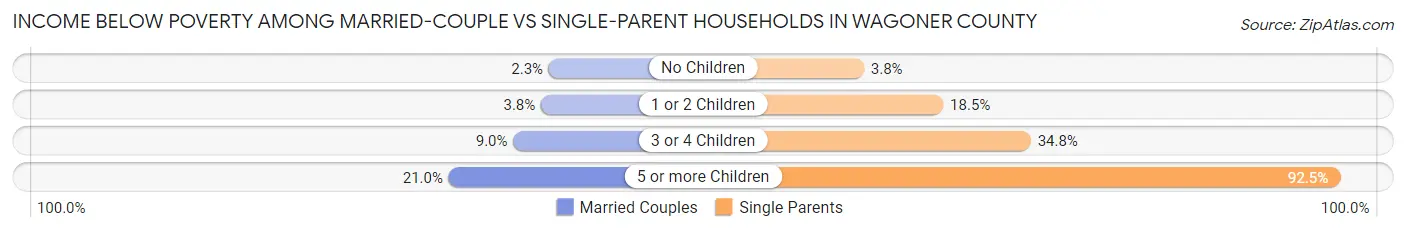
| Children | Married-Couple Families | Single-Parent Households |
| No Children | 236 (2.3%) | 59 (3.8%) |
| 1 or 2 Children | 208 (3.8%) | 402 (18.5%) |
| 3 or 4 Children | 164 (9.0%) | 200 (34.8%) |
| 5 or more Children | 34 (21.0%) | 49 (92.4%) |
| Total | 642 (3.6%) | 710 (16.3%) |
Employment Characteristics in Wagoner County
Employment by Class of Employer in Wagoner County
Among the 38,272 employed individuals in Wagoner County, private company employees (26,456 | 69.1%), self-employed (not incorporated) (2,540 | 6.6%), and not-for-profit organizations (2,500 | 6.5%) make up the most common classes of employment.
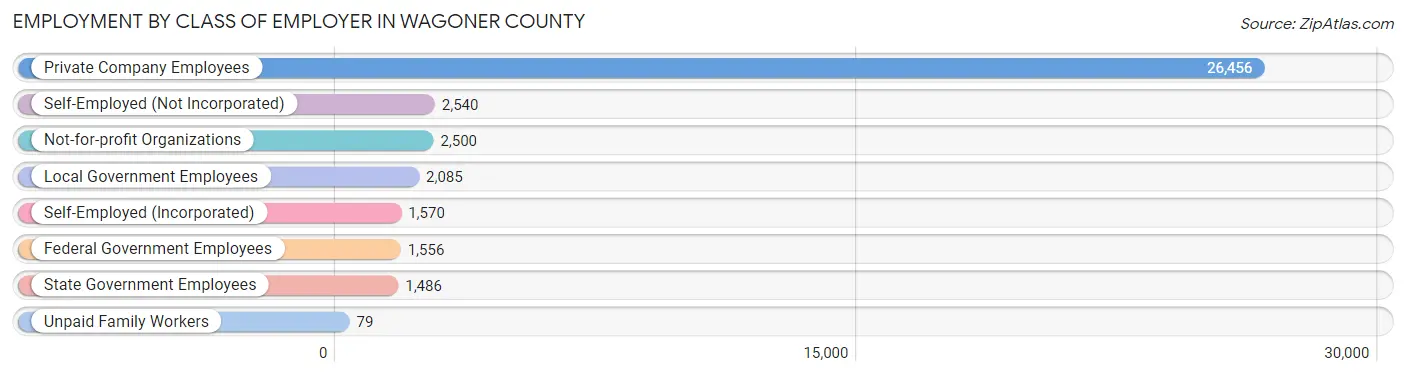
| Employer Class | # Employees | % Employees |
| Private Company Employees | 26,456 | 69.1% |
| Self-Employed (Incorporated) | 1,570 | 4.1% |
| Self-Employed (Not Incorporated) | 2,540 | 6.6% |
| Not-for-profit Organizations | 2,500 | 6.5% |
| Local Government Employees | 2,085 | 5.4% |
| State Government Employees | 1,486 | 3.9% |
| Federal Government Employees | 1,556 | 4.1% |
| Unpaid Family Workers | 79 | 0.2% |
| Total | 38,272 | 100.0% |
Employment Status by Age in Wagoner County
According to the labor force statistics for Wagoner County, out of the total population over 16 years of age (64,823), 63.3% or 41,033 individuals are in the labor force, with 4.9% or 2,011 of them unemployed. The age group with the highest labor force participation rate is 25 to 29 years, with 84.2% or 4,223 individuals in the labor force. Within the labor force, the 16 to 19 years age range has the highest percentage of unemployed individuals, with 13.2% or 236 of them being unemployed.
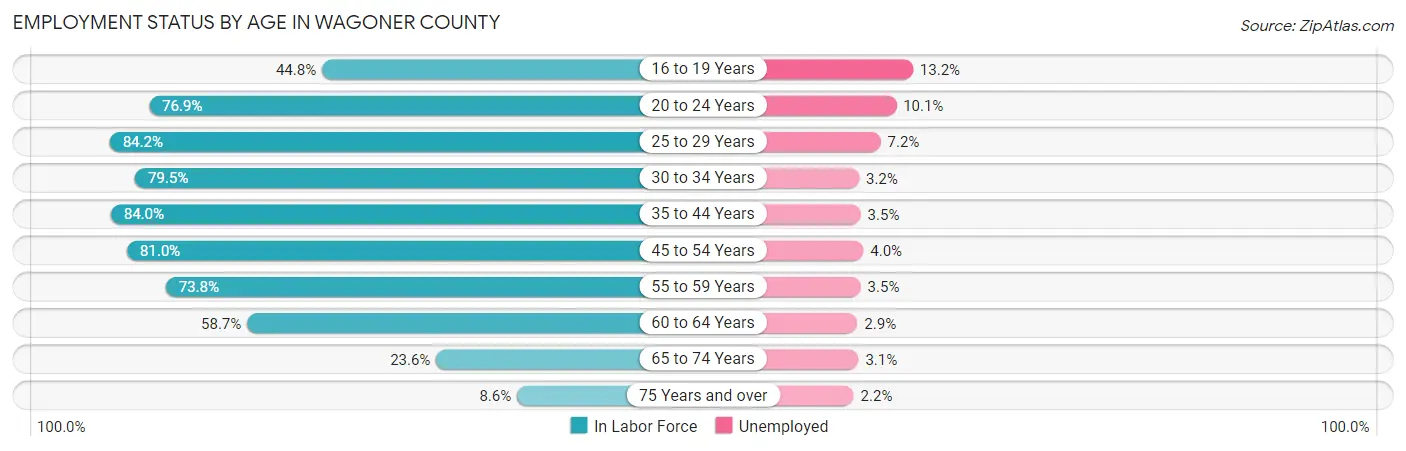
| Age Bracket | In Labor Force | Unemployed |
| 16 to 19 Years | 1,786 (44.8%) | 236 (13.2%) |
| 20 to 24 Years | 3,505 (76.9%) | 354 (10.1%) |
| 25 to 29 Years | 4,223 (84.2%) | 304 (7.2%) |
| 30 to 34 Years | 4,412 (79.5%) | 141 (3.2%) |
| 35 to 44 Years | 9,290 (84.0%) | 325 (3.5%) |
| 45 to 54 Years | 8,309 (81.0%) | 332 (4.0%) |
| 55 to 59 Years | 4,125 (73.8%) | 144 (3.5%) |
| 60 to 64 Years | 2,931 (58.7%) | 85 (2.9%) |
| 65 to 74 Years | 1,989 (23.6%) | 62 (3.1%) |
| 75 Years and over | 463 (8.6%) | 10 (2.2%) |
| Total | 41,033 (63.3%) | 2,011 (4.9%) |
Employment Status by Educational Attainment in Wagoner County
According to labor force statistics for Wagoner County, 78.4% of individuals (33,293) out of the total population between 25 and 64 years of age (42,466) are in the labor force, with 4.0% or 1,332 of them being unemployed. The group with the highest labor force participation rate are those with the educational attainment of bachelor's degree or higher, with 86.3% or 9,727 individuals in the labor force. Within the labor force, individuals with less than high school education have the highest percentage of unemployment, with 7.3% or 145 of them being unemployed.
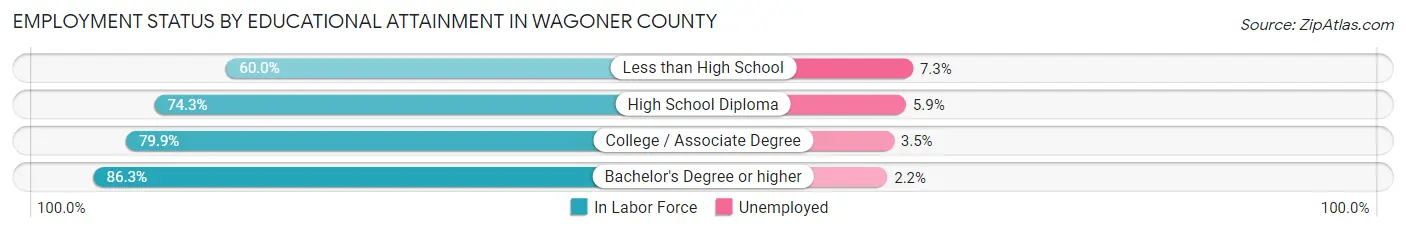
| Educational Attainment | In Labor Force | Unemployed |
| Less than High School | 1,991 (60.0%) | 242 (7.3%) |
| High School Diploma | 9,315 (74.3%) | 740 (5.9%) |
| College / Associate Degree | 12,256 (79.9%) | 537 (3.5%) |
| Bachelor's Degree or higher | 9,727 (86.3%) | 248 (2.2%) |
| Total | 33,293 (78.4%) | 1,699 (4.0%) |
Employment Occupations by Sex in Wagoner County
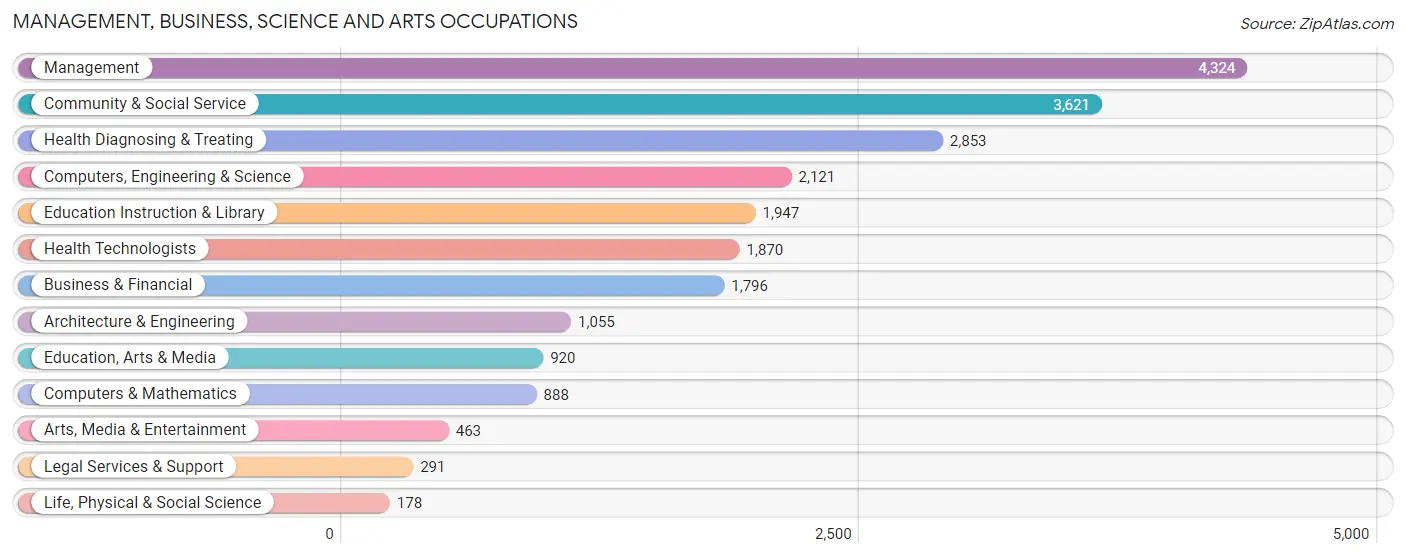
Management, Business, Science and Arts Occupations
The most common Management, Business, Science and Arts occupations in Wagoner County are Management (4,324 | 11.1%), Community & Social Service (3,621 | 9.3%), Health Diagnosing & Treating (2,853 | 7.3%), Computers, Engineering & Science (2,121 | 5.4%), and Education Instruction & Library (1,947 | 5.0%).
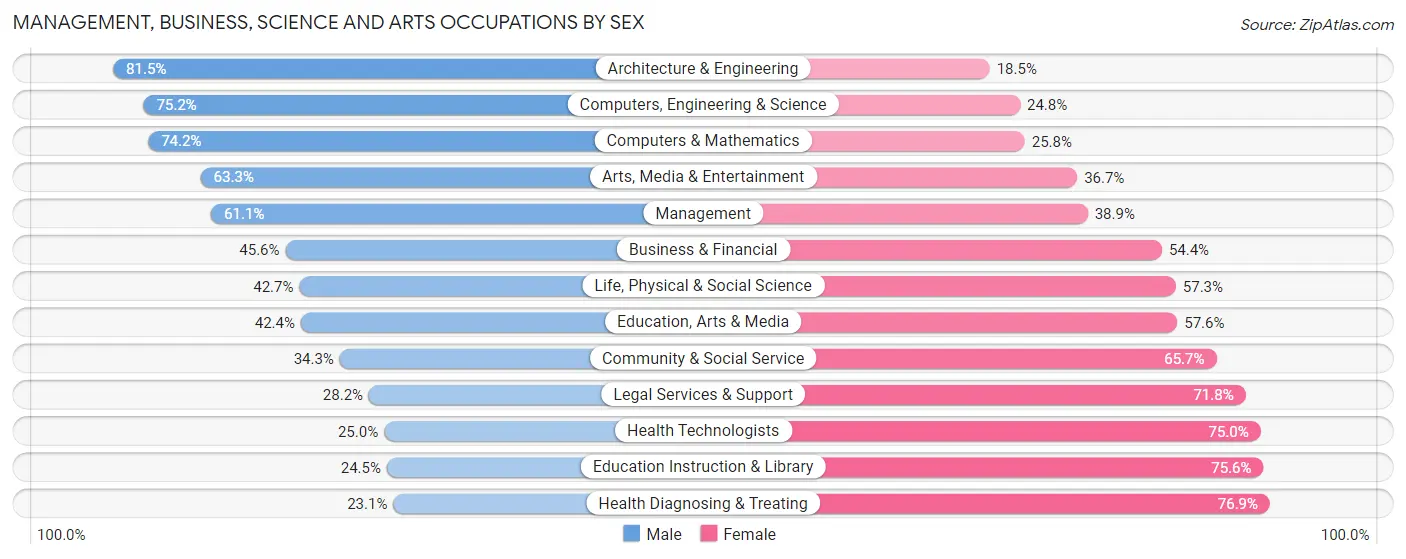
Management, Business, Science and Arts Occupations by Sex
Within the Management, Business, Science and Arts occupations in Wagoner County, the most male-oriented occupations are Architecture & Engineering (81.5%), Computers, Engineering & Science (75.2%), and Computers & Mathematics (74.2%), while the most female-oriented occupations are Health Diagnosing & Treating (76.9%), Education Instruction & Library (75.5%), and Health Technologists (75.0%).
| Occupation | Male | Female |
| Management | 2,641 (61.1%) | 1,683 (38.9%) |
| Business & Financial | 819 (45.6%) | 977 (54.4%) |
| Computers, Engineering & Science | 1,595 (75.2%) | 526 (24.8%) |
| Computers & Mathematics | 659 (74.2%) | 229 (25.8%) |
| Architecture & Engineering | 860 (81.5%) | 195 (18.5%) |
| Life, Physical & Social Science | 76 (42.7%) | 102 (57.3%) |
| Community & Social Service | 1,241 (34.3%) | 2,380 (65.7%) |
| Education, Arts & Media | 390 (42.4%) | 530 (57.6%) |
| Legal Services & Support | 82 (28.2%) | 209 (71.8%) |
| Education Instruction & Library | 476 (24.4%) | 1,471 (75.5%) |
| Arts, Media & Entertainment | 293 (63.3%) | 170 (36.7%) |
| Health Diagnosing & Treating | 659 (23.1%) | 2,194 (76.9%) |
| Health Technologists | 468 (25.0%) | 1,402 (75.0%) |
| Total (Category) | 6,955 (47.3%) | 7,760 (52.7%) |
| Total (Overall) | 21,394 (54.9%) | 17,537 (45.1%) |
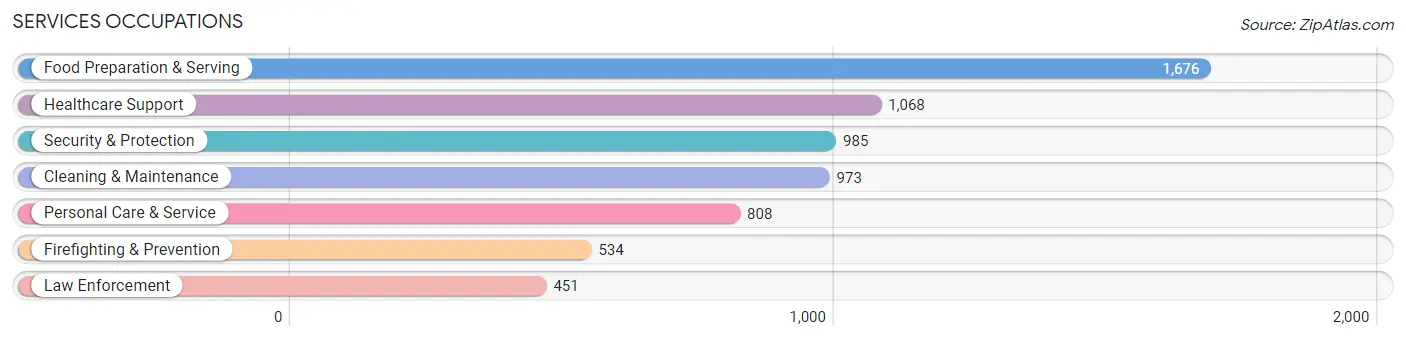
Services Occupations
The most common Services occupations in Wagoner County are Food Preparation & Serving (1,676 | 4.3%), Healthcare Support (1,068 | 2.7%), Security & Protection (985 | 2.5%), Cleaning & Maintenance (973 | 2.5%), and Personal Care & Service (808 | 2.1%).
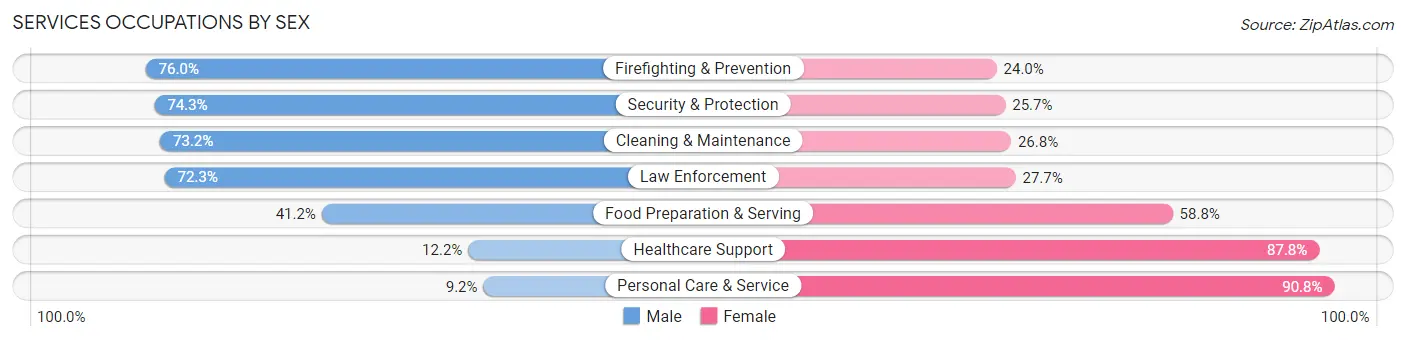
Services Occupations by Sex
Within the Services occupations in Wagoner County, the most male-oriented occupations are Firefighting & Prevention (76.0%), Security & Protection (74.3%), and Cleaning & Maintenance (73.2%), while the most female-oriented occupations are Personal Care & Service (90.8%), Healthcare Support (87.8%), and Food Preparation & Serving (58.8%).
| Occupation | Male | Female |
| Healthcare Support | 130 (12.2%) | 938 (87.8%) |
| Security & Protection | 732 (74.3%) | 253 (25.7%) |
| Firefighting & Prevention | 406 (76.0%) | 128 (24.0%) |
| Law Enforcement | 326 (72.3%) | 125 (27.7%) |
| Food Preparation & Serving | 690 (41.2%) | 986 (58.8%) |
| Cleaning & Maintenance | 712 (73.2%) | 261 (26.8%) |
| Personal Care & Service | 74 (9.2%) | 734 (90.8%) |
| Total (Category) | 2,338 (42.4%) | 3,172 (57.6%) |
| Total (Overall) | 21,394 (54.9%) | 17,537 (45.1%) |
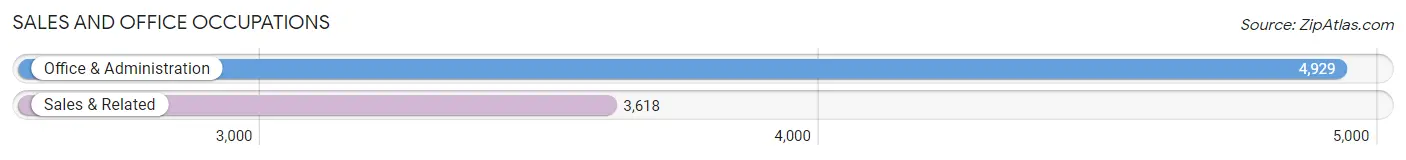
Sales and Office Occupations
The most common Sales and Office occupations in Wagoner County are Office & Administration (4,929 | 12.7%), and Sales & Related (3,618 | 9.3%).
Sales and Office Occupations by Sex
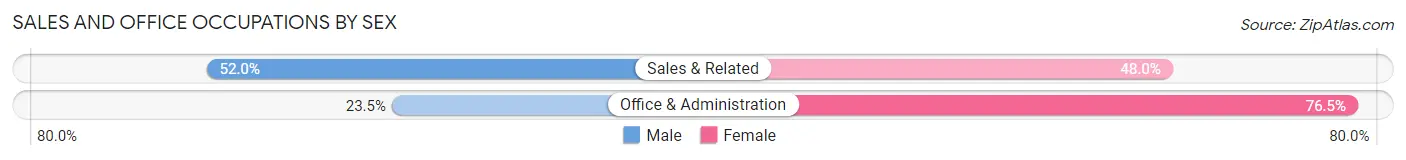
| Occupation | Male | Female |
| Sales & Related | 1,881 (52.0%) | 1,737 (48.0%) |
| Office & Administration | 1,159 (23.5%) | 3,770 (76.5%) |
| Total (Category) | 3,040 (35.6%) | 5,507 (64.4%) |
| Total (Overall) | 21,394 (54.9%) | 17,537 (45.1%) |
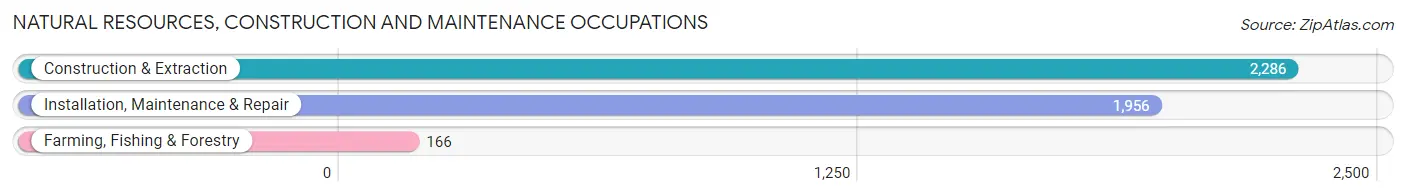
Natural Resources, Construction and Maintenance Occupations
The most common Natural Resources, Construction and Maintenance occupations in Wagoner County are Construction & Extraction (2,286 | 5.9%), Installation, Maintenance & Repair (1,956 | 5.0%), and Farming, Fishing & Forestry (166 | 0.4%).
Natural Resources, Construction and Maintenance Occupations by Sex
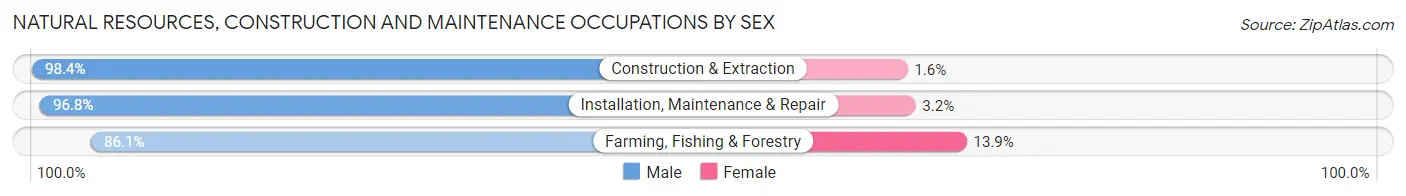
| Occupation | Male | Female |
| Farming, Fishing & Forestry | 143 (86.1%) | 23 (13.9%) |
| Construction & Extraction | 2,250 (98.4%) | 36 (1.6%) |
| Installation, Maintenance & Repair | 1,893 (96.8%) | 63 (3.2%) |
| Total (Category) | 4,286 (97.2%) | 122 (2.8%) |
| Total (Overall) | 21,394 (54.9%) | 17,537 (45.1%) |
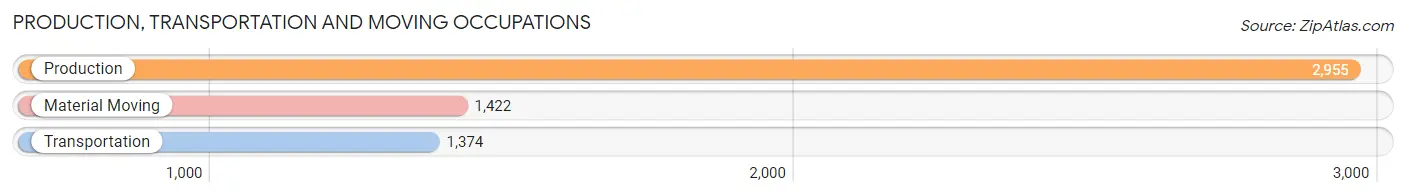
Production, Transportation and Moving Occupations
The most common Production, Transportation and Moving occupations in Wagoner County are Production (2,955 | 7.6%), Material Moving (1,422 | 3.6%), and Transportation (1,374 | 3.5%).
Production, Transportation and Moving Occupations by Sex
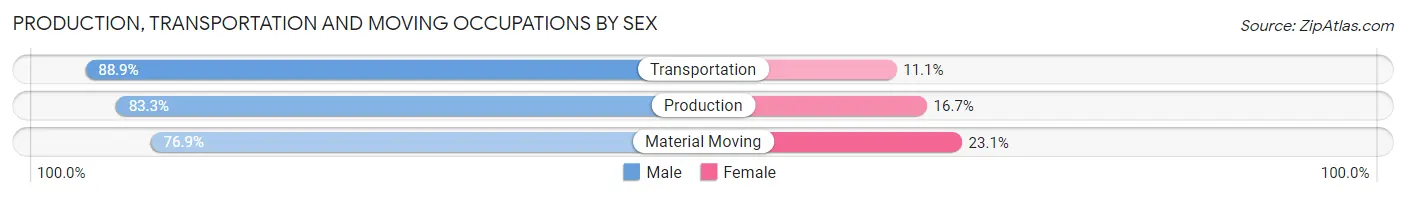
| Occupation | Male | Female |
| Production | 2,461 (83.3%) | 494 (16.7%) |
| Transportation | 1,221 (88.9%) | 153 (11.1%) |
| Material Moving | 1,093 (76.9%) | 329 (23.1%) |
| Total (Category) | 4,775 (83.0%) | 976 (17.0%) |
| Total (Overall) | 21,394 (54.9%) | 17,537 (45.1%) |
Employment Industries by Sex in Wagoner County
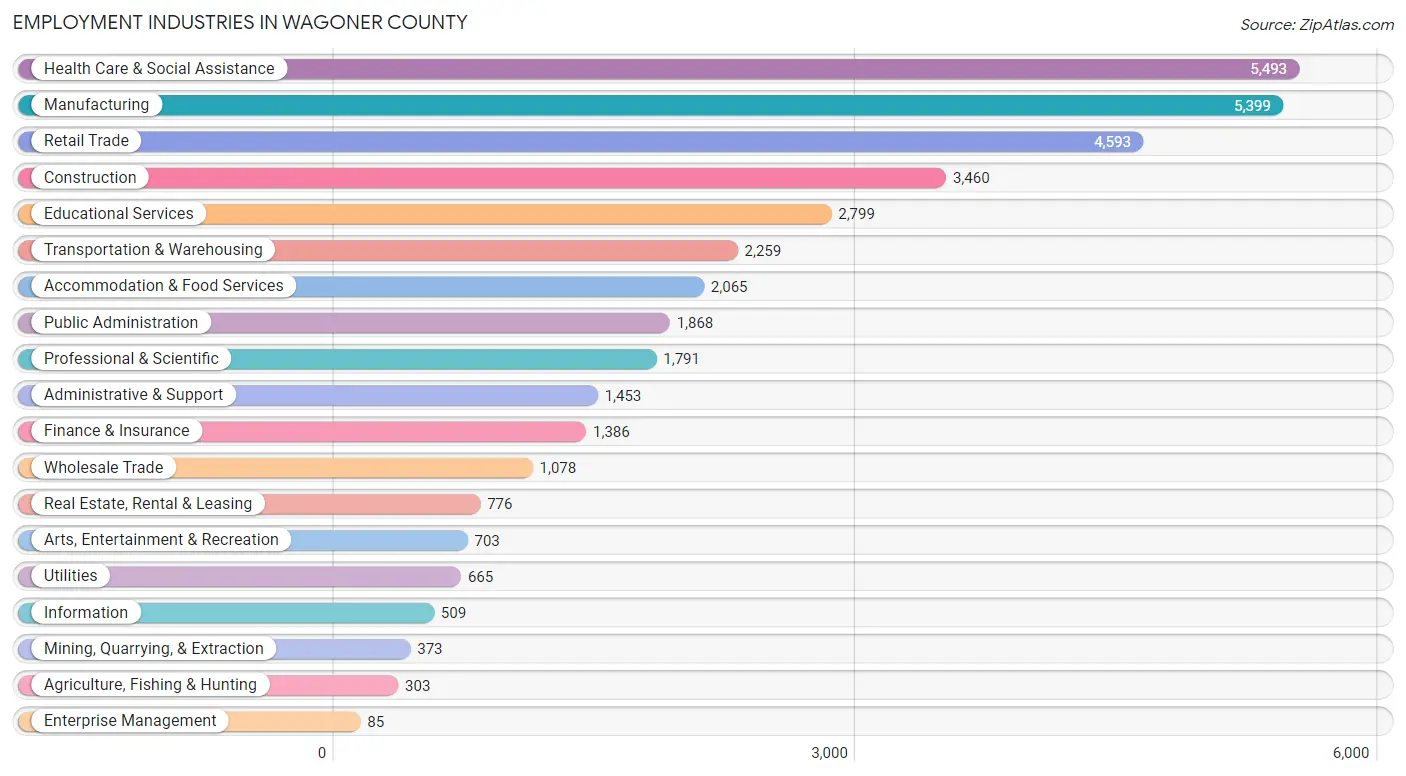
Employment Industries in Wagoner County
The major employment industries in Wagoner County include Health Care & Social Assistance (5,493 | 14.1%), Manufacturing (5,399 | 13.9%), Retail Trade (4,593 | 11.8%), Construction (3,460 | 8.9%), and Educational Services (2,799 | 7.2%).
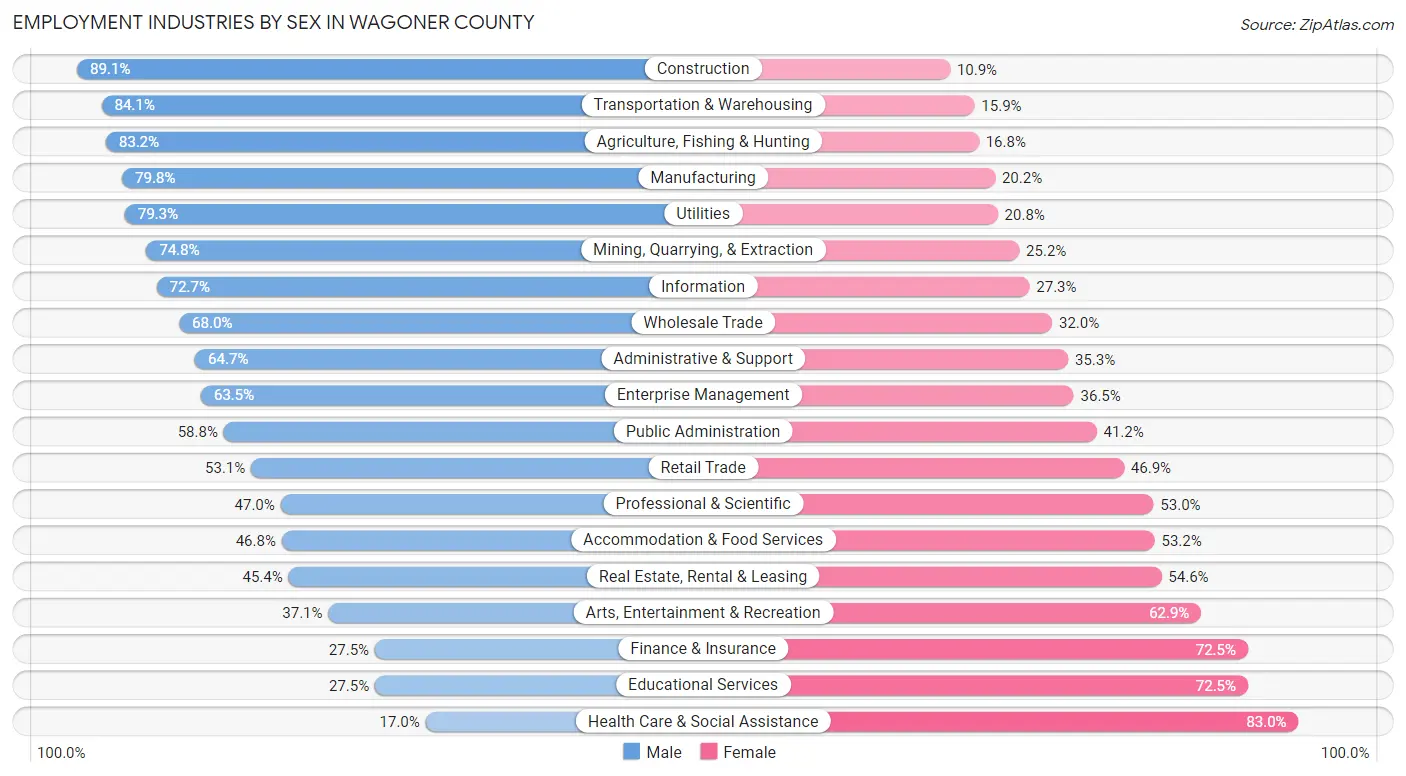
Employment Industries by Sex in Wagoner County
The Wagoner County industries that see more men than women are Construction (89.1%), Transportation & Warehousing (84.1%), and Agriculture, Fishing & Hunting (83.2%), whereas the industries that tend to have a higher number of women are Health Care & Social Assistance (83.0%), Educational Services (72.5%), and Finance & Insurance (72.5%).
| Industry | Male | Female |
| Agriculture, Fishing & Hunting | 252 (83.2%) | 51 (16.8%) |
| Mining, Quarrying, & Extraction | 279 (74.8%) | 94 (25.2%) |
| Construction | 3,084 (89.1%) | 376 (10.9%) |
| Manufacturing | 4,309 (79.8%) | 1,090 (20.2%) |
| Wholesale Trade | 733 (68.0%) | 345 (32.0%) |
| Retail Trade | 2,440 (53.1%) | 2,153 (46.9%) |
| Transportation & Warehousing | 1,899 (84.1%) | 360 (15.9%) |
| Utilities | 527 (79.2%) | 138 (20.7%) |
| Information | 370 (72.7%) | 139 (27.3%) |
| Finance & Insurance | 381 (27.5%) | 1,005 (72.5%) |
| Real Estate, Rental & Leasing | 352 (45.4%) | 424 (54.6%) |
| Professional & Scientific | 842 (47.0%) | 949 (53.0%) |
| Enterprise Management | 54 (63.5%) | 31 (36.5%) |
| Administrative & Support | 940 (64.7%) | 513 (35.3%) |
| Educational Services | 769 (27.5%) | 2,030 (72.5%) |
| Health Care & Social Assistance | 934 (17.0%) | 4,559 (83.0%) |
| Arts, Entertainment & Recreation | 261 (37.1%) | 442 (62.9%) |
| Accommodation & Food Services | 966 (46.8%) | 1,099 (53.2%) |
| Public Administration | 1,098 (58.8%) | 770 (41.2%) |
| Total | 21,394 (54.9%) | 17,537 (45.1%) |
Education in Wagoner County
School Enrollment in Wagoner County
The most common levels of schooling among the 19,415 students in Wagoner County are high school (4,701 | 24.2%), middle school (4,501 | 23.2%), and elementary school (4,437 | 22.9%).
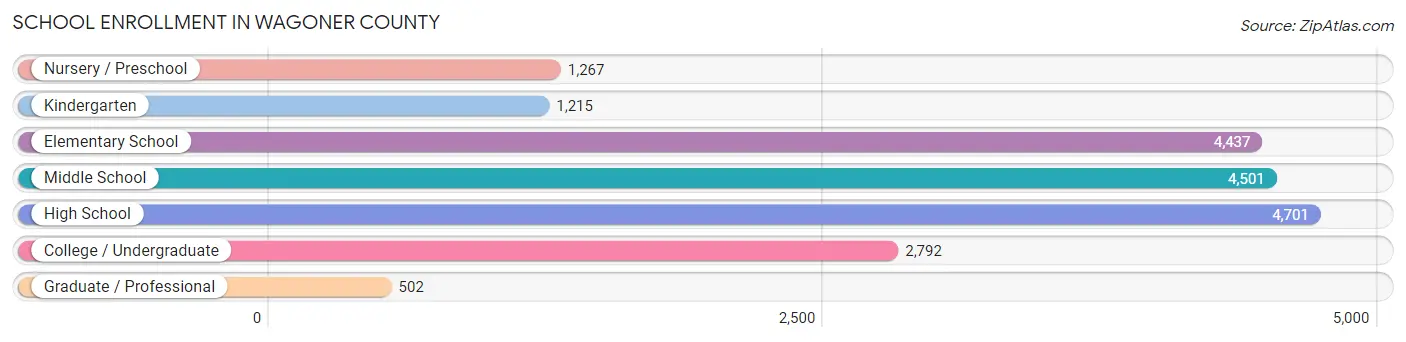
| School Level | # Students | % Students |
| Nursery / Preschool | 1,267 | 6.5% |
| Kindergarten | 1,215 | 6.3% |
| Elementary School | 4,437 | 22.9% |
| Middle School | 4,501 | 23.2% |
| High School | 4,701 | 24.2% |
| College / Undergraduate | 2,792 | 14.4% |
| Graduate / Professional | 502 | 2.6% |
| Total | 19,415 | 100.0% |
School Enrollment by Age by Funding Source in Wagoner County
Out of a total of 19,415 students who are enrolled in schools in Wagoner County, 2,893 (14.9%) attend a private institution, while the remaining 16,522 (85.1%) are enrolled in public schools. The age group of 3 to 4 year olds has the highest likelihood of being enrolled in private schools, with 275 (32.9% in the age bracket) enrolled. Conversely, the age group of 15 to 17 year olds has the lowest likelihood of being enrolled in a private school, with 3,172 (92.3% in the age bracket) attending a public institution.
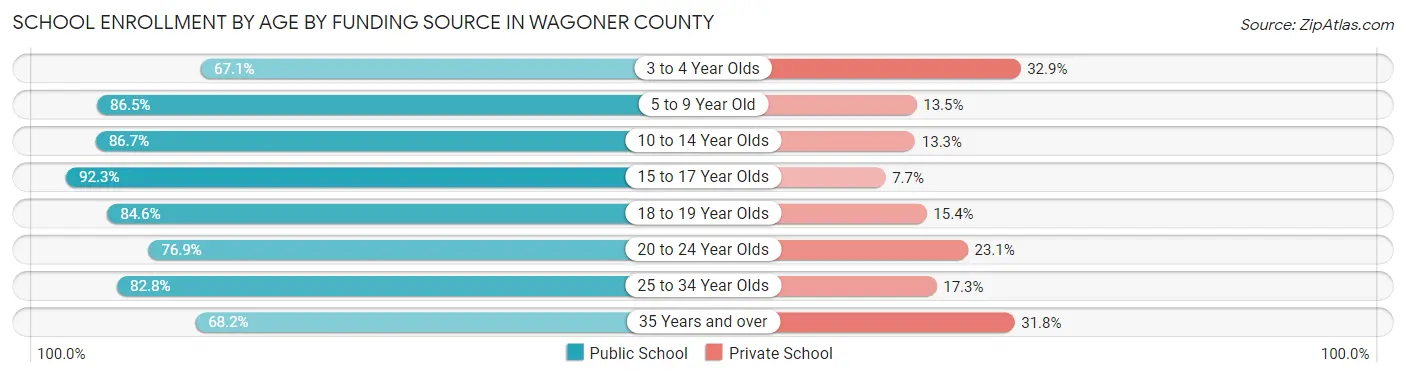
| Age Bracket | Public School | Private School |
| 3 to 4 Year Olds | 561 (67.1%) | 275 (32.9%) |
| 5 to 9 Year Old | 4,523 (86.5%) | 707 (13.5%) |
| 10 to 14 Year Olds | 4,950 (86.7%) | 757 (13.3%) |
| 15 to 17 Year Olds | 3,172 (92.3%) | 266 (7.7%) |
| 18 to 19 Year Olds | 1,076 (84.6%) | 196 (15.4%) |
| 20 to 24 Year Olds | 1,127 (76.9%) | 338 (23.1%) |
| 25 to 34 Year Olds | 662 (82.8%) | 138 (17.2%) |
| 35 Years and over | 455 (68.2%) | 212 (31.8%) |
| Total | 16,522 (85.1%) | 2,893 (14.9%) |
Educational Attainment by Field of Study in Wagoner County
Business (3,632 | 23.4%), education (2,707 | 17.4%), science & technology (2,015 | 13.0%), arts & humanities (1,316 | 8.5%), and engineering (1,000 | 6.4%) are the most common fields of study among 15,553 individuals in Wagoner County who have obtained a bachelor's degree or higher.
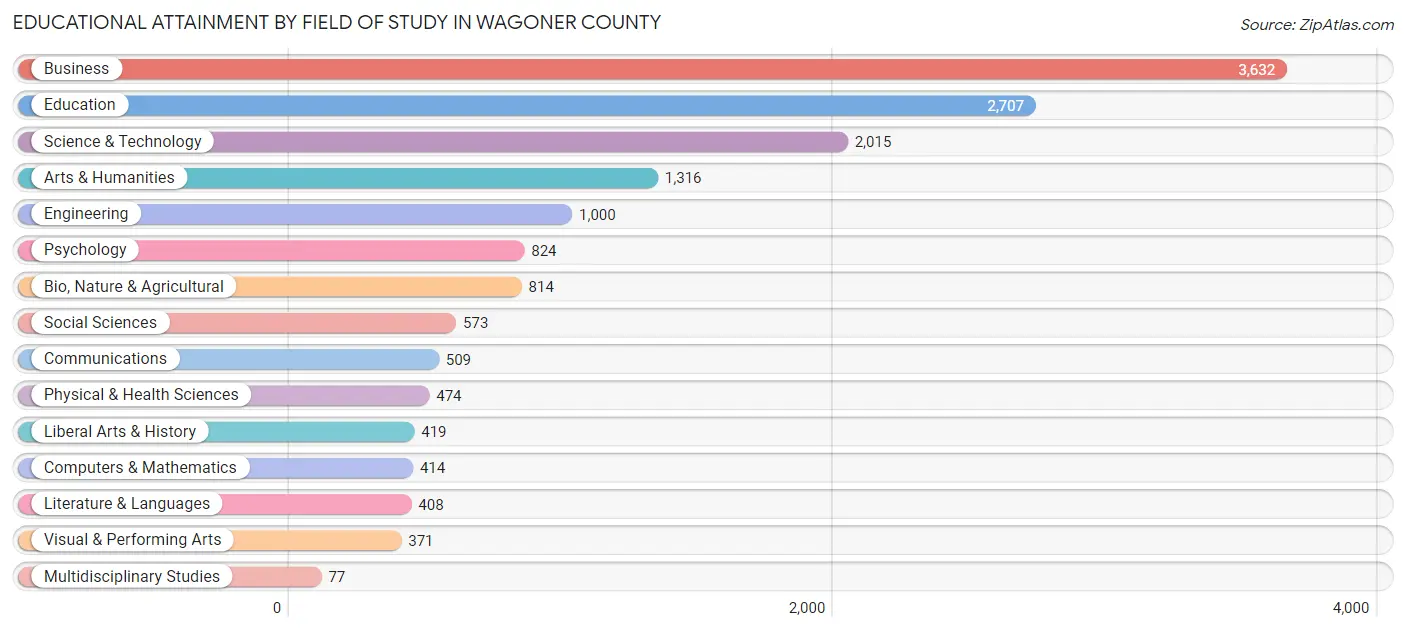
| Field of Study | # Graduates | % Graduates |
| Computers & Mathematics | 414 | 2.7% |
| Bio, Nature & Agricultural | 814 | 5.2% |
| Physical & Health Sciences | 474 | 3.0% |
| Psychology | 824 | 5.3% |
| Social Sciences | 573 | 3.7% |
| Engineering | 1,000 | 6.4% |
| Multidisciplinary Studies | 77 | 0.5% |
| Science & Technology | 2,015 | 13.0% |
| Business | 3,632 | 23.4% |
| Education | 2,707 | 17.4% |
| Literature & Languages | 408 | 2.6% |
| Liberal Arts & History | 419 | 2.7% |
| Visual & Performing Arts | 371 | 2.4% |
| Communications | 509 | 3.3% |
| Arts & Humanities | 1,316 | 8.5% |
| Total | 15,553 | 100.0% |
Transportation & Commute in Wagoner County
Vehicle Availability by Sex in Wagoner County
The most prevalent vehicle ownership categories in Wagoner County are males with 2 vehicles (8,475, accounting for 40.1%) and females with 2 vehicles (6,468, making up 49.5%).
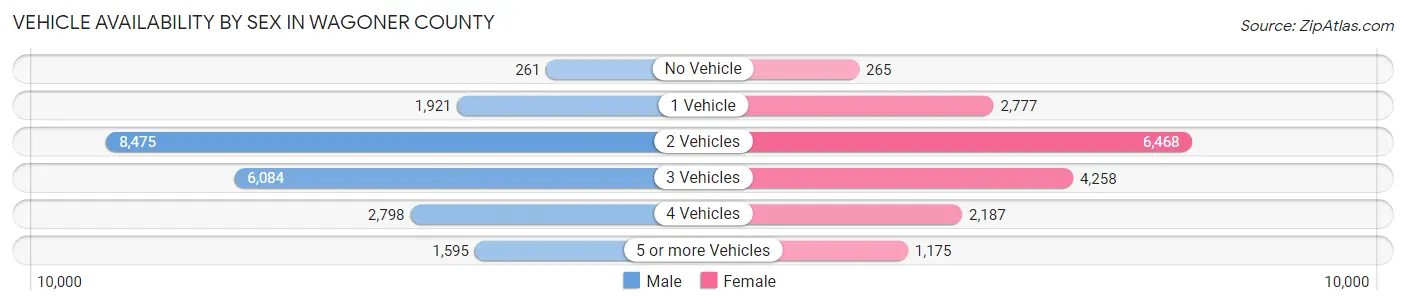
| Vehicles Available | Male | Female |
| No Vehicle | 261 (1.2%) | 265 (1.5%) |
| 1 Vehicle | 1,921 (9.1%) | 2,777 (16.2%) |
| 2 Vehicles | 8,475 (40.1%) | 6,468 (37.8%) |
| 3 Vehicles | 6,084 (28.8%) | 4,258 (24.9%) |
| 4 Vehicles | 2,798 (13.2%) | 2,187 (12.8%) |
| 5 or more Vehicles | 1,595 (7.5%) | 1,175 (6.9%) |
| Total | 21,134 (100.0%) | 17,130 (100.0%) |
Commute Time in Wagoner County
The most frequently occuring commute durations in Wagoner County are 20 to 24 minutes (6,684 commuters, 18.8%), 30 to 34 minutes (6,057 commuters, 17.0%), and 15 to 19 minutes (4,734 commuters, 13.3%).
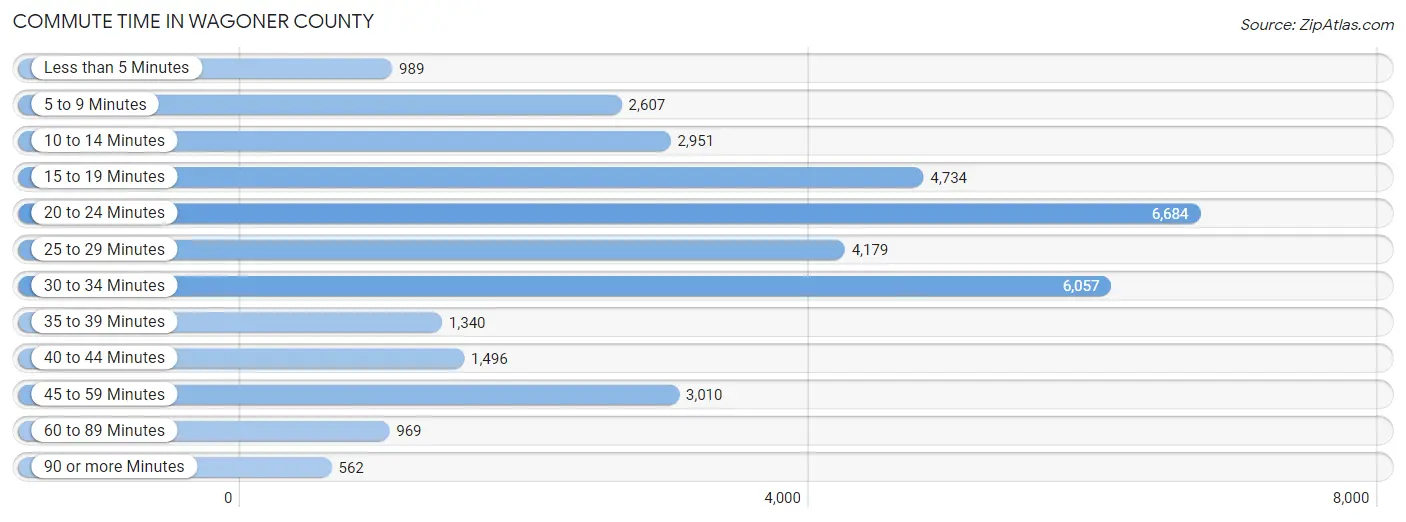
| Commute Time | # Commuters | % Commuters |
| Less than 5 Minutes | 989 | 2.8% |
| 5 to 9 Minutes | 2,607 | 7.3% |
| 10 to 14 Minutes | 2,951 | 8.3% |
| 15 to 19 Minutes | 4,734 | 13.3% |
| 20 to 24 Minutes | 6,684 | 18.8% |
| 25 to 29 Minutes | 4,179 | 11.7% |
| 30 to 34 Minutes | 6,057 | 17.0% |
| 35 to 39 Minutes | 1,340 | 3.8% |
| 40 to 44 Minutes | 1,496 | 4.2% |
| 45 to 59 Minutes | 3,010 | 8.5% |
| 60 to 89 Minutes | 969 | 2.7% |
| 90 or more Minutes | 562 | 1.6% |
Commute Time by Sex in Wagoner County
The most common commute times in Wagoner County are 20 to 24 minutes (3,751 commuters, 18.9%) for males and 30 to 34 minutes (2,978 commuters, 18.9%) for females.
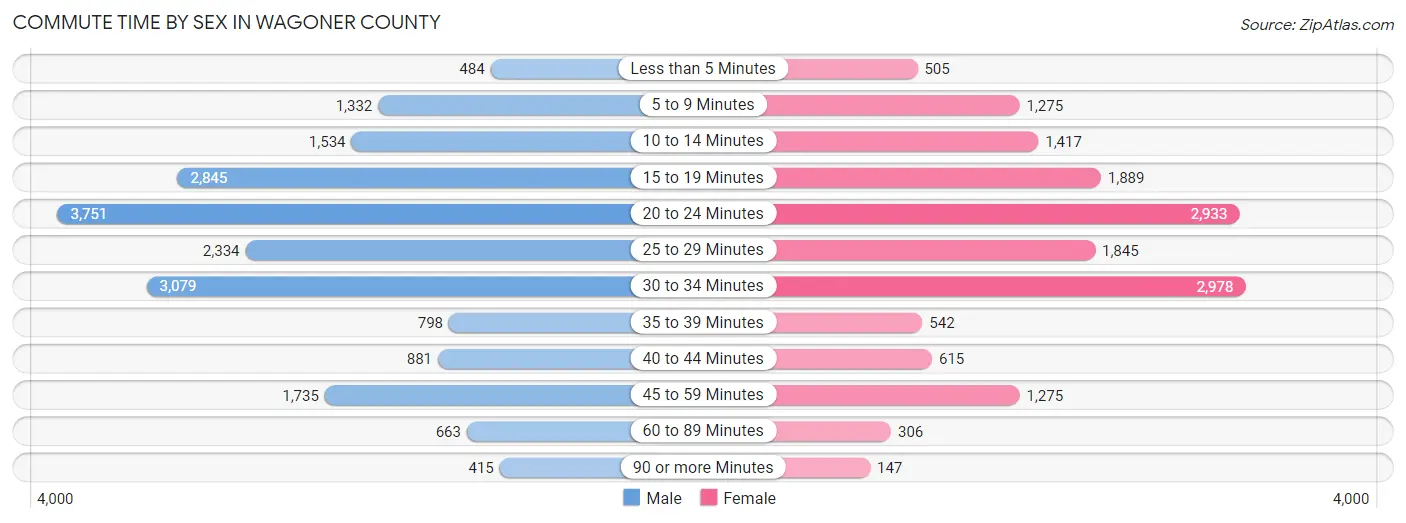
| Commute Time | Male | Female |
| Less than 5 Minutes | 484 (2.4%) | 505 (3.2%) |
| 5 to 9 Minutes | 1,332 (6.7%) | 1,275 (8.1%) |
| 10 to 14 Minutes | 1,534 (7.7%) | 1,417 (9.0%) |
| 15 to 19 Minutes | 2,845 (14.3%) | 1,889 (12.0%) |
| 20 to 24 Minutes | 3,751 (18.9%) | 2,933 (18.6%) |
| 25 to 29 Minutes | 2,334 (11.8%) | 1,845 (11.7%) |
| 30 to 34 Minutes | 3,079 (15.5%) | 2,978 (18.9%) |
| 35 to 39 Minutes | 798 (4.0%) | 542 (3.5%) |
| 40 to 44 Minutes | 881 (4.4%) | 615 (3.9%) |
| 45 to 59 Minutes | 1,735 (8.7%) | 1,275 (8.1%) |
| 60 to 89 Minutes | 663 (3.3%) | 306 (1.9%) |
| 90 or more Minutes | 415 (2.1%) | 147 (0.9%) |
Time of Departure to Work by Sex in Wagoner County
The most frequent times of departure to work in Wagoner County are 7:00 AM to 7:29 AM (3,076, 15.5%) for males and 7:00 AM to 7:29 AM (2,724, 17.3%) for females.
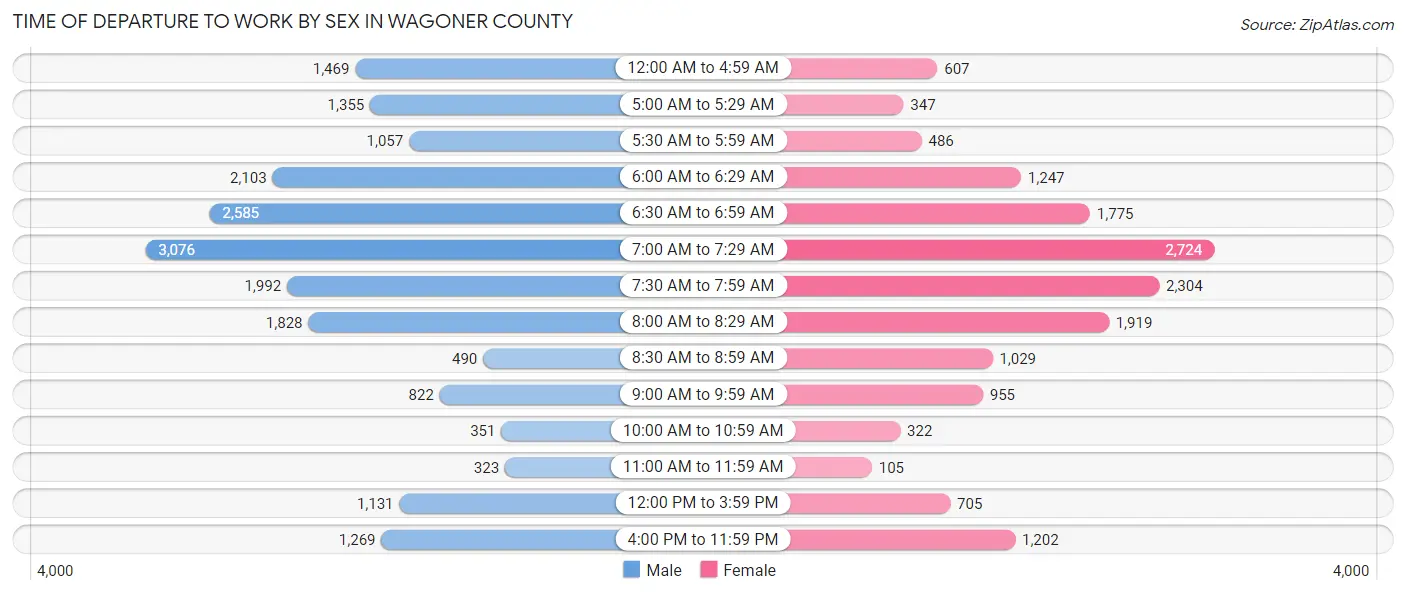
| Time of Departure | Male | Female |
| 12:00 AM to 4:59 AM | 1,469 (7.4%) | 607 (3.9%) |
| 5:00 AM to 5:29 AM | 1,355 (6.8%) | 347 (2.2%) |
| 5:30 AM to 5:59 AM | 1,057 (5.3%) | 486 (3.1%) |
| 6:00 AM to 6:29 AM | 2,103 (10.6%) | 1,247 (7.9%) |
| 6:30 AM to 6:59 AM | 2,585 (13.0%) | 1,775 (11.3%) |
| 7:00 AM to 7:29 AM | 3,076 (15.5%) | 2,724 (17.3%) |
| 7:30 AM to 7:59 AM | 1,992 (10.0%) | 2,304 (14.6%) |
| 8:00 AM to 8:29 AM | 1,828 (9.2%) | 1,919 (12.2%) |
| 8:30 AM to 8:59 AM | 490 (2.5%) | 1,029 (6.5%) |
| 9:00 AM to 9:59 AM | 822 (4.1%) | 955 (6.1%) |
| 10:00 AM to 10:59 AM | 351 (1.8%) | 322 (2.1%) |
| 11:00 AM to 11:59 AM | 323 (1.6%) | 105 (0.7%) |
| 12:00 PM to 3:59 PM | 1,131 (5.7%) | 705 (4.5%) |
| 4:00 PM to 11:59 PM | 1,269 (6.4%) | 1,202 (7.6%) |
| Total | 19,851 (100.0%) | 15,727 (100.0%) |
Housing Occupancy in Wagoner County
Occupancy by Ownership in Wagoner County
Of the total 30,086 dwellings in Wagoner County, owner-occupied units account for 24,103 (80.1%), while renter-occupied units make up 5,983 (19.9%).
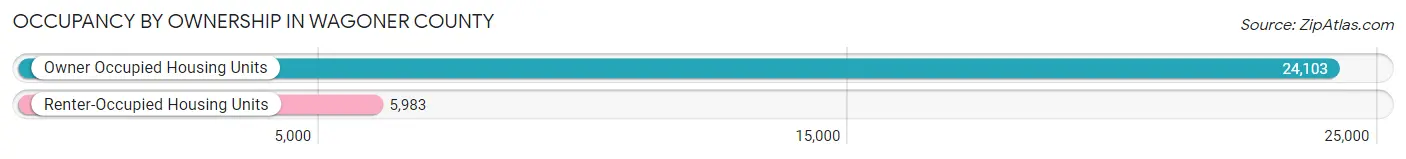
| Occupancy | # Housing Units | % Housing Units |
| Owner Occupied Housing Units | 24,103 | 80.1% |
| Renter-Occupied Housing Units | 5,983 | 19.9% |
| Total Occupied Housing Units | 30,086 | 100.0% |
Occupancy by Household Size in Wagoner County
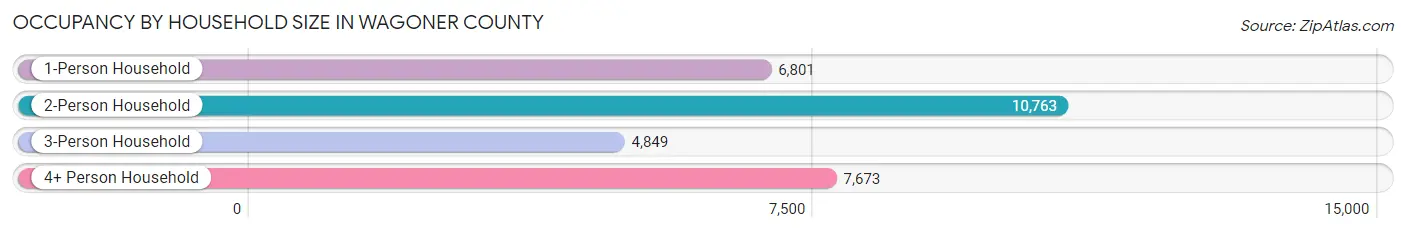
| Household Size | # Housing Units | % Housing Units |
| 1-Person Household | 6,801 | 22.6% |
| 2-Person Household | 10,763 | 35.8% |
| 3-Person Household | 4,849 | 16.1% |
| 4+ Person Household | 7,673 | 25.5% |
| Total Housing Units | 30,086 | 100.0% |
Occupancy by Ownership by Household Size in Wagoner County
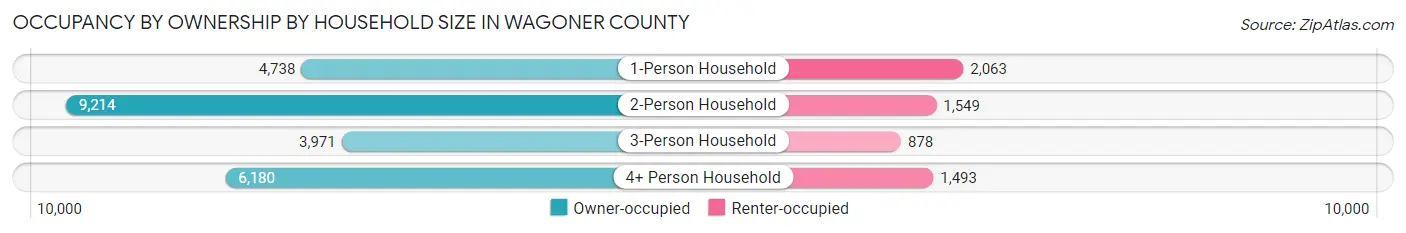
| Household Size | Owner-occupied | Renter-occupied |
| 1-Person Household | 4,738 (69.7%) | 2,063 (30.3%) |
| 2-Person Household | 9,214 (85.6%) | 1,549 (14.4%) |
| 3-Person Household | 3,971 (81.9%) | 878 (18.1%) |
| 4+ Person Household | 6,180 (80.5%) | 1,493 (19.5%) |
| Total Housing Units | 24,103 (80.1%) | 5,983 (19.9%) |
Occupancy by Educational Attainment in Wagoner County
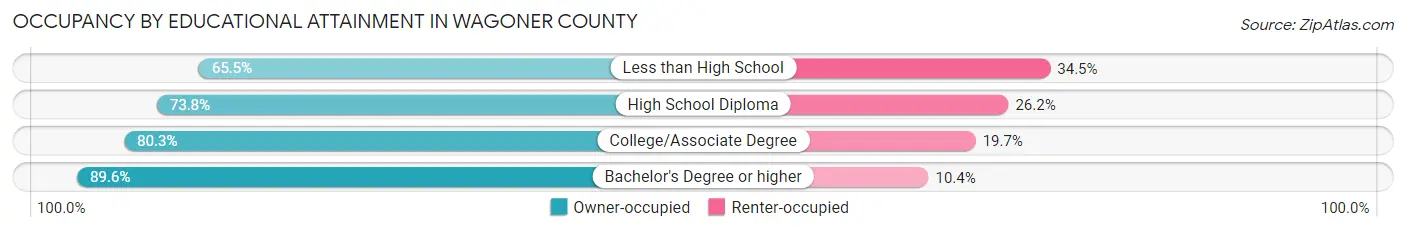
| Household Size | Owner-occupied | Renter-occupied |
| Less than High School | 1,486 (65.5%) | 784 (34.5%) |
| High School Diploma | 6,001 (73.8%) | 2,134 (26.2%) |
| College/Associate Degree | 8,762 (80.3%) | 2,154 (19.7%) |
| Bachelor's Degree or higher | 7,854 (89.6%) | 911 (10.4%) |
Occupancy by Age of Householder in Wagoner County
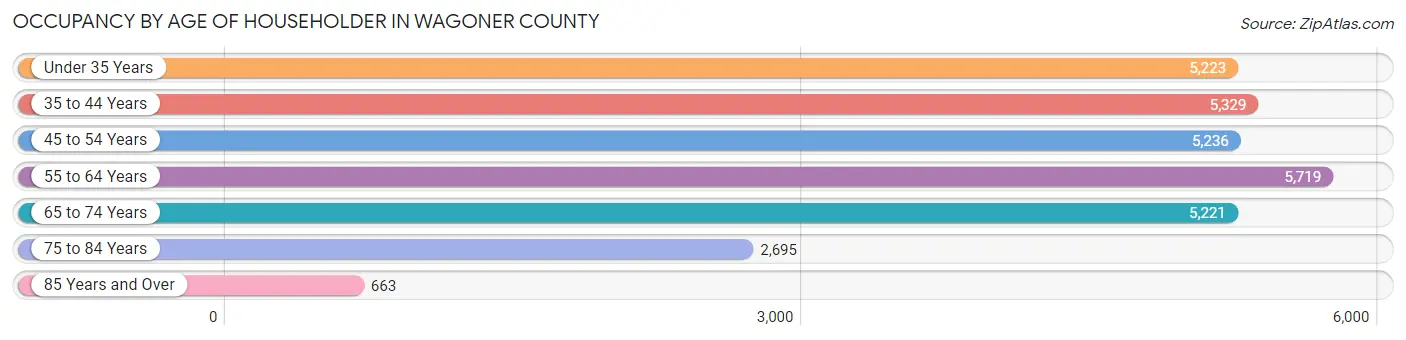
| Age Bracket | # Households | % Households |
| Under 35 Years | 5,223 | 17.4% |
| 35 to 44 Years | 5,329 | 17.7% |
| 45 to 54 Years | 5,236 | 17.4% |
| 55 to 64 Years | 5,719 | 19.0% |
| 65 to 74 Years | 5,221 | 17.3% |
| 75 to 84 Years | 2,695 | 9.0% |
| 85 Years and Over | 663 | 2.2% |
| Total | 30,086 | 100.0% |
Housing Finances in Wagoner County
Median Income by Occupancy in Wagoner County
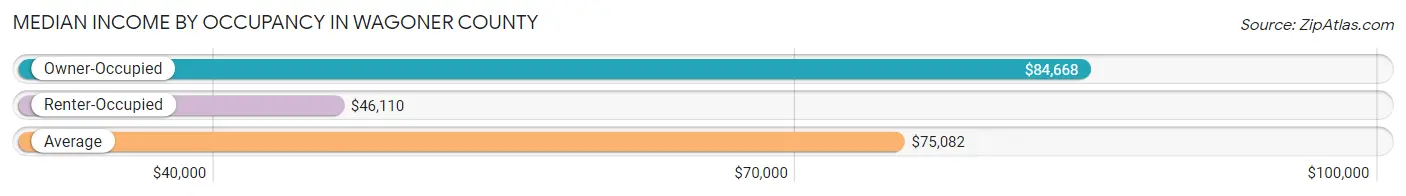
| Occupancy Type | # Households | Median Income |
| Owner-Occupied | 24,103 (80.1%) | $84,668 |
| Renter-Occupied | 5,983 (19.9%) | $46,110 |
| Average | 30,086 (100.0%) | $75,082 |
Occupancy by Householder Income Bracket in Wagoner County
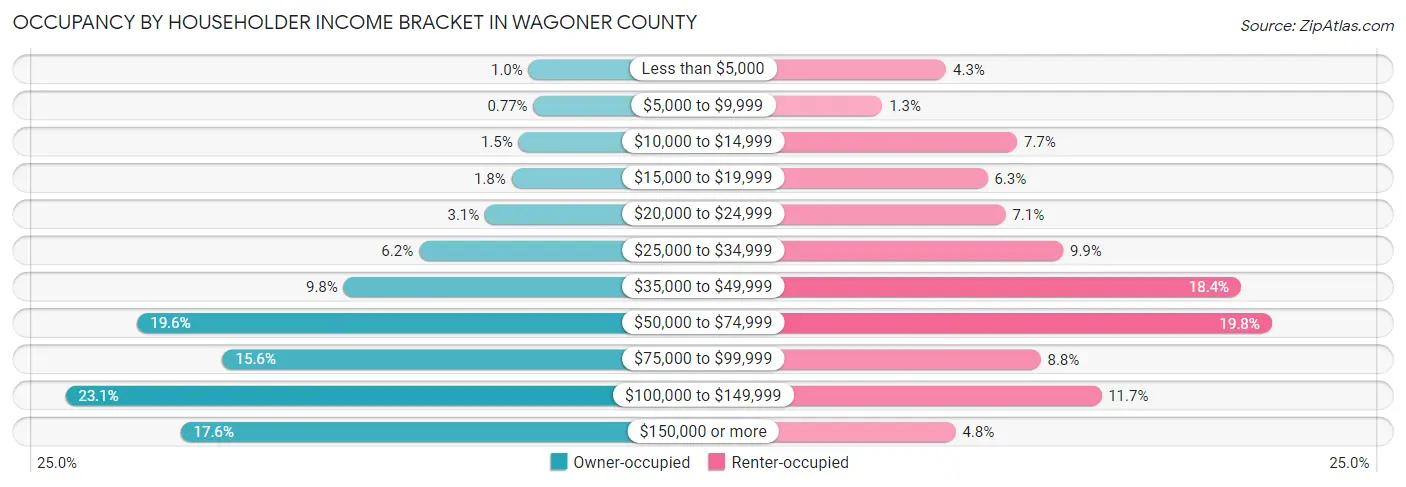
| Income Bracket | Owner-occupied | Renter-occupied |
| Less than $5,000 | 241 (1.0%) | 258 (4.3%) |
| $5,000 to $9,999 | 185 (0.8%) | 76 (1.3%) |
| $10,000 to $14,999 | 357 (1.5%) | 460 (7.7%) |
| $15,000 to $19,999 | 436 (1.8%) | 376 (6.3%) |
| $20,000 to $24,999 | 741 (3.1%) | 427 (7.1%) |
| $25,000 to $34,999 | 1,500 (6.2%) | 591 (9.9%) |
| $35,000 to $49,999 | 2,365 (9.8%) | 1,098 (18.3%) |
| $50,000 to $74,999 | 4,732 (19.6%) | 1,185 (19.8%) |
| $75,000 to $99,999 | 3,753 (15.6%) | 527 (8.8%) |
| $100,000 to $149,999 | 5,557 (23.1%) | 700 (11.7%) |
| $150,000 or more | 4,236 (17.6%) | 285 (4.8%) |
| Total | 24,103 (100.0%) | 5,983 (100.0%) |
Monthly Housing Cost Tiers in Wagoner County
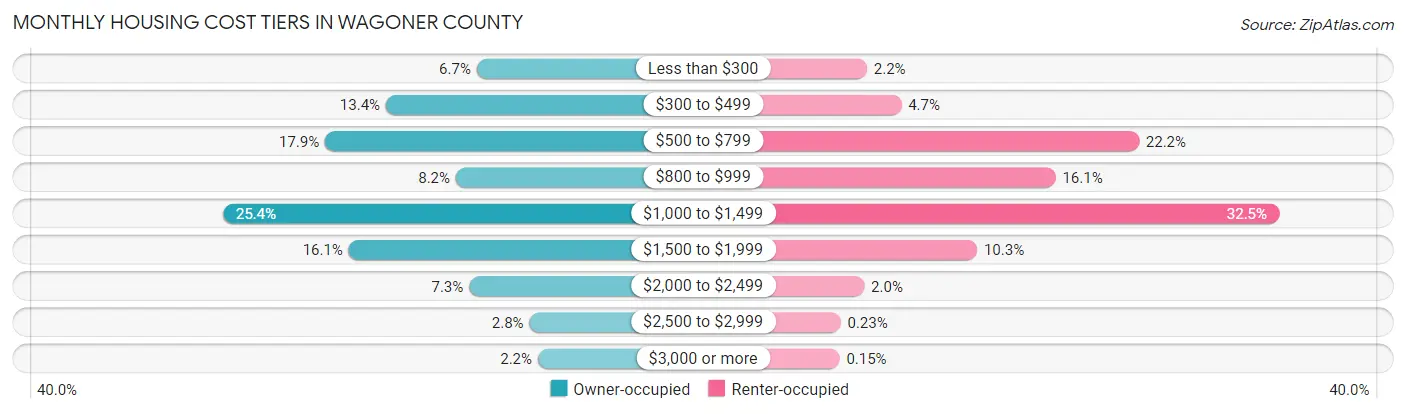
| Monthly Cost | Owner-occupied | Renter-occupied |
| Less than $300 | 1,615 (6.7%) | 130 (2.2%) |
| $300 to $499 | 3,227 (13.4%) | 281 (4.7%) |
| $500 to $799 | 4,308 (17.9%) | 1,328 (22.2%) |
| $800 to $999 | 1,985 (8.2%) | 961 (16.1%) |
| $1,000 to $1,499 | 6,122 (25.4%) | 1,945 (32.5%) |
| $1,500 to $1,999 | 3,888 (16.1%) | 615 (10.3%) |
| $2,000 to $2,499 | 1,749 (7.3%) | 118 (2.0%) |
| $2,500 to $2,999 | 679 (2.8%) | 14 (0.2%) |
| $3,000 or more | 530 (2.2%) | 9 (0.2%) |
| Total | 24,103 (100.0%) | 5,983 (100.0%) |
Physical Housing Characteristics in Wagoner County
Housing Structures in Wagoner County
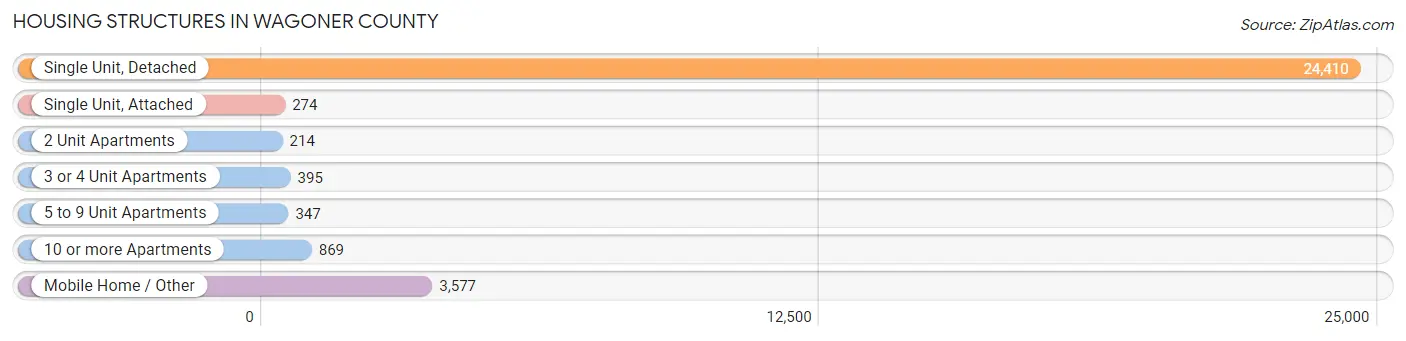
| Structure Type | # Housing Units | % Housing Units |
| Single Unit, Detached | 24,410 | 81.1% |
| Single Unit, Attached | 274 | 0.9% |
| 2 Unit Apartments | 214 | 0.7% |
| 3 or 4 Unit Apartments | 395 | 1.3% |
| 5 to 9 Unit Apartments | 347 | 1.1% |
| 10 or more Apartments | 869 | 2.9% |
| Mobile Home / Other | 3,577 | 11.9% |
| Total | 30,086 | 100.0% |
Housing Structures by Occupancy in Wagoner County
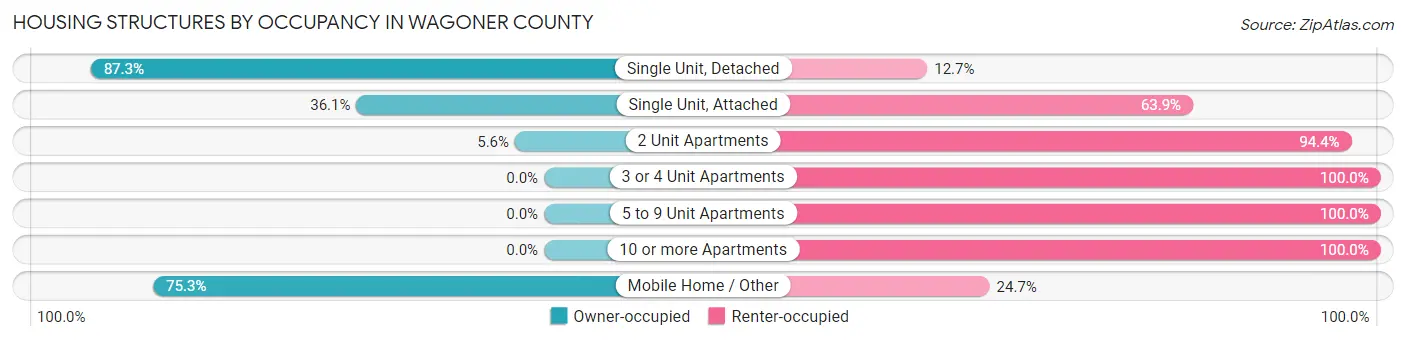
| Structure Type | Owner-occupied | Renter-occupied |
| Single Unit, Detached | 21,300 (87.3%) | 3,110 (12.7%) |
| Single Unit, Attached | 99 (36.1%) | 175 (63.9%) |
| 2 Unit Apartments | 12 (5.6%) | 202 (94.4%) |
| 3 or 4 Unit Apartments | 0 (0.0%) | 395 (100.0%) |
| 5 to 9 Unit Apartments | 0 (0.0%) | 347 (100.0%) |
| 10 or more Apartments | 0 (0.0%) | 869 (100.0%) |
| Mobile Home / Other | 2,692 (75.3%) | 885 (24.7%) |
| Total | 24,103 (80.1%) | 5,983 (19.9%) |
Housing Structures by Number of Rooms in Wagoner County
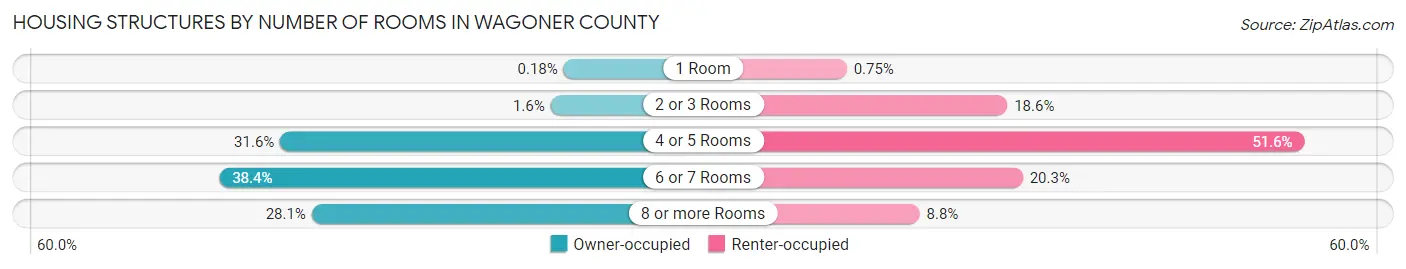
| Number of Rooms | Owner-occupied | Renter-occupied |
| 1 Room | 44 (0.2%) | 45 (0.7%) |
| 2 or 3 Rooms | 394 (1.6%) | 1,111 (18.6%) |
| 4 or 5 Rooms | 7,627 (31.6%) | 3,084 (51.5%) |
| 6 or 7 Rooms | 9,255 (38.4%) | 1,214 (20.3%) |
| 8 or more Rooms | 6,783 (28.1%) | 529 (8.8%) |
| Total | 24,103 (100.0%) | 5,983 (100.0%) |
Housing Structure by Heating Type in Wagoner County
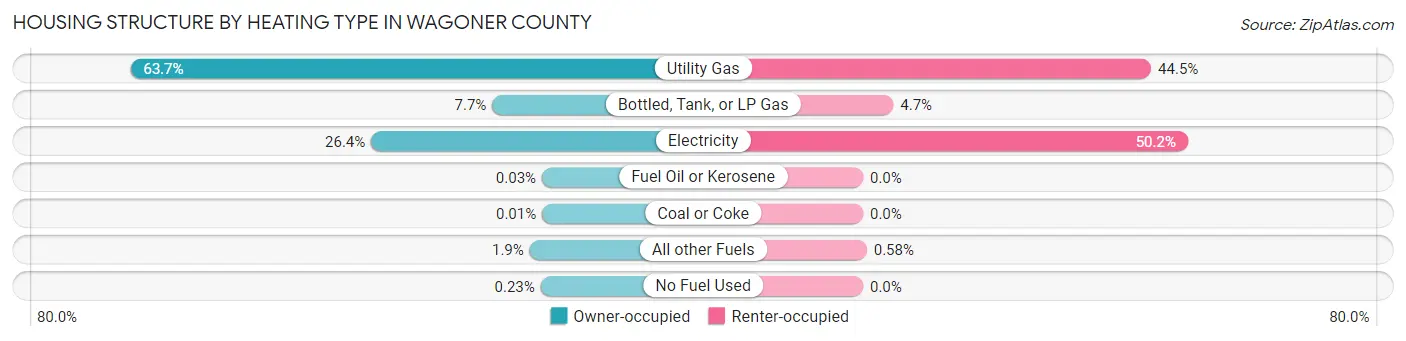
| Heating Type | Owner-occupied | Renter-occupied |
| Utility Gas | 15,343 (63.7%) | 2,665 (44.5%) |
| Bottled, Tank, or LP Gas | 1,860 (7.7%) | 280 (4.7%) |
| Electricity | 6,370 (26.4%) | 3,003 (50.2%) |
| Fuel Oil or Kerosene | 8 (0.0%) | 0 (0.0%) |
| Coal or Coke | 2 (0.0%) | 0 (0.0%) |
| All other Fuels | 465 (1.9%) | 35 (0.6%) |
| No Fuel Used | 55 (0.2%) | 0 (0.0%) |
| Total | 24,103 (100.0%) | 5,983 (100.0%) |
Household Vehicle Usage in Wagoner County
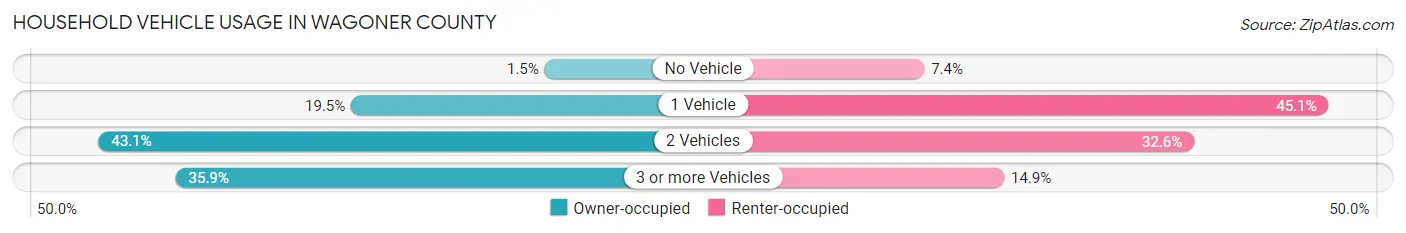
| Vehicles per Household | Owner-occupied | Renter-occupied |
| No Vehicle | 351 (1.5%) | 443 (7.4%) |
| 1 Vehicle | 4,706 (19.5%) | 2,701 (45.1%) |
| 2 Vehicles | 10,392 (43.1%) | 1,950 (32.6%) |
| 3 or more Vehicles | 8,654 (35.9%) | 889 (14.9%) |
| Total | 24,103 (100.0%) | 5,983 (100.0%) |
Real Estate & Mortgages in Wagoner County
Real Estate and Mortgage Overview in Wagoner County
| Characteristic | Without Mortgage | With Mortgage |
| Housing Units | 9,225 | 14,878 |
| Median Property Value | $179,000 | $210,500 |
| Median Household Income | $62,716 | $3,230 |
| Monthly Housing Costs | $492 | $521 |
| Real Estate Taxes | $1,315 | $868 |
Property Value by Mortgage Status in Wagoner County
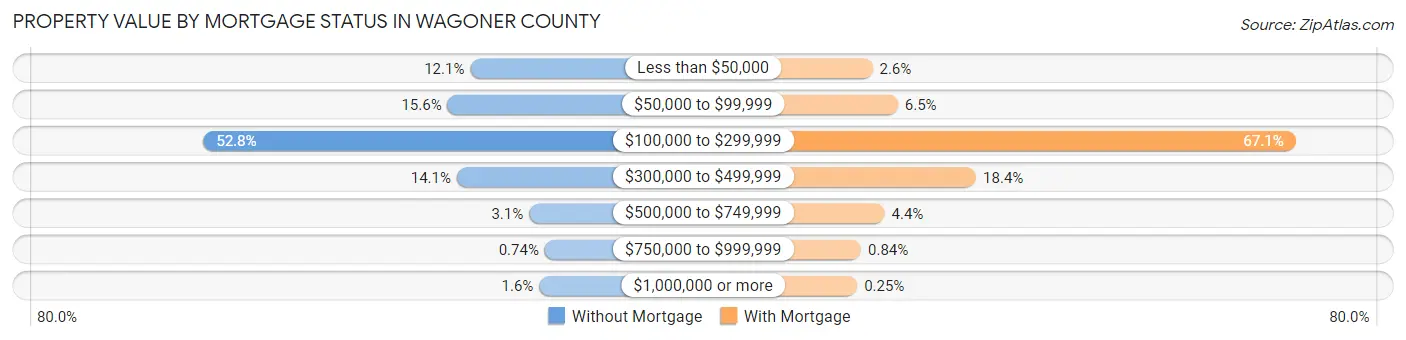
| Property Value | Without Mortgage | With Mortgage |
| Less than $50,000 | 1,115 (12.1%) | 386 (2.6%) |
| $50,000 to $99,999 | 1,435 (15.6%) | 959 (6.5%) |
| $100,000 to $299,999 | 4,867 (52.8%) | 9,977 (67.1%) |
| $300,000 to $499,999 | 1,304 (14.1%) | 2,735 (18.4%) |
| $500,000 to $749,999 | 289 (3.1%) | 659 (4.4%) |
| $750,000 to $999,999 | 68 (0.7%) | 125 (0.8%) |
| $1,000,000 or more | 147 (1.6%) | 37 (0.3%) |
| Total | 9,225 (100.0%) | 14,878 (100.0%) |
Household Income by Mortgage Status in Wagoner County
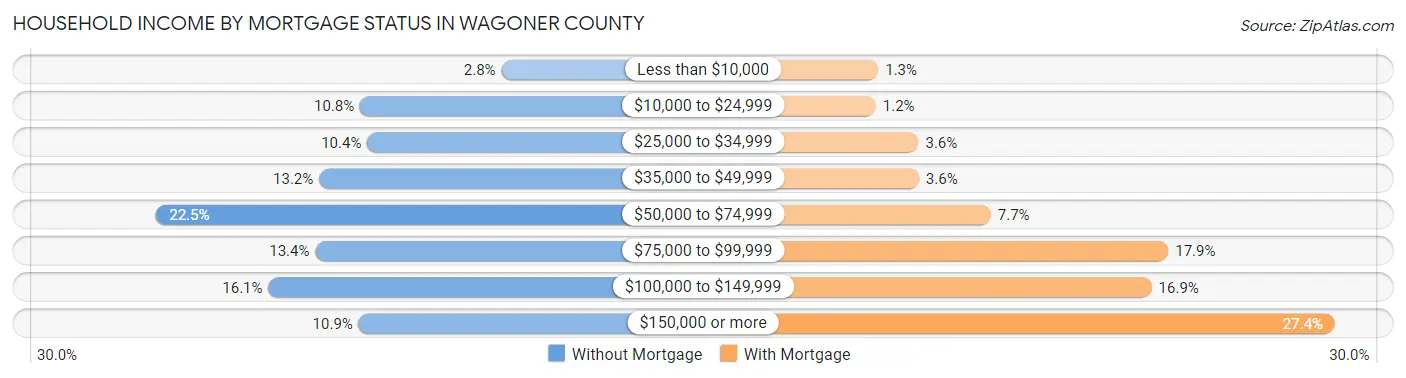
| Household Income | Without Mortgage | With Mortgage |
| Less than $10,000 | 254 (2.8%) | 194 (1.3%) |
| $10,000 to $24,999 | 999 (10.8%) | 172 (1.2%) |
| $25,000 to $34,999 | 961 (10.4%) | 535 (3.6%) |
| $35,000 to $49,999 | 1,215 (13.2%) | 539 (3.6%) |
| $50,000 to $74,999 | 2,073 (22.5%) | 1,150 (7.7%) |
| $75,000 to $99,999 | 1,235 (13.4%) | 2,659 (17.9%) |
| $100,000 to $149,999 | 1,482 (16.1%) | 2,518 (16.9%) |
| $150,000 or more | 1,006 (10.9%) | 4,075 (27.4%) |
| Total | 9,225 (100.0%) | 14,878 (100.0%) |
Property Value to Household Income Ratio in Wagoner County
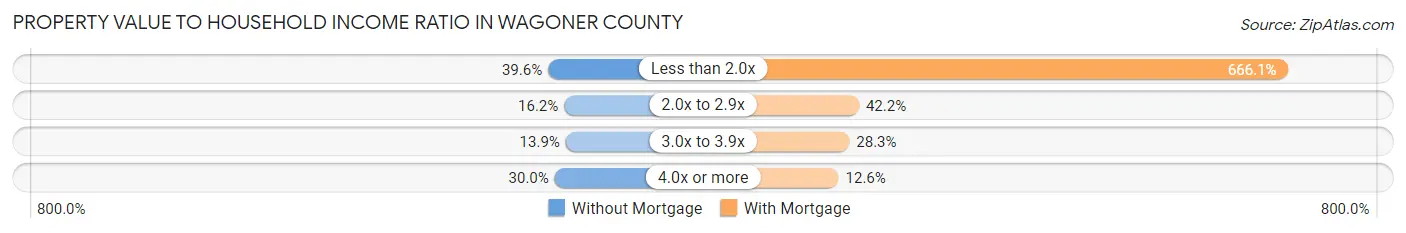
| Value-to-Income Ratio | Without Mortgage | With Mortgage |
| Less than 2.0x | 3,653 (39.6%) | 99,104 (666.1%) |
| 2.0x to 2.9x | 1,490 (16.2%) | 6,280 (42.2%) |
| 3.0x to 3.9x | 1,281 (13.9%) | 4,206 (28.3%) |
| 4.0x or more | 2,765 (30.0%) | 1,875 (12.6%) |
| Total | 9,225 (100.0%) | 14,878 (100.0%) |
Real Estate Taxes by Mortgage Status in Wagoner County
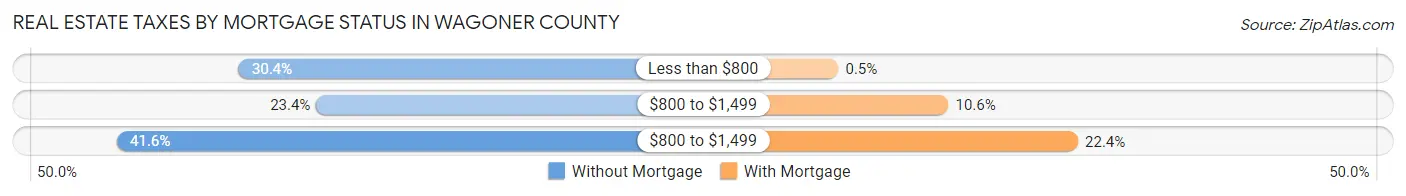
| Property Taxes | Without Mortgage | With Mortgage |
| Less than $800 | 2,807 (30.4%) | 75 (0.5%) |
| $800 to $1,499 | 2,156 (23.4%) | 1,569 (10.5%) |
| $800 to $1,499 | 3,833 (41.5%) | 3,330 (22.4%) |
| Total | 9,225 (100.0%) | 14,878 (100.0%) |
Health & Disability in Wagoner County
Health Insurance Coverage by Age in Wagoner County
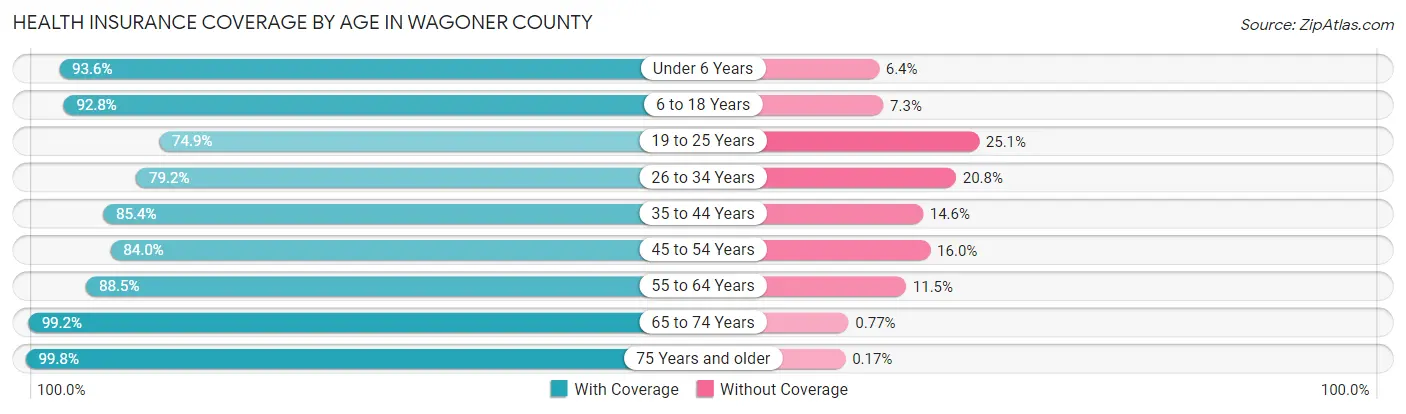
| Age Bracket | With Coverage | Without Coverage |
| Under 6 Years | 5,397 (93.6%) | 371 (6.4%) |
| 6 to 18 Years | 13,813 (92.7%) | 1,080 (7.2%) |
| 19 to 25 Years | 4,717 (74.9%) | 1,580 (25.1%) |
| 26 to 34 Years | 7,527 (79.2%) | 1,976 (20.8%) |
| 35 to 44 Years | 9,396 (85.4%) | 1,611 (14.6%) |
| 45 to 54 Years | 8,585 (84.0%) | 1,636 (16.0%) |
| 55 to 64 Years | 9,351 (88.5%) | 1,213 (11.5%) |
| 65 to 74 Years | 8,328 (99.2%) | 65 (0.8%) |
| 75 Years and older | 5,279 (99.8%) | 9 (0.2%) |
| Total | 72,393 (88.4%) | 9,541 (11.6%) |
Health Insurance Coverage by Citizenship Status in Wagoner County
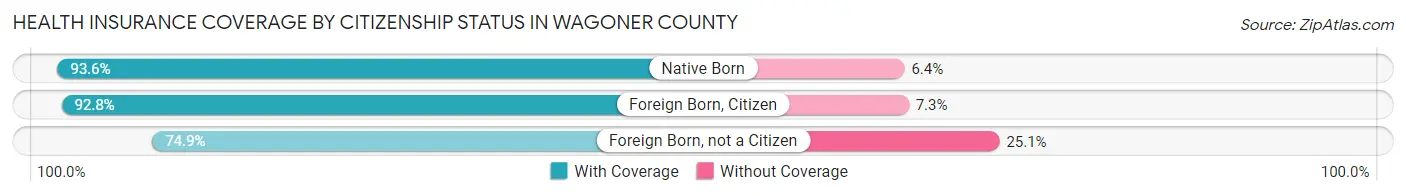
| Citizenship Status | With Coverage | Without Coverage |
| Native Born | 5,397 (93.6%) | 371 (6.4%) |
| Foreign Born, Citizen | 13,813 (92.7%) | 1,080 (7.2%) |
| Foreign Born, not a Citizen | 4,717 (74.9%) | 1,580 (25.1%) |
Health Insurance Coverage by Household Income in Wagoner County
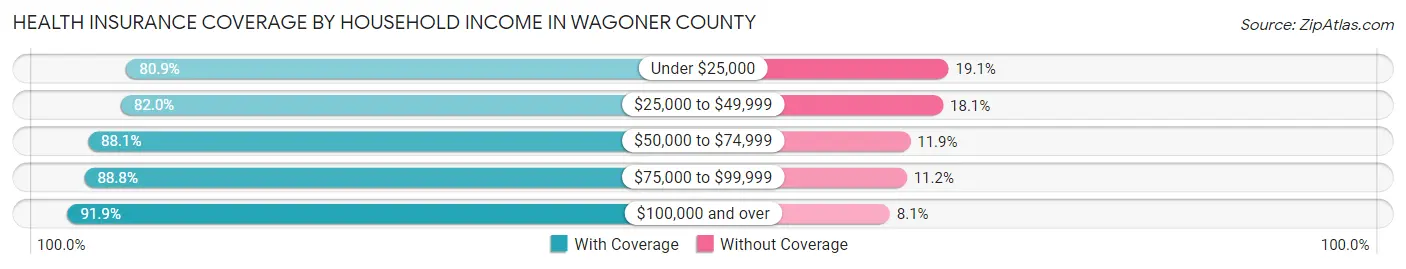
| Household Income | With Coverage | Without Coverage |
| Under $25,000 | 5,150 (80.9%) | 1,214 (19.1%) |
| $25,000 to $49,999 | 10,410 (82.0%) | 2,293 (18.0%) |
| $50,000 to $74,999 | 13,306 (88.1%) | 1,795 (11.9%) |
| $75,000 to $99,999 | 10,941 (88.8%) | 1,384 (11.2%) |
| $100,000 and over | 32,564 (91.9%) | 2,853 (8.1%) |
Public vs Private Health Insurance Coverage by Age in Wagoner County
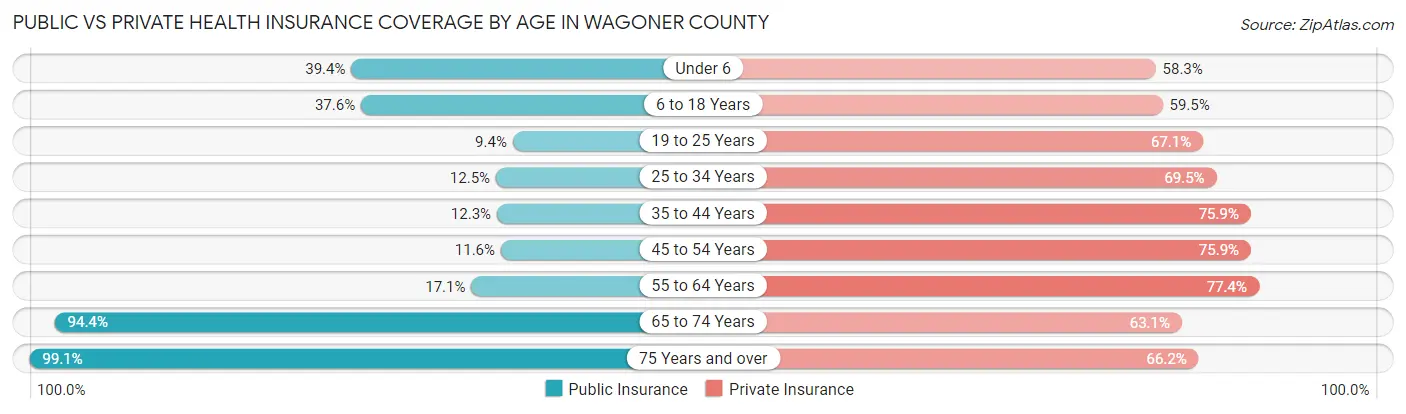
| Age Bracket | Public Insurance | Private Insurance |
| Under 6 | 2,270 (39.4%) | 3,360 (58.3%) |
| 6 to 18 Years | 5,594 (37.6%) | 8,868 (59.5%) |
| 19 to 25 Years | 591 (9.4%) | 4,222 (67.0%) |
| 25 to 34 Years | 1,190 (12.5%) | 6,607 (69.5%) |
| 35 to 44 Years | 1,357 (12.3%) | 8,354 (75.9%) |
| 45 to 54 Years | 1,186 (11.6%) | 7,761 (75.9%) |
| 55 to 64 Years | 1,805 (17.1%) | 8,175 (77.4%) |
| 65 to 74 Years | 7,925 (94.4%) | 5,296 (63.1%) |
| 75 Years and over | 5,241 (99.1%) | 3,502 (66.2%) |
| Total | 27,159 (33.2%) | 56,145 (68.5%) |
Disability Status by Sex by Age in Wagoner County
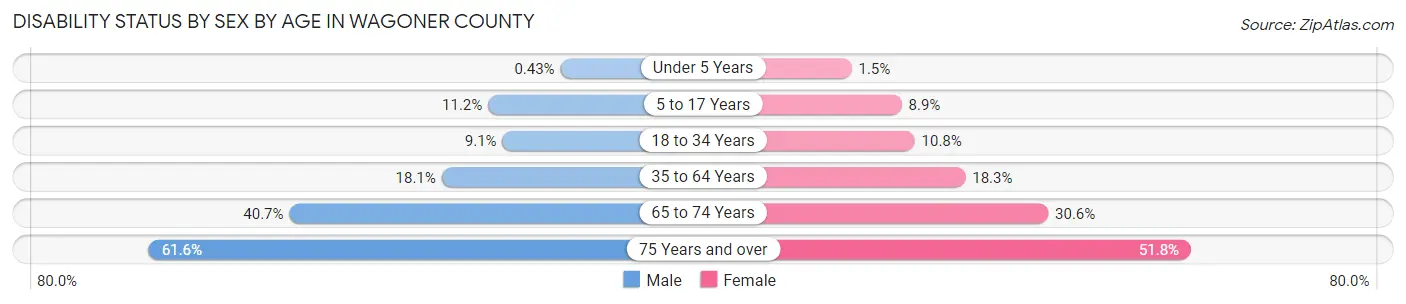
| Age Bracket | Male | Female |
| Under 5 Years | 10 (0.4%) | 33 (1.5%) |
| 5 to 17 Years | 856 (11.2%) | 642 (8.9%) |
| 18 to 34 Years | 777 (9.0%) | 904 (10.8%) |
| 35 to 64 Years | 2,862 (18.1%) | 2,927 (18.3%) |
| 65 to 74 Years | 1,620 (40.7%) | 1,352 (30.6%) |
| 75 Years and over | 1,494 (61.6%) | 1,483 (51.8%) |
Disability Class by Sex by Age in Wagoner County
Disability Class: Hearing Difficulty
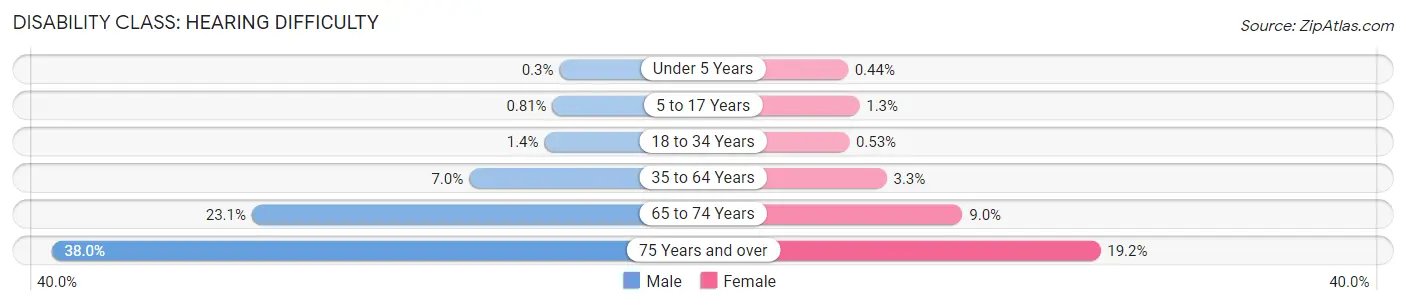
| Age Bracket | Male | Female |
| Under 5 Years | 7 (0.3%) | 10 (0.4%) |
| 5 to 17 Years | 62 (0.8%) | 94 (1.3%) |
| 18 to 34 Years | 121 (1.4%) | 44 (0.5%) |
| 35 to 64 Years | 1,108 (7.0%) | 530 (3.3%) |
| 65 to 74 Years | 921 (23.1%) | 395 (8.9%) |
| 75 Years and over | 922 (38.0%) | 549 (19.2%) |
Disability Class: Vision Difficulty
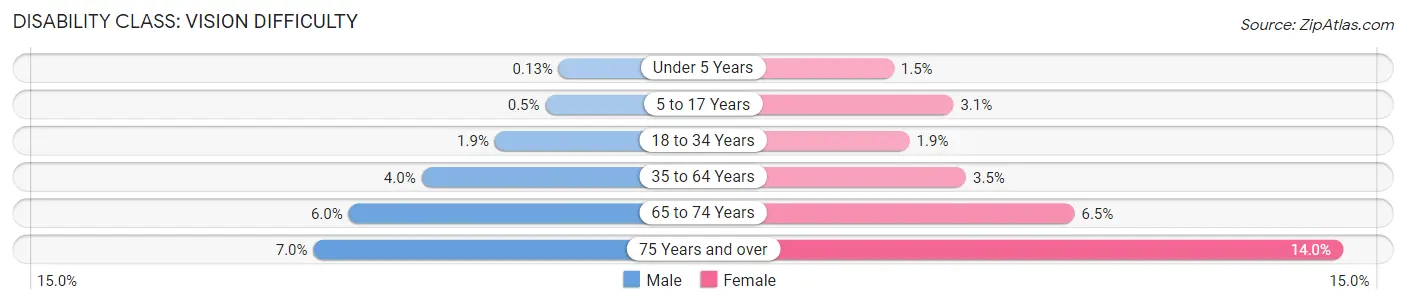
| Age Bracket | Male | Female |
| Under 5 Years | 3 (0.1%) | 33 (1.5%) |
| 5 to 17 Years | 38 (0.5%) | 225 (3.1%) |
| 18 to 34 Years | 164 (1.9%) | 158 (1.9%) |
| 35 to 64 Years | 626 (4.0%) | 553 (3.5%) |
| 65 to 74 Years | 238 (6.0%) | 286 (6.5%) |
| 75 Years and over | 169 (7.0%) | 399 (14.0%) |
Disability Class: Cognitive Difficulty
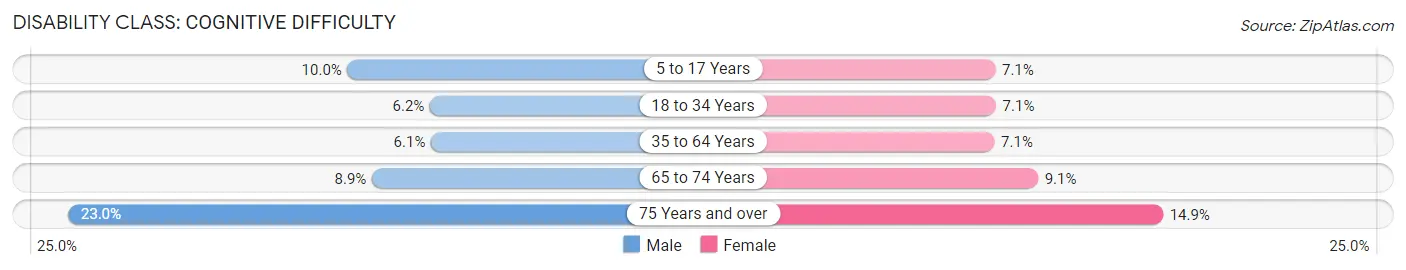
| Age Bracket | Male | Female |
| 5 to 17 Years | 767 (10.0%) | 514 (7.1%) |
| 18 to 34 Years | 531 (6.2%) | 597 (7.1%) |
| 35 to 64 Years | 971 (6.1%) | 1,128 (7.1%) |
| 65 to 74 Years | 353 (8.9%) | 401 (9.1%) |
| 75 Years and over | 558 (23.0%) | 426 (14.9%) |
Disability Class: Ambulatory Difficulty
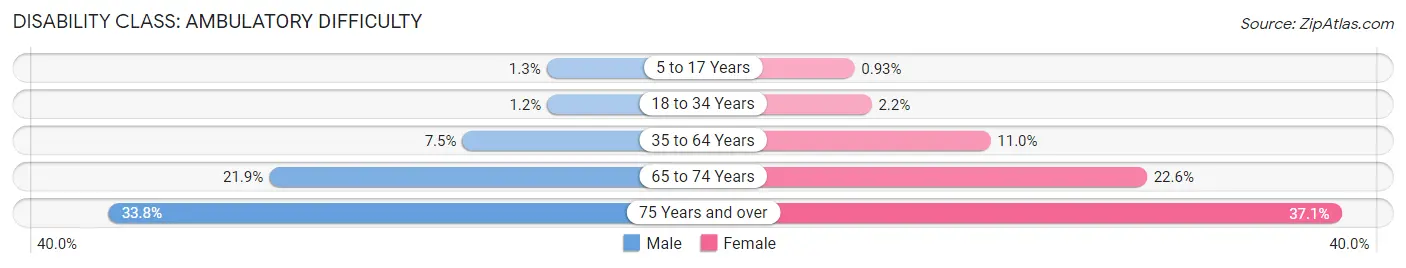
| Age Bracket | Male | Female |
| 5 to 17 Years | 96 (1.3%) | 67 (0.9%) |
| 18 to 34 Years | 104 (1.2%) | 184 (2.2%) |
| 35 to 64 Years | 1,187 (7.5%) | 1,761 (11.0%) |
| 65 to 74 Years | 870 (21.8%) | 999 (22.6%) |
| 75 Years and over | 819 (33.8%) | 1,061 (37.1%) |
Disability Class: Self-Care Difficulty
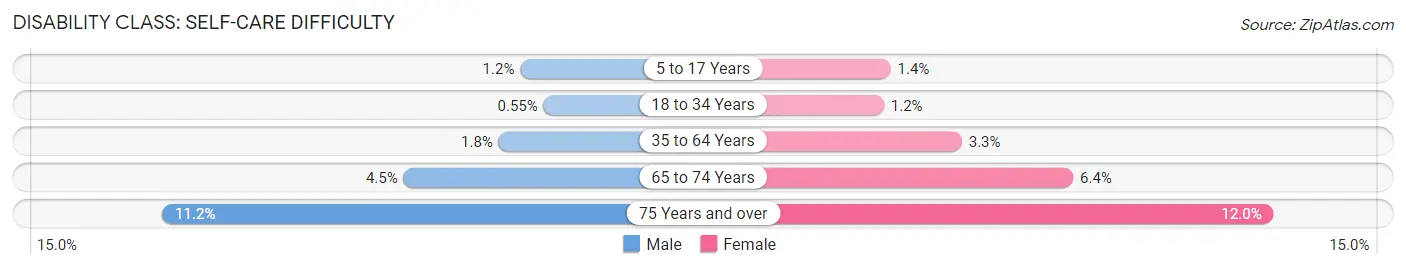
| Age Bracket | Male | Female |
| 5 to 17 Years | 92 (1.2%) | 98 (1.4%) |
| 18 to 34 Years | 47 (0.5%) | 98 (1.2%) |
| 35 to 64 Years | 285 (1.8%) | 533 (3.3%) |
| 65 to 74 Years | 177 (4.4%) | 284 (6.4%) |
| 75 Years and over | 271 (11.2%) | 344 (12.0%) |
Technology Access in Wagoner County
Computing Device Access in Wagoner County
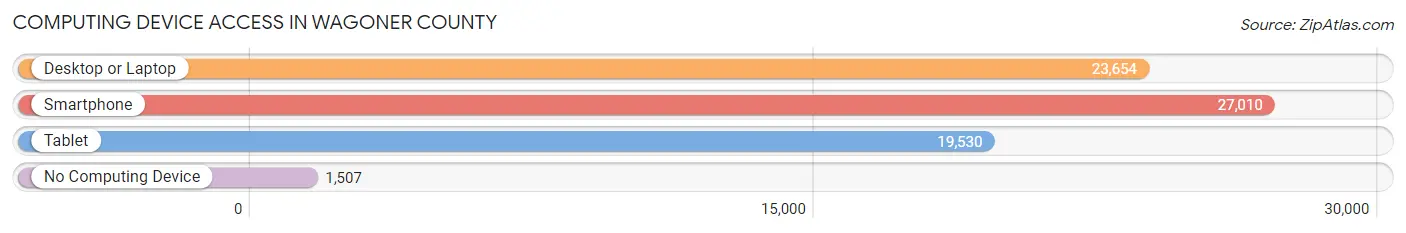
| Device Type | # Households | % Households |
| Desktop or Laptop | 23,654 | 78.6% |
| Smartphone | 27,010 | 89.8% |
| Tablet | 19,530 | 64.9% |
| No Computing Device | 1,507 | 5.0% |
| Total | 30,086 | 100.0% |
Internet Access in Wagoner County
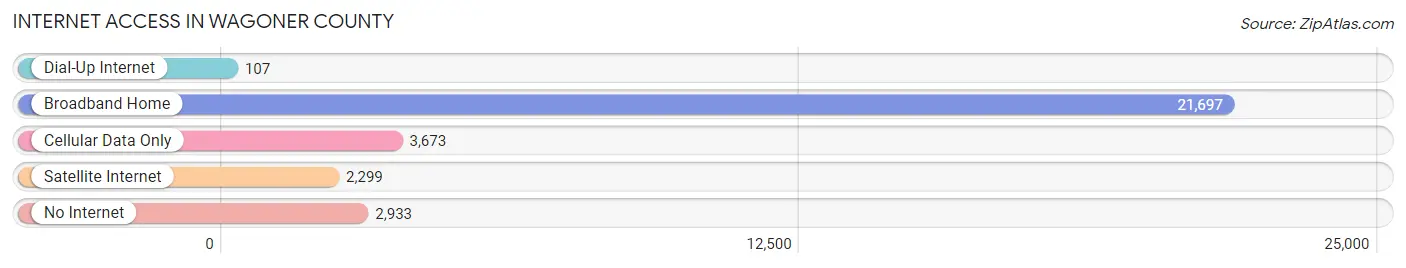
| Internet Type | # Households | % Households |
| Dial-Up Internet | 107 | 0.4% |
| Broadband Home | 21,697 | 72.1% |
| Cellular Data Only | 3,673 | 12.2% |
| Satellite Internet | 2,299 | 7.6% |
| No Internet | 2,933 | 9.8% |
| Total | 30,086 | 100.0% |
Wagoner County Summary
Wagoner County is located in the northeastern part of Oklahoma and is part of the Tulsa Metropolitan Statistical Area. The county was created in 1907 and named after the Cherokee leader, Pleasant Porter. It covers an area of 745 square miles and has a population of 73,085 as of the 2020 census.
Geography
Wagoner County is located in the northeastern part of Oklahoma and is bordered by Muskogee County to the north, Cherokee County to the east, Mayes County to the south, and Rogers County to the west. The county is located in the Ozark Plateau region of the state and is characterized by rolling hills and valleys. The Arkansas River forms the northern boundary of the county and the Verdigris River forms the eastern boundary. The county is home to several lakes, including Fort Gibson Lake, Lake Wister, and Lake Tenkiller.
Economy
The economy of Wagoner County is largely based on agriculture and manufacturing. The county is home to several large agricultural operations, including poultry farms, cattle ranches, and vegetable farms. The county is also home to several manufacturing companies, including a steel mill, a paper mill, and a plastics plant. The county is also home to several oil and gas companies, as well as several coal mines.
Demographics
As of the 2020 census, Wagoner County had a population of 73,085. The population is made up of a diverse mix of ethnicities, including White (77.2%), African American (14.2%), Native American (3.2%), Asian (1.7%), and Hispanic or Latino (2.7%). The median household income in the county is $50,845 and the median age is 38.3.
Education
Wagoner County is served by the Wagoner Public School District, which consists of seven elementary schools, two middle schools, and one high school. The county is also home to several private schools, including Wagoner Christian Academy and Wagoner Montessori School. The county is also home to several higher education institutions, including Northeastern State University and Rogers State University.
Conclusion
Wagoner County is a diverse and vibrant county located in the northeastern part of Oklahoma. The county is home to a variety of industries, including agriculture, manufacturing, oil and gas, and coal mining. The population of the county is made up of a diverse mix of ethnicities and the median household income is $50,845. The county is served by the Wagoner Public School District and several higher education institutions.
Common Questions
What is the Total Population of Wagoner County?
Total Population of Wagoner County is 82,269.
What is the Total Male Population of Wagoner County?
Total Male Population of Wagoner County is 41,011.
What is the Total Female Population of Wagoner County?
Total Female Population of Wagoner County is 41,258.
What is the Ratio of Males per 100 Females in Wagoner County?
There are 99.40 Males per 100 Females in Wagoner County.
What is the Ratio of Females per 100 Males in Wagoner County?
There are 100.60 Females per 100 Males in Wagoner County.
What is the Median Population Age in Wagoner County?
Median Population Age in Wagoner County is 38.9 Years.
What is the Average Family Size in Wagoner County
Average Family Size in Wagoner County is 3.2 People.
What is the Average Household Size in Wagoner County
Average Household Size in Wagoner County is 2.7 People.
What is Per Capita Income in Wagoner County?
Per Capita income in Wagoner County is $35,675.
What is the Median Family Income in Wagoner County?
Median Family Income in Wagoner County is $90,327.
What is the Median Household income in Wagoner County?
Median Household Income in Wagoner County is $75,082.
What is Income or Wage Gap in Wagoner County?
Income or Wage Gap in Wagoner County is 31.5%.
Women in Wagoner County earn 68.5 cents for every dollar earned by a man.
What is Family Income Deficit in Wagoner County?
Family Income Deficit in Wagoner County is $11,239.
Families that are below poverty line in Wagoner County earn $11,239 less on average than the poverty threshold level.
What is Inequality or Gini Index in Wagoner County?
Inequality or Gini Index in Wagoner County is 0.40.
How Large is the Labor Force in Wagoner County?
There are 41,033 People in the Labor Forcein in Wagoner County.
What is the Percentage of People in the Labor Force in Wagoner County?
63.3% of People are in the Labor Force in Wagoner County.
What is the Unemployment Rate in Wagoner County?
Unemployment Rate in Wagoner County is 4.9%.