Tulsa County, OK
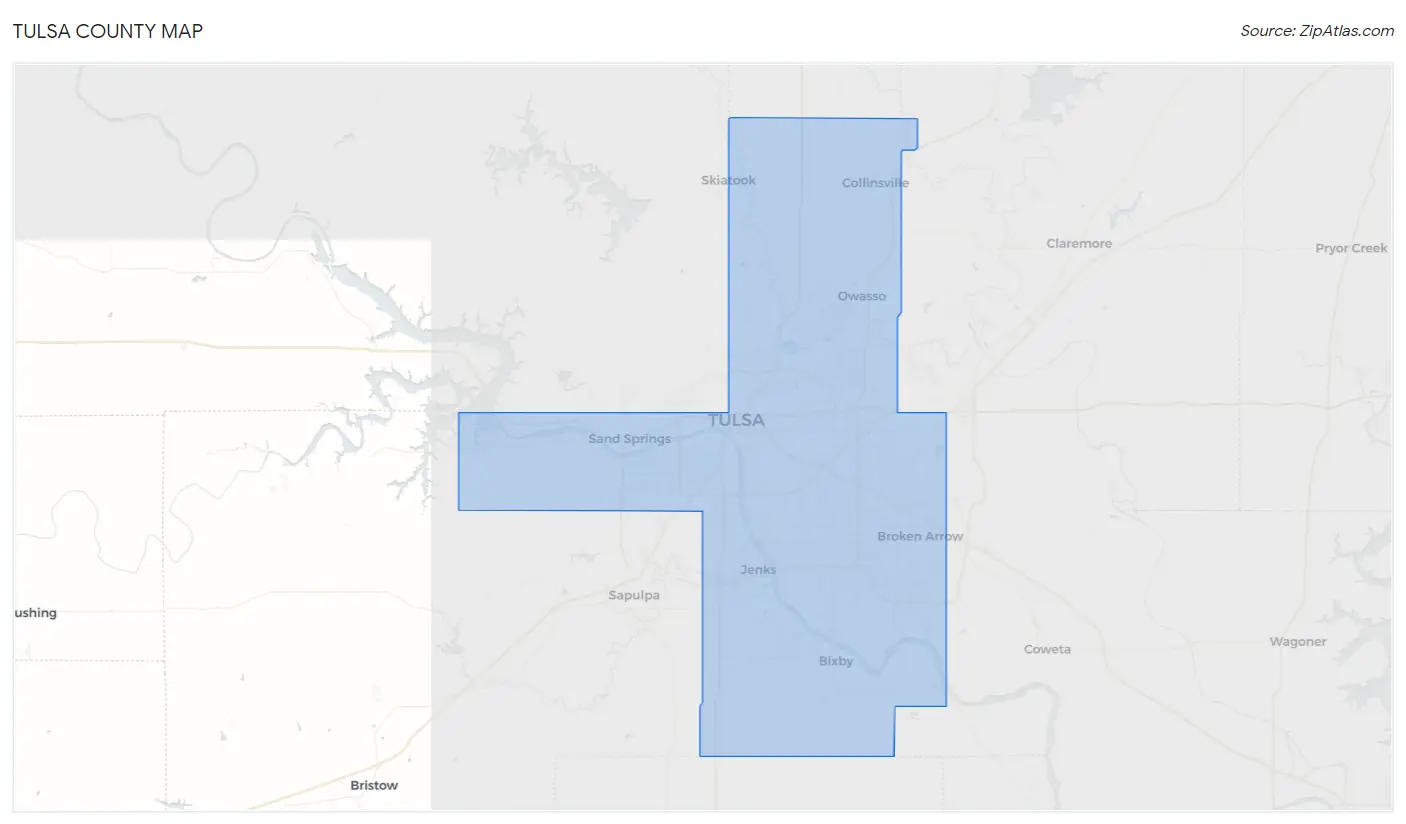
Tulsa County Map
Tulsa County Overview
668,923
TOTAL POPULATION
328,785
MALE POPULATION
340,138
FEMALE POPULATION
96.66
MALES / 100 FEMALES
103.45
FEMALES / 100 MALES
36.0
MEDIAN AGE
3.2
AVG FAMILY SIZE
2.5
AVG HOUSEHOLD SIZE
$38,496
PER CAPITA INCOME
$84,573
AVG FAMILY INCOME
$65,229
AVG HOUSEHOLD INCOME
27.9%
WAGE / INCOME GAP [ % ]
72.1¢/ $1
WAGE / INCOME GAP [ $ ]
$11,582
FAMILY INCOME DEFICIT
0.49
INEQUALITY / GINI INDEX
342,647
LABOR FORCE [ PEOPLE ]
65.8%
PERCENT IN LABOR FORCE
5.3%
UNEMPLOYMENT RATE
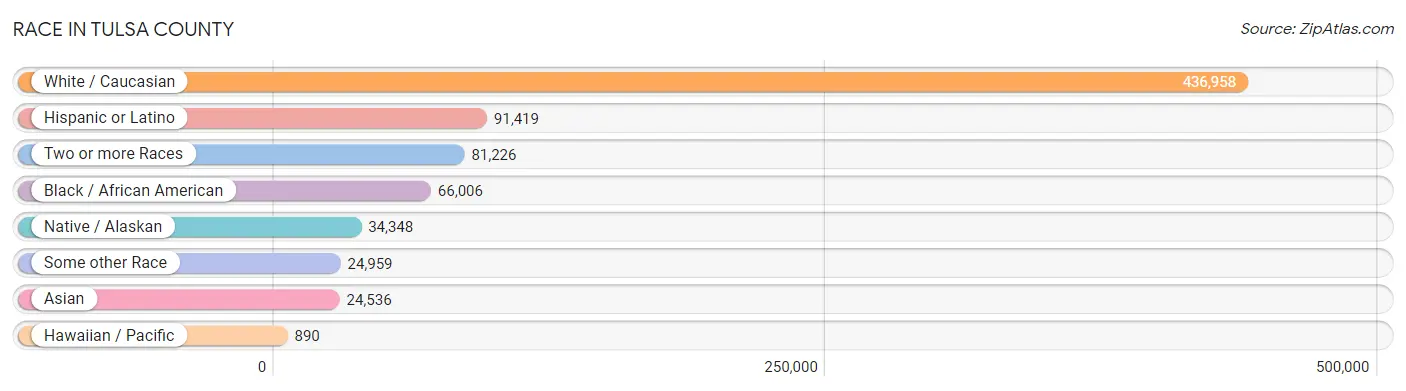
Race in Tulsa County
The most populous races in Tulsa County are White / Caucasian (436,958 | 65.3%), Hispanic or Latino (91,419 | 13.7%), and Two or more Races (81,226 | 12.1%).
| Race | # Population | % Population |
| Asian | 24,536 | 3.7% |
| Black / African American | 66,006 | 9.9% |
| Hawaiian / Pacific | 890 | 0.1% |
| Hispanic or Latino | 91,419 | 13.7% |
| Native / Alaskan | 34,348 | 5.1% |
| White / Caucasian | 436,958 | 65.3% |
| Two or more Races | 81,226 | 12.1% |
| Some other Race | 24,959 | 3.7% |
| Total | 668,923 | 100.0% |
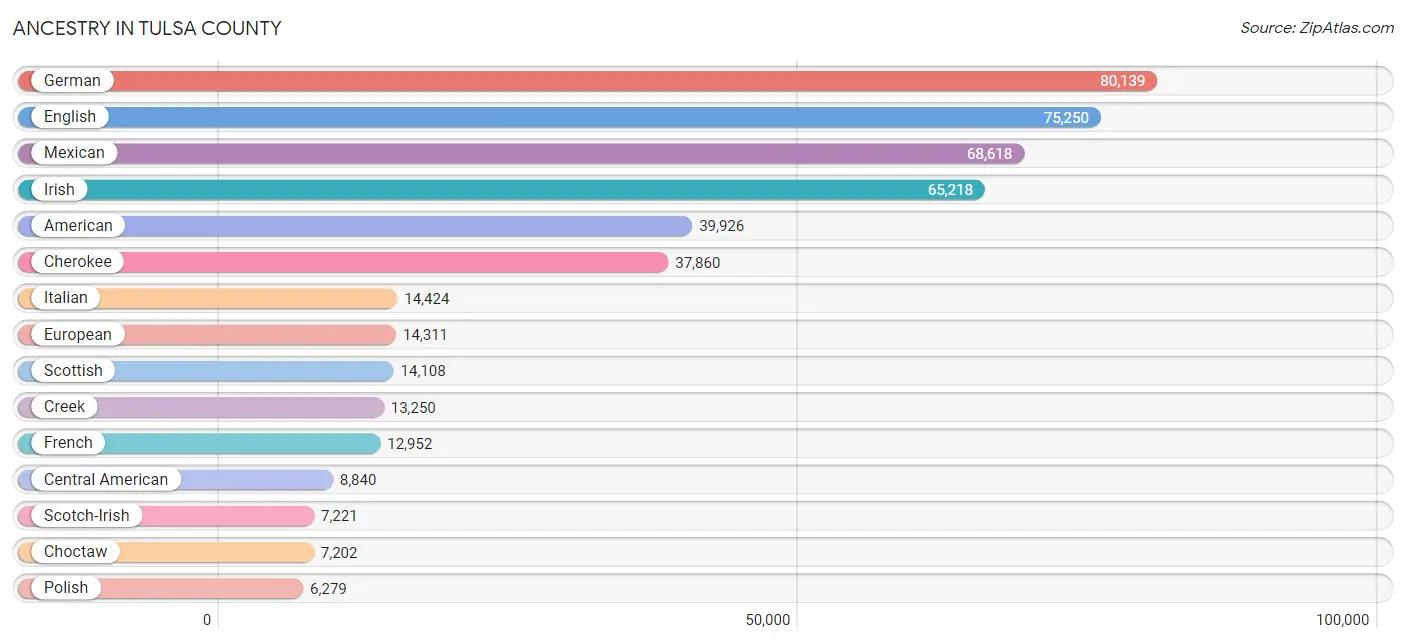
Ancestry in Tulsa County
The most populous ancestries reported in Tulsa County are German (80,139 | 12.0%), English (75,250 | 11.3%), Mexican (68,618 | 10.3%), Irish (65,218 | 9.8%), and American (39,926 | 6.0%), together accounting for 49.2% of all Tulsa County residents.
| Ancestry | # Population | % Population |
| Afghan | 244 | 0.0% |
| African | 3,543 | 0.5% |
| Alaska Native | 7 | 0.0% |
| Alaskan Athabascan | 9 | 0.0% |
| Albanian | 5 | 0.0% |
| Aleut | 40 | 0.0% |
| Alsatian | 7 | 0.0% |
| American | 39,926 | 6.0% |
| Apache | 693 | 0.1% |
| Arab | 3,625 | 0.5% |
| Arapaho | 26 | 0.0% |
| Argentinean | 240 | 0.0% |
| Armenian | 229 | 0.0% |
| Australian | 236 | 0.0% |
| Austrian | 836 | 0.1% |
| Bahamian | 50 | 0.0% |
| Bangladeshi | 3,579 | 0.5% |
| Barbadian | 110 | 0.0% |
| Basque | 14 | 0.0% |
| Belgian | 154 | 0.0% |
| Belizean | 121 | 0.0% |
| Bhutanese | 1,400 | 0.2% |
| Blackfeet | 468 | 0.1% |
| Bolivian | 48 | 0.0% |
| Brazilian | 580 | 0.1% |
| British | 4,533 | 0.7% |
| British West Indian | 64 | 0.0% |
| Bulgarian | 80 | 0.0% |
| Burmese | 1,515 | 0.2% |
| Cajun | 205 | 0.0% |
| Canadian | 611 | 0.1% |
| Cape Verdean | 11 | 0.0% |
| Celtic | 86 | 0.0% |
| Central American | 8,840 | 1.3% |
| Central American Indian | 614 | 0.1% |
| Cherokee | 37,860 | 5.7% |
| Cheyenne | 202 | 0.0% |
| Chickasaw | 1,985 | 0.3% |
| Chilean | 188 | 0.0% |
| Chippewa | 121 | 0.0% |
| Choctaw | 7,202 | 1.1% |
| Colombian | 727 | 0.1% |
| Comanche | 366 | 0.1% |
| Costa Rican | 254 | 0.0% |
| Cree | 9 | 0.0% |
| Creek | 13,250 | 2.0% |
| Croatian | 353 | 0.1% |
| Crow | 40 | 0.0% |
| Cuban | 693 | 0.1% |
| Czech | 2,101 | 0.3% |
| Czechoslovakian | 335 | 0.1% |
| Danish | 1,362 | 0.2% |
| Delaware | 679 | 0.1% |
| Dominican | 871 | 0.1% |
| Dutch | 6,231 | 0.9% |
| Dutch West Indian | 1,140 | 0.2% |
| Eastern European | 1,018 | 0.2% |
| Ecuadorian | 306 | 0.1% |
| Egyptian | 300 | 0.0% |
| English | 75,250 | 11.3% |
| Estonian | 97 | 0.0% |
| Ethiopian | 185 | 0.0% |
| European | 14,311 | 2.1% |
| Fijian | 116 | 0.0% |
| Filipino | 93 | 0.0% |
| Finnish | 334 | 0.1% |
| French | 12,952 | 1.9% |
| French American Indian | 28 | 0.0% |
| French Canadian | 1,359 | 0.2% |
| German | 80,139 | 12.0% |
| German Russian | 156 | 0.0% |
| Ghanaian | 54 | 0.0% |
| Greek | 1,303 | 0.2% |
| Guamanian / Chamorro | 91 | 0.0% |
| Guatemalan | 3,999 | 0.6% |
| Guyanese | 23 | 0.0% |
| Haitian | 151 | 0.0% |
| Honduran | 2,035 | 0.3% |
| Hopi | 15 | 0.0% |
| Hungarian | 918 | 0.1% |
| Icelander | 185 | 0.0% |
| Indian (Asian) | 3,070 | 0.5% |
| Indonesian | 4,580 | 0.7% |
| Inupiat | 65 | 0.0% |
| Iranian | 765 | 0.1% |
| Iraqi | 154 | 0.0% |
| Irish | 65,218 | 9.8% |
| Iroquois | 586 | 0.1% |
| Israeli | 342 | 0.1% |
| Italian | 14,424 | 2.2% |
| Jamaican | 476 | 0.1% |
| Japanese | 87 | 0.0% |
| Jordanian | 162 | 0.0% |
| Kenyan | 289 | 0.0% |
| Kiowa | 521 | 0.1% |
| Korean | 2,637 | 0.4% |
| Laotian | 174 | 0.0% |
| Latvian | 76 | 0.0% |
| Lebanese | 1,288 | 0.2% |
| Liberian | 106 | 0.0% |
| Lithuanian | 502 | 0.1% |
| Lumbee | 81 | 0.0% |
| Luxembourger | 29 | 0.0% |
| Malaysian | 230 | 0.0% |
| Maltese | 15 | 0.0% |
| Marshallese | 40 | 0.0% |
| Mexican | 68,618 | 10.3% |
| Mexican American Indian | 971 | 0.2% |
| Mongolian | 49 | 0.0% |
| Moroccan | 59 | 0.0% |
| Native Hawaiian | 613 | 0.1% |
| Navajo | 656 | 0.1% |
| Nepalese | 13 | 0.0% |
| New Zealander | 17 | 0.0% |
| Nicaraguan | 391 | 0.1% |
| Nigerian | 1,121 | 0.2% |
| Northern European | 2,041 | 0.3% |
| Norwegian | 4,791 | 0.7% |
| Osage | 1,829 | 0.3% |
| Ottawa | 116 | 0.0% |
| Pakistani | 308 | 0.1% |
| Palestinian | 174 | 0.0% |
| Panamanian | 532 | 0.1% |
| Paraguayan | 9 | 0.0% |
| Pennsylvania German | 343 | 0.1% |
| Peruvian | 559 | 0.1% |
| Pima | 60 | 0.0% |
| Polish | 6,279 | 0.9% |
| Portuguese | 1,065 | 0.2% |
| Potawatomi | 616 | 0.1% |
| Pueblo | 108 | 0.0% |
| Puerto Rican | 3,883 | 0.6% |
| Romanian | 500 | 0.1% |
| Russian | 2,236 | 0.3% |
| Salvadoran | 1,502 | 0.2% |
| Samoan | 218 | 0.0% |
| Scandinavian | 2,409 | 0.4% |
| Scotch-Irish | 7,221 | 1.1% |
| Scottish | 14,108 | 2.1% |
| Seminole | 1,008 | 0.2% |
| Serbian | 17 | 0.0% |
| Shoshone | 7 | 0.0% |
| Sioux | 447 | 0.1% |
| Slavic | 193 | 0.0% |
| Slovak | 317 | 0.1% |
| Slovene | 102 | 0.0% |
| South African | 38 | 0.0% |
| South American | 3,862 | 0.6% |
| South American Indian | 55 | 0.0% |
| Spaniard | 1,281 | 0.2% |
| Spanish | 1,485 | 0.2% |
| Spanish American | 36 | 0.0% |
| Spanish American Indian | 6 | 0.0% |
| Sri Lankan | 4,738 | 0.7% |
| Subsaharan African | 6,016 | 0.9% |
| Sudanese | 89 | 0.0% |
| Swedish | 4,916 | 0.7% |
| Swiss | 1,325 | 0.2% |
| Syrian | 527 | 0.1% |
| Thai | 4,649 | 0.7% |
| Tlingit-Haida | 37 | 0.0% |
| Tohono O'Odham | 9 | 0.0% |
| Tongan | 11 | 0.0% |
| Trinidadian and Tobagonian | 74 | 0.0% |
| Tsimshian | 1 | 0.0% |
| Turkish | 371 | 0.1% |
| U.S. Virgin Islander | 61 | 0.0% |
| Ugandan | 179 | 0.0% |
| Ukrainian | 1,316 | 0.2% |
| Uruguayan | 25 | 0.0% |
| Venezuelan | 1,737 | 0.3% |
| Vietnamese | 169 | 0.0% |
| Welsh | 3,972 | 0.6% |
| West Indian | 262 | 0.0% |
| Yugoslavian | 105 | 0.0% |
| Zimbabwean | 25 | 0.0% | View All 176 Rows |
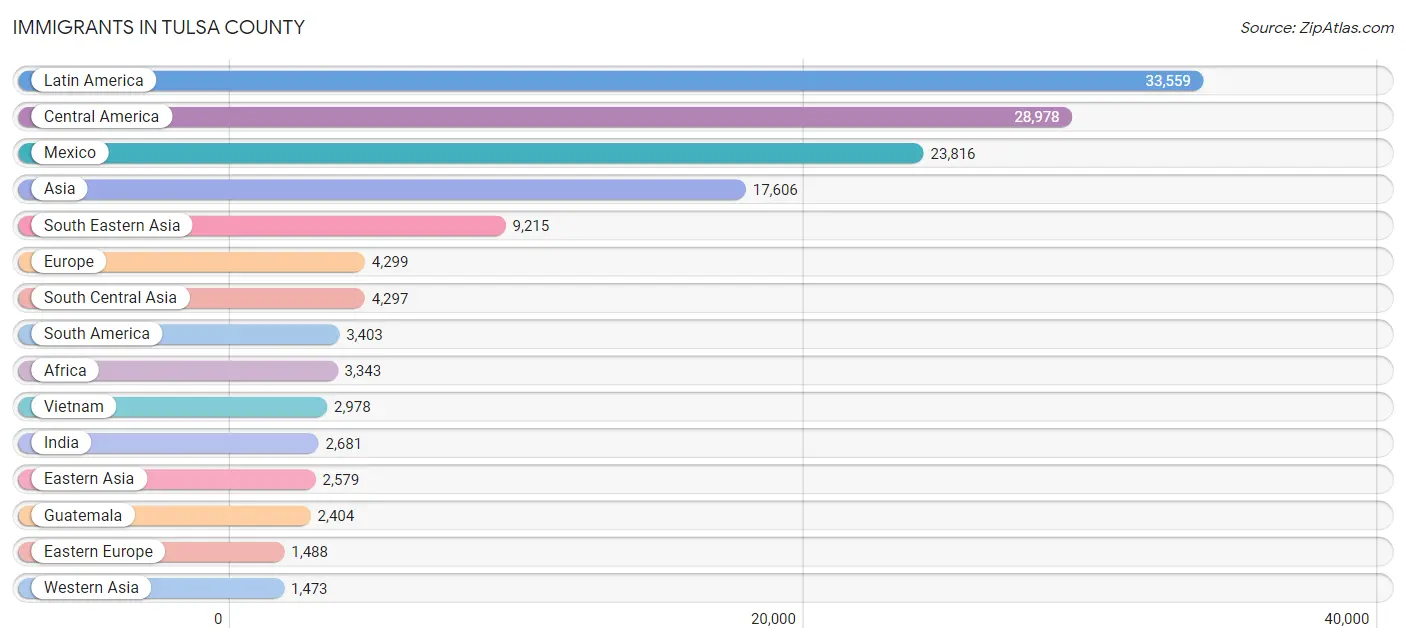
Immigrants in Tulsa County
The most numerous immigrant groups reported in Tulsa County came from Latin America (33,559 | 5.0%), Central America (28,978 | 4.3%), Mexico (23,816 | 3.6%), Asia (17,606 | 2.6%), and South Eastern Asia (9,215 | 1.4%), together accounting for 16.9% of all Tulsa County residents.
| Immigration Origin | # Population | % Population |
| Afghanistan | 249 | 0.0% |
| Africa | 3,343 | 0.5% |
| Argentina | 172 | 0.0% |
| Armenia | 14 | 0.0% |
| Asia | 17,606 | 2.6% |
| Australia | 166 | 0.0% |
| Austria | 61 | 0.0% |
| Bahamas | 57 | 0.0% |
| Bangladesh | 203 | 0.0% |
| Barbados | 85 | 0.0% |
| Belarus | 20 | 0.0% |
| Belgium | 37 | 0.0% |
| Belize | 58 | 0.0% |
| Bolivia | 48 | 0.0% |
| Brazil | 531 | 0.1% |
| Bulgaria | 17 | 0.0% |
| Cambodia | 19 | 0.0% |
| Cameroon | 39 | 0.0% |
| Canada | 944 | 0.1% |
| Caribbean | 1,178 | 0.2% |
| Central America | 28,978 | 4.3% |
| Chile | 81 | 0.0% |
| China | 1,424 | 0.2% |
| Colombia | 406 | 0.1% |
| Congo | 23 | 0.0% |
| Costa Rica | 57 | 0.0% |
| Cuba | 278 | 0.0% |
| Czechoslovakia | 75 | 0.0% |
| Denmark | 41 | 0.0% |
| Dominican Republic | 352 | 0.1% |
| Eastern Africa | 1,255 | 0.2% |
| Eastern Asia | 2,579 | 0.4% |
| Eastern Europe | 1,488 | 0.2% |
| Ecuador | 223 | 0.0% |
| Egypt | 245 | 0.0% |
| El Salvador | 1,007 | 0.2% |
| England | 571 | 0.1% |
| Eritrea | 134 | 0.0% |
| Ethiopia | 140 | 0.0% |
| Europe | 4,299 | 0.6% |
| Fiji | 9 | 0.0% |
| France | 121 | 0.0% |
| Germany | 823 | 0.1% |
| Ghana | 123 | 0.0% |
| Greece | 53 | 0.0% |
| Guatemala | 2,404 | 0.4% |
| Guyana | 94 | 0.0% |
| Haiti | 63 | 0.0% |
| Honduras | 1,371 | 0.2% |
| Hong Kong | 81 | 0.0% |
| Hungary | 1 | 0.0% |
| India | 2,681 | 0.4% |
| Indonesia | 96 | 0.0% |
| Iran | 321 | 0.1% |
| Iraq | 173 | 0.0% |
| Ireland | 43 | 0.0% |
| Israel | 42 | 0.0% |
| Italy | 137 | 0.0% |
| Jamaica | 234 | 0.0% |
| Japan | 293 | 0.0% |
| Jordan | 123 | 0.0% |
| Kazakhstan | 45 | 0.0% |
| Kenya | 376 | 0.1% |
| Korea | 862 | 0.1% |
| Kuwait | 45 | 0.0% |
| Laos | 891 | 0.1% |
| Latin America | 33,559 | 5.0% |
| Latvia | 21 | 0.0% |
| Lebanon | 214 | 0.0% |
| Liberia | 164 | 0.0% |
| Lithuania | 8 | 0.0% |
| Malaysia | 546 | 0.1% |
| Mexico | 23,816 | 3.6% |
| Micronesia | 273 | 0.0% |
| Middle Africa | 127 | 0.0% |
| Moldova | 96 | 0.0% |
| Morocco | 42 | 0.0% |
| Nepal | 86 | 0.0% |
| Netherlands | 93 | 0.0% |
| Nicaragua | 151 | 0.0% |
| Nigeria | 777 | 0.1% |
| Northern Africa | 451 | 0.1% |
| Northern Europe | 1,174 | 0.2% |
| Norway | 32 | 0.0% |
| Oceania | 621 | 0.1% |
| Pakistan | 665 | 0.1% |
| Panama | 84 | 0.0% |
| Peru | 375 | 0.1% |
| Philippines | 937 | 0.1% |
| Poland | 176 | 0.0% |
| Portugal | 56 | 0.0% |
| Romania | 82 | 0.0% |
| Russia | 390 | 0.1% |
| Saudi Arabia | 123 | 0.0% |
| Scotland | 84 | 0.0% |
| Serbia | 10 | 0.0% |
| Singapore | 15 | 0.0% |
| South Africa | 77 | 0.0% |
| South America | 3,403 | 0.5% |
| South Central Asia | 4,297 | 0.6% |
| South Eastern Asia | 9,215 | 1.4% |
| Southern Europe | 454 | 0.1% |
| Spain | 208 | 0.0% |
| Sri Lanka | 12 | 0.0% |
| Sudan | 42 | 0.0% |
| Sweden | 47 | 0.0% |
| Switzerland | 38 | 0.0% |
| Syria | 370 | 0.1% |
| Taiwan | 79 | 0.0% |
| Thailand | 445 | 0.1% |
| Trinidad and Tobago | 106 | 0.0% |
| Turkey | 163 | 0.0% |
| Uganda | 183 | 0.0% |
| Ukraine | 506 | 0.1% |
| Uruguay | 12 | 0.0% |
| Uzbekistan | 25 | 0.0% |
| Venezuela | 1,449 | 0.2% |
| Vietnam | 2,978 | 0.4% |
| Western Africa | 1,279 | 0.2% |
| Western Asia | 1,473 | 0.2% |
| Western Europe | 1,173 | 0.2% |
| Yemen | 24 | 0.0% |
| Zaire | 57 | 0.0% |
| Zimbabwe | 67 | 0.0% | View All 124 Rows |
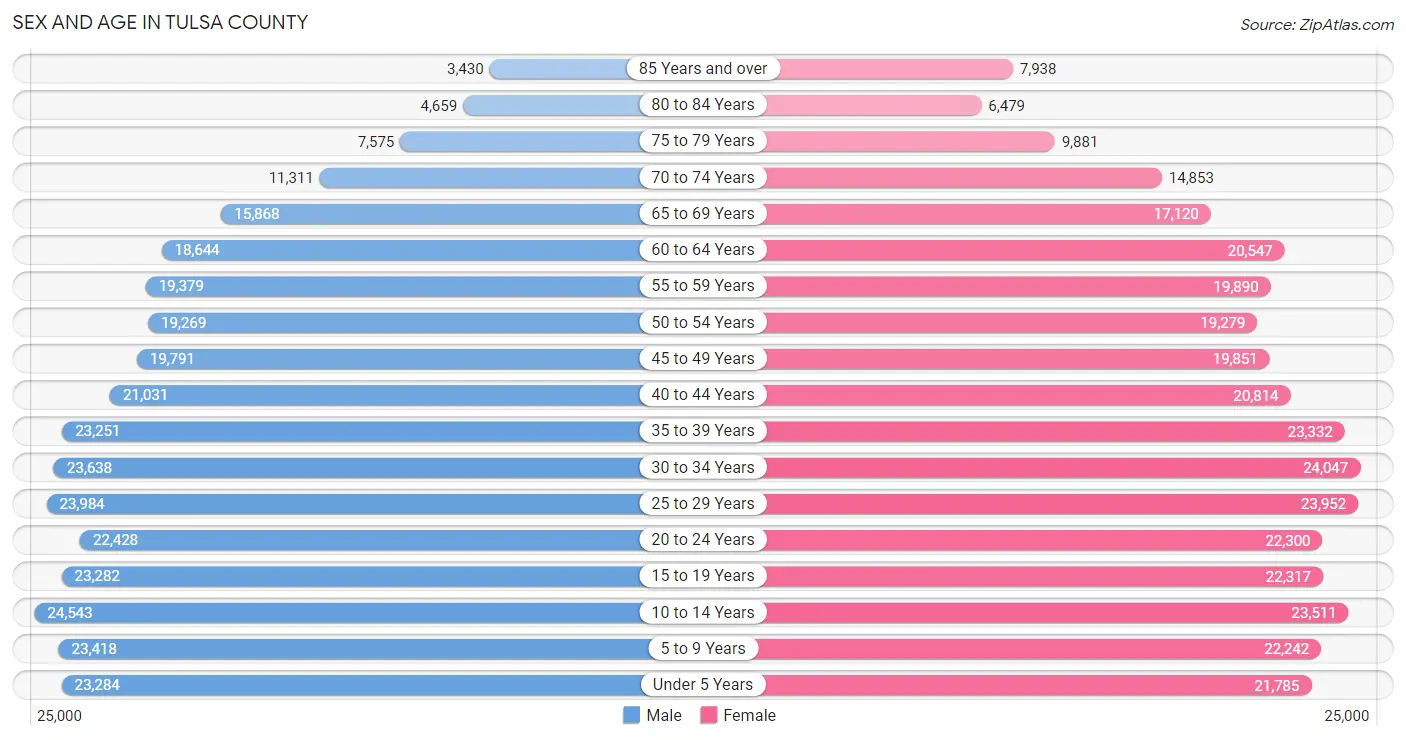
Sex and Age in Tulsa County
Sex and Age in Tulsa County
The most populous age groups in Tulsa County are 10 to 14 Years (24,543 | 7.5%) for men and 30 to 34 Years (24,047 | 7.1%) for women.
| Age Bracket | Male | Female |
| Under 5 Years | 23,284 (7.1%) | 21,785 (6.4%) |
| 5 to 9 Years | 23,418 (7.1%) | 22,242 (6.5%) |
| 10 to 14 Years | 24,543 (7.5%) | 23,511 (6.9%) |
| 15 to 19 Years | 23,282 (7.1%) | 22,317 (6.6%) |
| 20 to 24 Years | 22,428 (6.8%) | 22,300 (6.6%) |
| 25 to 29 Years | 23,984 (7.3%) | 23,952 (7.0%) |
| 30 to 34 Years | 23,638 (7.2%) | 24,047 (7.1%) |
| 35 to 39 Years | 23,251 (7.1%) | 23,332 (6.9%) |
| 40 to 44 Years | 21,031 (6.4%) | 20,814 (6.1%) |
| 45 to 49 Years | 19,791 (6.0%) | 19,851 (5.8%) |
| 50 to 54 Years | 19,269 (5.9%) | 19,279 (5.7%) |
| 55 to 59 Years | 19,379 (5.9%) | 19,890 (5.9%) |
| 60 to 64 Years | 18,644 (5.7%) | 20,547 (6.0%) |
| 65 to 69 Years | 15,868 (4.8%) | 17,120 (5.0%) |
| 70 to 74 Years | 11,311 (3.4%) | 14,853 (4.4%) |
| 75 to 79 Years | 7,575 (2.3%) | 9,881 (2.9%) |
| 80 to 84 Years | 4,659 (1.4%) | 6,479 (1.9%) |
| 85 Years and over | 3,430 (1.0%) | 7,938 (2.3%) |
| Total | 328,785 (100.0%) | 340,138 (100.0%) |
Families and Households in Tulsa County
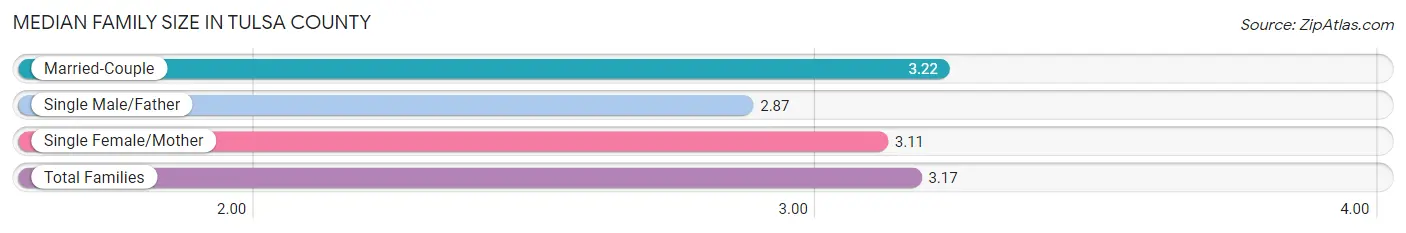
Median Family Size in Tulsa County
The median family size in Tulsa County is 3.17 persons per family, with married-couple families (118,240 | 72.0%) accounting for the largest median family size of 3.22 persons per family. On the other hand, single male/father families (14,148 | 8.6%) represent the smallest median family size with 2.87 persons per family.
| Family Type | # Families | Family Size |
| Married-Couple | 118,240 (72.0%) | 3.22 |
| Single Male/Father | 14,148 (8.6%) | 2.87 |
| Single Female/Mother | 31,954 (19.4%) | 3.11 |
| Total Families | 164,342 (100.0%) | 3.17 |
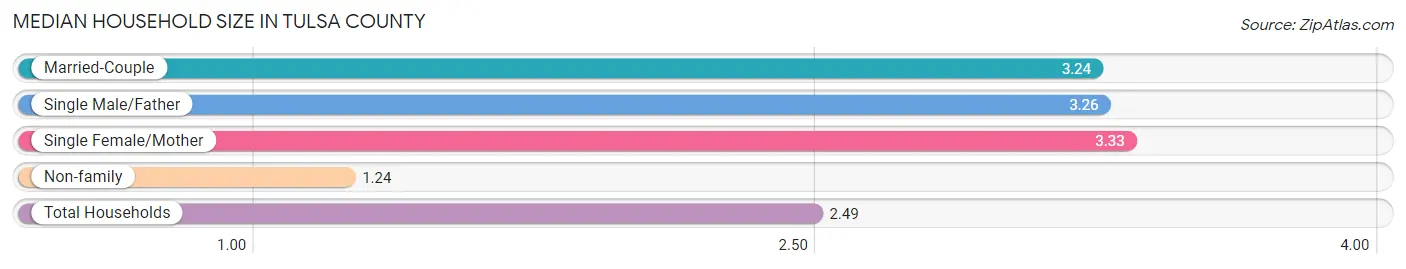
Median Household Size in Tulsa County
The median household size in Tulsa County is 2.49 persons per household, with single female/mother households (31,954 | 12.1%) accounting for the largest median household size of 3.33 persons per household. non-family households (99,954 | 37.8%) represent the smallest median household size with 1.24 persons per household.
| Household Type | # Households | Household Size |
| Married-Couple | 118,240 (44.7%) | 3.24 |
| Single Male/Father | 14,148 (5.3%) | 3.26 |
| Single Female/Mother | 31,954 (12.1%) | 3.33 |
| Non-family | 99,954 (37.8%) | 1.24 |
| Total Households | 264,296 (100.0%) | 2.49 |
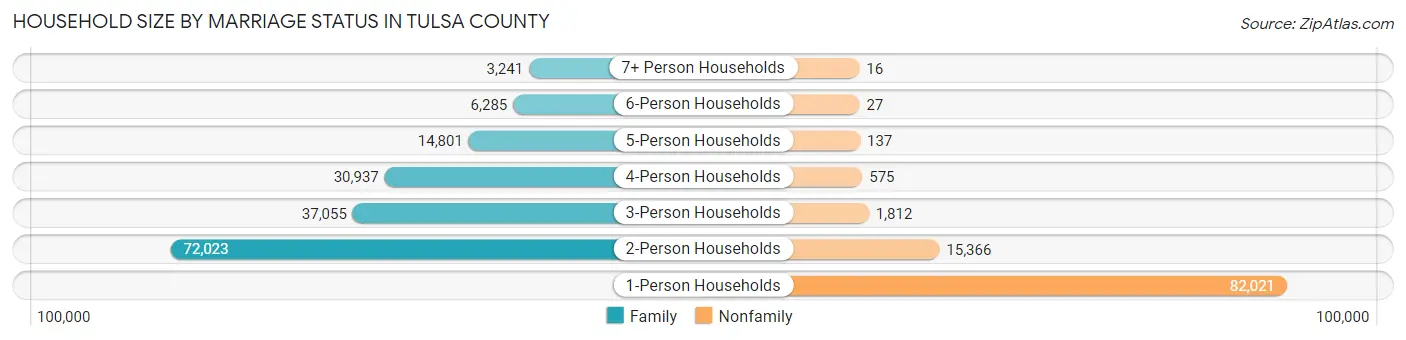
Household Size by Marriage Status in Tulsa County
Out of a total of 264,296 households in Tulsa County, 164,342 (62.2%) are family households, while 99,954 (37.8%) are nonfamily households. The most numerous type of family households are 2-person households, comprising 72,023, and the most common type of nonfamily households are 1-person households, comprising 82,021.
| Household Size | Family Households | Nonfamily Households |
| 1-Person Households | - | 82,021 (31.0%) |
| 2-Person Households | 72,023 (27.3%) | 15,366 (5.8%) |
| 3-Person Households | 37,055 (14.0%) | 1,812 (0.7%) |
| 4-Person Households | 30,937 (11.7%) | 575 (0.2%) |
| 5-Person Households | 14,801 (5.6%) | 137 (0.1%) |
| 6-Person Households | 6,285 (2.4%) | 27 (0.0%) |
| 7+ Person Households | 3,241 (1.2%) | 16 (0.0%) |
| Total | 164,342 (62.2%) | 99,954 (37.8%) |
Female Fertility in Tulsa County
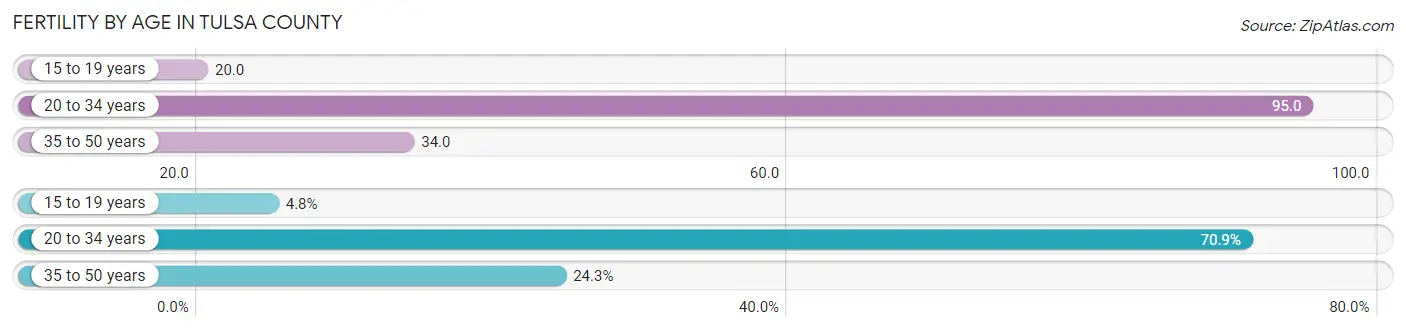
Fertility by Age in Tulsa County
Average fertility rate in Tulsa County is 59.0 births per 1,000 women. Women in the age bracket of 20 to 34 years have the highest fertility rate with 95.0 births per 1,000 women. Women in the age bracket of 20 to 34 years acount for 70.9% of all women with births.
| Age Bracket | Women with Births | Births / 1,000 Women |
| 15 to 19 years | 455 (4.8%) | 20.0 |
| 20 to 34 years | 6,713 (70.9%) | 95.0 |
| 35 to 50 years | 2,302 (24.3%) | 34.0 |
| Total | 9,470 (100.0%) | 59.0 |
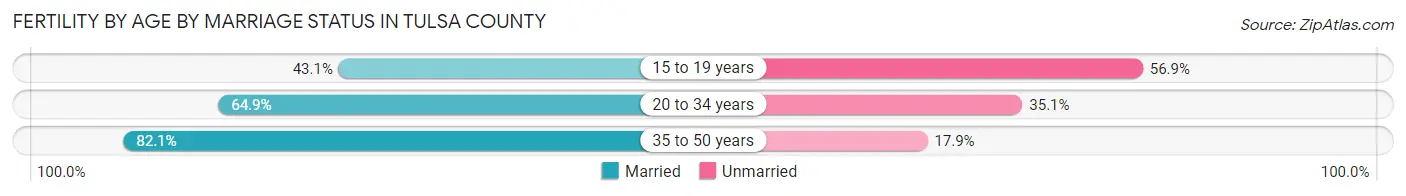
Fertility by Age by Marriage Status in Tulsa County
68.0% of women with births (9,470) in Tulsa County are married. The highest percentage of unmarried women with births falls into 15 to 19 years age bracket with 56.9% of them unmarried at the time of birth, while the lowest percentage of unmarried women with births belong to 35 to 50 years age bracket with 17.9% of them unmarried.
| Age Bracket | Married | Unmarried |
| 15 to 19 years | 196 (43.1%) | 259 (56.9%) |
| 20 to 34 years | 4,357 (64.9%) | 2,356 (35.1%) |
| 35 to 50 years | 1,890 (82.1%) | 412 (17.9%) |
| Total | 6,440 (68.0%) | 3,030 (32.0%) |
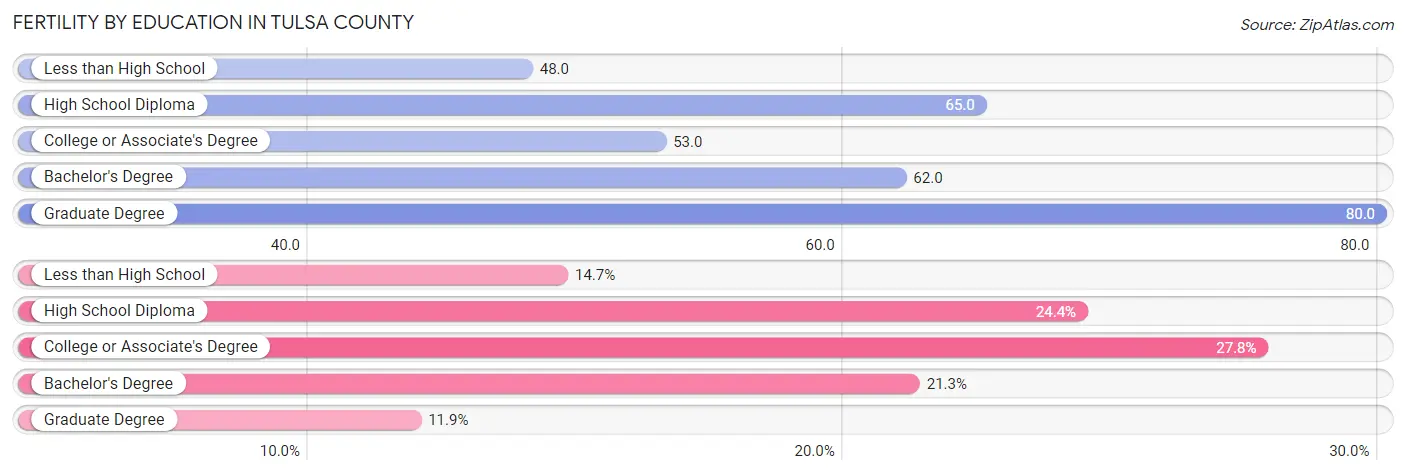
Fertility by Education in Tulsa County
Average fertility rate in Tulsa County is 59.0 births per 1,000 women. Women with the education attainment of graduate degree have the highest fertility rate of 80.0 births per 1,000 women, while women with the education attainment of less than high school have the lowest fertility at 48.0 births per 1,000 women. Women with the education attainment of college or associate's degree represent 27.8% of all women with births.
| Educational Attainment | Women with Births | Births / 1,000 Women |
| Less than High School | 1,388 (14.7%) | 48.0 |
| High School Diploma | 2,311 (24.4%) | 65.0 |
| College or Associate's Degree | 2,631 (27.8%) | 53.0 |
| Bachelor's Degree | 2,012 (21.2%) | 62.0 |
| Graduate Degree | 1,128 (11.9%) | 80.0 |
| Total | 9,470 (100.0%) | 59.0 |
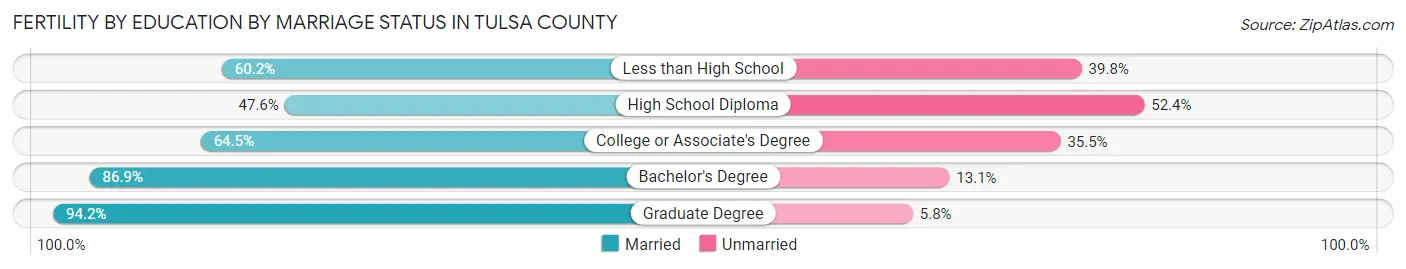
Fertility by Education by Marriage Status in Tulsa County
32.0% of women with births in Tulsa County are unmarried. Women with the educational attainment of graduate degree are most likely to be married with 94.2% of them married at childbirth, while women with the educational attainment of high school diploma are least likely to be married with 52.4% of them unmarried at childbirth.
| Educational Attainment | Married | Unmarried |
| Less than High School | 836 (60.2%) | 552 (39.8%) |
| High School Diploma | 1,100 (47.6%) | 1,211 (52.4%) |
| College or Associate's Degree | 1,697 (64.5%) | 934 (35.5%) |
| Bachelor's Degree | 1,748 (86.9%) | 264 (13.1%) |
| Graduate Degree | 1,063 (94.2%) | 65 (5.8%) |
| Total | 6,440 (68.0%) | 3,030 (32.0%) |
Income in Tulsa County
Income Overview in Tulsa County
Per Capita Income in Tulsa County is $38,496, while median incomes of families and households are $84,573 and $65,229 respectively.
| Characteristic | Number | Measure |
| Per Capita Income | 668,923 | $38,496 |
| Median Family Income | 164,342 | $84,573 |
| Mean Family Income | 164,342 | $114,509 |
| Median Household Income | 264,296 | $65,229 |
| Mean Household Income | 264,296 | $94,060 |
| Income Deficit | 164,342 | $11,582 |
| Wage / Income Gap (%) | 668,923 | 27.88% |
| Wage / Income Gap ($) | 668,923 | 72.12¢ per $1 |
| Gini / Inequality Index | 668,923 | 0.49 |
Earnings by Sex in Tulsa County
Average Earnings in Tulsa County are $38,804, $45,621 for men and $32,901 for women, a difference of 27.9%.
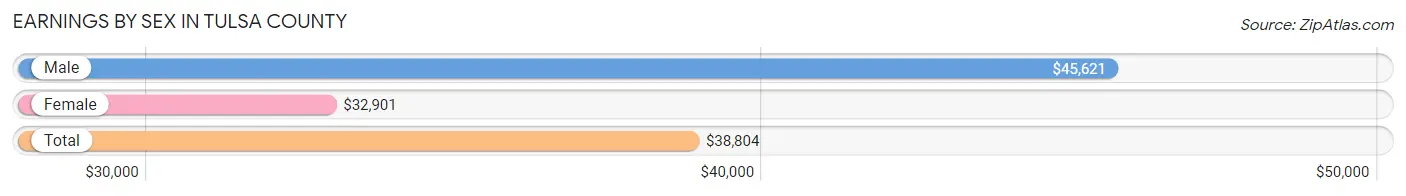
| Sex | Number | Average Earnings |
| Male | 189,115 (53.0%) | $45,621 |
| Female | 167,937 (47.0%) | $32,901 |
| Total | 357,052 (100.0%) | $38,804 |
Earnings by Sex by Income Bracket in Tulsa County
The most common earnings brackets in Tulsa County are $100,000+ for men (32,485 | 17.2%) and $25,000 to $29,999 for women (12,163 | 7.2%).

| Income | Male | Female |
| $2,499 or less | 8,506 (4.5%) | 11,254 (6.7%) |
| $2,500 to $4,999 | 5,076 (2.7%) | 6,464 (3.8%) |
| $5,000 to $7,499 | 4,713 (2.5%) | 7,419 (4.4%) |
| $7,500 to $9,999 | 4,573 (2.4%) | 5,246 (3.1%) |
| $10,000 to $12,499 | 5,213 (2.8%) | 6,132 (3.6%) |
| $12,500 to $14,999 | 4,274 (2.3%) | 6,653 (4.0%) |
| $15,000 to $17,499 | 4,159 (2.2%) | 5,928 (3.5%) |
| $17,500 to $19,999 | 3,436 (1.8%) | 4,466 (2.7%) |
| $20,000 to $22,499 | 4,931 (2.6%) | 5,197 (3.1%) |
| $22,500 to $24,999 | 5,767 (3.0%) | 6,507 (3.9%) |
| $25,000 to $29,999 | 11,075 (5.9%) | 12,163 (7.2%) |
| $30,000 to $34,999 | 10,920 (5.8%) | 11,964 (7.1%) |
| $35,000 to $39,999 | 10,526 (5.6%) | 10,612 (6.3%) |
| $40,000 to $44,999 | 9,848 (5.2%) | 9,874 (5.9%) |
| $45,000 to $49,999 | 9,570 (5.1%) | 8,862 (5.3%) |
| $50,000 to $54,999 | 8,583 (4.5%) | 7,889 (4.7%) |
| $55,000 to $64,999 | 15,928 (8.4%) | 11,379 (6.8%) |
| $65,000 to $74,999 | 10,636 (5.6%) | 7,508 (4.5%) |
| $75,000 to $99,999 | 18,896 (10.0%) | 11,147 (6.6%) |
| $100,000+ | 32,485 (17.2%) | 11,273 (6.7%) |
| Total | 189,115 (100.0%) | 167,937 (100.0%) |
Earnings by Sex by Educational Attainment in Tulsa County
Average earnings in Tulsa County are $52,477 for men and $37,549 for women, a difference of 28.4%. Men with an educational attainment of graduate degree enjoy the highest average annual earnings of $97,720, while those with less than high school education earn the least with $33,351. Women with an educational attainment of graduate degree earn the most with the average annual earnings of $59,721, while those with less than high school education have the smallest earnings of $22,091.
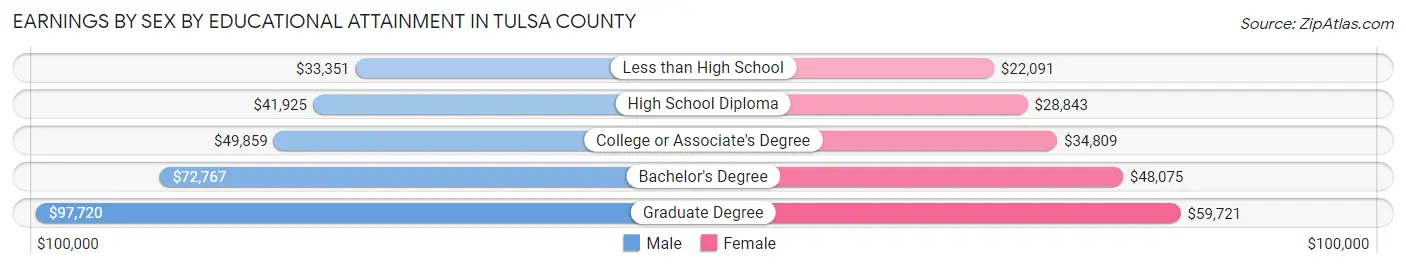
| Educational Attainment | Male Income | Female Income |
| Less than High School | $33,351 | $22,091 |
| High School Diploma | $41,925 | $28,843 |
| College or Associate's Degree | $49,859 | $34,809 |
| Bachelor's Degree | $72,767 | $48,075 |
| Graduate Degree | $97,720 | $59,721 |
| Total | $52,477 | $37,549 |
Family Income in Tulsa County
Family Income Brackets in Tulsa County
According to the Tulsa County family income data, there are 33,361 families falling into the $100,000 to $149,999 income range, which is the most common income bracket and makes up 20.3% of all families. Conversely, the $10,000 to $14,999 income bracket is the least frequent group with only 3,451 families (2.1%) belonging to this category.
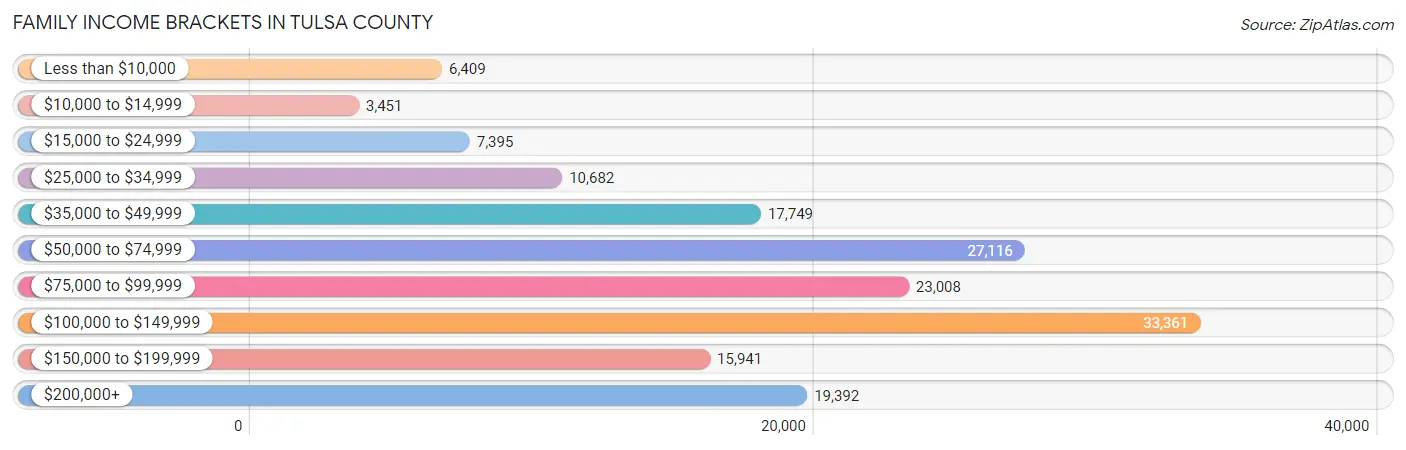
| Income Bracket | # Families | % Families |
| Less than $10,000 | 6,409 | 3.9% |
| $10,000 to $14,999 | 3,451 | 2.1% |
| $15,000 to $24,999 | 7,395 | 4.5% |
| $25,000 to $34,999 | 10,682 | 6.5% |
| $35,000 to $49,999 | 17,749 | 10.8% |
| $50,000 to $74,999 | 27,116 | 16.5% |
| $75,000 to $99,999 | 23,008 | 14.0% |
| $100,000 to $149,999 | 33,361 | 20.3% |
| $150,000 to $199,999 | 15,941 | 9.7% |
| $200,000+ | 19,392 | 11.8% |
Family Income by Famaliy Size in Tulsa County
4-person families (29,658 | 18.0%) account for the highest median family income in Tulsa County with $96,509 per family, while 2-person families (77,543 | 47.2%) have the highest median income of $38,718 per family member.
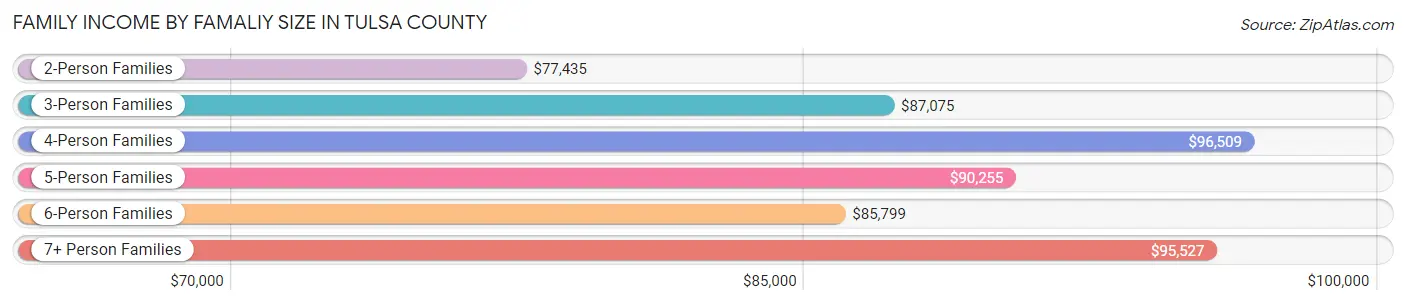
| Income Bracket | # Families | Median Income |
| 2-Person Families | 77,543 (47.2%) | $77,435 |
| 3-Person Families | 35,223 (21.4%) | $87,075 |
| 4-Person Families | 29,658 (18.0%) | $96,509 |
| 5-Person Families | 13,548 (8.2%) | $90,255 |
| 6-Person Families | 5,563 (3.4%) | $85,799 |
| 7+ Person Families | 2,807 (1.7%) | $95,527 |
| Total | 164,342 (100.0%) | $84,573 |
Family Income by Number of Earners in Tulsa County
The median family income in Tulsa County is $84,573, with families comprising 3+ earners (17,444) having the highest median family income of $129,222, while families with no earners (21,016) have the lowest median family income of $47,005, accounting for 10.6% and 12.8% of families, respectively.
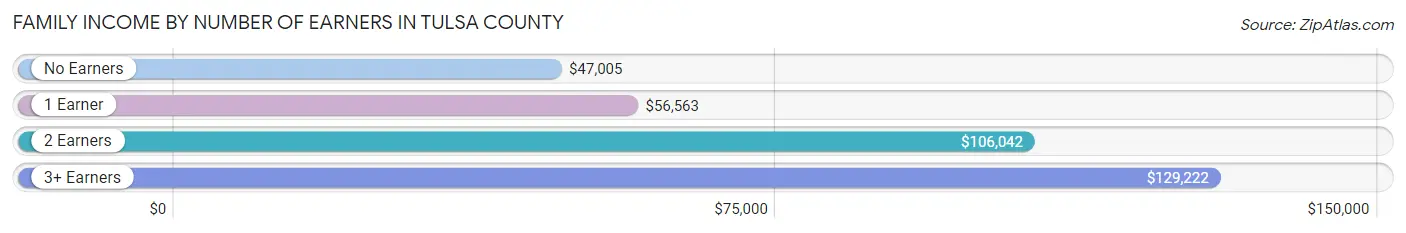
| Number of Earners | # Families | Median Income |
| No Earners | 21,016 (12.8%) | $47,005 |
| 1 Earner | 56,067 (34.1%) | $56,563 |
| 2 Earners | 69,815 (42.5%) | $106,042 |
| 3+ Earners | 17,444 (10.6%) | $129,222 |
| Total | 164,342 (100.0%) | $84,573 |
Household Income in Tulsa County
Household Income Brackets in Tulsa County
With 46,780 households falling in the category, the $50,000 to $74,999 income range is the most frequent in Tulsa County, accounting for 17.7% of all households. In contrast, only 10,043 households (3.8%) fall into the $10,000 to $14,999 income bracket, making it the least populous group.
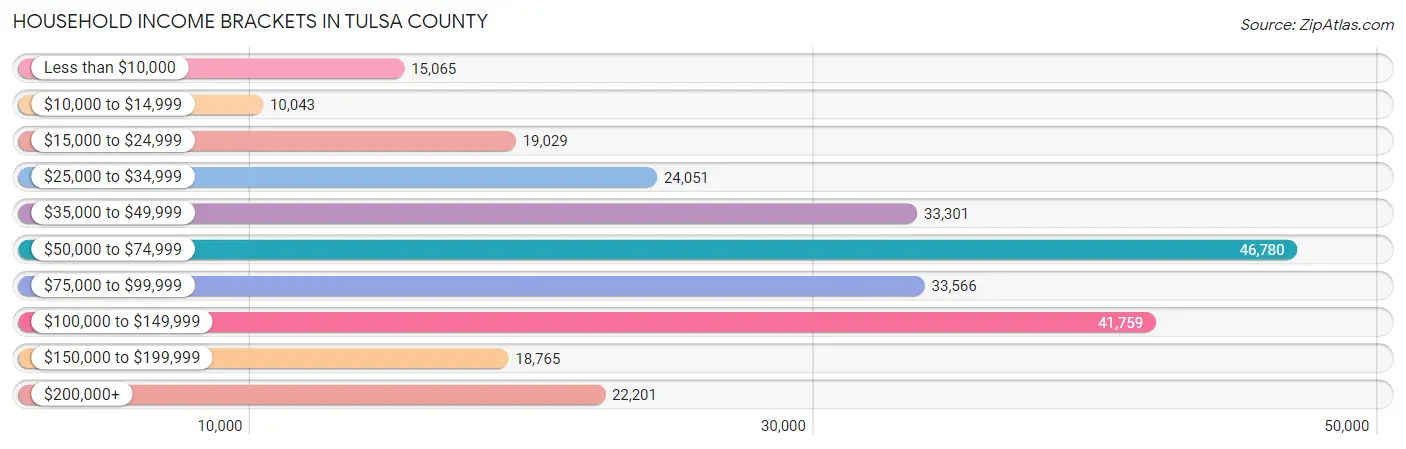
| Income Bracket | # Households | % Households |
| Less than $10,000 | 15,065 | 5.7% |
| $10,000 to $14,999 | 10,043 | 3.8% |
| $15,000 to $24,999 | 19,029 | 7.2% |
| $25,000 to $34,999 | 24,051 | 9.1% |
| $35,000 to $49,999 | 33,301 | 12.6% |
| $50,000 to $74,999 | 46,780 | 17.7% |
| $75,000 to $99,999 | 33,566 | 12.7% |
| $100,000 to $149,999 | 41,759 | 15.8% |
| $150,000 to $199,999 | 18,765 | 7.1% |
| $200,000+ | 22,201 | 8.4% |
Household Income by Householder Age in Tulsa County
The median household income in Tulsa County is $65,229, with the highest median household income of $78,440 found in the 45 to 64 years age bracket for the primary householder. A total of 91,035 households (34.4%) fall into this category. Meanwhile, the 15 to 24 years age bracket for the primary householder has the lowest median household income of $38,768, with 14,013 households (5.3%) in this group.
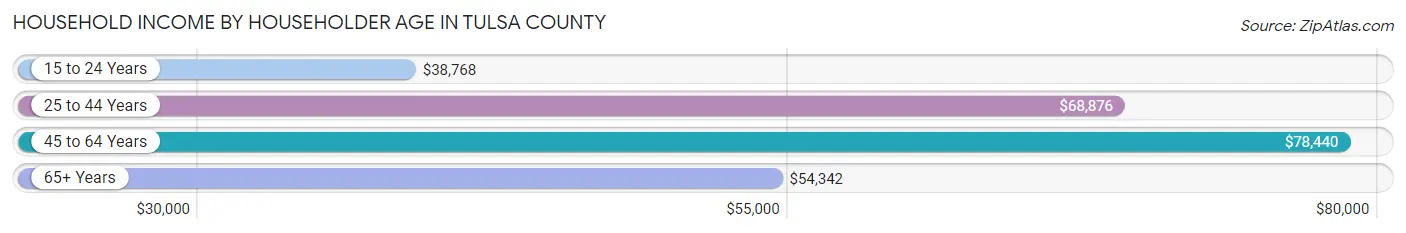
| Income Bracket | # Households | Median Income |
| 15 to 24 Years | 14,013 (5.3%) | $38,768 |
| 25 to 44 Years | 93,804 (35.5%) | $68,876 |
| 45 to 64 Years | 91,035 (34.4%) | $78,440 |
| 65+ Years | 65,444 (24.8%) | $54,342 |
| Total | 264,296 (100.0%) | $65,229 |
Poverty in Tulsa County
Income Below Poverty by Sex and Age in Tulsa County
With 12.9% poverty level for males and 15.9% for females among the residents of Tulsa County, under 5 year old males and under 5 year old females are the most vulnerable to poverty, with 5,013 males (22.0%) and 5,623 females (26.3%) in their respective age groups living below the poverty level.
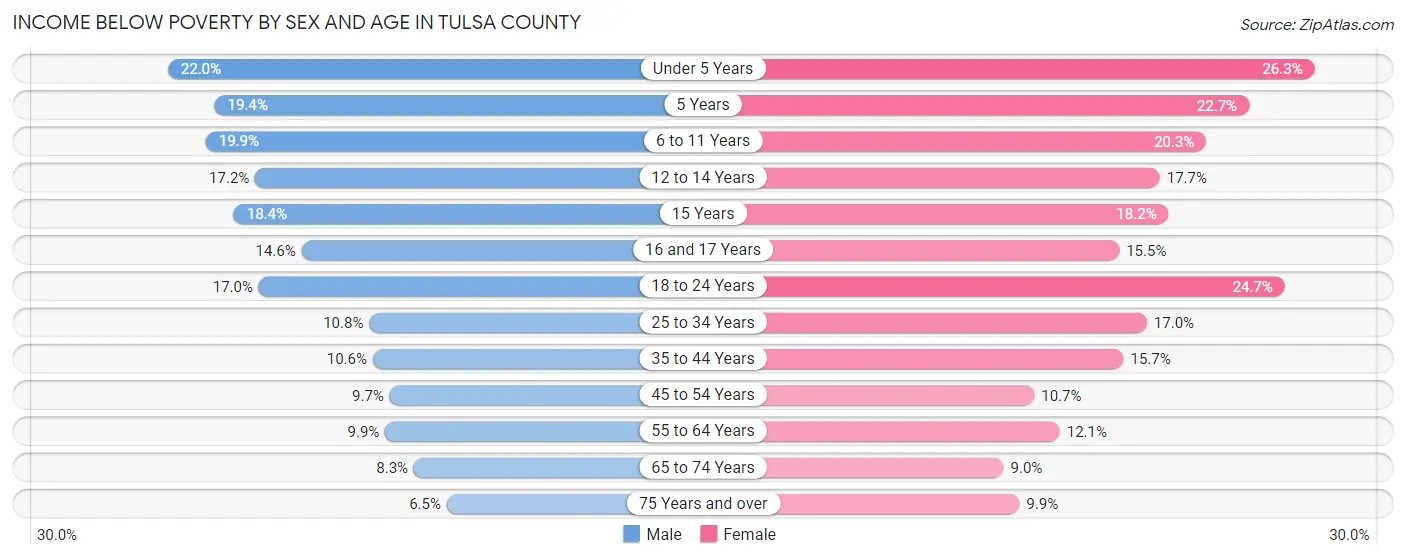
| Age Bracket | Male | Female |
| Under 5 Years | 5,013 (22.0%) | 5,623 (26.3%) |
| 5 Years | 961 (19.4%) | 882 (22.7%) |
| 6 to 11 Years | 5,551 (19.9%) | 5,572 (20.3%) |
| 12 to 14 Years | 2,477 (17.2%) | 2,435 (17.7%) |
| 15 Years | 854 (18.3%) | 855 (18.2%) |
| 16 and 17 Years | 1,389 (14.6%) | 1,370 (15.4%) |
| 18 to 24 Years | 5,073 (17.0%) | 7,152 (24.7%) |
| 25 to 34 Years | 5,088 (10.8%) | 8,104 (17.0%) |
| 35 to 44 Years | 4,659 (10.6%) | 6,913 (15.7%) |
| 45 to 54 Years | 3,763 (9.7%) | 4,183 (10.7%) |
| 55 to 64 Years | 3,725 (9.9%) | 4,891 (12.1%) |
| 65 to 74 Years | 2,235 (8.3%) | 2,847 (9.0%) |
| 75 Years and over | 991 (6.5%) | 2,254 (9.9%) |
| Total | 41,779 (12.9%) | 53,081 (15.9%) |
Income Above Poverty by Sex and Age in Tulsa County
According to the poverty statistics in Tulsa County, males aged 75 years and over and females aged 65 to 74 years are the age groups that are most secure financially, with 93.5% of males and 91.0% of females in these age groups living above the poverty line.
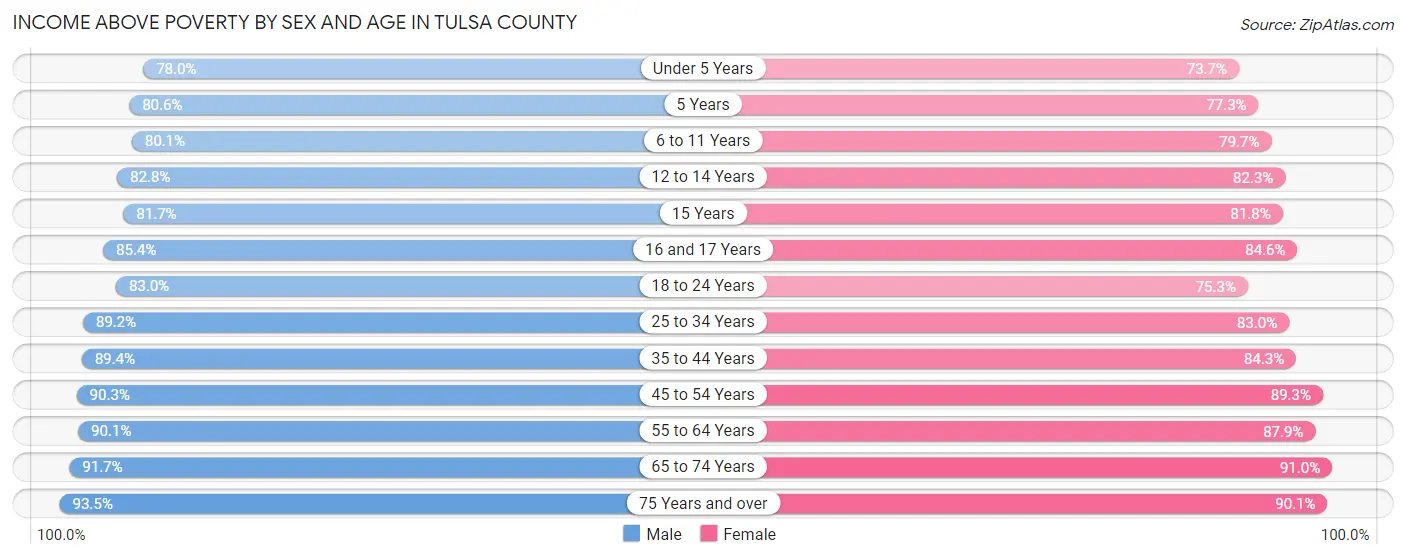
| Age Bracket | Male | Female |
| Under 5 Years | 17,750 (78.0%) | 15,744 (73.7%) |
| 5 Years | 3,987 (80.6%) | 3,009 (77.3%) |
| 6 to 11 Years | 22,331 (80.1%) | 21,888 (79.7%) |
| 12 to 14 Years | 11,954 (82.8%) | 11,317 (82.3%) |
| 15 Years | 3,801 (81.7%) | 3,846 (81.8%) |
| 16 and 17 Years | 8,138 (85.4%) | 7,495 (84.6%) |
| 18 to 24 Years | 24,843 (83.0%) | 21,845 (75.3%) |
| 25 to 34 Years | 41,960 (89.2%) | 39,599 (83.0%) |
| 35 to 44 Years | 39,247 (89.4%) | 37,136 (84.3%) |
| 45 to 54 Years | 35,171 (90.3%) | 34,843 (89.3%) |
| 55 to 64 Years | 33,834 (90.1%) | 35,411 (87.9%) |
| 65 to 74 Years | 24,642 (91.7%) | 28,745 (91.0%) |
| 75 Years and over | 14,274 (93.5%) | 20,539 (90.1%) |
| Total | 281,932 (87.1%) | 281,417 (84.1%) |
Income Below Poverty Among Married-Couple Families in Tulsa County
The poverty statistics for married-couple families in Tulsa County show that 5.7% or 6,699 of the total 118,240 families live below the poverty line. Families with 5 or more children have the highest poverty rate of 21.9%, comprising of 228 families. On the other hand, families with no children have the lowest poverty rate of 3.7%, which includes 2,441 families.
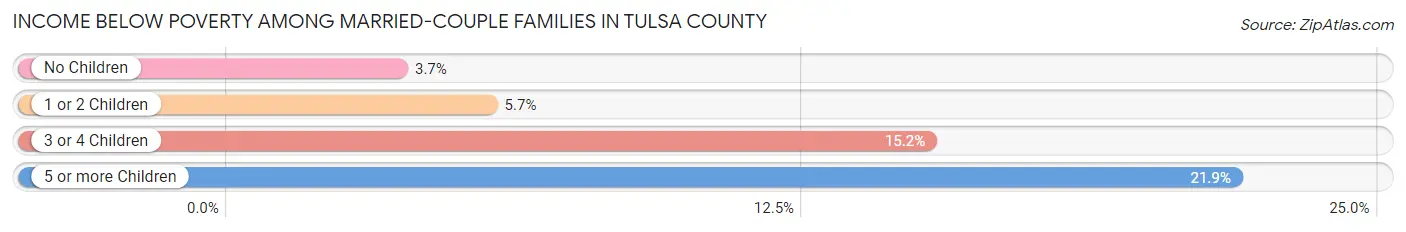
| Children | Above Poverty | Below Poverty |
| No Children | 63,565 (96.3%) | 2,441 (3.7%) |
| 1 or 2 Children | 37,076 (94.4%) | 2,221 (5.7%) |
| 3 or 4 Children | 10,085 (84.8%) | 1,809 (15.2%) |
| 5 or more Children | 815 (78.1%) | 228 (21.9%) |
| Total | 111,541 (94.3%) | 6,699 (5.7%) |
Income Below Poverty Among Single-Parent Households in Tulsa County
According to the poverty data in Tulsa County, 13.8% or 1,949 single-father households and 27.5% or 8,801 single-mother households are living below the poverty line. Among single-father households, those with 5 or more children have the highest poverty rate, with 11 households (61.1%) experiencing poverty. Likewise, among single-mother households, those with 5 or more children have the highest poverty rate, with 299 households (57.7%) falling below the poverty line.
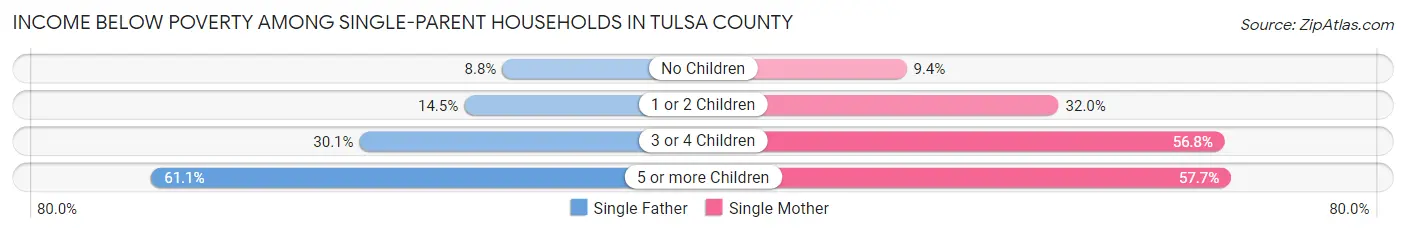
| Children | Single Father | Single Mother |
| No Children | 510 (8.8%) | 1,048 (9.4%) |
| 1 or 2 Children | 1,015 (14.5%) | 5,230 (32.0%) |
| 3 or 4 Children | 413 (30.1%) | 2,224 (56.8%) |
| 5 or more Children | 11 (61.1%) | 299 (57.7%) |
| Total | 1,949 (13.8%) | 8,801 (27.5%) |
Income Below Poverty Among Married-Couple vs Single-Parent Households in Tulsa County
The poverty data for Tulsa County shows that 6,699 of the married-couple family households (5.7%) and 10,750 of the single-parent households (23.3%) are living below the poverty level. Within the married-couple family households, those with 5 or more children have the highest poverty rate, with 228 households (21.9%) falling below the poverty line. Among the single-parent households, those with 5 or more children have the highest poverty rate, with 310 household (57.8%) living below poverty.
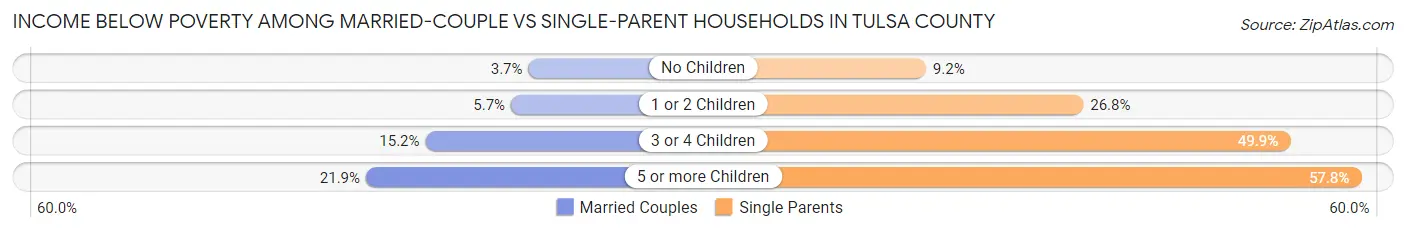
| Children | Married-Couple Families | Single-Parent Households |
| No Children | 2,441 (3.7%) | 1,558 (9.2%) |
| 1 or 2 Children | 2,221 (5.7%) | 6,245 (26.8%) |
| 3 or 4 Children | 1,809 (15.2%) | 2,637 (49.9%) |
| 5 or more Children | 228 (21.9%) | 310 (57.8%) |
| Total | 6,699 (5.7%) | 10,750 (23.3%) |
Employment Characteristics in Tulsa County
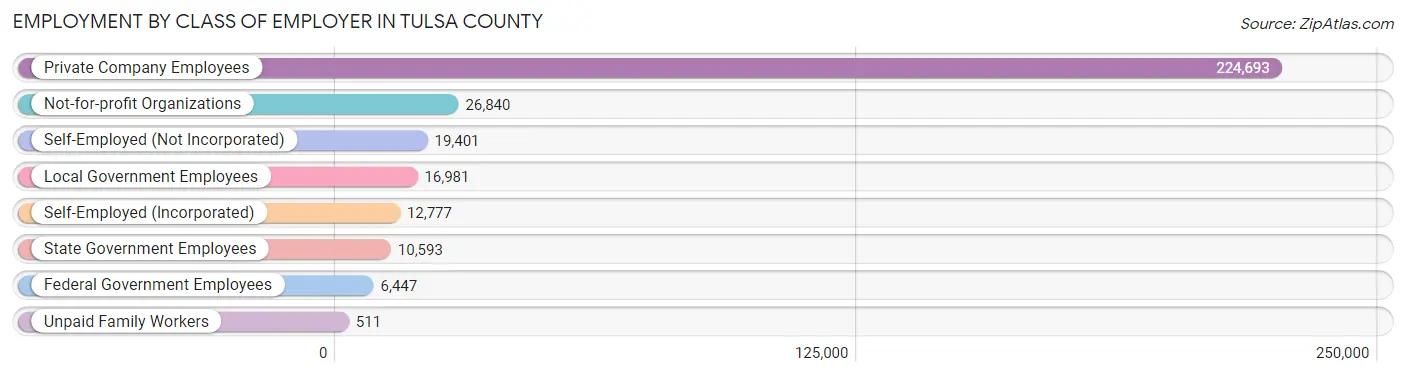
Employment by Class of Employer in Tulsa County
Among the 318,243 employed individuals in Tulsa County, private company employees (224,693 | 70.6%), not-for-profit organizations (26,840 | 8.4%), and self-employed (not incorporated) (19,401 | 6.1%) make up the most common classes of employment.
| Employer Class | # Employees | % Employees |
| Private Company Employees | 224,693 | 70.6% |
| Self-Employed (Incorporated) | 12,777 | 4.0% |
| Self-Employed (Not Incorporated) | 19,401 | 6.1% |
| Not-for-profit Organizations | 26,840 | 8.4% |
| Local Government Employees | 16,981 | 5.3% |
| State Government Employees | 10,593 | 3.3% |
| Federal Government Employees | 6,447 | 2.0% |
| Unpaid Family Workers | 511 | 0.2% |
| Total | 318,243 | 100.0% |
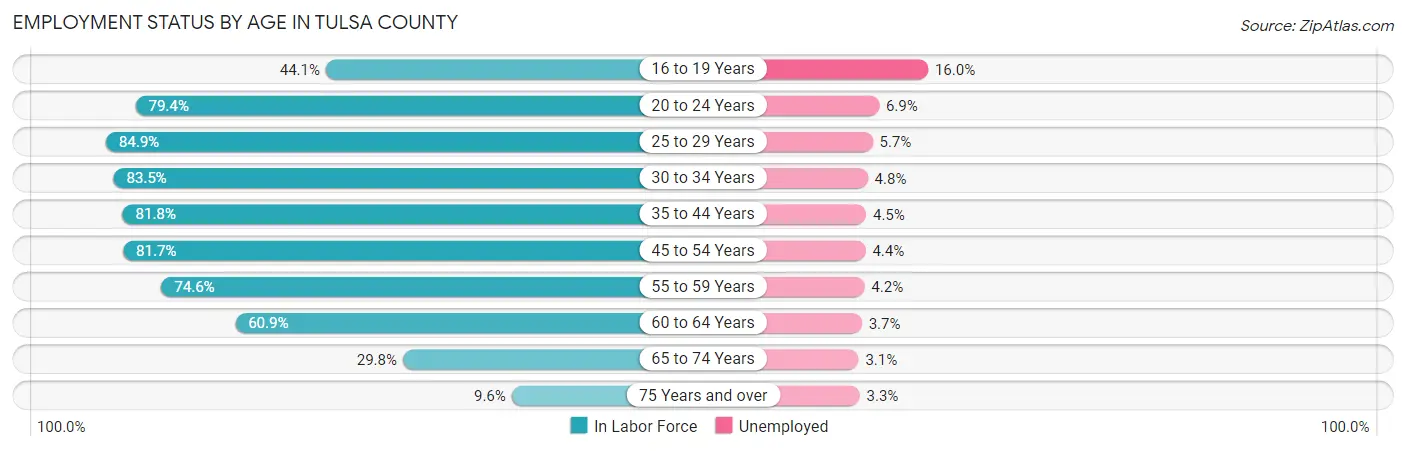
Employment Status by Age in Tulsa County
According to the labor force statistics for Tulsa County, out of the total population over 16 years of age (520,740), 65.8% or 342,647 individuals are in the labor force, with 5.3% or 18,160 of them unemployed. The age group with the highest labor force participation rate is 25 to 29 years, with 84.9% or 40,698 individuals in the labor force. Within the labor force, the 16 to 19 years age range has the highest percentage of unemployed individuals, with 16.0% or 2,554 of them being unemployed.
| Age Bracket | In Labor Force | Unemployed |
| 16 to 19 Years | 15,964 (44.1%) | 2,554 (16.0%) |
| 20 to 24 Years | 35,514 (79.4%) | 2,450 (6.9%) |
| 25 to 29 Years | 40,698 (84.9%) | 2,320 (5.7%) |
| 30 to 34 Years | 39,817 (83.5%) | 1,911 (4.8%) |
| 35 to 44 Years | 72,334 (81.8%) | 3,255 (4.5%) |
| 45 to 54 Years | 63,881 (81.7%) | 2,811 (4.4%) |
| 55 to 59 Years | 29,295 (74.6%) | 1,230 (4.2%) |
| 60 to 64 Years | 23,867 (60.9%) | 883 (3.7%) |
| 65 to 74 Years | 17,627 (29.8%) | 546 (3.1%) |
| 75 Years and over | 3,836 (9.6%) | 127 (3.3%) |
| Total | 342,647 (65.8%) | 18,160 (5.3%) |
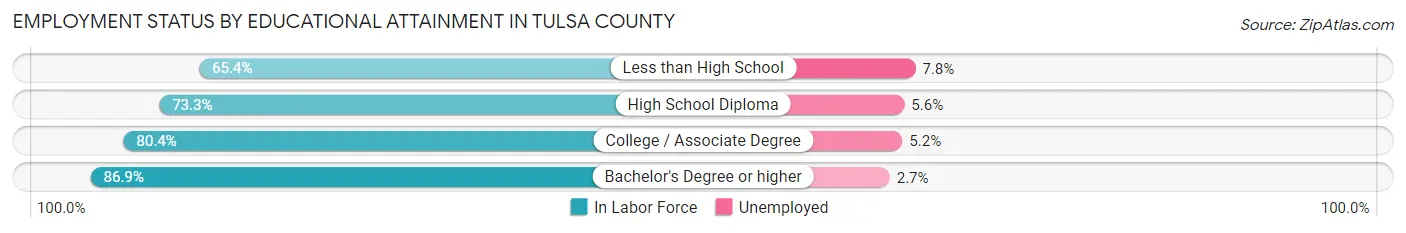
Employment Status by Educational Attainment in Tulsa County
According to labor force statistics for Tulsa County, 79.2% of individuals (269,834) out of the total population between 25 and 64 years of age (340,699) are in the labor force, with 4.6% or 12,412 of them being unemployed. The group with the highest labor force participation rate are those with the educational attainment of bachelor's degree or higher, with 86.9% or 98,748 individuals in the labor force. Within the labor force, individuals with less than high school education have the highest percentage of unemployment, with 7.8% or 1,846 of them being unemployed.
| Educational Attainment | In Labor Force | Unemployed |
| Less than High School | 23,662 (65.4%) | 2,822 (7.8%) |
| High School Diploma | 61,924 (73.3%) | 4,731 (5.6%) |
| College / Associate Degree | 85,550 (80.4%) | 5,533 (5.2%) |
| Bachelor's Degree or higher | 98,748 (86.9%) | 3,068 (2.7%) |
| Total | 269,834 (79.2%) | 15,672 (4.6%) |
Employment Occupations by Sex in Tulsa County
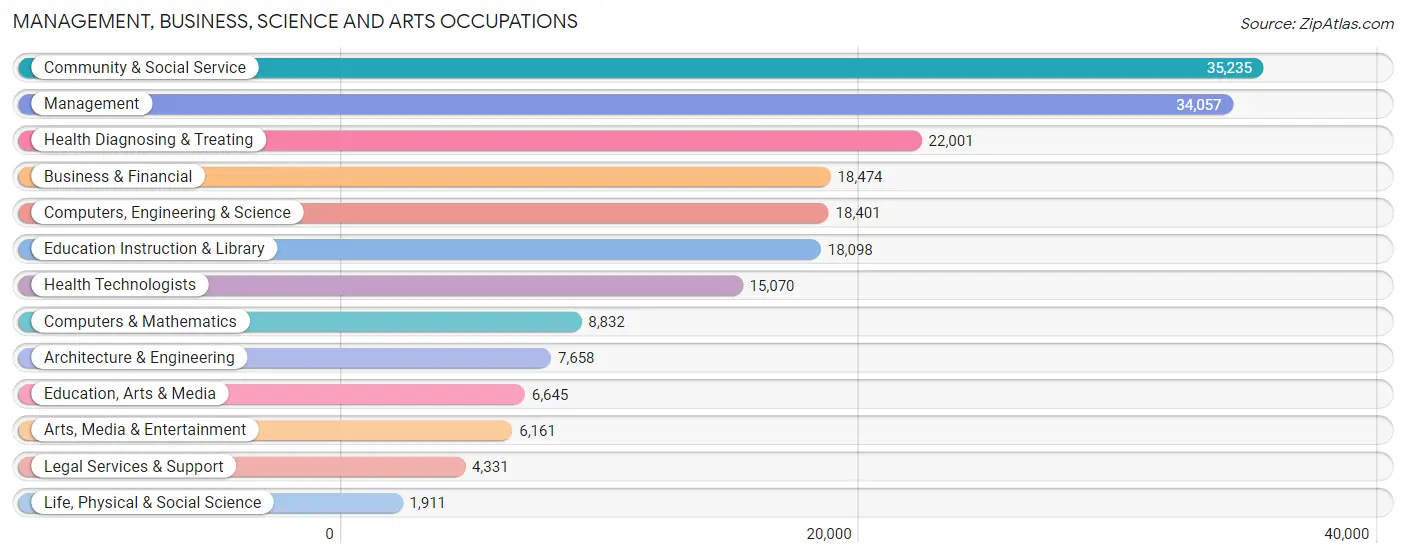
Management, Business, Science and Arts Occupations
The most common Management, Business, Science and Arts occupations in Tulsa County are Community & Social Service (35,235 | 10.9%), Management (34,057 | 10.5%), Health Diagnosing & Treating (22,001 | 6.8%), Business & Financial (18,474 | 5.7%), and Computers, Engineering & Science (18,401 | 5.7%).
Management, Business, Science and Arts Occupations by Sex
Within the Management, Business, Science and Arts occupations in Tulsa County, the most male-oriented occupations are Architecture & Engineering (82.9%), Computers & Mathematics (78.3%), and Computers, Engineering & Science (77.8%), while the most female-oriented occupations are Education Instruction & Library (71.5%), Health Diagnosing & Treating (68.4%), and Health Technologists (68.0%).
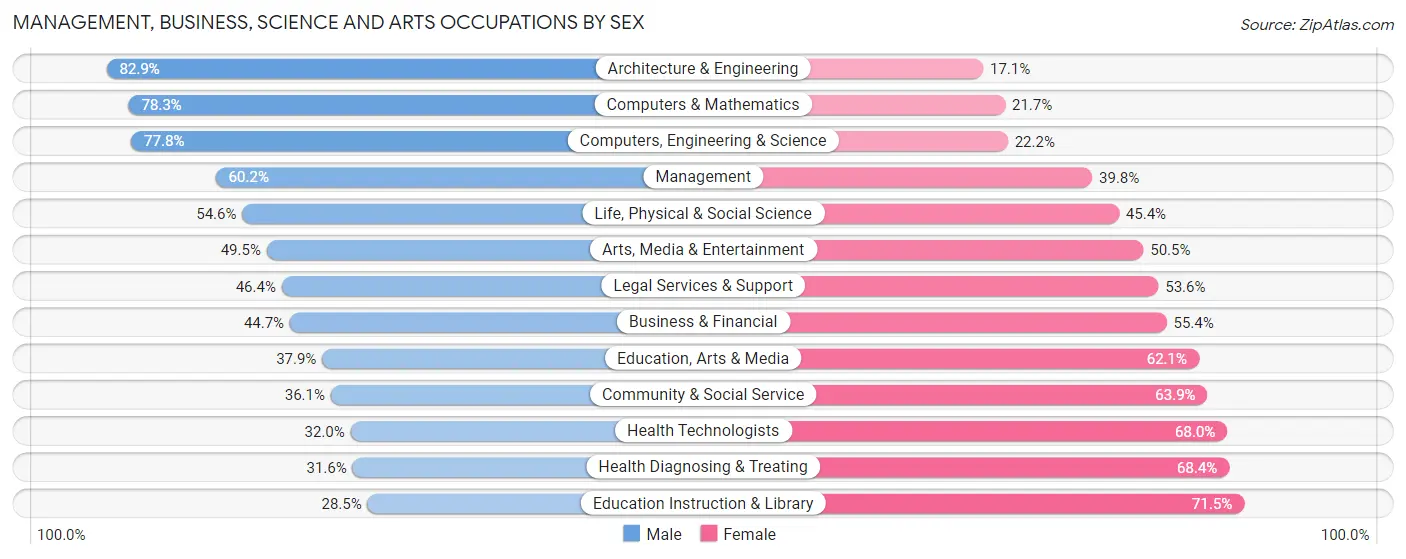
| Occupation | Male | Female |
| Management | 20,492 (60.2%) | 13,565 (39.8%) |
| Business & Financial | 8,248 (44.7%) | 10,226 (55.3%) |
| Computers, Engineering & Science | 14,311 (77.8%) | 4,090 (22.2%) |
| Computers & Mathematics | 6,918 (78.3%) | 1,914 (21.7%) |
| Architecture & Engineering | 6,350 (82.9%) | 1,308 (17.1%) |
| Life, Physical & Social Science | 1,043 (54.6%) | 868 (45.4%) |
| Community & Social Service | 12,728 (36.1%) | 22,507 (63.9%) |
| Education, Arts & Media | 2,520 (37.9%) | 4,125 (62.1%) |
| Legal Services & Support | 2,008 (46.4%) | 2,323 (53.6%) |
| Education Instruction & Library | 5,151 (28.5%) | 12,947 (71.5%) |
| Arts, Media & Entertainment | 3,049 (49.5%) | 3,112 (50.5%) |
| Health Diagnosing & Treating | 6,951 (31.6%) | 15,050 (68.4%) |
| Health Technologists | 4,822 (32.0%) | 10,248 (68.0%) |
| Total (Category) | 62,730 (48.9%) | 65,438 (51.1%) |
| Total (Overall) | 173,189 (53.5%) | 150,780 (46.5%) |
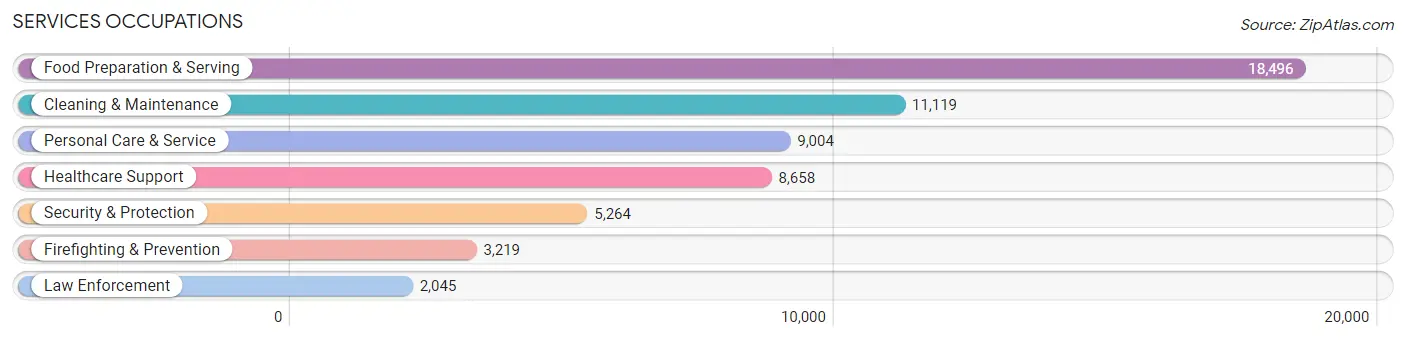
Services Occupations
The most common Services occupations in Tulsa County are Food Preparation & Serving (18,496 | 5.7%), Cleaning & Maintenance (11,119 | 3.4%), Personal Care & Service (9,004 | 2.8%), Healthcare Support (8,658 | 2.7%), and Security & Protection (5,264 | 1.6%).
Services Occupations by Sex
Within the Services occupations in Tulsa County, the most male-oriented occupations are Firefighting & Prevention (78.2%), Security & Protection (77.6%), and Law Enforcement (76.7%), while the most female-oriented occupations are Healthcare Support (88.1%), Personal Care & Service (74.2%), and Food Preparation & Serving (56.8%).
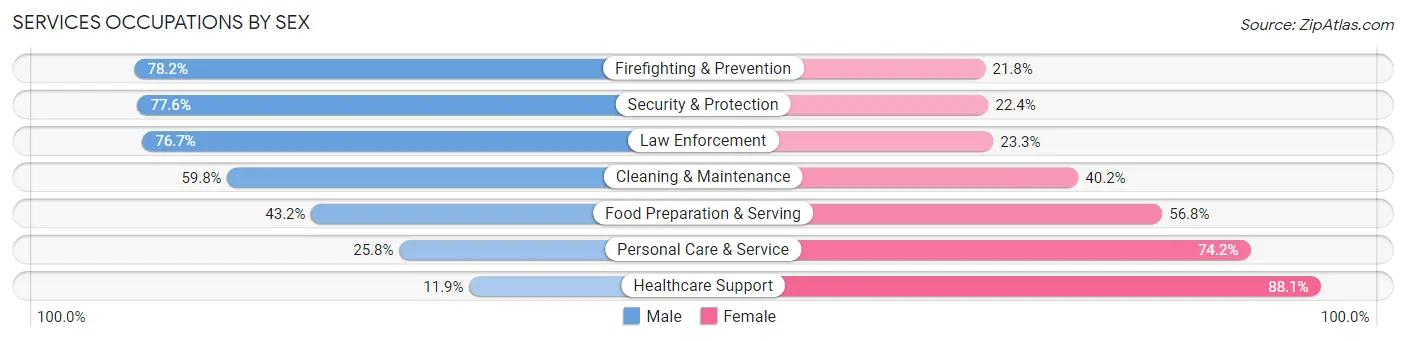
| Occupation | Male | Female |
| Healthcare Support | 1,033 (11.9%) | 7,625 (88.1%) |
| Security & Protection | 4,086 (77.6%) | 1,178 (22.4%) |
| Firefighting & Prevention | 2,518 (78.2%) | 701 (21.8%) |
| Law Enforcement | 1,568 (76.7%) | 477 (23.3%) |
| Food Preparation & Serving | 7,994 (43.2%) | 10,502 (56.8%) |
| Cleaning & Maintenance | 6,653 (59.8%) | 4,466 (40.2%) |
| Personal Care & Service | 2,324 (25.8%) | 6,680 (74.2%) |
| Total (Category) | 22,090 (42.0%) | 30,451 (58.0%) |
| Total (Overall) | 173,189 (53.5%) | 150,780 (46.5%) |
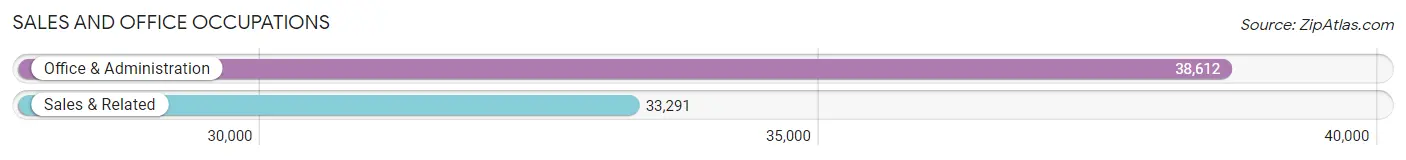
Sales and Office Occupations
The most common Sales and Office occupations in Tulsa County are Office & Administration (38,612 | 11.9%), and Sales & Related (33,291 | 10.3%).
Sales and Office Occupations by Sex
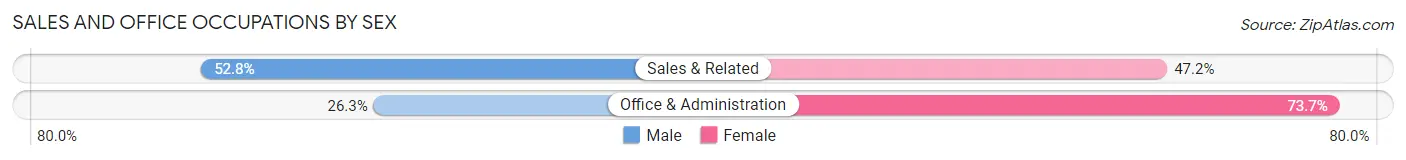
| Occupation | Male | Female |
| Sales & Related | 17,585 (52.8%) | 15,706 (47.2%) |
| Office & Administration | 10,163 (26.3%) | 28,449 (73.7%) |
| Total (Category) | 27,748 (38.6%) | 44,155 (61.4%) |
| Total (Overall) | 173,189 (53.5%) | 150,780 (46.5%) |
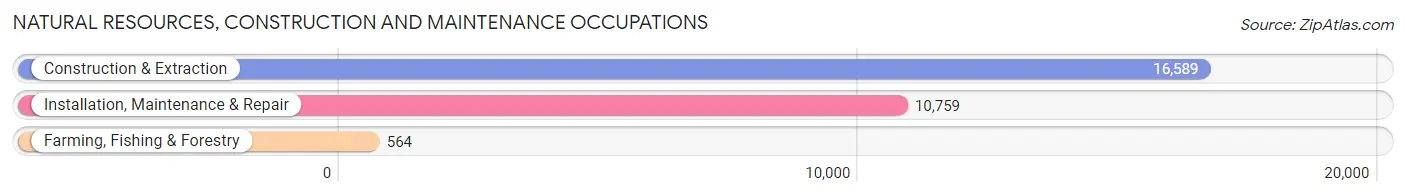
Natural Resources, Construction and Maintenance Occupations
The most common Natural Resources, Construction and Maintenance occupations in Tulsa County are Construction & Extraction (16,589 | 5.1%), Installation, Maintenance & Repair (10,759 | 3.3%), and Farming, Fishing & Forestry (564 | 0.2%).
Natural Resources, Construction and Maintenance Occupations by Sex
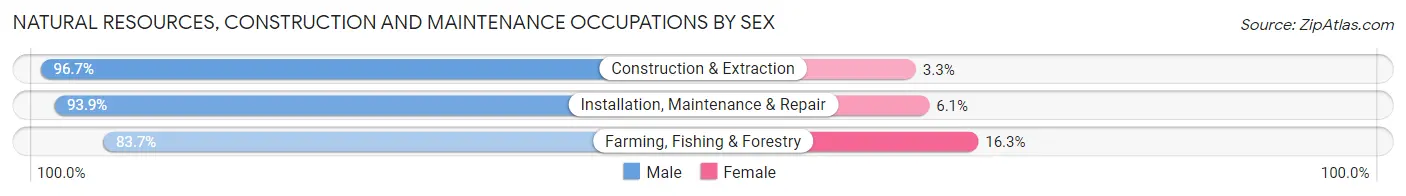
| Occupation | Male | Female |
| Farming, Fishing & Forestry | 472 (83.7%) | 92 (16.3%) |
| Construction & Extraction | 16,036 (96.7%) | 553 (3.3%) |
| Installation, Maintenance & Repair | 10,102 (93.9%) | 657 (6.1%) |
| Total (Category) | 26,610 (95.3%) | 1,302 (4.7%) |
| Total (Overall) | 173,189 (53.5%) | 150,780 (46.5%) |
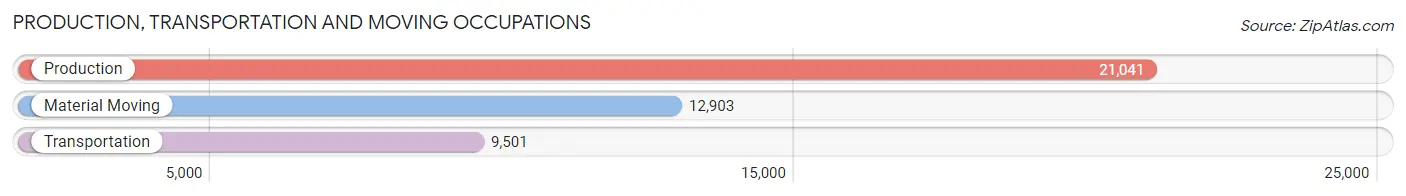
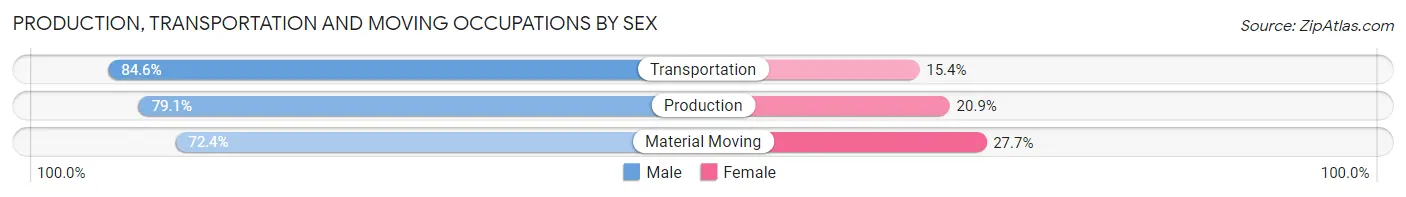
Production, Transportation and Moving Occupations
The most common Production, Transportation and Moving occupations in Tulsa County are Production (21,041 | 6.5%), Material Moving (12,903 | 4.0%), and Transportation (9,501 | 2.9%).
Production, Transportation and Moving Occupations by Sex
| Occupation | Male | Female |
| Production | 16,635 (79.1%) | 4,406 (20.9%) |
| Transportation | 8,041 (84.6%) | 1,460 (15.4%) |
| Material Moving | 9,335 (72.4%) | 3,568 (27.7%) |
| Total (Category) | 34,011 (78.3%) | 9,434 (21.7%) |
| Total (Overall) | 173,189 (53.5%) | 150,780 (46.5%) |
Employment Industries by Sex in Tulsa County
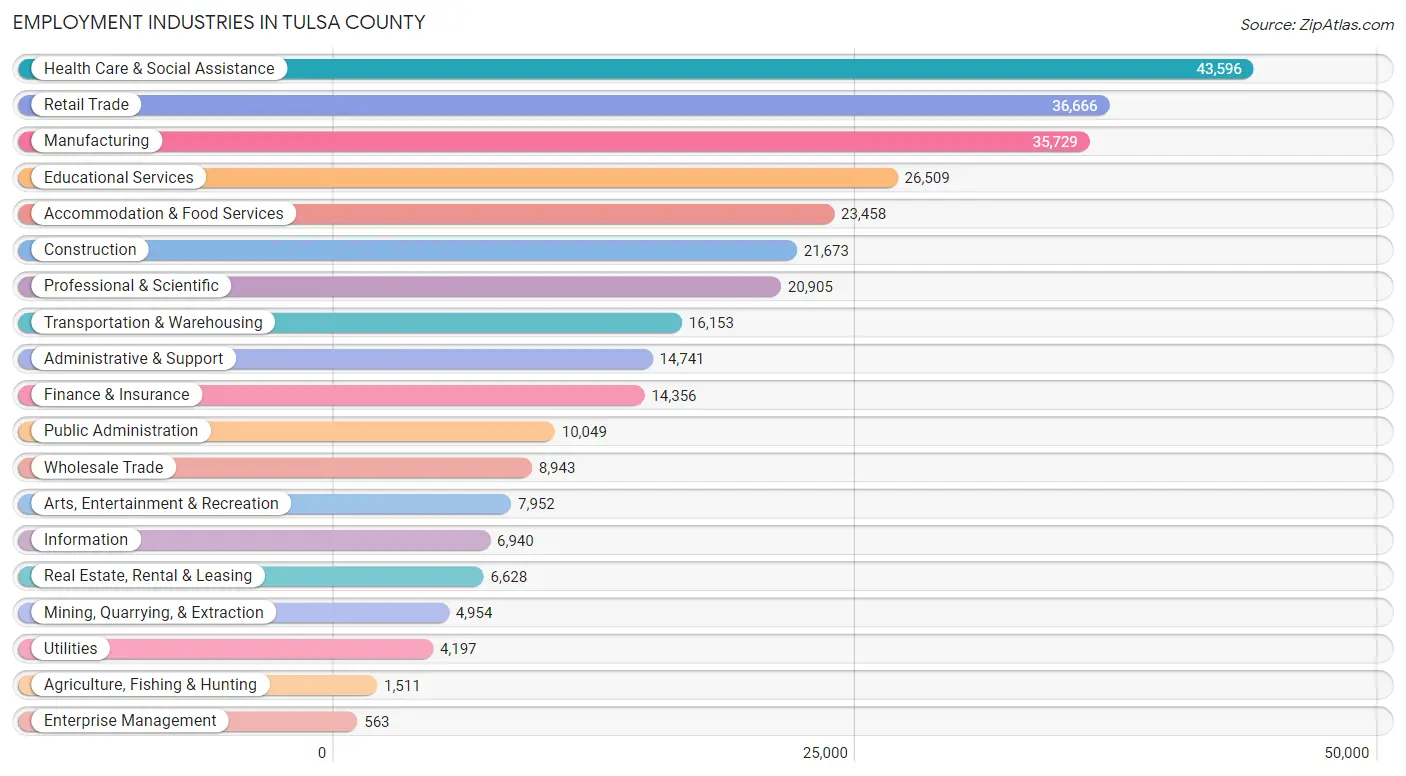
Employment Industries in Tulsa County
The major employment industries in Tulsa County include Health Care & Social Assistance (43,596 | 13.5%), Retail Trade (36,666 | 11.3%), Manufacturing (35,729 | 11.0%), Educational Services (26,509 | 8.2%), and Accommodation & Food Services (23,458 | 7.2%).
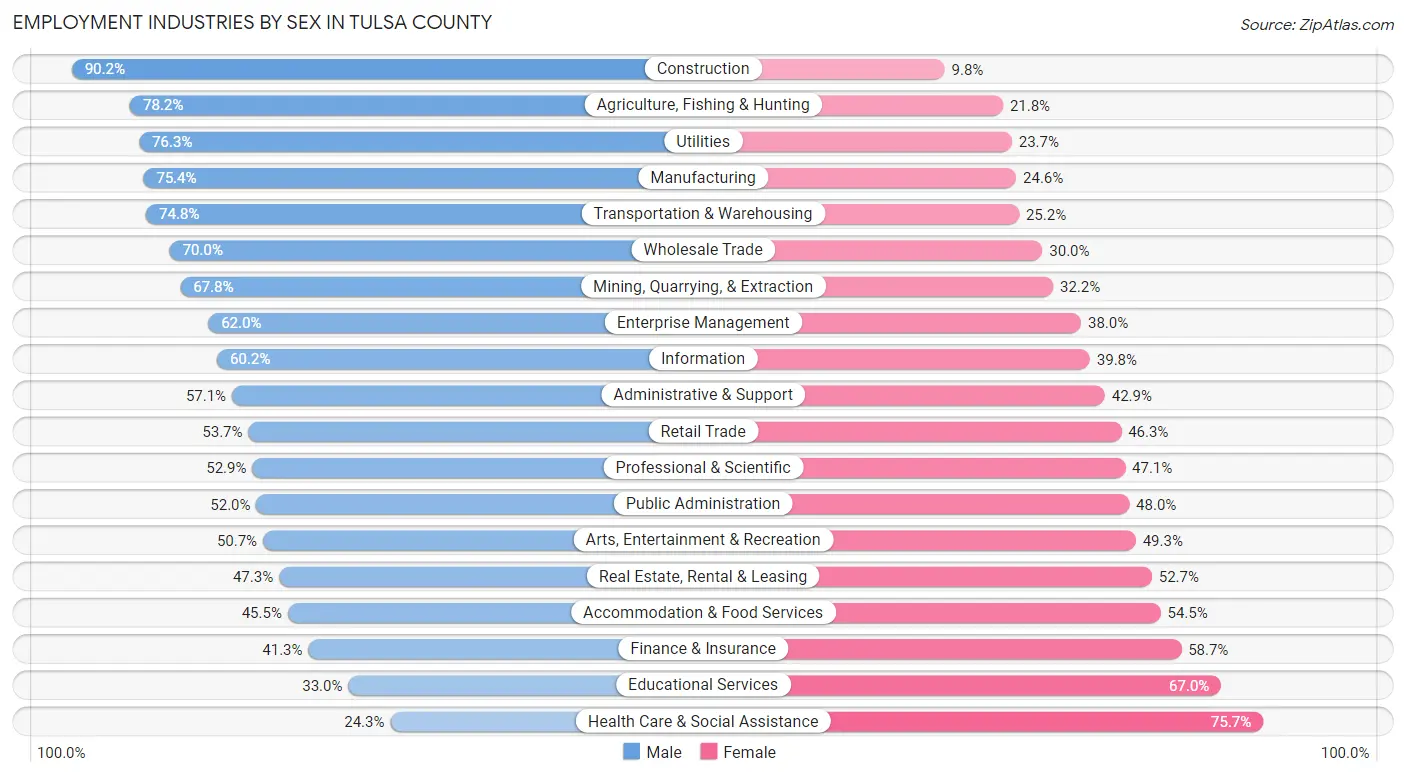
Employment Industries by Sex in Tulsa County
The Tulsa County industries that see more men than women are Construction (90.2%), Agriculture, Fishing & Hunting (78.2%), and Utilities (76.3%), whereas the industries that tend to have a higher number of women are Health Care & Social Assistance (75.7%), Educational Services (67.0%), and Finance & Insurance (58.7%).
| Industry | Male | Female |
| Agriculture, Fishing & Hunting | 1,181 (78.2%) | 330 (21.8%) |
| Mining, Quarrying, & Extraction | 3,358 (67.8%) | 1,596 (32.2%) |
| Construction | 19,558 (90.2%) | 2,115 (9.8%) |
| Manufacturing | 26,951 (75.4%) | 8,778 (24.6%) |
| Wholesale Trade | 6,260 (70.0%) | 2,683 (30.0%) |
| Retail Trade | 19,681 (53.7%) | 16,985 (46.3%) |
| Transportation & Warehousing | 12,089 (74.8%) | 4,064 (25.2%) |
| Utilities | 3,203 (76.3%) | 994 (23.7%) |
| Information | 4,176 (60.2%) | 2,764 (39.8%) |
| Finance & Insurance | 5,924 (41.3%) | 8,432 (58.7%) |
| Real Estate, Rental & Leasing | 3,138 (47.3%) | 3,490 (52.7%) |
| Professional & Scientific | 11,052 (52.9%) | 9,853 (47.1%) |
| Enterprise Management | 349 (62.0%) | 214 (38.0%) |
| Administrative & Support | 8,414 (57.1%) | 6,327 (42.9%) |
| Educational Services | 8,749 (33.0%) | 17,760 (67.0%) |
| Health Care & Social Assistance | 10,597 (24.3%) | 32,999 (75.7%) |
| Arts, Entertainment & Recreation | 4,029 (50.7%) | 3,923 (49.3%) |
| Accommodation & Food Services | 10,681 (45.5%) | 12,777 (54.5%) |
| Public Administration | 5,228 (52.0%) | 4,821 (48.0%) |
| Total | 173,189 (53.5%) | 150,780 (46.5%) |
Education in Tulsa County
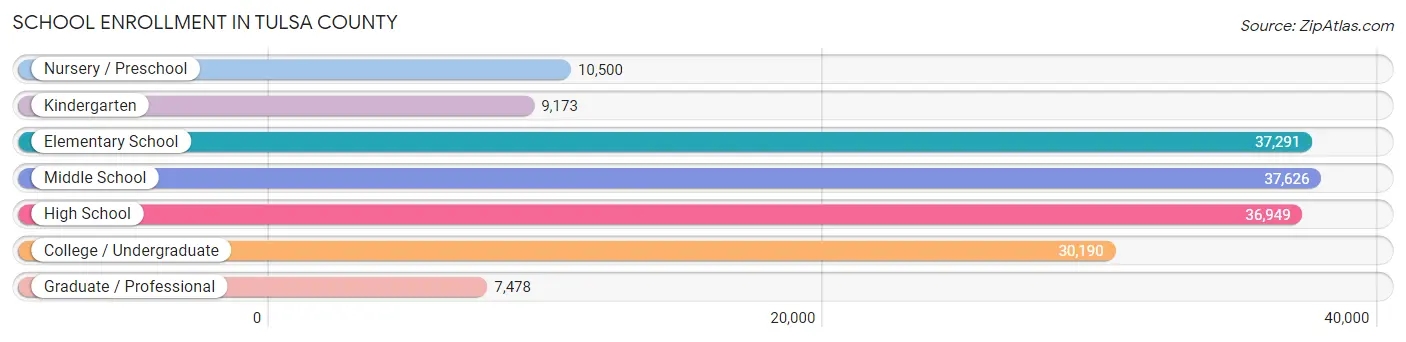
School Enrollment in Tulsa County
The most common levels of schooling among the 169,207 students in Tulsa County are middle school (37,626 | 22.2%), elementary school (37,291 | 22.0%), and high school (36,949 | 21.8%).
| School Level | # Students | % Students |
| Nursery / Preschool | 10,500 | 6.2% |
| Kindergarten | 9,173 | 5.4% |
| Elementary School | 37,291 | 22.0% |
| Middle School | 37,626 | 22.2% |
| High School | 36,949 | 21.8% |
| College / Undergraduate | 30,190 | 17.8% |
| Graduate / Professional | 7,478 | 4.4% |
| Total | 169,207 | 100.0% |
School Enrollment by Age by Funding Source in Tulsa County
Out of a total of 169,207 students who are enrolled in schools in Tulsa County, 36,041 (21.3%) attend a private institution, while the remaining 133,166 (78.7%) are enrolled in public schools. The age group of 3 to 4 year olds has the highest likelihood of being enrolled in private schools, with 3,328 (41.5% in the age bracket) enrolled. Conversely, the age group of 10 to 14 year olds has the lowest likelihood of being enrolled in a private school, with 39,364 (84.2% in the age bracket) attending a public institution.
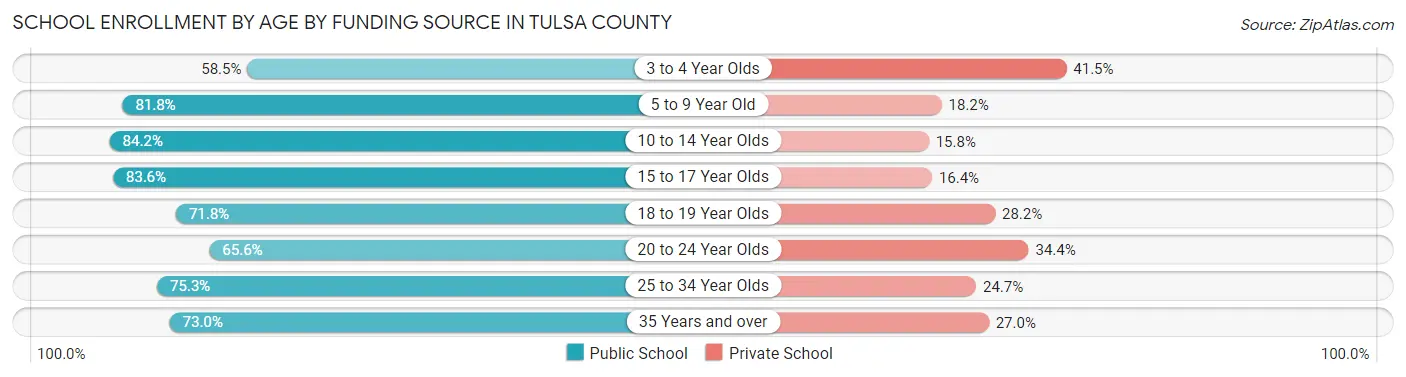
| Age Bracket | Public School | Private School |
| 3 to 4 Year Olds | 4,695 (58.5%) | 3,328 (41.5%) |
| 5 to 9 Year Old | 35,260 (81.8%) | 7,862 (18.2%) |
| 10 to 14 Year Olds | 39,364 (84.2%) | 7,411 (15.8%) |
| 15 to 17 Year Olds | 22,477 (83.6%) | 4,421 (16.4%) |
| 18 to 19 Year Olds | 8,743 (71.8%) | 3,434 (28.2%) |
| 20 to 24 Year Olds | 9,702 (65.6%) | 5,095 (34.4%) |
| 25 to 34 Year Olds | 7,140 (75.3%) | 2,337 (24.7%) |
| 35 Years and over | 5,793 (73.0%) | 2,145 (27.0%) |
| Total | 133,166 (78.7%) | 36,041 (21.3%) |
Educational Attainment by Field of Study in Tulsa County
Business (37,239 | 23.7%), education (21,058 | 13.4%), science & technology (15,171 | 9.7%), engineering (10,940 | 7.0%), and arts & humanities (10,222 | 6.5%) are the most common fields of study among 157,155 individuals in Tulsa County who have obtained a bachelor's degree or higher.
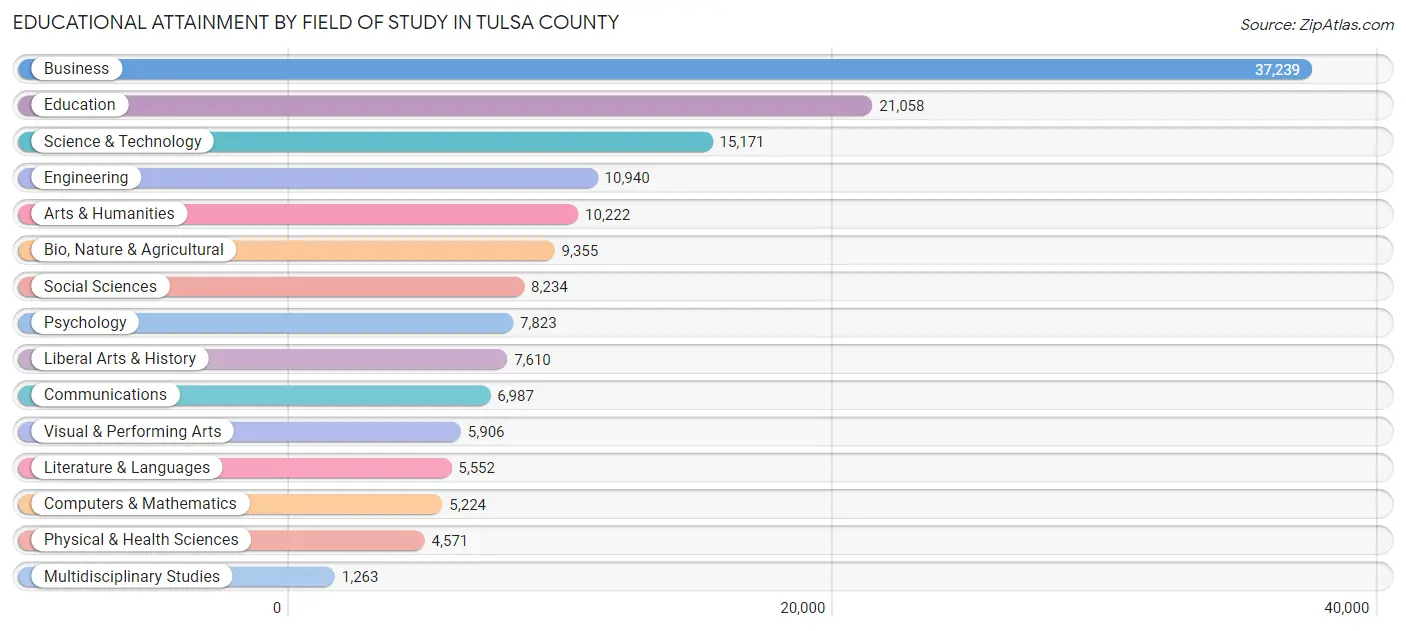
| Field of Study | # Graduates | % Graduates |
| Computers & Mathematics | 5,224 | 3.3% |
| Bio, Nature & Agricultural | 9,355 | 5.9% |
| Physical & Health Sciences | 4,571 | 2.9% |
| Psychology | 7,823 | 5.0% |
| Social Sciences | 8,234 | 5.2% |
| Engineering | 10,940 | 7.0% |
| Multidisciplinary Studies | 1,263 | 0.8% |
| Science & Technology | 15,171 | 9.7% |
| Business | 37,239 | 23.7% |
| Education | 21,058 | 13.4% |
| Literature & Languages | 5,552 | 3.5% |
| Liberal Arts & History | 7,610 | 4.8% |
| Visual & Performing Arts | 5,906 | 3.8% |
| Communications | 6,987 | 4.4% |
| Arts & Humanities | 10,222 | 6.5% |
| Total | 157,155 | 100.0% |
Transportation & Commute in Tulsa County
Vehicle Availability by Sex in Tulsa County
The most prevalent vehicle ownership categories in Tulsa County are males with 2 vehicles (76,627, accounting for 45.0%) and females with 2 vehicles (61,701, making up 52.4%).
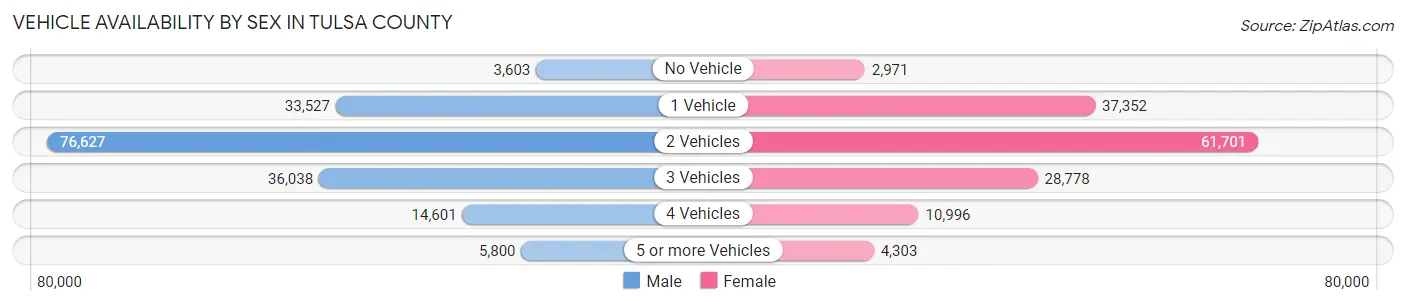
| Vehicles Available | Male | Female |
| No Vehicle | 3,603 (2.1%) | 2,971 (2.0%) |
| 1 Vehicle | 33,527 (19.7%) | 37,352 (25.6%) |
| 2 Vehicles | 76,627 (45.0%) | 61,701 (42.2%) |
| 3 Vehicles | 36,038 (21.2%) | 28,778 (19.7%) |
| 4 Vehicles | 14,601 (8.6%) | 10,996 (7.5%) |
| 5 or more Vehicles | 5,800 (3.4%) | 4,303 (2.9%) |
| Total | 170,196 (100.0%) | 146,101 (100.0%) |
Commute Time in Tulsa County
The most frequently occuring commute durations in Tulsa County are 15 to 19 minutes (64,401 commuters, 22.2%), 20 to 24 minutes (61,094 commuters, 21.0%), and 10 to 14 minutes (50,002 commuters, 17.2%).
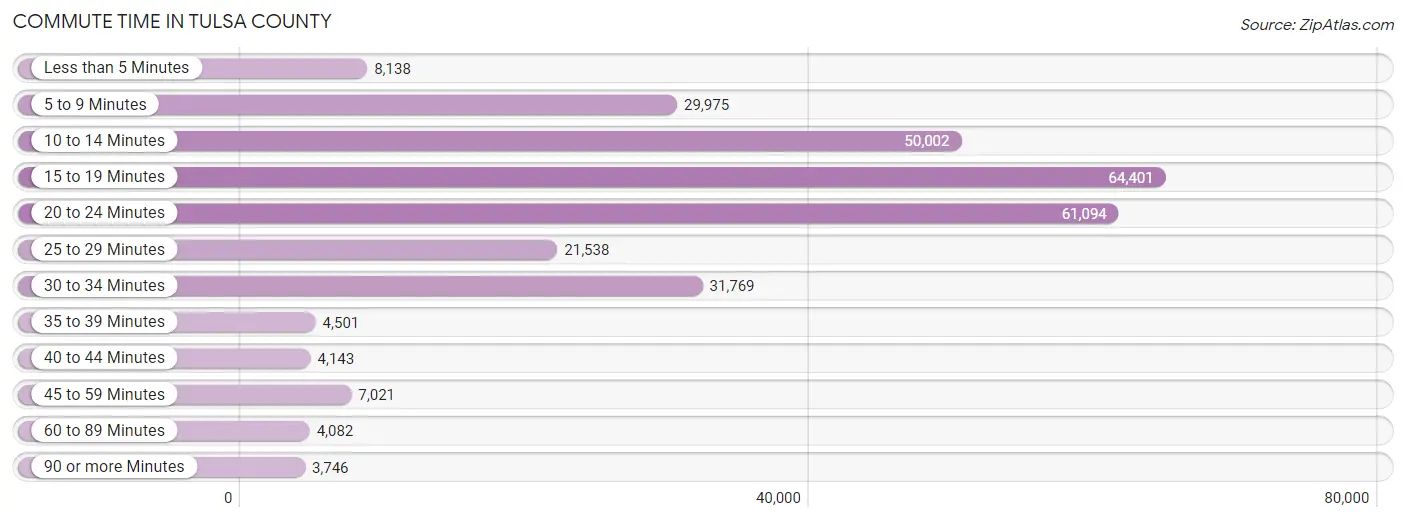
| Commute Time | # Commuters | % Commuters |
| Less than 5 Minutes | 8,138 | 2.8% |
| 5 to 9 Minutes | 29,975 | 10.3% |
| 10 to 14 Minutes | 50,002 | 17.2% |
| 15 to 19 Minutes | 64,401 | 22.2% |
| 20 to 24 Minutes | 61,094 | 21.0% |
| 25 to 29 Minutes | 21,538 | 7.4% |
| 30 to 34 Minutes | 31,769 | 10.9% |
| 35 to 39 Minutes | 4,501 | 1.5% |
| 40 to 44 Minutes | 4,143 | 1.4% |
| 45 to 59 Minutes | 7,021 | 2.4% |
| 60 to 89 Minutes | 4,082 | 1.4% |
| 90 or more Minutes | 3,746 | 1.3% |
Commute Time by Sex in Tulsa County
The most common commute times in Tulsa County are 15 to 19 minutes (35,089 commuters, 22.3%) for males and 15 to 19 minutes (29,312 commuters, 22.0%) for females.
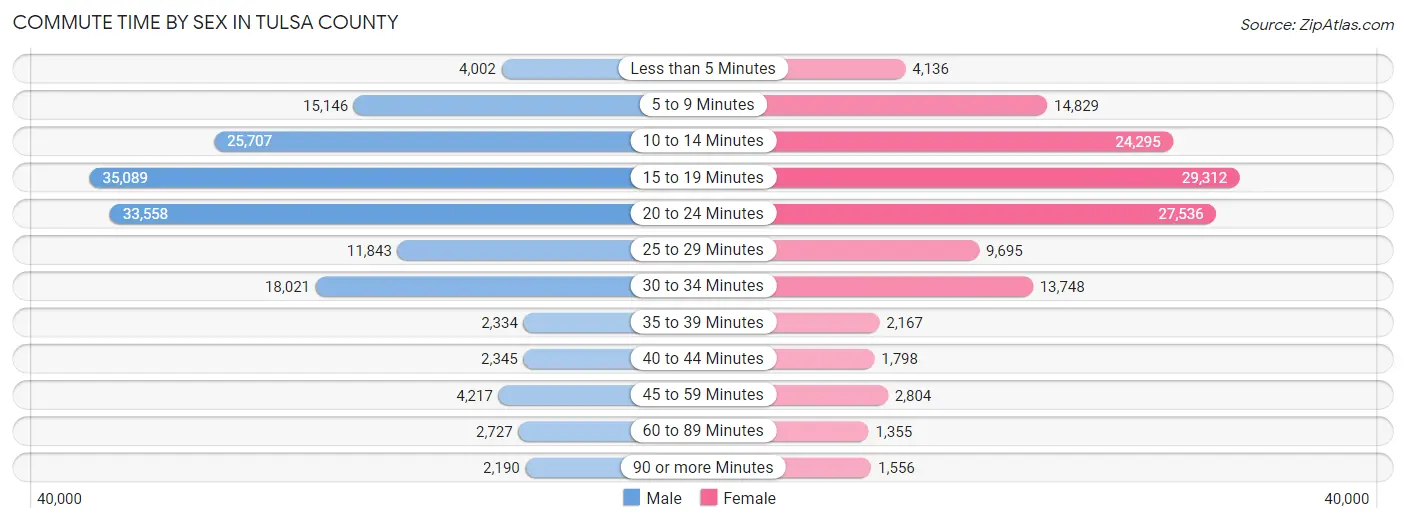
| Commute Time | Male | Female |
| Less than 5 Minutes | 4,002 (2.5%) | 4,136 (3.1%) |
| 5 to 9 Minutes | 15,146 (9.6%) | 14,829 (11.1%) |
| 10 to 14 Minutes | 25,707 (16.4%) | 24,295 (18.2%) |
| 15 to 19 Minutes | 35,089 (22.3%) | 29,312 (22.0%) |
| 20 to 24 Minutes | 33,558 (21.3%) | 27,536 (20.7%) |
| 25 to 29 Minutes | 11,843 (7.5%) | 9,695 (7.3%) |
| 30 to 34 Minutes | 18,021 (11.5%) | 13,748 (10.3%) |
| 35 to 39 Minutes | 2,334 (1.5%) | 2,167 (1.6%) |
| 40 to 44 Minutes | 2,345 (1.5%) | 1,798 (1.3%) |
| 45 to 59 Minutes | 4,217 (2.7%) | 2,804 (2.1%) |
| 60 to 89 Minutes | 2,727 (1.7%) | 1,355 (1.0%) |
| 90 or more Minutes | 2,190 (1.4%) | 1,556 (1.2%) |
Time of Departure to Work by Sex in Tulsa County
The most frequent times of departure to work in Tulsa County are 7:00 AM to 7:29 AM (22,739, 14.5%) for males and 7:30 AM to 7:59 AM (22,039, 16.5%) for females.
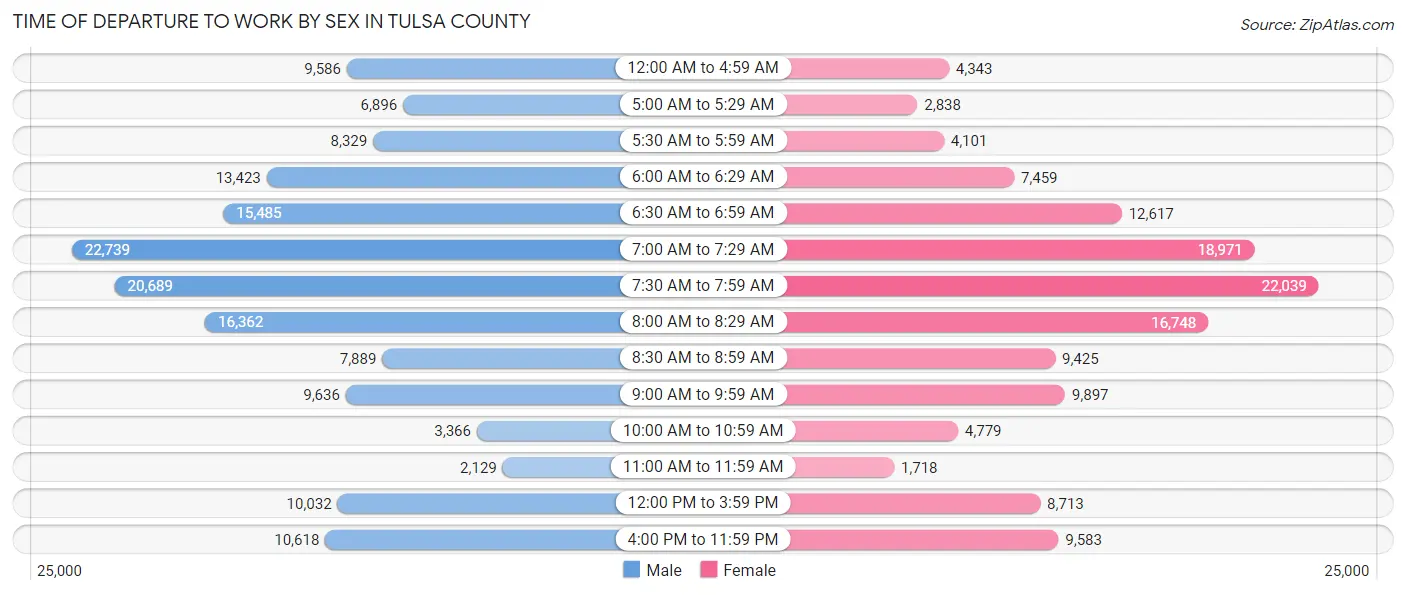
| Time of Departure | Male | Female |
| 12:00 AM to 4:59 AM | 9,586 (6.1%) | 4,343 (3.3%) |
| 5:00 AM to 5:29 AM | 6,896 (4.4%) | 2,838 (2.1%) |
| 5:30 AM to 5:59 AM | 8,329 (5.3%) | 4,101 (3.1%) |
| 6:00 AM to 6:29 AM | 13,423 (8.5%) | 7,459 (5.6%) |
| 6:30 AM to 6:59 AM | 15,485 (9.9%) | 12,617 (9.5%) |
| 7:00 AM to 7:29 AM | 22,739 (14.5%) | 18,971 (14.2%) |
| 7:30 AM to 7:59 AM | 20,689 (13.2%) | 22,039 (16.5%) |
| 8:00 AM to 8:29 AM | 16,362 (10.4%) | 16,748 (12.6%) |
| 8:30 AM to 8:59 AM | 7,889 (5.0%) | 9,425 (7.1%) |
| 9:00 AM to 9:59 AM | 9,636 (6.1%) | 9,897 (7.4%) |
| 10:00 AM to 10:59 AM | 3,366 (2.1%) | 4,779 (3.6%) |
| 11:00 AM to 11:59 AM | 2,129 (1.3%) | 1,718 (1.3%) |
| 12:00 PM to 3:59 PM | 10,032 (6.4%) | 8,713 (6.5%) |
| 4:00 PM to 11:59 PM | 10,618 (6.8%) | 9,583 (7.2%) |
| Total | 157,179 (100.0%) | 133,231 (100.0%) |
Housing Occupancy in Tulsa County
Occupancy by Ownership in Tulsa County
Of the total 264,296 dwellings in Tulsa County, owner-occupied units account for 158,277 (59.9%), while renter-occupied units make up 106,019 (40.1%).
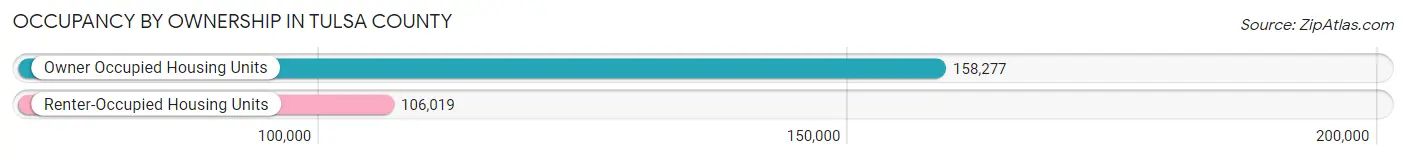
| Occupancy | # Housing Units | % Housing Units |
| Owner Occupied Housing Units | 158,277 | 59.9% |
| Renter-Occupied Housing Units | 106,019 | 40.1% |
| Total Occupied Housing Units | 264,296 | 100.0% |
Occupancy by Household Size in Tulsa County
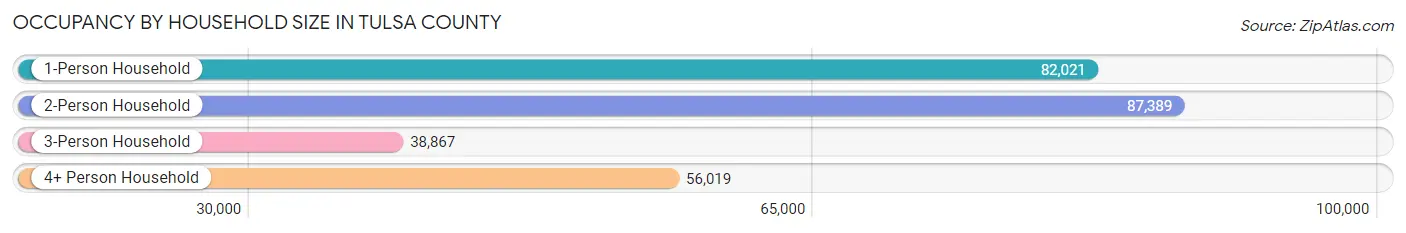
| Household Size | # Housing Units | % Housing Units |
| 1-Person Household | 82,021 | 31.0% |
| 2-Person Household | 87,389 | 33.1% |
| 3-Person Household | 38,867 | 14.7% |
| 4+ Person Household | 56,019 | 21.2% |
| Total Housing Units | 264,296 | 100.0% |
Occupancy by Ownership by Household Size in Tulsa County
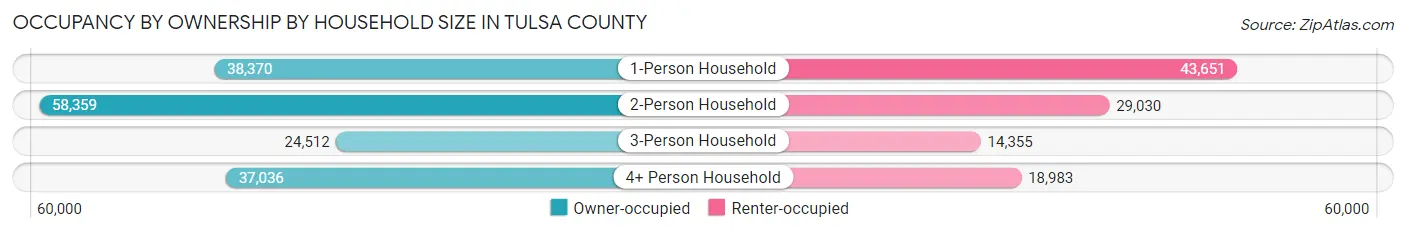
| Household Size | Owner-occupied | Renter-occupied |
| 1-Person Household | 38,370 (46.8%) | 43,651 (53.2%) |
| 2-Person Household | 58,359 (66.8%) | 29,030 (33.2%) |
| 3-Person Household | 24,512 (63.1%) | 14,355 (36.9%) |
| 4+ Person Household | 37,036 (66.1%) | 18,983 (33.9%) |
| Total Housing Units | 158,277 (59.9%) | 106,019 (40.1%) |
Occupancy by Educational Attainment in Tulsa County
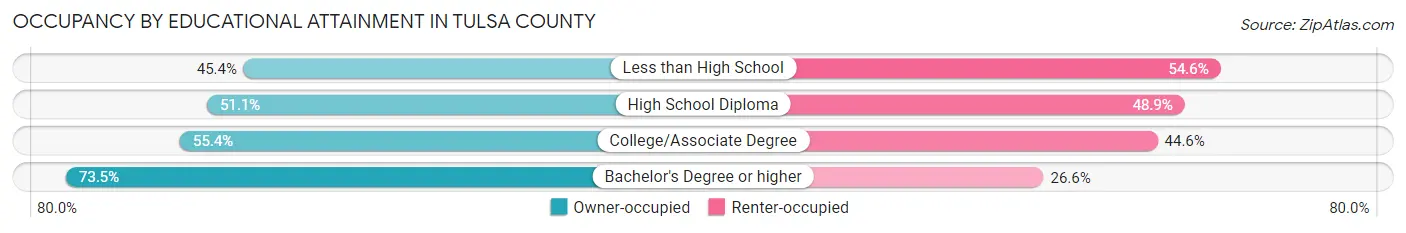
| Household Size | Owner-occupied | Renter-occupied |
| Less than High School | 10,284 (45.4%) | 12,372 (54.6%) |
| High School Diploma | 30,522 (51.1%) | 29,246 (48.9%) |
| College/Associate Degree | 49,298 (55.4%) | 39,757 (44.6%) |
| Bachelor's Degree or higher | 68,173 (73.5%) | 24,644 (26.6%) |
Occupancy by Age of Householder in Tulsa County
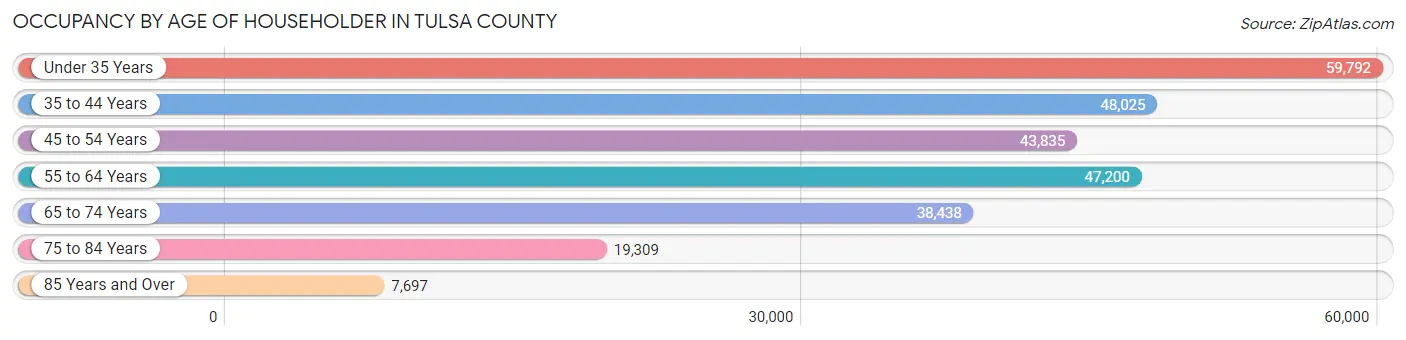
| Age Bracket | # Households | % Households |
| Under 35 Years | 59,792 | 22.6% |
| 35 to 44 Years | 48,025 | 18.2% |
| 45 to 54 Years | 43,835 | 16.6% |
| 55 to 64 Years | 47,200 | 17.9% |
| 65 to 74 Years | 38,438 | 14.5% |
| 75 to 84 Years | 19,309 | 7.3% |
| 85 Years and Over | 7,697 | 2.9% |
| Total | 264,296 | 100.0% |
Housing Finances in Tulsa County
Median Income by Occupancy in Tulsa County
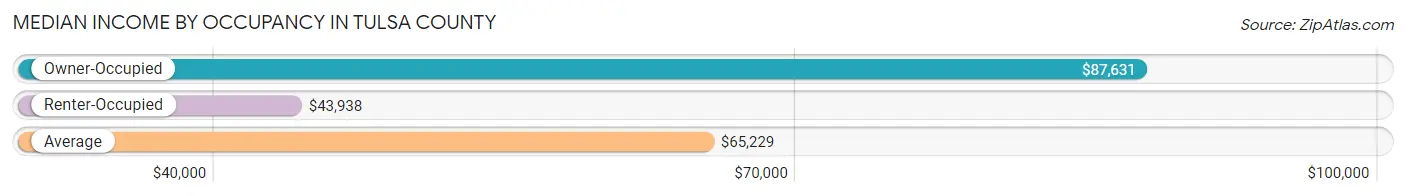
| Occupancy Type | # Households | Median Income |
| Owner-Occupied | 158,277 (59.9%) | $87,631 |
| Renter-Occupied | 106,019 (40.1%) | $43,938 |
| Average | 264,296 (100.0%) | $65,229 |
Occupancy by Householder Income Bracket in Tulsa County
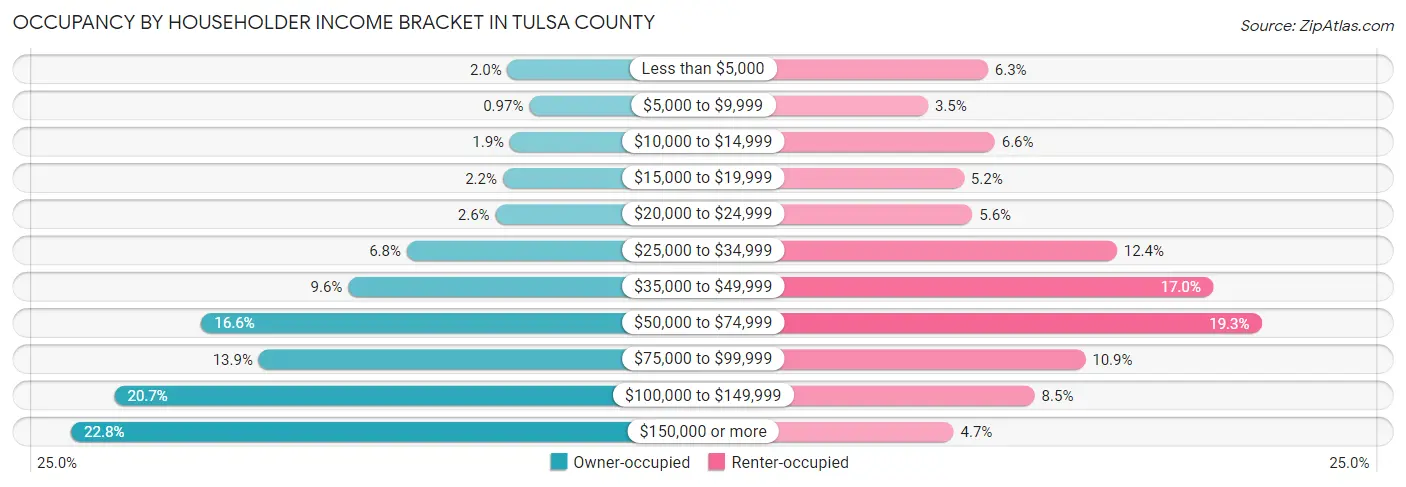
| Income Bracket | Owner-occupied | Renter-occupied |
| Less than $5,000 | 3,161 (2.0%) | 6,676 (6.3%) |
| $5,000 to $9,999 | 1,537 (1.0%) | 3,653 (3.5%) |
| $10,000 to $14,999 | 2,997 (1.9%) | 7,025 (6.6%) |
| $15,000 to $19,999 | 3,532 (2.2%) | 5,471 (5.2%) |
| $20,000 to $24,999 | 4,089 (2.6%) | 5,892 (5.6%) |
| $25,000 to $34,999 | 10,769 (6.8%) | 13,194 (12.4%) |
| $35,000 to $49,999 | 15,182 (9.6%) | 18,039 (17.0%) |
| $50,000 to $74,999 | 26,241 (16.6%) | 20,479 (19.3%) |
| $75,000 to $99,999 | 21,915 (13.9%) | 11,598 (10.9%) |
| $100,000 to $149,999 | 32,798 (20.7%) | 9,042 (8.5%) |
| $150,000 or more | 36,056 (22.8%) | 4,950 (4.7%) |
| Total | 158,277 (100.0%) | 106,019 (100.0%) |
Monthly Housing Cost Tiers in Tulsa County
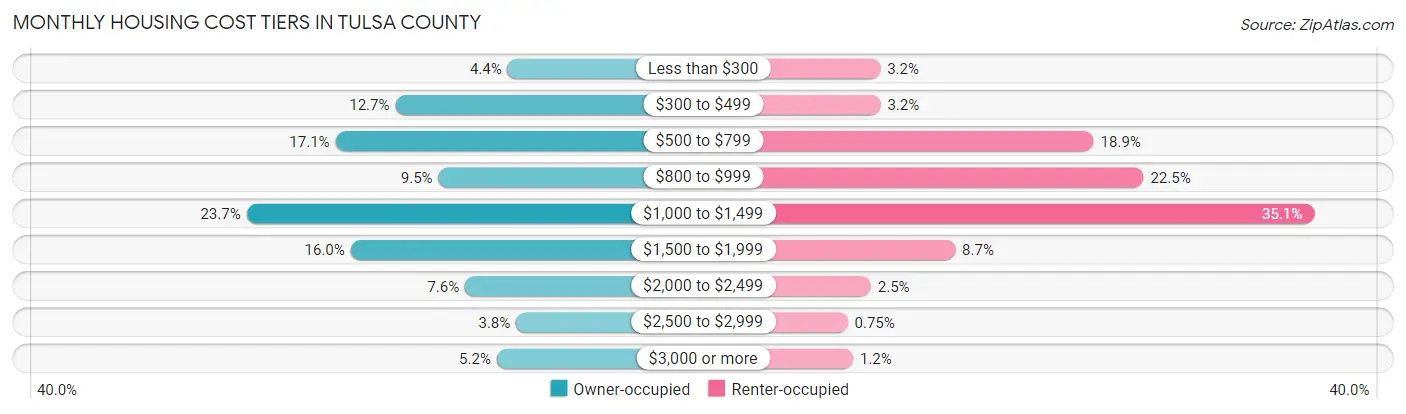
| Monthly Cost | Owner-occupied | Renter-occupied |
| Less than $300 | 7,015 (4.4%) | 3,336 (3.2%) |
| $300 to $499 | 20,105 (12.7%) | 3,357 (3.2%) |
| $500 to $799 | 27,082 (17.1%) | 20,003 (18.9%) |
| $800 to $999 | 15,069 (9.5%) | 23,897 (22.5%) |
| $1,000 to $1,499 | 37,448 (23.7%) | 37,209 (35.1%) |
| $1,500 to $1,999 | 25,307 (16.0%) | 9,197 (8.7%) |
| $2,000 to $2,499 | 11,962 (7.6%) | 2,604 (2.5%) |
| $2,500 to $2,999 | 6,011 (3.8%) | 791 (0.7%) |
| $3,000 or more | 8,278 (5.2%) | 1,216 (1.1%) |
| Total | 158,277 (100.0%) | 106,019 (100.0%) |
Physical Housing Characteristics in Tulsa County
Housing Structures in Tulsa County
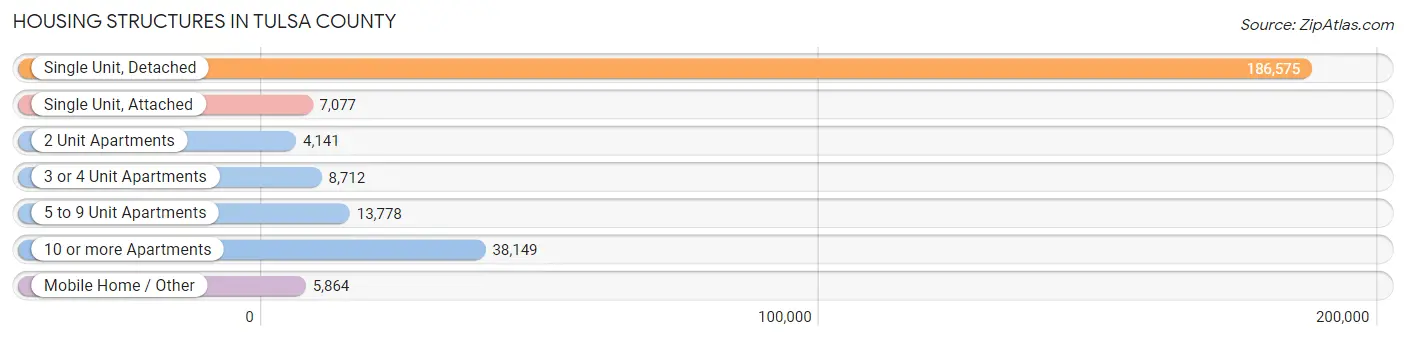
| Structure Type | # Housing Units | % Housing Units |
| Single Unit, Detached | 186,575 | 70.6% |
| Single Unit, Attached | 7,077 | 2.7% |
| 2 Unit Apartments | 4,141 | 1.6% |
| 3 or 4 Unit Apartments | 8,712 | 3.3% |
| 5 to 9 Unit Apartments | 13,778 | 5.2% |
| 10 or more Apartments | 38,149 | 14.4% |
| Mobile Home / Other | 5,864 | 2.2% |
| Total | 264,296 | 100.0% |
Housing Structures by Occupancy in Tulsa County
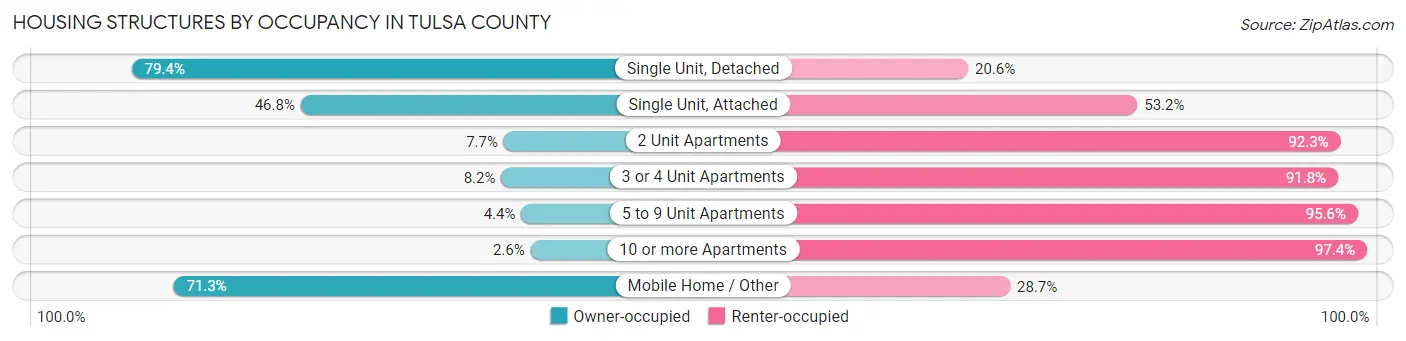
| Structure Type | Owner-occupied | Renter-occupied |
| Single Unit, Detached | 148,155 (79.4%) | 38,420 (20.6%) |
| Single Unit, Attached | 3,314 (46.8%) | 3,763 (53.2%) |
| 2 Unit Apartments | 320 (7.7%) | 3,821 (92.3%) |
| 3 or 4 Unit Apartments | 715 (8.2%) | 7,997 (91.8%) |
| 5 to 9 Unit Apartments | 602 (4.4%) | 13,176 (95.6%) |
| 10 or more Apartments | 988 (2.6%) | 37,161 (97.4%) |
| Mobile Home / Other | 4,183 (71.3%) | 1,681 (28.7%) |
| Total | 158,277 (59.9%) | 106,019 (40.1%) |
Housing Structures by Number of Rooms in Tulsa County
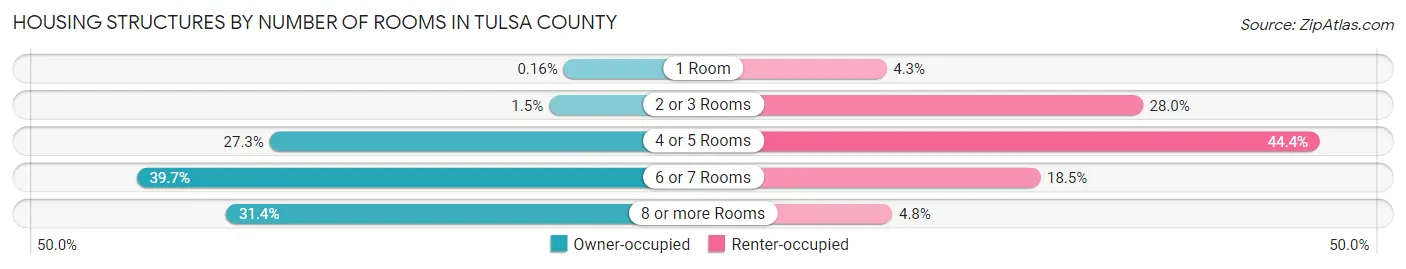
| Number of Rooms | Owner-occupied | Renter-occupied |
| 1 Room | 247 (0.2%) | 4,548 (4.3%) |
| 2 or 3 Rooms | 2,369 (1.5%) | 29,680 (28.0%) |
| 4 or 5 Rooms | 43,278 (27.3%) | 47,058 (44.4%) |
| 6 or 7 Rooms | 62,752 (39.7%) | 19,625 (18.5%) |
| 8 or more Rooms | 49,631 (31.4%) | 5,108 (4.8%) |
| Total | 158,277 (100.0%) | 106,019 (100.0%) |
Housing Structure by Heating Type in Tulsa County
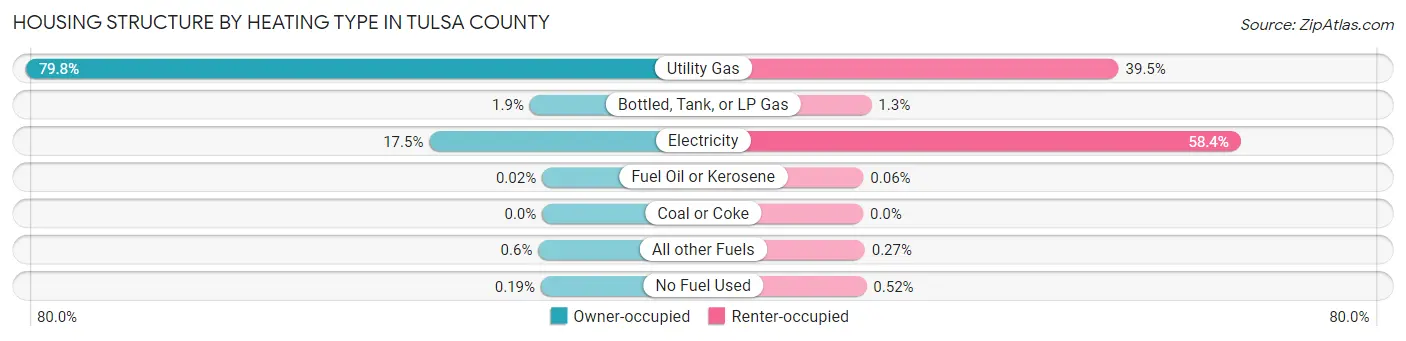
| Heating Type | Owner-occupied | Renter-occupied |
| Utility Gas | 126,341 (79.8%) | 41,891 (39.5%) |
| Bottled, Tank, or LP Gas | 3,022 (1.9%) | 1,366 (1.3%) |
| Electricity | 27,625 (17.4%) | 61,868 (58.4%) |
| Fuel Oil or Kerosene | 38 (0.0%) | 62 (0.1%) |
| Coal or Coke | 0 (0.0%) | 0 (0.0%) |
| All other Fuels | 956 (0.6%) | 284 (0.3%) |
| No Fuel Used | 295 (0.2%) | 548 (0.5%) |
| Total | 158,277 (100.0%) | 106,019 (100.0%) |
Household Vehicle Usage in Tulsa County
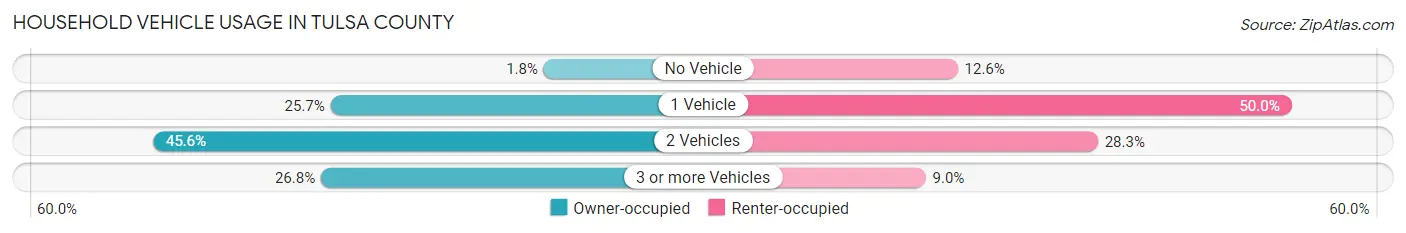
| Vehicles per Household | Owner-occupied | Renter-occupied |
| No Vehicle | 2,913 (1.8%) | 13,381 (12.6%) |
| 1 Vehicle | 40,703 (25.7%) | 53,027 (50.0%) |
| 2 Vehicles | 72,244 (45.6%) | 30,026 (28.3%) |
| 3 or more Vehicles | 42,417 (26.8%) | 9,585 (9.0%) |
| Total | 158,277 (100.0%) | 106,019 (100.0%) |
Real Estate & Mortgages in Tulsa County
Real Estate and Mortgage Overview in Tulsa County
| Characteristic | Without Mortgage | With Mortgage |
| Housing Units | 62,294 | 95,983 |
| Median Property Value | $174,800 | $207,800 |
| Median Household Income | $65,088 | $25,810 |
| Monthly Housing Costs | $548 | $7,934 |
| Real Estate Taxes | $1,813 | $2,781 |
Property Value by Mortgage Status in Tulsa County
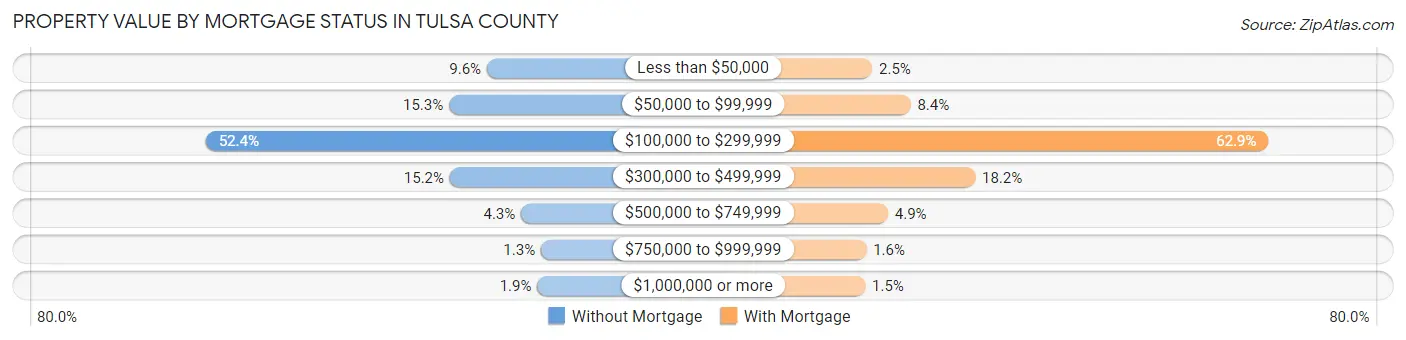
| Property Value | Without Mortgage | With Mortgage |
| Less than $50,000 | 5,952 (9.6%) | 2,416 (2.5%) |
| $50,000 to $99,999 | 9,541 (15.3%) | 8,036 (8.4%) |
| $100,000 to $299,999 | 32,638 (52.4%) | 60,371 (62.9%) |
| $300,000 to $499,999 | 9,471 (15.2%) | 17,476 (18.2%) |
| $500,000 to $749,999 | 2,706 (4.3%) | 4,725 (4.9%) |
| $750,000 to $999,999 | 816 (1.3%) | 1,557 (1.6%) |
| $1,000,000 or more | 1,170 (1.9%) | 1,402 (1.5%) |
| Total | 62,294 (100.0%) | 95,983 (100.0%) |
Household Income by Mortgage Status in Tulsa County
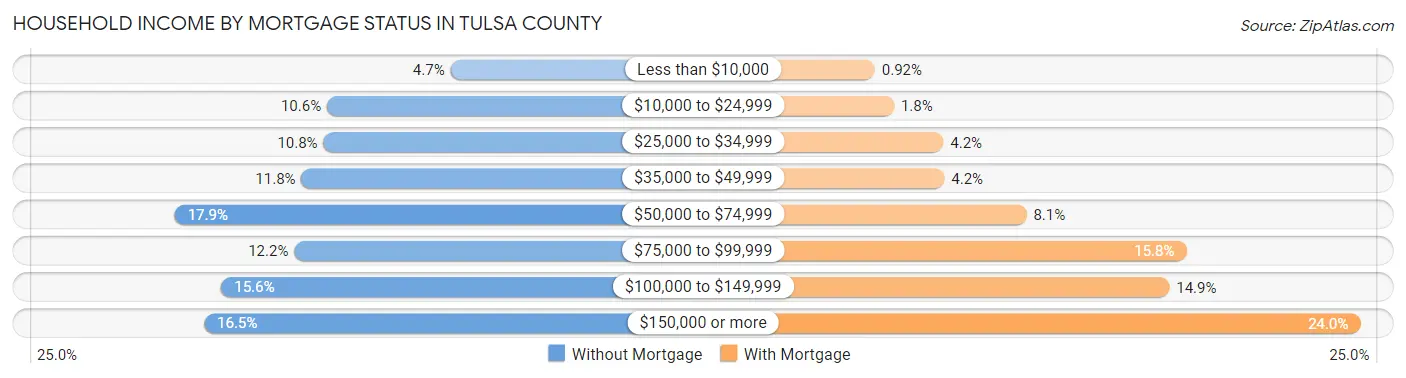
| Household Income | Without Mortgage | With Mortgage |
| Less than $10,000 | 2,940 (4.7%) | 884 (0.9%) |
| $10,000 to $24,999 | 6,605 (10.6%) | 1,758 (1.8%) |
| $25,000 to $34,999 | 6,710 (10.8%) | 4,013 (4.2%) |
| $35,000 to $49,999 | 7,366 (11.8%) | 4,059 (4.2%) |
| $50,000 to $74,999 | 11,121 (17.8%) | 7,816 (8.1%) |
| $75,000 to $99,999 | 7,572 (12.2%) | 15,120 (15.8%) |
| $100,000 to $149,999 | 9,734 (15.6%) | 14,343 (14.9%) |
| $150,000 or more | 10,246 (16.5%) | 23,064 (24.0%) |
| Total | 62,294 (100.0%) | 95,983 (100.0%) |
Property Value to Household Income Ratio in Tulsa County
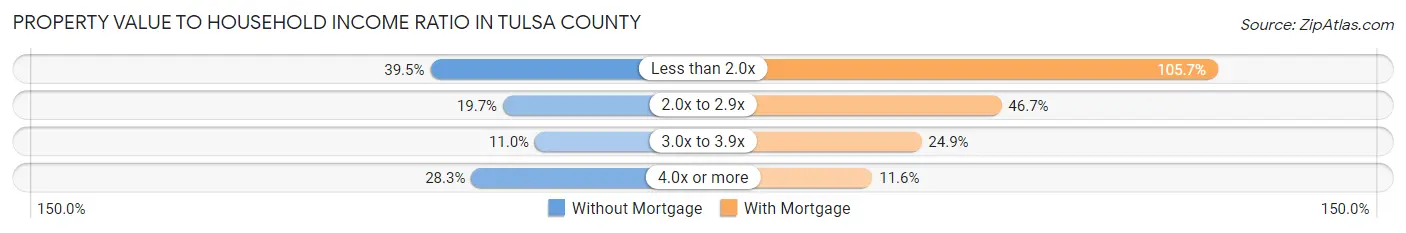
| Value-to-Income Ratio | Without Mortgage | With Mortgage |
| Less than 2.0x | 24,594 (39.5%) | 101,425 (105.7%) |
| 2.0x to 2.9x | 12,267 (19.7%) | 44,842 (46.7%) |
| 3.0x to 3.9x | 6,832 (11.0%) | 23,917 (24.9%) |
| 4.0x or more | 17,649 (28.3%) | 11,084 (11.6%) |
| Total | 62,294 (100.0%) | 95,983 (100.0%) |
Real Estate Taxes by Mortgage Status in Tulsa County
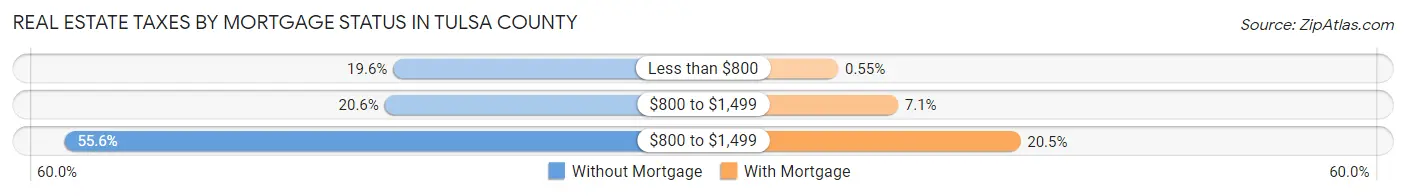
| Property Taxes | Without Mortgage | With Mortgage |
| Less than $800 | 12,218 (19.6%) | 527 (0.5%) |
| $800 to $1,499 | 12,802 (20.5%) | 6,819 (7.1%) |
| $800 to $1,499 | 34,657 (55.6%) | 19,700 (20.5%) |
| Total | 62,294 (100.0%) | 95,983 (100.0%) |
Health & Disability in Tulsa County
Health Insurance Coverage by Age in Tulsa County
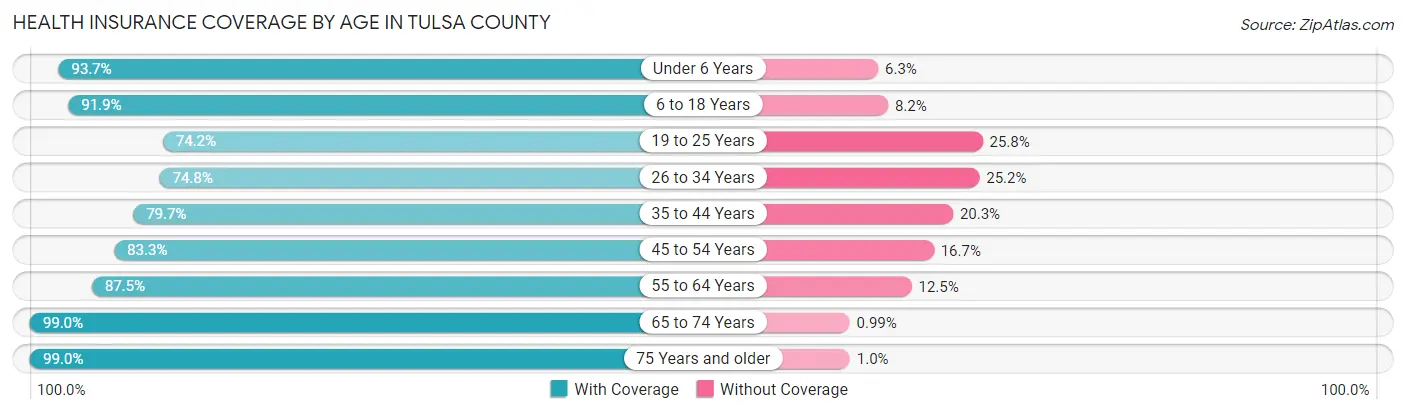
| Age Bracket | With Coverage | Without Coverage |
| Under 6 Years | 50,647 (93.7%) | 3,407 (6.3%) |
| 6 to 18 Years | 111,541 (91.8%) | 9,893 (8.2%) |
| 19 to 25 Years | 46,645 (74.2%) | 16,203 (25.8%) |
| 26 to 34 Years | 63,441 (74.8%) | 21,341 (25.2%) |
| 35 to 44 Years | 69,991 (79.7%) | 17,786 (20.3%) |
| 45 to 54 Years | 64,883 (83.3%) | 12,991 (16.7%) |
| 55 to 64 Years | 68,083 (87.5%) | 9,762 (12.5%) |
| 65 to 74 Years | 57,889 (99.0%) | 580 (1.0%) |
| 75 Years and older | 37,667 (99.0%) | 391 (1.0%) |
| Total | 570,787 (86.1%) | 92,354 (13.9%) |
Health Insurance Coverage by Citizenship Status in Tulsa County
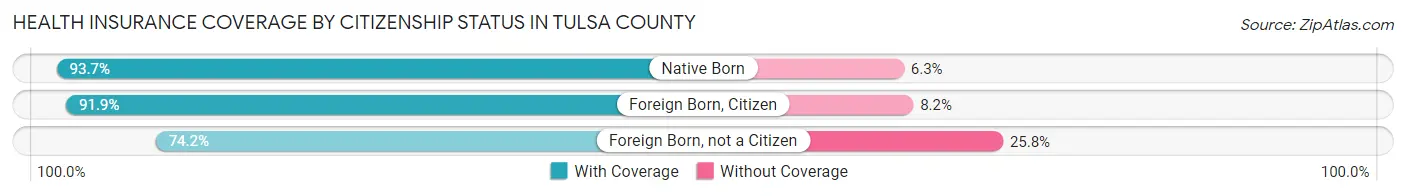
| Citizenship Status | With Coverage | Without Coverage |
| Native Born | 50,647 (93.7%) | 3,407 (6.3%) |
| Foreign Born, Citizen | 111,541 (91.8%) | 9,893 (8.2%) |
| Foreign Born, not a Citizen | 46,645 (74.2%) | 16,203 (25.8%) |
Health Insurance Coverage by Household Income in Tulsa County
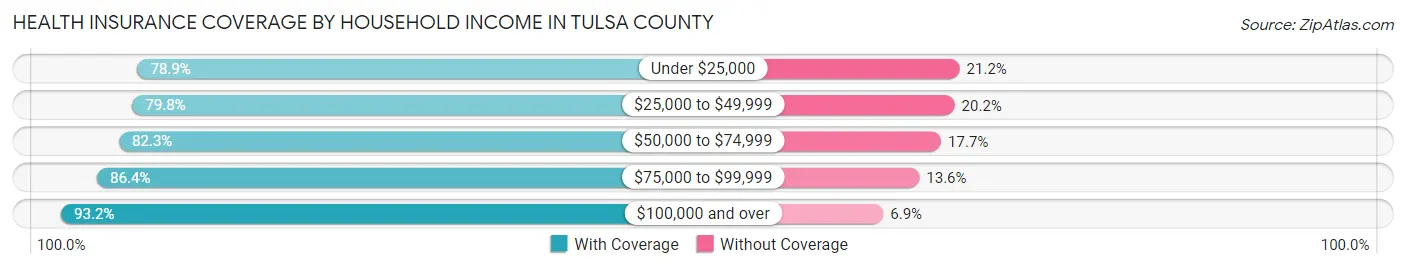
| Household Income | With Coverage | Without Coverage |
| Under $25,000 | 63,467 (78.8%) | 17,019 (21.1%) |
| $25,000 to $49,999 | 97,606 (79.8%) | 24,719 (20.2%) |
| $50,000 to $74,999 | 92,928 (82.3%) | 19,962 (17.7%) |
| $75,000 to $99,999 | 79,931 (86.4%) | 12,585 (13.6%) |
| $100,000 and over | 233,205 (93.1%) | 17,137 (6.9%) |
Public vs Private Health Insurance Coverage by Age in Tulsa County
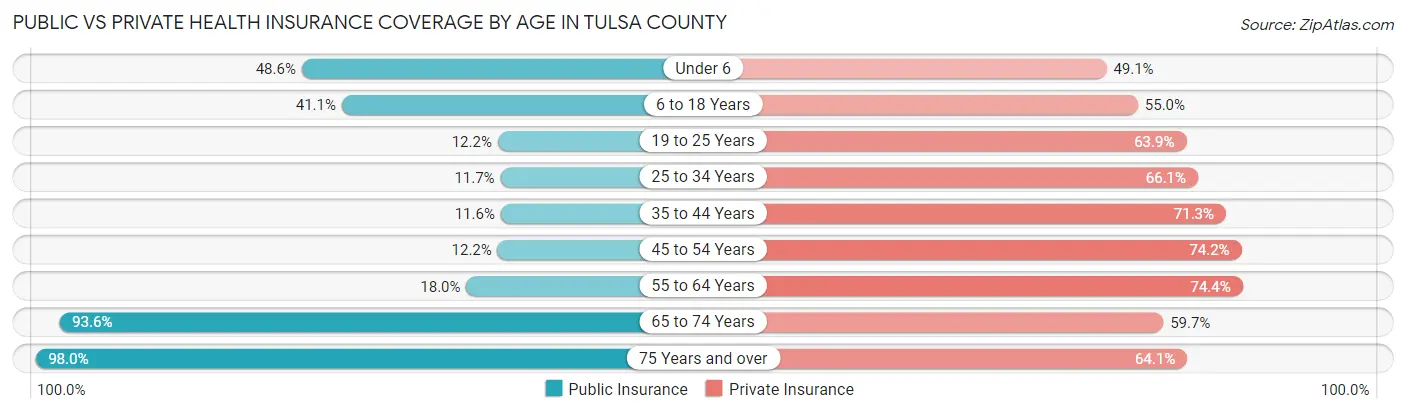
| Age Bracket | Public Insurance | Private Insurance |
| Under 6 | 26,246 (48.6%) | 26,552 (49.1%) |
| 6 to 18 Years | 49,948 (41.1%) | 66,734 (54.9%) |
| 19 to 25 Years | 7,657 (12.2%) | 40,177 (63.9%) |
| 25 to 34 Years | 9,901 (11.7%) | 56,025 (66.1%) |
| 35 to 44 Years | 10,204 (11.6%) | 62,570 (71.3%) |
| 45 to 54 Years | 9,504 (12.2%) | 57,761 (74.2%) |
| 55 to 64 Years | 14,013 (18.0%) | 57,905 (74.4%) |
| 65 to 74 Years | 54,715 (93.6%) | 34,883 (59.7%) |
| 75 Years and over | 37,304 (98.0%) | 24,394 (64.1%) |
| Total | 219,492 (33.1%) | 427,001 (64.4%) |
Disability Status by Sex by Age in Tulsa County
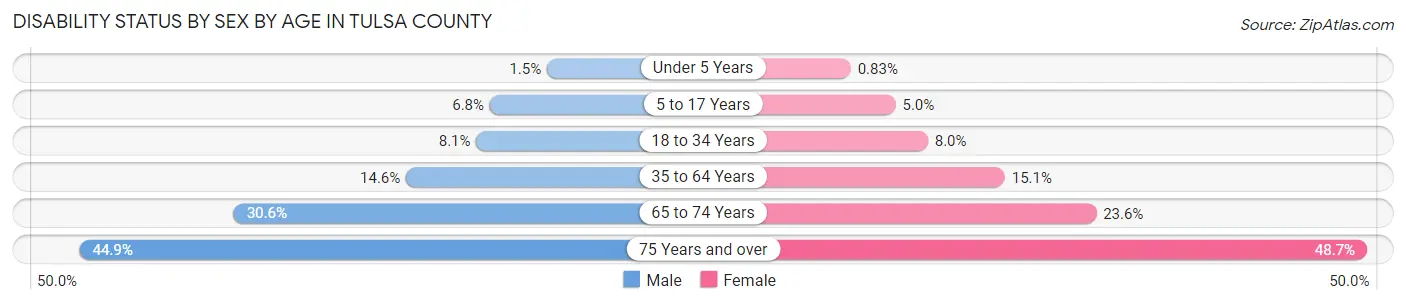
| Age Bracket | Male | Female |
| Under 5 Years | 352 (1.5%) | 180 (0.8%) |
| 5 to 17 Years | 4,237 (6.8%) | 2,963 (5.0%) |
| 18 to 34 Years | 6,289 (8.1%) | 6,278 (8.0%) |
| 35 to 64 Years | 17,530 (14.6%) | 18,653 (15.1%) |
| 65 to 74 Years | 8,222 (30.6%) | 7,460 (23.6%) |
| 75 Years and over | 6,854 (44.9%) | 11,107 (48.7%) |
Disability Class by Sex by Age in Tulsa County
Disability Class: Hearing Difficulty
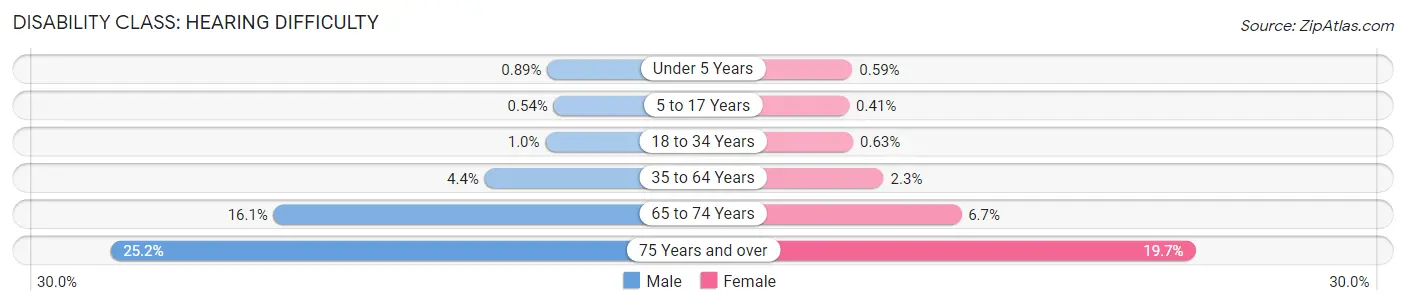
| Age Bracket | Male | Female |
| Under 5 Years | 207 (0.9%) | 128 (0.6%) |
| 5 to 17 Years | 337 (0.5%) | 242 (0.4%) |
| 18 to 34 Years | 781 (1.0%) | 498 (0.6%) |
| 35 to 64 Years | 5,266 (4.4%) | 2,874 (2.3%) |
| 65 to 74 Years | 4,336 (16.1%) | 2,100 (6.7%) |
| 75 Years and over | 3,851 (25.2%) | 4,488 (19.7%) |
Disability Class: Vision Difficulty
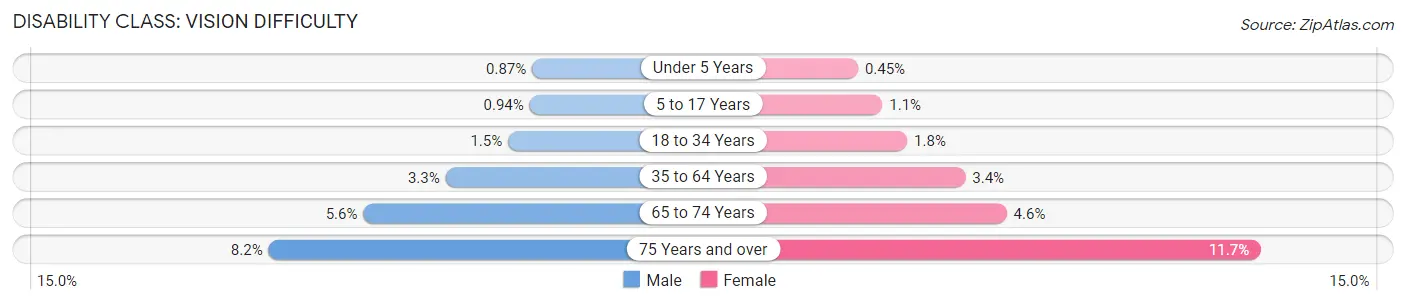
| Age Bracket | Male | Female |
| Under 5 Years | 203 (0.9%) | 98 (0.4%) |
| 5 to 17 Years | 586 (0.9%) | 671 (1.1%) |
| 18 to 34 Years | 1,198 (1.5%) | 1,433 (1.8%) |
| 35 to 64 Years | 3,938 (3.3%) | 4,243 (3.4%) |
| 65 to 74 Years | 1,498 (5.6%) | 1,449 (4.6%) |
| 75 Years and over | 1,253 (8.2%) | 2,661 (11.7%) |
Disability Class: Cognitive Difficulty
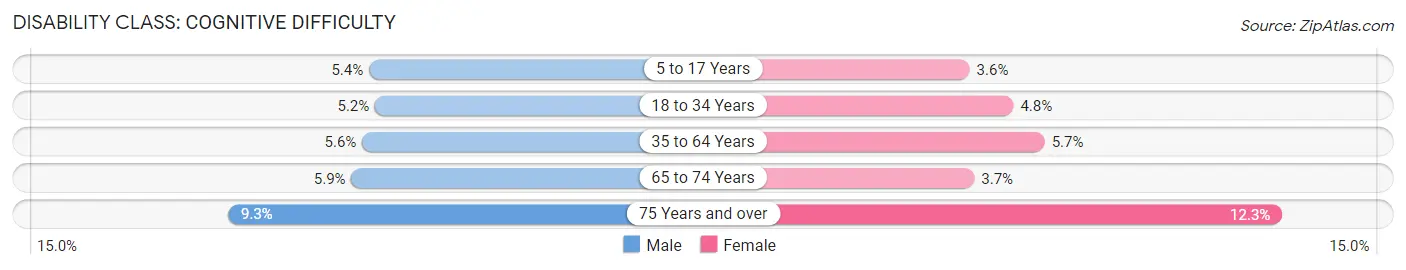
| Age Bracket | Male | Female |
| 5 to 17 Years | 3,362 (5.4%) | 2,114 (3.6%) |
| 18 to 34 Years | 4,083 (5.2%) | 3,755 (4.8%) |
| 35 to 64 Years | 6,733 (5.6%) | 6,966 (5.7%) |
| 65 to 74 Years | 1,586 (5.9%) | 1,165 (3.7%) |
| 75 Years and over | 1,426 (9.3%) | 2,794 (12.3%) |
Disability Class: Ambulatory Difficulty
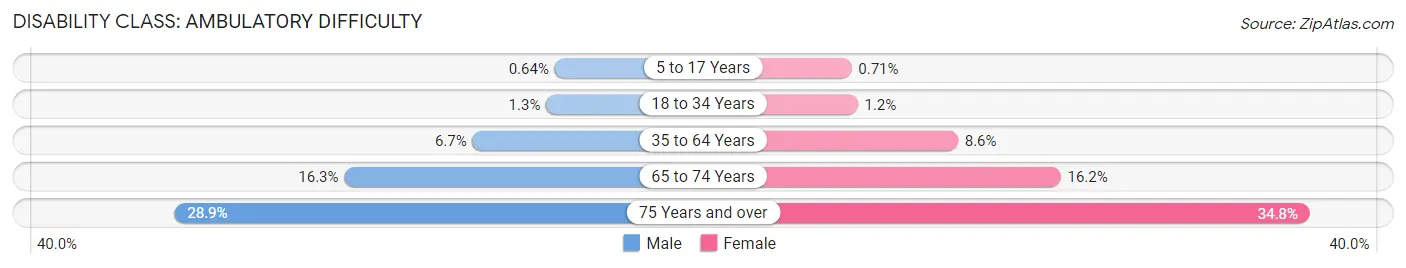
| Age Bracket | Male | Female |
| 5 to 17 Years | 399 (0.6%) | 419 (0.7%) |
| 18 to 34 Years | 991 (1.3%) | 918 (1.2%) |
| 35 to 64 Years | 8,101 (6.7%) | 10,618 (8.6%) |
| 65 to 74 Years | 4,371 (16.3%) | 5,131 (16.2%) |
| 75 Years and over | 4,408 (28.9%) | 7,921 (34.7%) |
Disability Class: Self-Care Difficulty
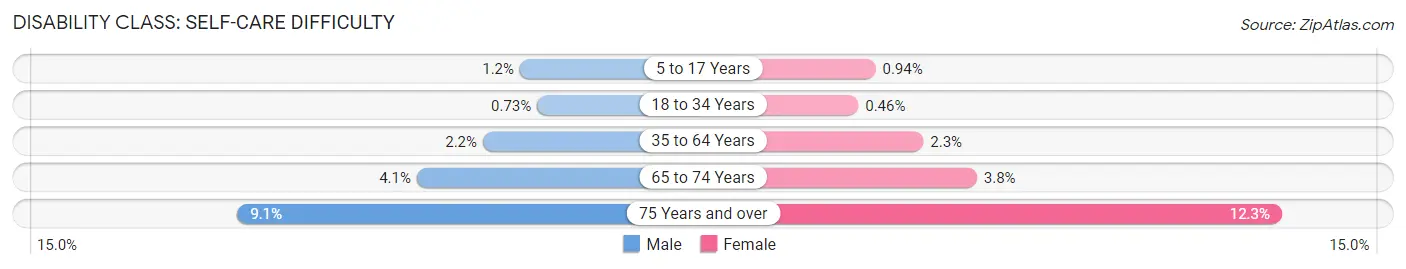
| Age Bracket | Male | Female |
| 5 to 17 Years | 753 (1.2%) | 555 (0.9%) |
| 18 to 34 Years | 568 (0.7%) | 365 (0.5%) |
| 35 to 64 Years | 2,686 (2.2%) | 2,805 (2.3%) |
| 65 to 74 Years | 1,096 (4.1%) | 1,189 (3.8%) |
| 75 Years and over | 1,386 (9.1%) | 2,793 (12.2%) |
Technology Access in Tulsa County
Computing Device Access in Tulsa County
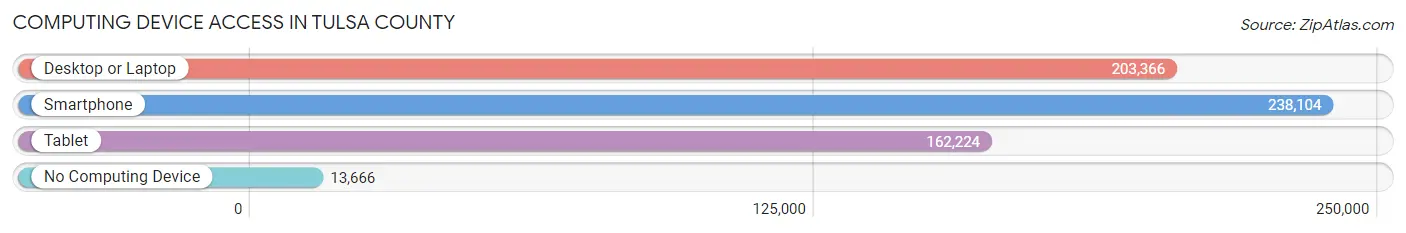
| Device Type | # Households | % Households |
| Desktop or Laptop | 203,366 | 76.9% |
| Smartphone | 238,104 | 90.1% |
| Tablet | 162,224 | 61.4% |
| No Computing Device | 13,666 | 5.2% |
| Total | 264,296 | 100.0% |
Internet Access in Tulsa County
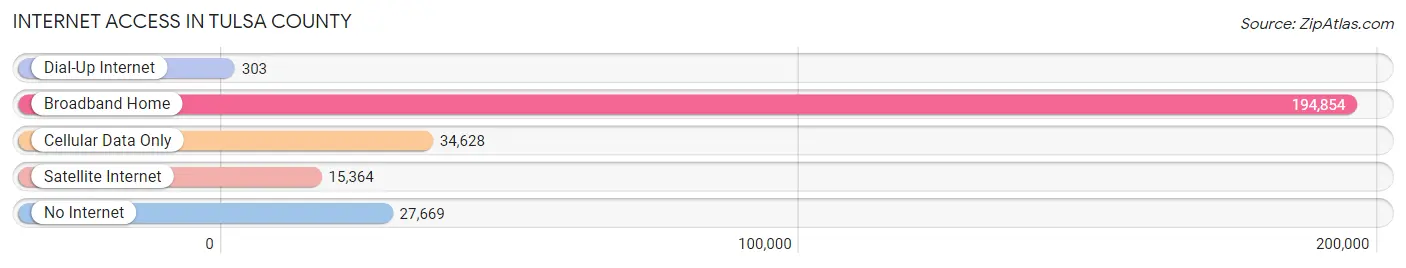
| Internet Type | # Households | % Households |
| Dial-Up Internet | 303 | 0.1% |
| Broadband Home | 194,854 | 73.7% |
| Cellular Data Only | 34,628 | 13.1% |
| Satellite Internet | 15,364 | 5.8% |
| No Internet | 27,669 | 10.5% |
| Total | 264,296 | 100.0% |
Tulsa County Summary
Tulsa County is located in the northeastern part of Oklahoma and is the second most populous county in the state. It is bordered by Creek, Osage, Rogers, Wagoner, and Washington counties. The county seat is Tulsa, the second largest city in the state. The county was established in 1907 and named after the city of Tulsa.
Geography
Tulsa County covers an area of 1,077 square miles and is located in the Green Country region of Oklahoma. The county is mostly flat with some rolling hills in the east. The Arkansas River forms the northern border of the county and the Verdigris River forms the eastern border. The county is drained by the Cimarron River and its tributaries. The climate is humid subtropical with hot summers and mild winters.
Economy
Tulsa County has a diverse economy with a mix of manufacturing, services, and retail. The county is home to several major employers, including American Airlines, BOK Financial, and Williams Companies. The county is also home to several major oil and gas companies, including ConocoPhillips, Devon Energy, and ONEOK. The county is also home to several universities, including the University of Tulsa, Oral Roberts University, and Tulsa Community College.
Demographics
As of the 2010 census, Tulsa County had a population of 603,403. The population was 54.3% White, 16.2% Black or African American, 8.2% Native American, 3.2% Asian, 0.2% Pacific Islander, and 17.1% from other races. The median household income was $45,837 and the median family income was $54,837. The per capita income was $25,837.
Conclusion
Tulsa County is a diverse county located in northeastern Oklahoma. It has a diverse economy with a mix of manufacturing, services, and retail. The county is home to several major employers and universities. The population is diverse and the median household income is above the national average. Tulsa County is an important part of the state of Oklahoma and is a great place to live and work.
Common Questions
What is the Total Population of Tulsa County?
Total Population of Tulsa County is 668,923.
What is the Total Male Population of Tulsa County?
Total Male Population of Tulsa County is 328,785.
What is the Total Female Population of Tulsa County?
Total Female Population of Tulsa County is 340,138.
What is the Ratio of Males per 100 Females in Tulsa County?
There are 96.66 Males per 100 Females in Tulsa County.
What is the Ratio of Females per 100 Males in Tulsa County?
There are 103.45 Females per 100 Males in Tulsa County.
What is the Median Population Age in Tulsa County?
Median Population Age in Tulsa County is 36.0 Years.
What is the Average Family Size in Tulsa County
Average Family Size in Tulsa County is 3.2 People.
What is the Average Household Size in Tulsa County
Average Household Size in Tulsa County is 2.5 People.
What is Per Capita Income in Tulsa County?
Per Capita income in Tulsa County is $38,496.
What is the Median Family Income in Tulsa County?
Median Family Income in Tulsa County is $84,573.
What is the Median Household income in Tulsa County?
Median Household Income in Tulsa County is $65,229.
What is Income or Wage Gap in Tulsa County?
Income or Wage Gap in Tulsa County is 27.9%.
Women in Tulsa County earn 72.1 cents for every dollar earned by a man.
What is Family Income Deficit in Tulsa County?
Family Income Deficit in Tulsa County is $11,582.
Families that are below poverty line in Tulsa County earn $11,582 less on average than the poverty threshold level.
What is Inequality or Gini Index in Tulsa County?
Inequality or Gini Index in Tulsa County is 0.49.
How Large is the Labor Force in Tulsa County?
There are 342,647 People in the Labor Forcein in Tulsa County.
What is the Percentage of People in the Labor Force in Tulsa County?
65.8% of People are in the Labor Force in Tulsa County.
What is the Unemployment Rate in Tulsa County?
Unemployment Rate in Tulsa County is 5.3%.