Sequoyah County, OK
Sequoyah County Map
Sequoyah County Overview
39,538
TOTAL POPULATION
19,621
MALE POPULATION
19,917
FEMALE POPULATION
98.51
MALES / 100 FEMALES
101.51
FEMALES / 100 MALES
40.8
MEDIAN AGE
3.2
AVG FAMILY SIZE
2.6
AVG HOUSEHOLD SIZE
$24,708
PER CAPITA INCOME
$60,823
AVG FAMILY INCOME
$47,494
AVG HOUSEHOLD INCOME
34.6%
WAGE / INCOME GAP [ % ]
65.4¢/ $1
WAGE / INCOME GAP [ $ ]
$11,044
FAMILY INCOME DEFICIT
0.45
INEQUALITY / GINI INDEX
16,187
LABOR FORCE [ PEOPLE ]
51.7%
PERCENT IN LABOR FORCE
5.2%
UNEMPLOYMENT RATE
Sequoyah County Area Codes
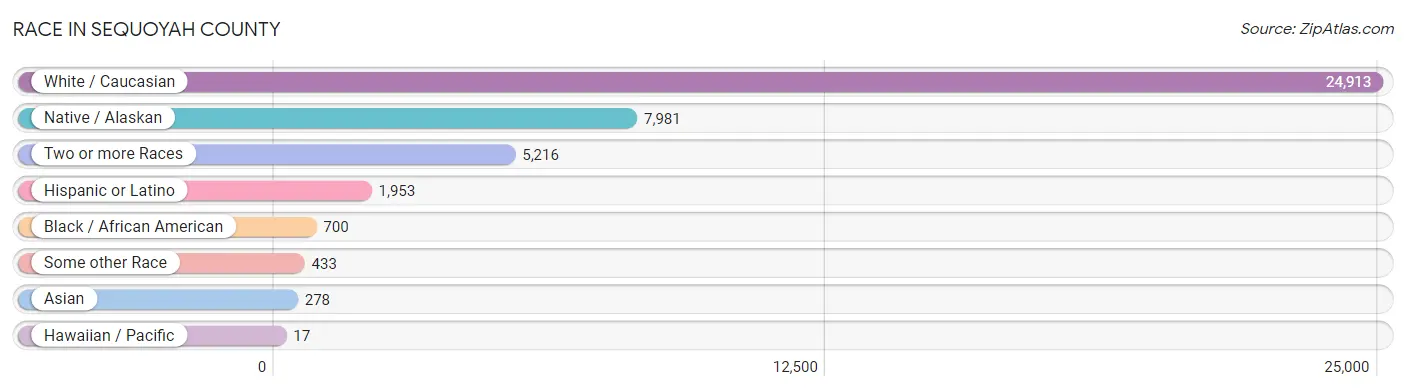
Race in Sequoyah County
The most populous races in Sequoyah County are White / Caucasian (24,913 | 63.0%), Native / Alaskan (7,981 | 20.2%), and Two or more Races (5,216 | 13.2%).
| Race | # Population | % Population |
| Asian | 278 | 0.7% |
| Black / African American | 700 | 1.8% |
| Hawaiian / Pacific | 17 | 0.0% |
| Hispanic or Latino | 1,953 | 4.9% |
| Native / Alaskan | 7,981 | 20.2% |
| White / Caucasian | 24,913 | 63.0% |
| Two or more Races | 5,216 | 13.2% |
| Some other Race | 433 | 1.1% |
| Total | 39,538 | 100.0% |
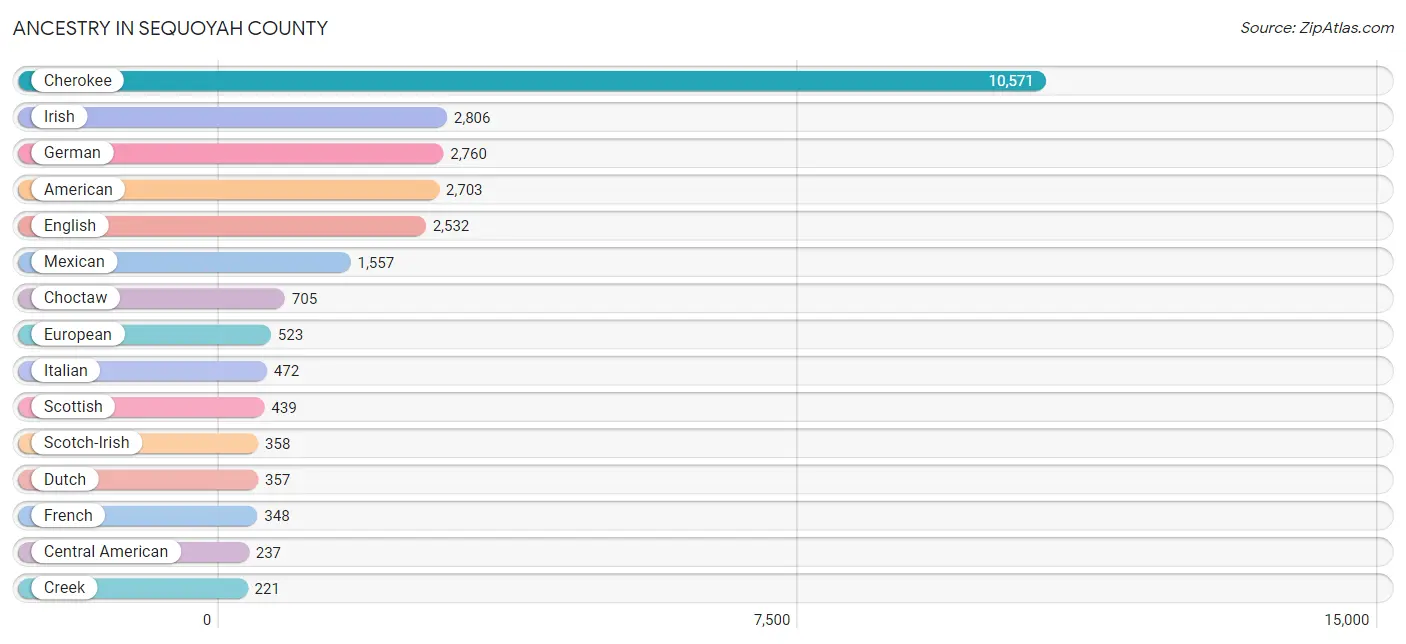
Ancestry in Sequoyah County
The most populous ancestries reported in Sequoyah County are Cherokee (10,571 | 26.7%), Irish (2,806 | 7.1%), German (2,760 | 7.0%), American (2,703 | 6.8%), and English (2,532 | 6.4%), together accounting for 54.1% of all Sequoyah County residents.
| Ancestry | # Population | % Population |
| African | 51 | 0.1% |
| Alaska Native | 41 | 0.1% |
| American | 2,703 | 6.8% |
| Apache | 103 | 0.3% |
| Arab | 29 | 0.1% |
| Austrian | 11 | 0.0% |
| Bangladeshi | 14 | 0.0% |
| Belgian | 3 | 0.0% |
| Bhutanese | 76 | 0.2% |
| Blackfeet | 70 | 0.2% |
| British | 38 | 0.1% |
| Bulgarian | 19 | 0.1% |
| Burmese | 28 | 0.1% |
| Canadian | 50 | 0.1% |
| Central American | 237 | 0.6% |
| Cherokee | 10,571 | 26.7% |
| Cheyenne | 7 | 0.0% |
| Chickasaw | 136 | 0.3% |
| Chippewa | 11 | 0.0% |
| Choctaw | 705 | 1.8% |
| Comanche | 10 | 0.0% |
| Creek | 221 | 0.6% |
| Croatian | 13 | 0.0% |
| Czech | 44 | 0.1% |
| Danish | 15 | 0.0% |
| Delaware | 32 | 0.1% |
| Dominican | 56 | 0.1% |
| Dutch | 357 | 0.9% |
| Dutch West Indian | 138 | 0.4% |
| Eastern European | 28 | 0.1% |
| English | 2,532 | 6.4% |
| European | 523 | 1.3% |
| Finnish | 8 | 0.0% |
| French | 348 | 0.9% |
| French Canadian | 87 | 0.2% |
| German | 2,760 | 7.0% |
| Greek | 20 | 0.1% |
| Guamanian / Chamorro | 6 | 0.0% |
| Guatemalan | 148 | 0.4% |
| Honduran | 2 | 0.0% |
| Hungarian | 33 | 0.1% |
| Indian (Asian) | 24 | 0.1% |
| Iranian | 6 | 0.0% |
| Irish | 2,806 | 7.1% |
| Iroquois | 30 | 0.1% |
| Italian | 472 | 1.2% |
| Kiowa | 27 | 0.1% |
| Korean | 124 | 0.3% |
| Lebanese | 7 | 0.0% |
| Lithuanian | 7 | 0.0% |
| Mexican | 1,557 | 3.9% |
| Native Hawaiian | 46 | 0.1% |
| Navajo | 21 | 0.1% |
| Northern European | 52 | 0.1% |
| Norwegian | 136 | 0.3% |
| Osage | 2 | 0.0% |
| Pakistani | 114 | 0.3% |
| Peruvian | 23 | 0.1% |
| Polish | 114 | 0.3% |
| Portuguese | 11 | 0.0% |
| Potawatomi | 44 | 0.1% |
| Puerto Rican | 78 | 0.2% |
| Russian | 25 | 0.1% |
| Salvadoran | 87 | 0.2% |
| Samoan | 10 | 0.0% |
| Scandinavian | 13 | 0.0% |
| Scotch-Irish | 358 | 0.9% |
| Scottish | 439 | 1.1% |
| Seminole | 5 | 0.0% |
| Shoshone | 34 | 0.1% |
| Sioux | 50 | 0.1% |
| Slovene | 11 | 0.0% |
| South American | 23 | 0.1% |
| Spanish | 2 | 0.0% |
| Sri Lankan | 26 | 0.1% |
| Subsaharan African | 51 | 0.1% |
| Swedish | 146 | 0.4% |
| Swiss | 13 | 0.0% |
| Syrian | 3 | 0.0% |
| Thai | 27 | 0.1% |
| Welsh | 118 | 0.3% |
| Yugoslavian | 18 | 0.1% | View All 82 Rows |
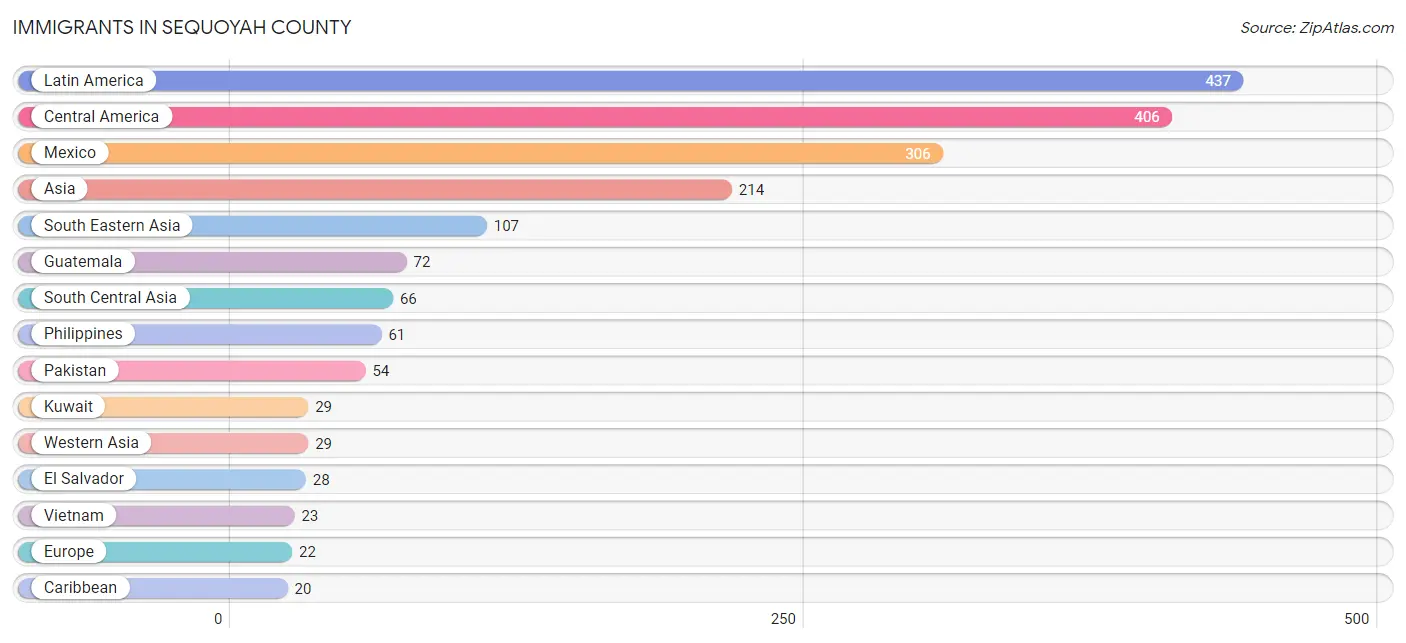
Immigrants in Sequoyah County
The most numerous immigrant groups reported in Sequoyah County came from Latin America (437 | 1.1%), Central America (406 | 1.0%), Mexico (306 | 0.8%), Asia (214 | 0.5%), and South Eastern Asia (107 | 0.3%), together accounting for 3.7% of all Sequoyah County residents.
| Immigration Origin | # Population | % Population |
| Asia | 214 | 0.5% |
| Caribbean | 20 | 0.1% |
| Central America | 406 | 1.0% |
| China | 7 | 0.0% |
| Dominican Republic | 20 | 0.1% |
| Eastern Asia | 12 | 0.0% |
| El Salvador | 28 | 0.1% |
| England | 7 | 0.0% |
| Europe | 22 | 0.1% |
| France | 3 | 0.0% |
| Germany | 12 | 0.0% |
| Guatemala | 72 | 0.2% |
| India | 6 | 0.0% |
| Iran | 6 | 0.0% |
| Korea | 5 | 0.0% |
| Kuwait | 29 | 0.1% |
| Laos | 12 | 0.0% |
| Latin America | 437 | 1.1% |
| Mexico | 306 | 0.8% |
| Northern Europe | 7 | 0.0% |
| Pakistan | 54 | 0.1% |
| Peru | 11 | 0.0% |
| Philippines | 61 | 0.2% |
| South America | 11 | 0.0% |
| South Central Asia | 66 | 0.2% |
| South Eastern Asia | 107 | 0.3% |
| Thailand | 11 | 0.0% |
| Vietnam | 23 | 0.1% |
| Western Asia | 29 | 0.1% |
| Western Europe | 15 | 0.0% | View All 30 Rows |
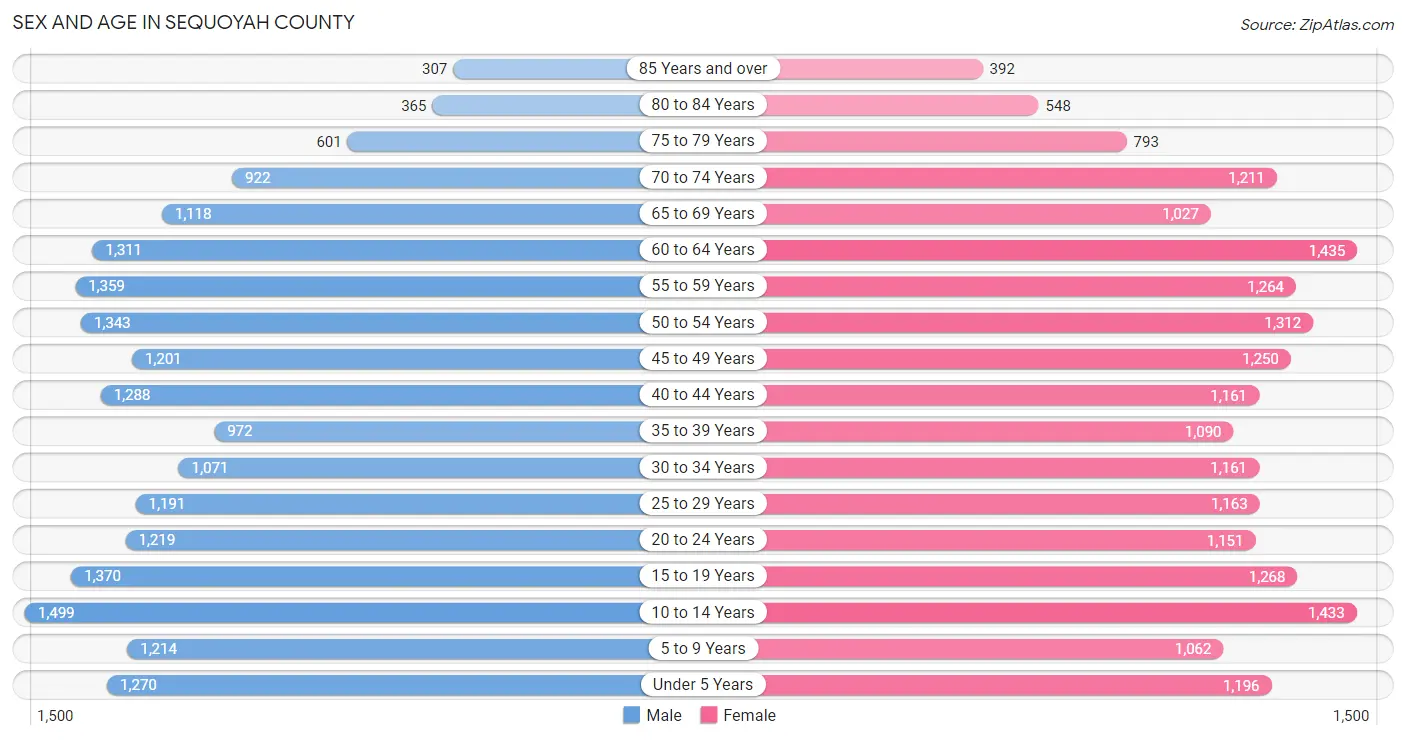
Sex and Age in Sequoyah County
Sex and Age in Sequoyah County
The most populous age groups in Sequoyah County are 10 to 14 Years (1,499 | 7.6%) for men and 60 to 64 Years (1,435 | 7.2%) for women.
| Age Bracket | Male | Female |
| Under 5 Years | 1,270 (6.5%) | 1,196 (6.0%) |
| 5 to 9 Years | 1,214 (6.2%) | 1,062 (5.3%) |
| 10 to 14 Years | 1,499 (7.6%) | 1,433 (7.2%) |
| 15 to 19 Years | 1,370 (7.0%) | 1,268 (6.4%) |
| 20 to 24 Years | 1,219 (6.2%) | 1,151 (5.8%) |
| 25 to 29 Years | 1,191 (6.1%) | 1,163 (5.8%) |
| 30 to 34 Years | 1,071 (5.5%) | 1,161 (5.8%) |
| 35 to 39 Years | 972 (5.0%) | 1,090 (5.5%) |
| 40 to 44 Years | 1,288 (6.6%) | 1,161 (5.8%) |
| 45 to 49 Years | 1,201 (6.1%) | 1,250 (6.3%) |
| 50 to 54 Years | 1,343 (6.8%) | 1,312 (6.6%) |
| 55 to 59 Years | 1,359 (6.9%) | 1,264 (6.4%) |
| 60 to 64 Years | 1,311 (6.7%) | 1,435 (7.2%) |
| 65 to 69 Years | 1,118 (5.7%) | 1,027 (5.2%) |
| 70 to 74 Years | 922 (4.7%) | 1,211 (6.1%) |
| 75 to 79 Years | 601 (3.1%) | 793 (4.0%) |
| 80 to 84 Years | 365 (1.9%) | 548 (2.8%) |
| 85 Years and over | 307 (1.6%) | 392 (2.0%) |
| Total | 19,621 (100.0%) | 19,917 (100.0%) |
Families and Households in Sequoyah County
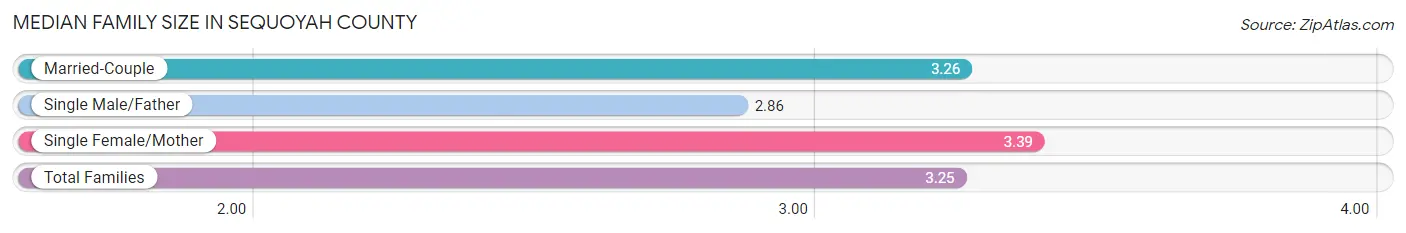
Median Family Size in Sequoyah County
The median family size in Sequoyah County is 3.25 persons per family, with single female/mother families (1,839 | 18.4%) accounting for the largest median family size of 3.39 persons per family. On the other hand, single male/father families (897 | 8.9%) represent the smallest median family size with 2.86 persons per family.
| Family Type | # Families | Family Size |
| Married-Couple | 7,281 (72.7%) | 3.26 |
| Single Male/Father | 897 (8.9%) | 2.86 |
| Single Female/Mother | 1,839 (18.4%) | 3.39 |
| Total Families | 10,017 (100.0%) | 3.25 |
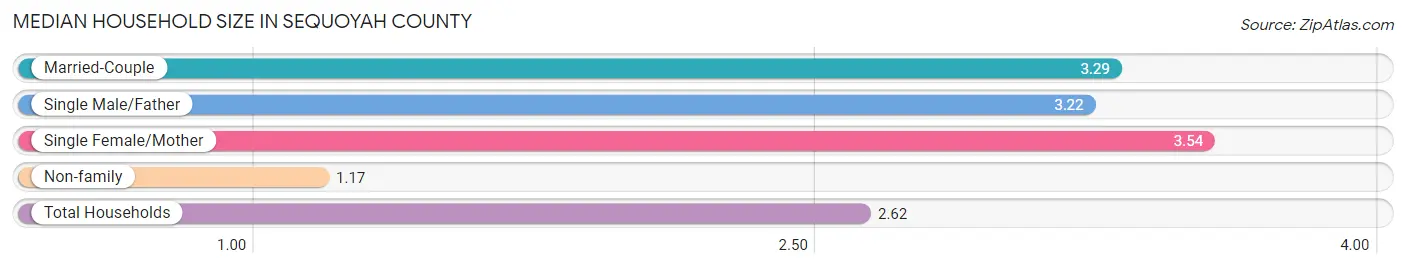
Median Household Size in Sequoyah County
The median household size in Sequoyah County is 2.62 persons per household, with single female/mother households (1,839 | 12.3%) accounting for the largest median household size of 3.54 persons per household. non-family households (4,943 | 33.0%) represent the smallest median household size with 1.17 persons per household.
| Household Type | # Households | Household Size |
| Married-Couple | 7,281 (48.7%) | 3.29 |
| Single Male/Father | 897 (6.0%) | 3.22 |
| Single Female/Mother | 1,839 (12.3%) | 3.54 |
| Non-family | 4,943 (33.0%) | 1.17 |
| Total Households | 14,960 (100.0%) | 2.62 |
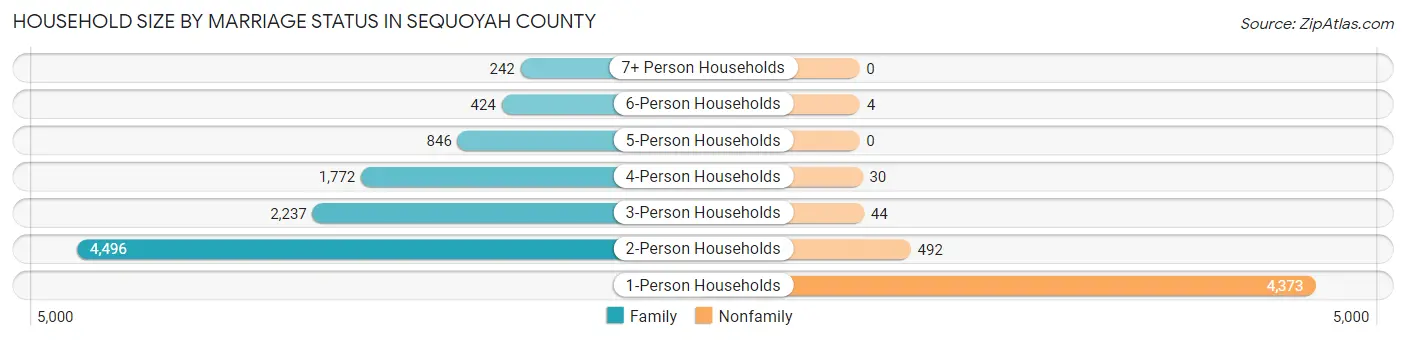
Household Size by Marriage Status in Sequoyah County
Out of a total of 14,960 households in Sequoyah County, 10,017 (67.0%) are family households, while 4,943 (33.0%) are nonfamily households. The most numerous type of family households are 2-person households, comprising 4,496, and the most common type of nonfamily households are 1-person households, comprising 4,373.
| Household Size | Family Households | Nonfamily Households |
| 1-Person Households | - | 4,373 (29.2%) |
| 2-Person Households | 4,496 (30.0%) | 492 (3.3%) |
| 3-Person Households | 2,237 (14.9%) | 44 (0.3%) |
| 4-Person Households | 1,772 (11.8%) | 30 (0.2%) |
| 5-Person Households | 846 (5.7%) | 0 (0.0%) |
| 6-Person Households | 424 (2.8%) | 4 (0.0%) |
| 7+ Person Households | 242 (1.6%) | 0 (0.0%) |
| Total | 10,017 (67.0%) | 4,943 (33.0%) |
Female Fertility in Sequoyah County
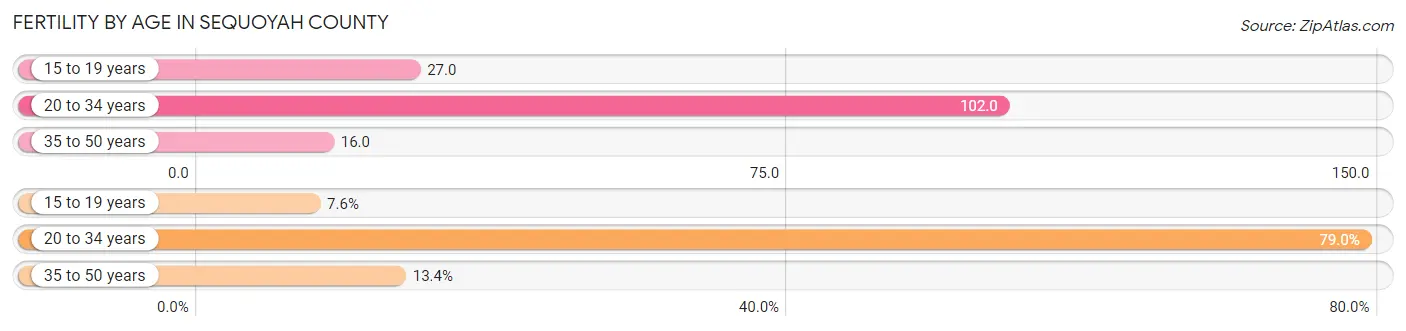
Fertility by Age in Sequoyah County
Average fertility rate in Sequoyah County is 53.0 births per 1,000 women. Women in the age bracket of 20 to 34 years have the highest fertility rate with 102.0 births per 1,000 women. Women in the age bracket of 20 to 34 years acount for 79.0% of all women with births.
| Age Bracket | Women with Births | Births / 1,000 Women |
| 15 to 19 years | 34 (7.6%) | 27.0 |
| 20 to 34 years | 353 (79.0%) | 102.0 |
| 35 to 50 years | 60 (13.4%) | 16.0 |
| Total | 447 (100.0%) | 53.0 |
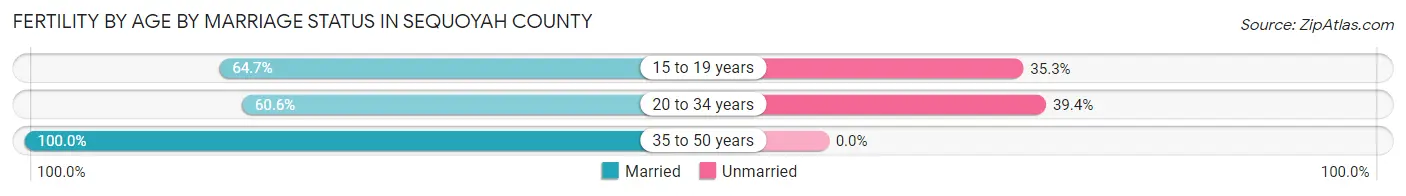
Fertility by Age by Marriage Status in Sequoyah County
66.2% of women with births (447) in Sequoyah County are married. The highest percentage of unmarried women with births falls into 20 to 34 years age bracket with 39.4% of them unmarried at the time of birth, while the lowest percentage of unmarried women with births belong to 35 to 50 years age bracket with 0.0% of them unmarried.
| Age Bracket | Married | Unmarried |
| 15 to 19 years | 22 (64.7%) | 12 (35.3%) |
| 20 to 34 years | 214 (60.6%) | 139 (39.4%) |
| 35 to 50 years | 60 (100.0%) | 0 (0.0%) |
| Total | 296 (66.2%) | 151 (33.8%) |
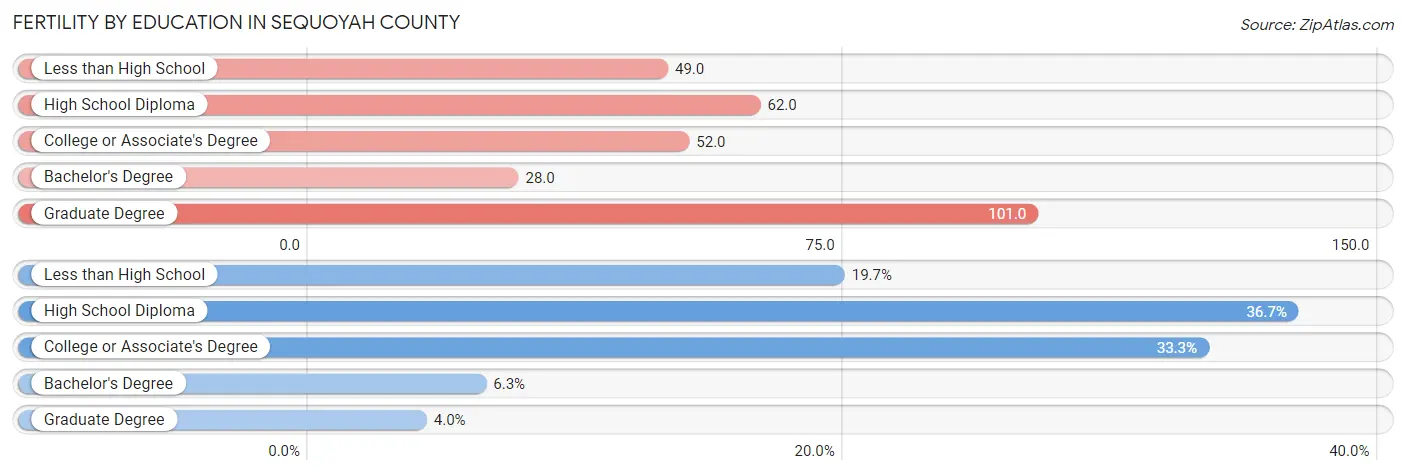
Fertility by Education in Sequoyah County
Average fertility rate in Sequoyah County is 53.0 births per 1,000 women. Women with the education attainment of graduate degree have the highest fertility rate of 101.0 births per 1,000 women, while women with the education attainment of bachelor's degree have the lowest fertility at 28.0 births per 1,000 women. Women with the education attainment of high school diploma represent 36.7% of all women with births.
| Educational Attainment | Women with Births | Births / 1,000 Women |
| Less than High School | 88 (19.7%) | 49.0 |
| High School Diploma | 164 (36.7%) | 62.0 |
| College or Associate's Degree | 149 (33.3%) | 52.0 |
| Bachelor's Degree | 28 (6.3%) | 28.0 |
| Graduate Degree | 18 (4.0%) | 101.0 |
| Total | 447 (100.0%) | 53.0 |
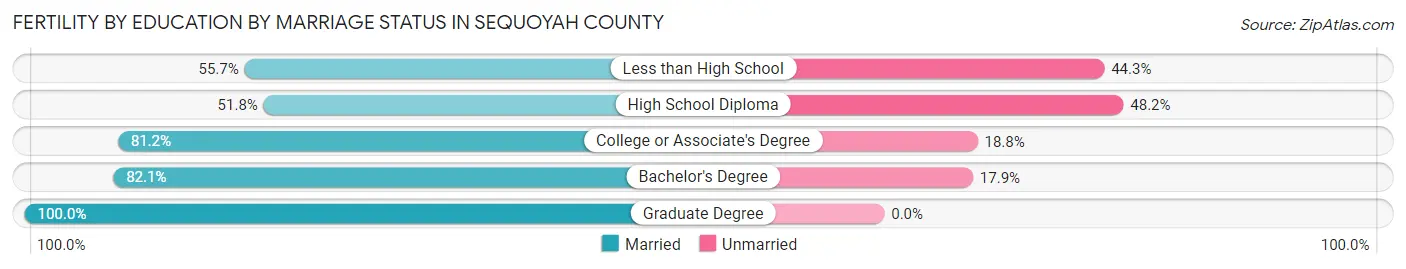
Fertility by Education by Marriage Status in Sequoyah County
33.8% of women with births in Sequoyah County are unmarried. Women with the educational attainment of graduate degree are most likely to be married with 100.0% of them married at childbirth, while women with the educational attainment of high school diploma are least likely to be married with 48.2% of them unmarried at childbirth.
| Educational Attainment | Married | Unmarried |
| Less than High School | 49 (55.7%) | 39 (44.3%) |
| High School Diploma | 85 (51.8%) | 79 (48.2%) |
| College or Associate's Degree | 121 (81.2%) | 28 (18.8%) |
| Bachelor's Degree | 23 (82.1%) | 5 (17.9%) |
| Graduate Degree | 18 (100.0%) | 0 (0.0%) |
| Total | 296 (66.2%) | 151 (33.8%) |
Income in Sequoyah County
Income Overview in Sequoyah County
Per Capita Income in Sequoyah County is $24,708, while median incomes of families and households are $60,823 and $47,494 respectively.
| Characteristic | Number | Measure |
| Per Capita Income | 39,538 | $24,708 |
| Median Family Income | 10,017 | $60,823 |
| Mean Family Income | 10,017 | $73,894 |
| Median Household Income | 14,960 | $47,494 |
| Mean Household Income | 14,960 | $62,304 |
| Income Deficit | 10,017 | $11,044 |
| Wage / Income Gap (%) | 39,538 | 34.64% |
| Wage / Income Gap ($) | 39,538 | 65.36¢ per $1 |
| Gini / Inequality Index | 39,538 | 0.45 |
Earnings by Sex in Sequoyah County
Average Earnings in Sequoyah County are $32,786, $39,171 for men and $25,601 for women, a difference of 34.6%.
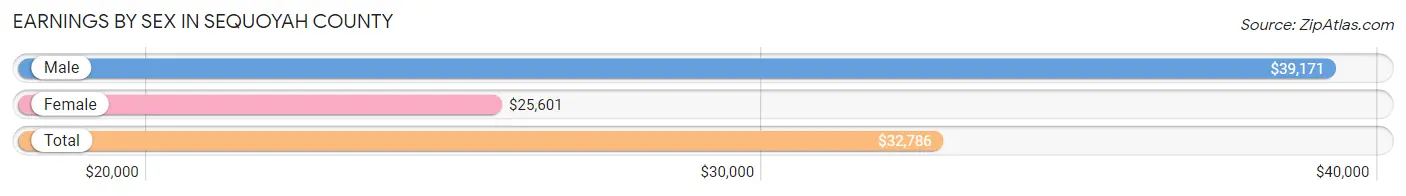
| Sex | Number | Average Earnings |
| Male | 8,742 (52.0%) | $39,171 |
| Female | 8,080 (48.0%) | $25,601 |
| Total | 16,822 (100.0%) | $32,786 |
Earnings by Sex by Income Bracket in Sequoyah County
The most common earnings brackets in Sequoyah County are $55,000 to $64,999 for men (775 | 8.9%) and $25,000 to $29,999 for women (608 | 7.5%).
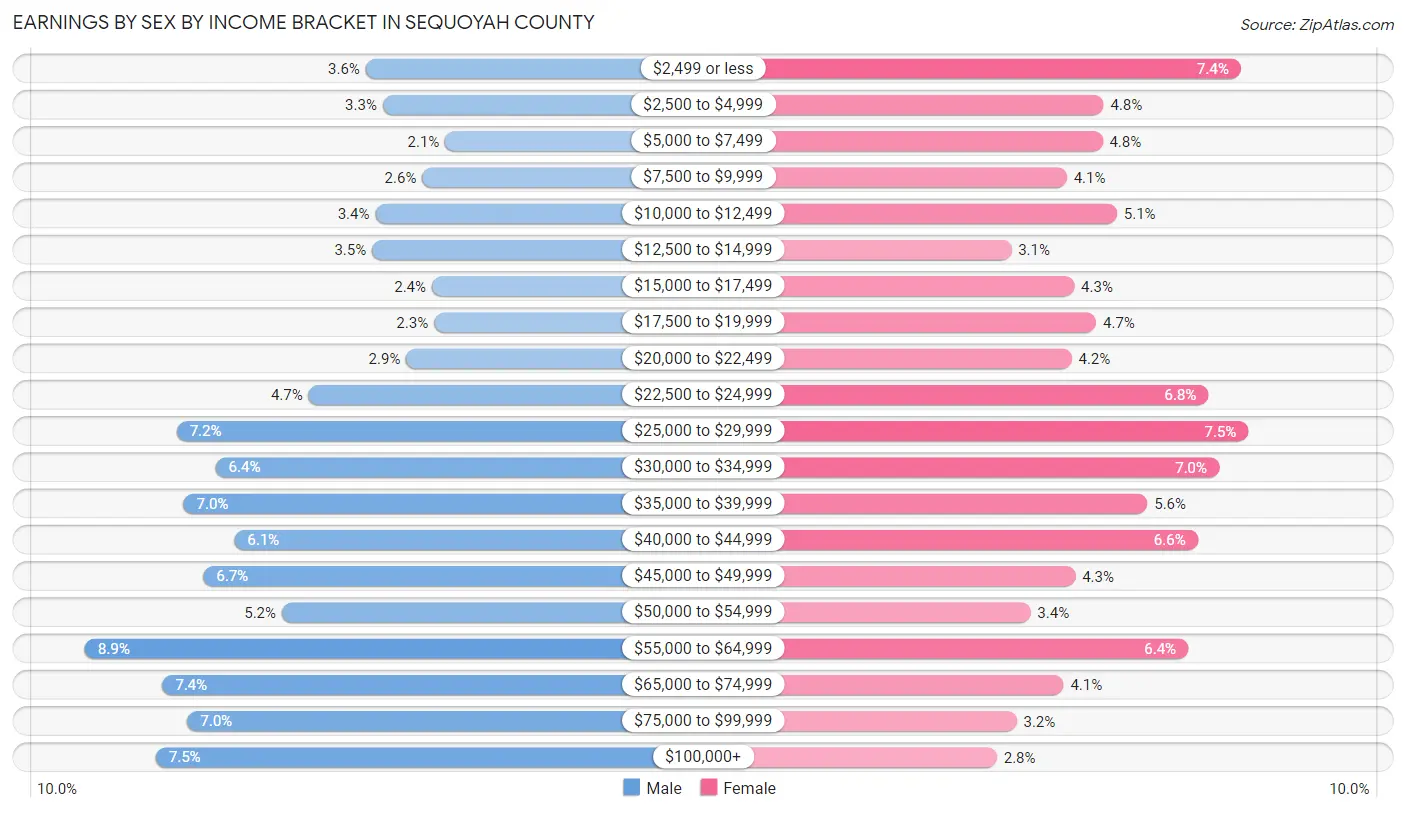
| Income | Male | Female |
| $2,499 or less | 316 (3.6%) | 596 (7.4%) |
| $2,500 to $4,999 | 288 (3.3%) | 389 (4.8%) |
| $5,000 to $7,499 | 185 (2.1%) | 387 (4.8%) |
| $7,500 to $9,999 | 223 (2.5%) | 333 (4.1%) |
| $10,000 to $12,499 | 300 (3.4%) | 409 (5.1%) |
| $12,500 to $14,999 | 305 (3.5%) | 249 (3.1%) |
| $15,000 to $17,499 | 207 (2.4%) | 344 (4.3%) |
| $17,500 to $19,999 | 204 (2.3%) | 377 (4.7%) |
| $20,000 to $22,499 | 249 (2.9%) | 340 (4.2%) |
| $22,500 to $24,999 | 409 (4.7%) | 547 (6.8%) |
| $25,000 to $29,999 | 625 (7.1%) | 608 (7.5%) |
| $30,000 to $34,999 | 561 (6.4%) | 563 (7.0%) |
| $35,000 to $39,999 | 614 (7.0%) | 455 (5.6%) |
| $40,000 to $44,999 | 531 (6.1%) | 531 (6.6%) |
| $45,000 to $49,999 | 581 (6.7%) | 346 (4.3%) |
| $50,000 to $54,999 | 453 (5.2%) | 278 (3.4%) |
| $55,000 to $64,999 | 775 (8.9%) | 516 (6.4%) |
| $65,000 to $74,999 | 649 (7.4%) | 328 (4.1%) |
| $75,000 to $99,999 | 608 (7.0%) | 257 (3.2%) |
| $100,000+ | 659 (7.5%) | 227 (2.8%) |
| Total | 8,742 (100.0%) | 8,080 (100.0%) |
Earnings by Sex by Educational Attainment in Sequoyah County
Average earnings in Sequoyah County are $43,699 for men and $29,586 for women, a difference of 32.3%. Men with an educational attainment of graduate degree enjoy the highest average annual earnings of $86,339, while those with less than high school education earn the least with $28,254. Women with an educational attainment of graduate degree earn the most with the average annual earnings of $58,839, while those with less than high school education have the smallest earnings of $18,527.
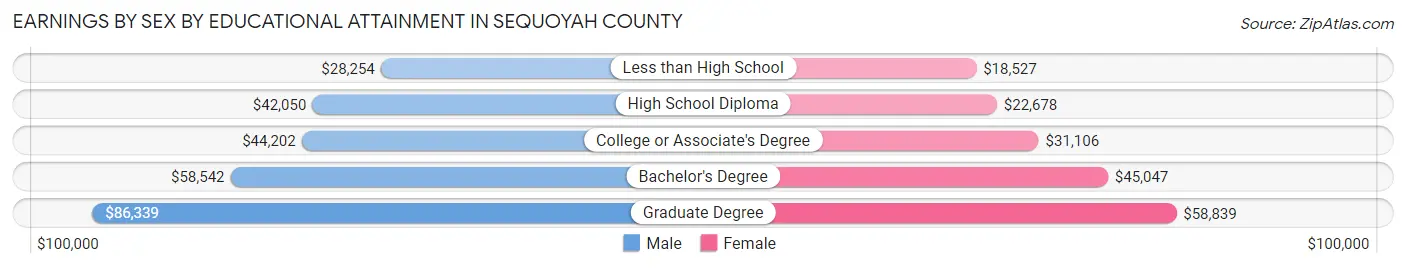
| Educational Attainment | Male Income | Female Income |
| Less than High School | $28,254 | $18,527 |
| High School Diploma | $42,050 | $22,678 |
| College or Associate's Degree | $44,202 | $31,106 |
| Bachelor's Degree | $58,542 | $45,047 |
| Graduate Degree | $86,339 | $58,839 |
| Total | $43,699 | $29,586 |
Family Income in Sequoyah County
Family Income Brackets in Sequoyah County
According to the Sequoyah County family income data, there are 2,164 families falling into the $50,000 to $74,999 income range, which is the most common income bracket and makes up 21.6% of all families. Conversely, the $200,000+ income bracket is the least frequent group with only 341 families (3.4%) belonging to this category.
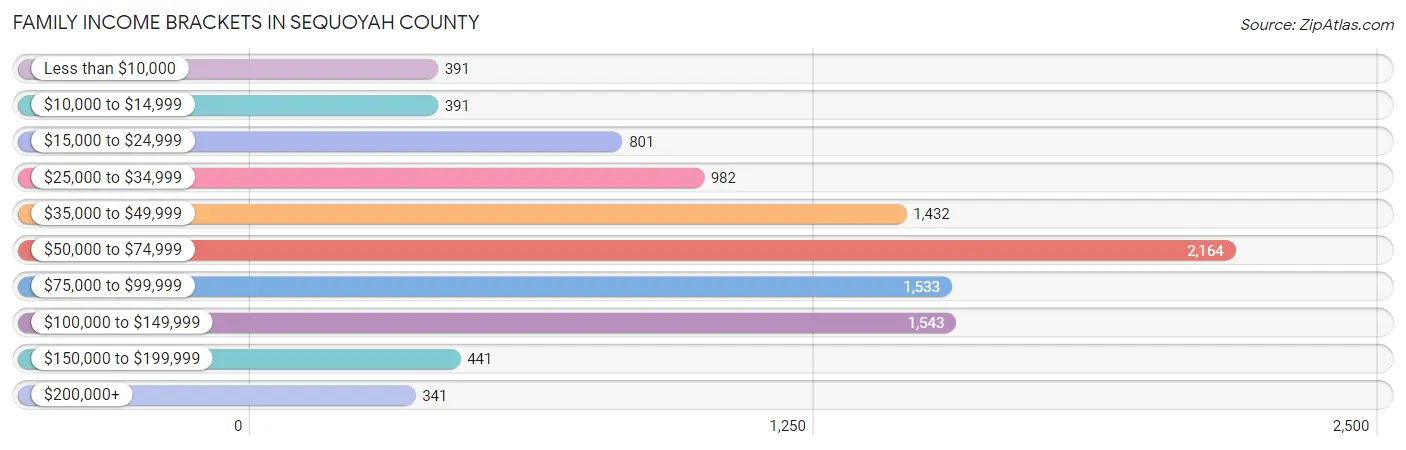
| Income Bracket | # Families | % Families |
| Less than $10,000 | 391 | 3.9% |
| $10,000 to $14,999 | 391 | 3.9% |
| $15,000 to $24,999 | 801 | 8.0% |
| $25,000 to $34,999 | 982 | 9.8% |
| $35,000 to $49,999 | 1,432 | 14.3% |
| $50,000 to $74,999 | 2,164 | 21.6% |
| $75,000 to $99,999 | 1,533 | 15.3% |
| $100,000 to $149,999 | 1,543 | 15.4% |
| $150,000 to $199,999 | 441 | 4.4% |
| $200,000+ | 341 | 3.4% |
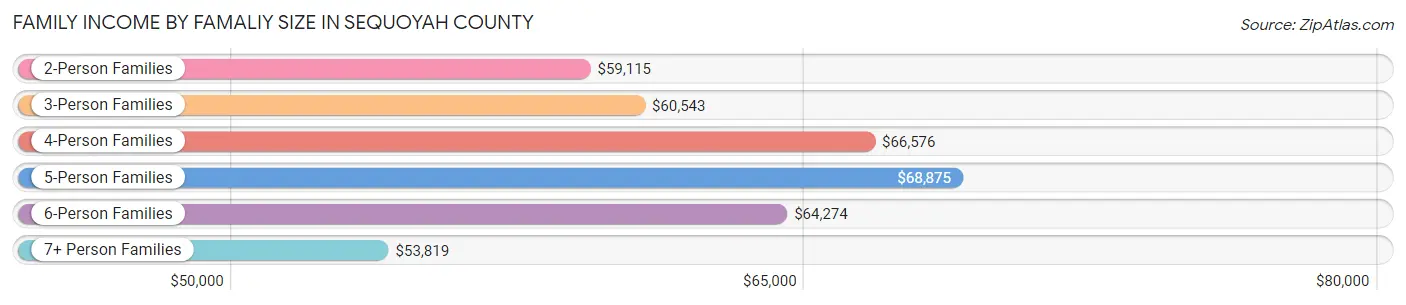
Family Income by Famaliy Size in Sequoyah County
5-person families (808 | 8.1%) account for the highest median family income in Sequoyah County with $68,875 per family, while 2-person families (4,721 | 47.1%) have the highest median income of $29,558 per family member.
| Income Bracket | # Families | Median Income |
| 2-Person Families | 4,721 (47.1%) | $59,115 |
| 3-Person Families | 2,212 (22.1%) | $60,543 |
| 4-Person Families | 1,681 (16.8%) | $66,576 |
| 5-Person Families | 808 (8.1%) | $68,875 |
| 6-Person Families | 404 (4.0%) | $64,274 |
| 7+ Person Families | 191 (1.9%) | $53,819 |
| Total | 10,017 (100.0%) | $60,823 |
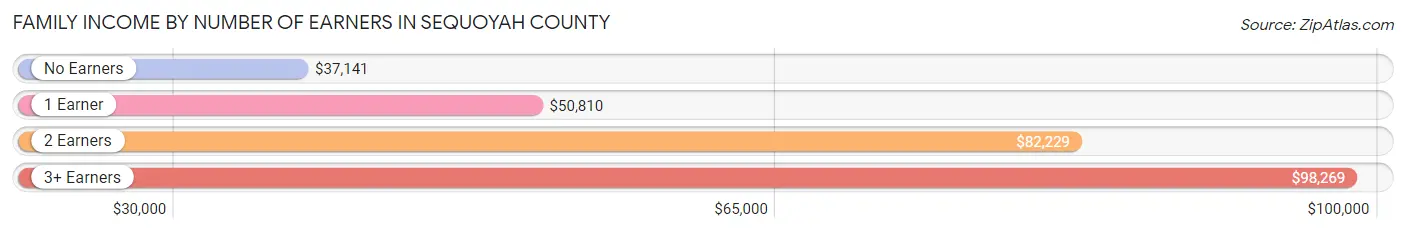
Family Income by Number of Earners in Sequoyah County
The median family income in Sequoyah County is $60,823, with families comprising 3+ earners (826) having the highest median family income of $98,269, while families with no earners (2,360) have the lowest median family income of $37,141, accounting for 8.3% and 23.6% of families, respectively.
| Number of Earners | # Families | Median Income |
| No Earners | 2,360 (23.6%) | $37,141 |
| 1 Earner | 3,428 (34.2%) | $50,810 |
| 2 Earners | 3,403 (34.0%) | $82,229 |
| 3+ Earners | 826 (8.3%) | $98,269 |
| Total | 10,017 (100.0%) | $60,823 |
Household Income in Sequoyah County
Household Income Brackets in Sequoyah County
With 2,798 households falling in the category, the $50,000 to $74,999 income range is the most frequent in Sequoyah County, accounting for 18.7% of all households. In contrast, only 404 households (2.7%) fall into the $200,000+ income bracket, making it the least populous group.

| Income Bracket | # Households | % Households |
| Less than $10,000 | 883 | 5.9% |
| $10,000 to $14,999 | 1,062 | 7.1% |
| $15,000 to $24,999 | 2,035 | 13.6% |
| $25,000 to $34,999 | 1,780 | 11.9% |
| $35,000 to $49,999 | 2,020 | 13.5% |
| $50,000 to $74,999 | 2,798 | 18.7% |
| $75,000 to $99,999 | 1,795 | 12.0% |
| $100,000 to $149,999 | 1,735 | 11.6% |
| $150,000 to $199,999 | 449 | 3.0% |
| $200,000+ | 404 | 2.7% |
Household Income by Householder Age in Sequoyah County
The median household income in Sequoyah County is $47,494, with the highest median household income of $57,303 found in the 25 to 44 years age bracket for the primary householder. A total of 3,965 households (26.5%) fall into this category. Meanwhile, the 65+ years age bracket for the primary householder has the lowest median household income of $33,995, with 4,580 households (30.6%) in this group.

| Income Bracket | # Households | Median Income |
| 15 to 24 Years | 512 (3.4%) | $34,764 |
| 25 to 44 Years | 3,965 (26.5%) | $57,303 |
| 45 to 64 Years | 5,903 (39.5%) | $56,067 |
| 65+ Years | 4,580 (30.6%) | $33,995 |
| Total | 14,960 (100.0%) | $47,494 |
Poverty in Sequoyah County
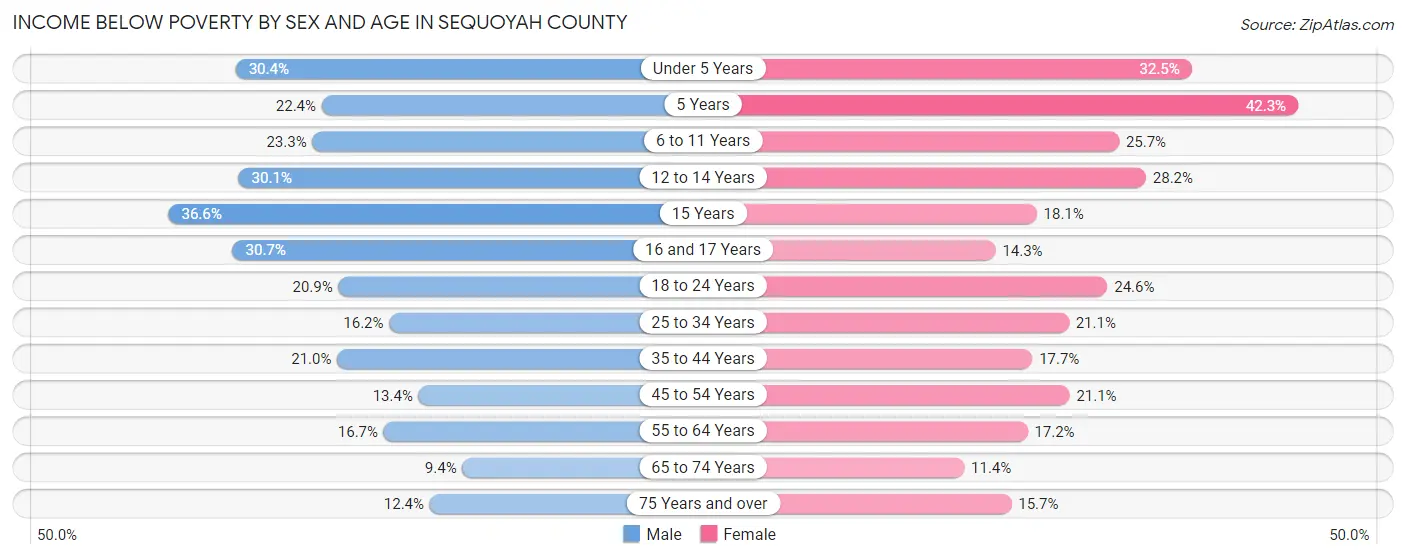
Income Below Poverty by Sex and Age in Sequoyah County
With 18.8% poverty level for males and 20.2% for females among the residents of Sequoyah County, 15 year old males and 5 year old females are the most vulnerable to poverty, with 107 males (36.6%) and 80 females (42.3%) in their respective age groups living below the poverty level.
| Age Bracket | Male | Female |
| Under 5 Years | 384 (30.4%) | 383 (32.5%) |
| 5 Years | 39 (22.4%) | 80 (42.3%) |
| 6 to 11 Years | 365 (23.3%) | 341 (25.7%) |
| 12 to 14 Years | 276 (30.1%) | 263 (28.2%) |
| 15 Years | 107 (36.6%) | 47 (18.1%) |
| 16 and 17 Years | 170 (30.7%) | 81 (14.3%) |
| 18 to 24 Years | 359 (20.9%) | 390 (24.6%) |
| 25 to 34 Years | 362 (16.2%) | 484 (21.1%) |
| 35 to 44 Years | 467 (21.0%) | 397 (17.7%) |
| 45 to 54 Years | 340 (13.4%) | 541 (21.1%) |
| 55 to 64 Years | 441 (16.7%) | 465 (17.2%) |
| 65 to 74 Years | 190 (9.4%) | 249 (11.4%) |
| 75 Years and over | 152 (12.4%) | 259 (15.7%) |
| Total | 3,652 (18.8%) | 3,980 (20.2%) |
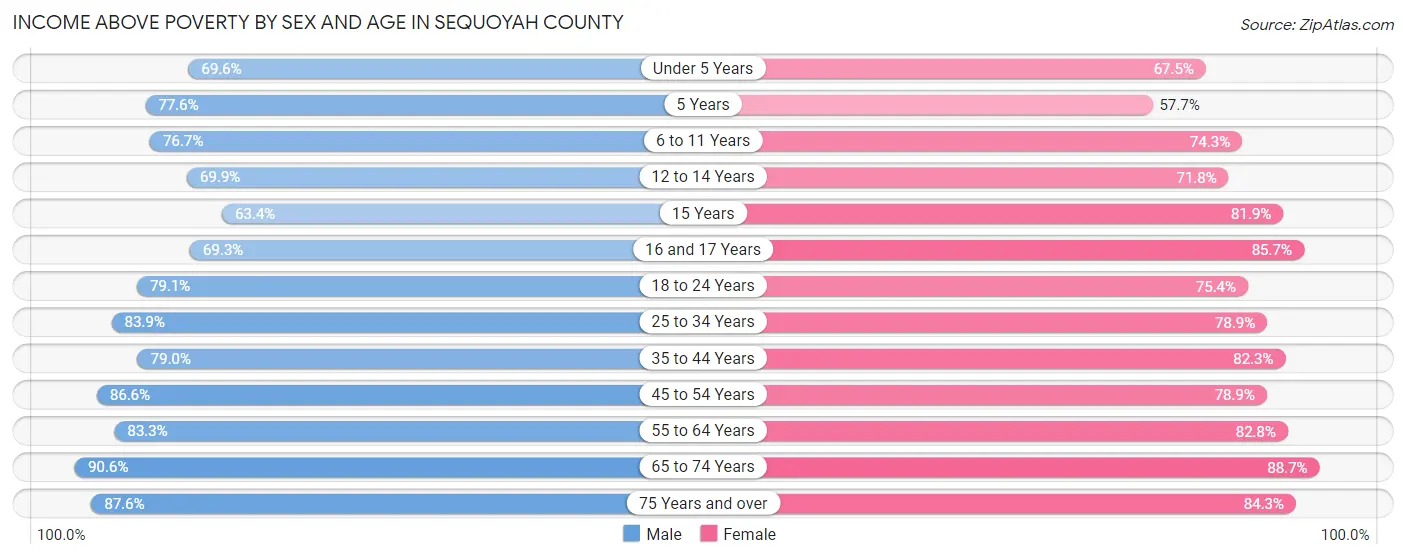
Income Above Poverty by Sex and Age in Sequoyah County
According to the poverty statistics in Sequoyah County, males aged 65 to 74 years and females aged 65 to 74 years are the age groups that are most secure financially, with 90.6% of males and 88.6% of females in these age groups living above the poverty line.
| Age Bracket | Male | Female |
| Under 5 Years | 879 (69.6%) | 797 (67.5%) |
| 5 Years | 135 (77.6%) | 109 (57.7%) |
| 6 to 11 Years | 1,203 (76.7%) | 985 (74.3%) |
| 12 to 14 Years | 640 (69.9%) | 669 (71.8%) |
| 15 Years | 185 (63.4%) | 213 (81.9%) |
| 16 and 17 Years | 384 (69.3%) | 487 (85.7%) |
| 18 to 24 Years | 1,362 (79.1%) | 1,193 (75.4%) |
| 25 to 34 Years | 1,879 (83.9%) | 1,814 (78.9%) |
| 35 to 44 Years | 1,759 (79.0%) | 1,850 (82.3%) |
| 45 to 54 Years | 2,194 (86.6%) | 2,019 (78.9%) |
| 55 to 64 Years | 2,206 (83.3%) | 2,234 (82.8%) |
| 65 to 74 Years | 1,840 (90.6%) | 1,944 (88.6%) |
| 75 Years and over | 1,075 (87.6%) | 1,388 (84.3%) |
| Total | 15,741 (81.2%) | 15,702 (79.8%) |
Income Below Poverty Among Married-Couple Families in Sequoyah County
The poverty statistics for married-couple families in Sequoyah County show that 9.1% or 661 of the total 7,281 families live below the poverty line. Families with 5 or more children have the highest poverty rate of 35.0%, comprising of 14 families. On the other hand, families with no children have the lowest poverty rate of 5.1%, which includes 219 families.
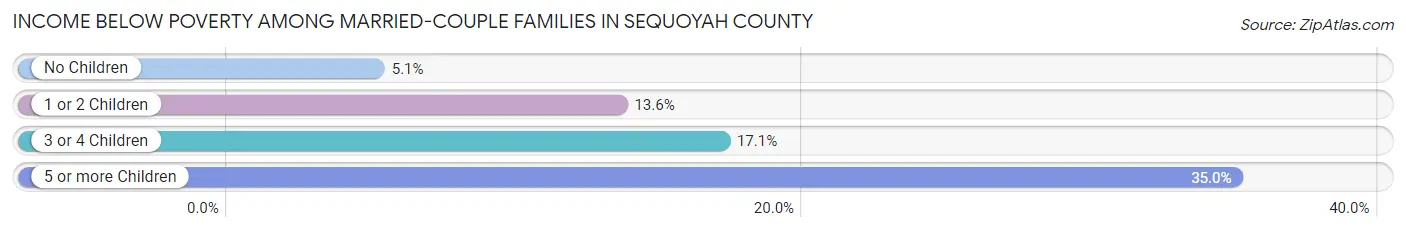
| Children | Above Poverty | Below Poverty |
| No Children | 4,066 (94.9%) | 219 (5.1%) |
| 1 or 2 Children | 1,899 (86.4%) | 298 (13.6%) |
| 3 or 4 Children | 629 (82.9%) | 130 (17.1%) |
| 5 or more Children | 26 (65.0%) | 14 (35.0%) |
| Total | 6,620 (90.9%) | 661 (9.1%) |
Income Below Poverty Among Single-Parent Households in Sequoyah County
According to the poverty data in Sequoyah County, 29.5% or 265 single-father households and 30.0% or 552 single-mother households are living below the poverty line. Among single-father households, those with 1 or 2 children have the highest poverty rate, with 207 households (44.1%) experiencing poverty. Likewise, among single-mother households, those with 5 or more children have the highest poverty rate, with 16 households (88.9%) falling below the poverty line.
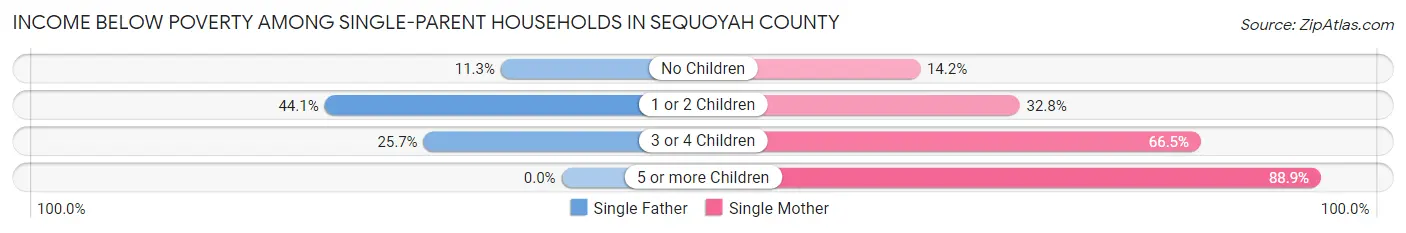
| Children | Single Father | Single Mother |
| No Children | 40 (11.3%) | 109 (14.2%) |
| 1 or 2 Children | 207 (44.1%) | 266 (32.8%) |
| 3 or 4 Children | 18 (25.7%) | 161 (66.5%) |
| 5 or more Children | 0 (0.0%) | 16 (88.9%) |
| Total | 265 (29.5%) | 552 (30.0%) |
Income Below Poverty Among Married-Couple vs Single-Parent Households in Sequoyah County
The poverty data for Sequoyah County shows that 661 of the married-couple family households (9.1%) and 817 of the single-parent households (29.9%) are living below the poverty level. Within the married-couple family households, those with 5 or more children have the highest poverty rate, with 14 households (35.0%) falling below the poverty line. Among the single-parent households, those with 5 or more children have the highest poverty rate, with 16 household (72.7%) living below poverty.
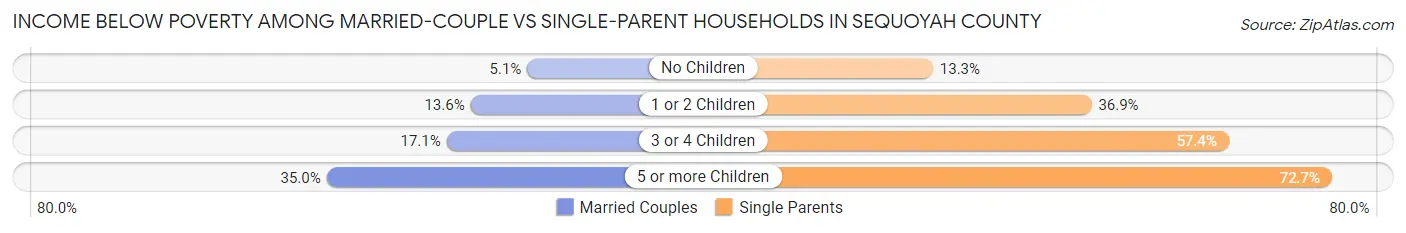
| Children | Married-Couple Families | Single-Parent Households |
| No Children | 219 (5.1%) | 149 (13.3%) |
| 1 or 2 Children | 298 (13.6%) | 473 (36.9%) |
| 3 or 4 Children | 130 (17.1%) | 179 (57.4%) |
| 5 or more Children | 14 (35.0%) | 16 (72.7%) |
| Total | 661 (9.1%) | 817 (29.9%) |
Employment Characteristics in Sequoyah County
Employment by Class of Employer in Sequoyah County
Among the 15,212 employed individuals in Sequoyah County, private company employees (9,601 | 63.1%), local government employees (1,297 | 8.5%), and state government employees (1,167 | 7.7%) make up the most common classes of employment.
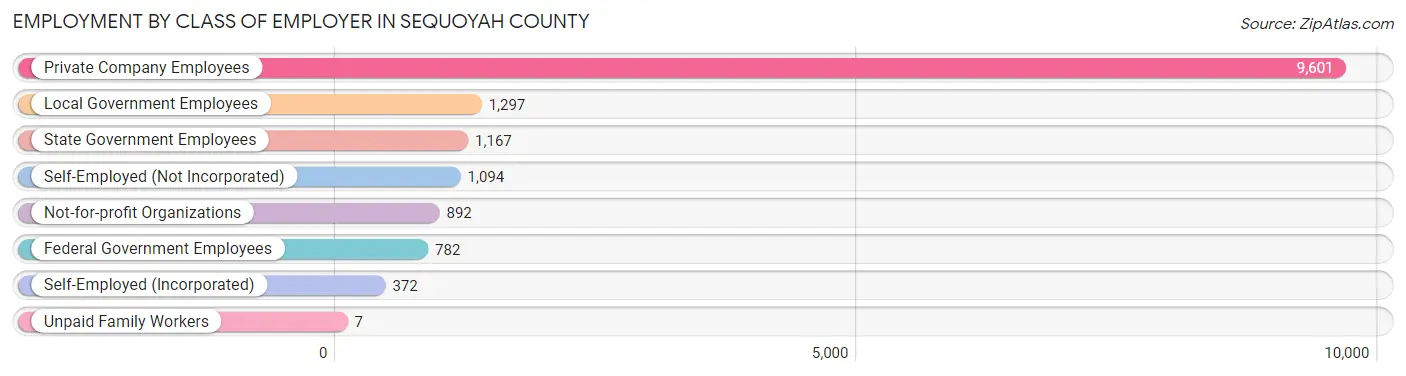
| Employer Class | # Employees | % Employees |
| Private Company Employees | 9,601 | 63.1% |
| Self-Employed (Incorporated) | 372 | 2.5% |
| Self-Employed (Not Incorporated) | 1,094 | 7.2% |
| Not-for-profit Organizations | 892 | 5.9% |
| Local Government Employees | 1,297 | 8.5% |
| State Government Employees | 1,167 | 7.7% |
| Federal Government Employees | 782 | 5.1% |
| Unpaid Family Workers | 7 | 0.1% |
| Total | 15,212 | 100.0% |
Employment Status by Age in Sequoyah County
According to the labor force statistics for Sequoyah County, out of the total population over 16 years of age (31,310), 51.7% or 16,187 individuals are in the labor force, with 5.2% or 842 of them unemployed. The age group with the highest labor force participation rate is 35 to 44 years, with 78.1% or 3,523 individuals in the labor force. Within the labor force, the 16 to 19 years age range has the highest percentage of unemployed individuals, with 11.0% or 84 of them being unemployed.
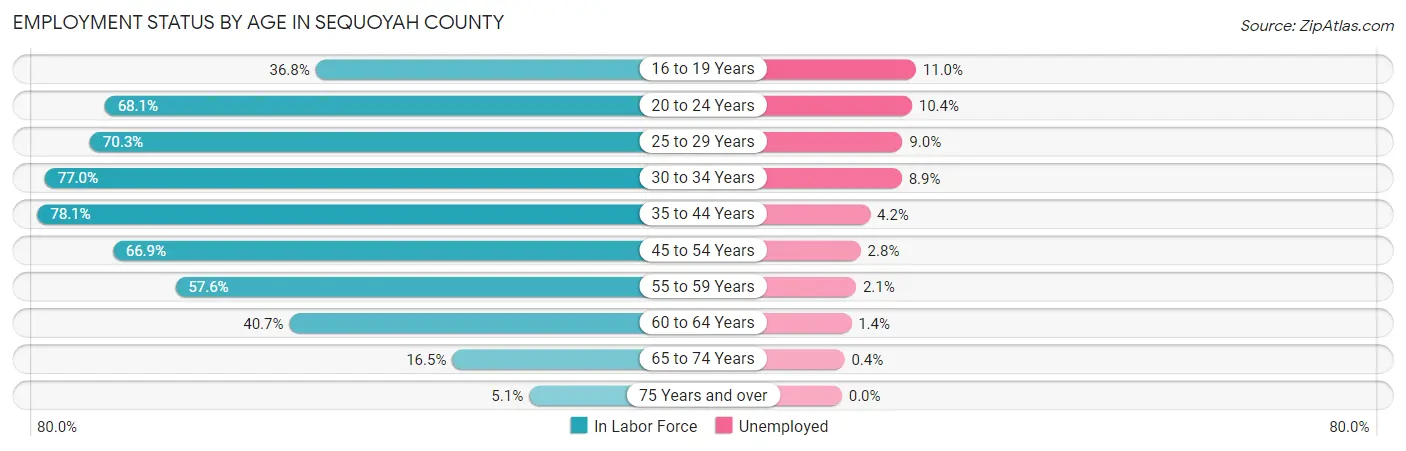
| Age Bracket | In Labor Force | Unemployed |
| 16 to 19 Years | 767 (36.8%) | 84 (11.0%) |
| 20 to 24 Years | 1,614 (68.1%) | 168 (10.4%) |
| 25 to 29 Years | 1,655 (70.3%) | 149 (9.0%) |
| 30 to 34 Years | 1,719 (77.0%) | 153 (8.9%) |
| 35 to 44 Years | 3,523 (78.1%) | 148 (4.2%) |
| 45 to 54 Years | 3,416 (66.9%) | 96 (2.8%) |
| 55 to 59 Years | 1,511 (57.6%) | 32 (2.1%) |
| 60 to 64 Years | 1,118 (40.7%) | 16 (1.4%) |
| 65 to 74 Years | 706 (16.5%) | 3 (0.4%) |
| 75 Years and over | 153 (5.1%) | 0 (0.0%) |
| Total | 16,187 (51.7%) | 842 (5.2%) |
Employment Status by Educational Attainment in Sequoyah County
According to labor force statistics for Sequoyah County, 66.1% of individuals (12,937) out of the total population between 25 and 64 years of age (19,572) are in the labor force, with 4.5% or 582 of them being unemployed. The group with the highest labor force participation rate are those with the educational attainment of bachelor's degree or higher, with 80.7% or 2,291 individuals in the labor force. Within the labor force, individuals with less than high school education have the highest percentage of unemployment, with 7.3% or 85 of them being unemployed.
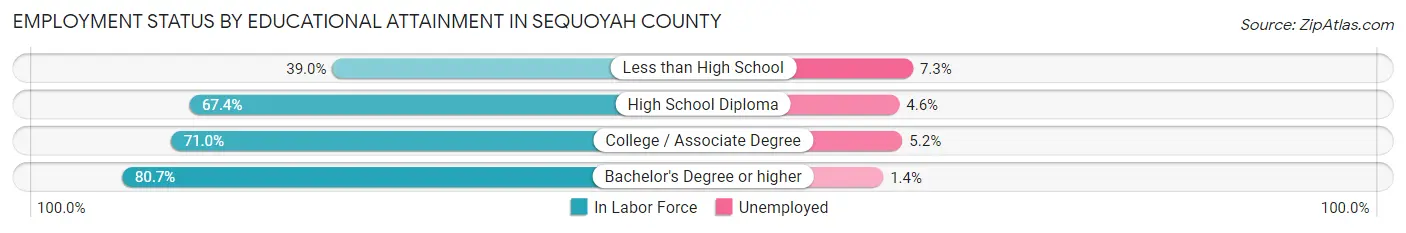
| Educational Attainment | In Labor Force | Unemployed |
| Less than High School | 1,170 (39.0%) | 219 (7.3%) |
| High School Diploma | 5,031 (67.4%) | 343 (4.6%) |
| College / Associate Degree | 4,450 (71.0%) | 326 (5.2%) |
| Bachelor's Degree or higher | 2,291 (80.7%) | 40 (1.4%) |
| Total | 12,937 (66.1%) | 881 (4.5%) |
Employment Occupations by Sex in Sequoyah County
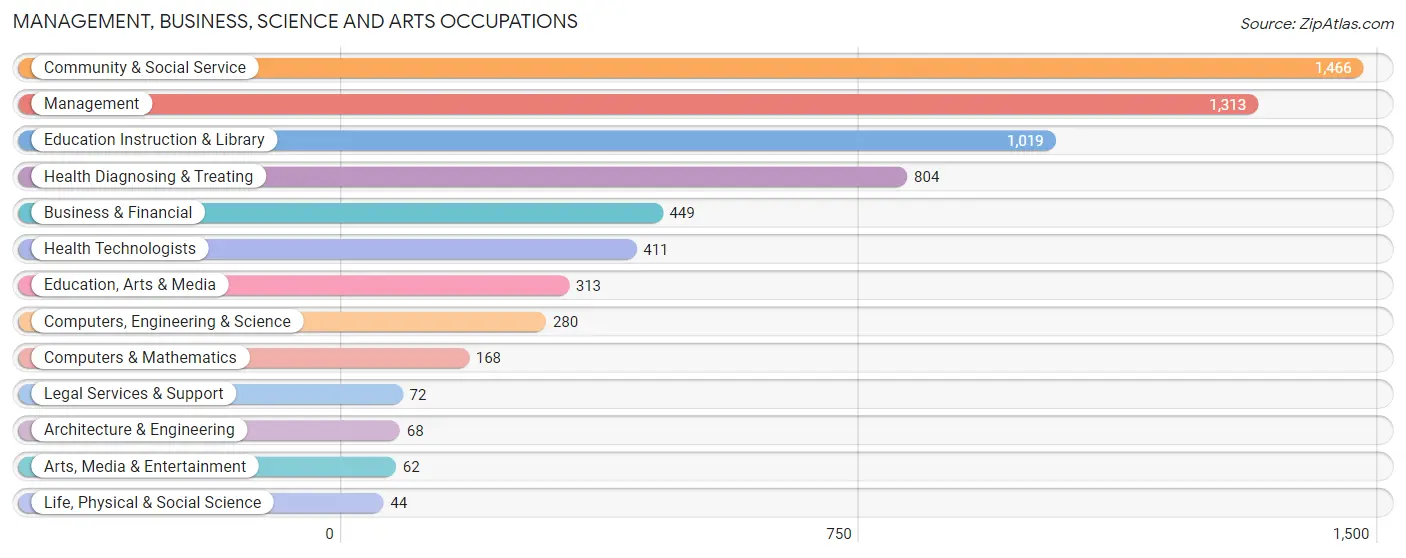
Management, Business, Science and Arts Occupations
The most common Management, Business, Science and Arts occupations in Sequoyah County are Community & Social Service (1,466 | 9.7%), Management (1,313 | 8.6%), Education Instruction & Library (1,019 | 6.7%), Health Diagnosing & Treating (804 | 5.3%), and Business & Financial (449 | 3.0%).
Management, Business, Science and Arts Occupations by Sex
Within the Management, Business, Science and Arts occupations in Sequoyah County, the most male-oriented occupations are Architecture & Engineering (91.2%), Computers & Mathematics (78.0%), and Computers, Engineering & Science (76.4%), while the most female-oriented occupations are Health Diagnosing & Treating (82.8%), Health Technologists (78.3%), and Education Instruction & Library (78.2%).
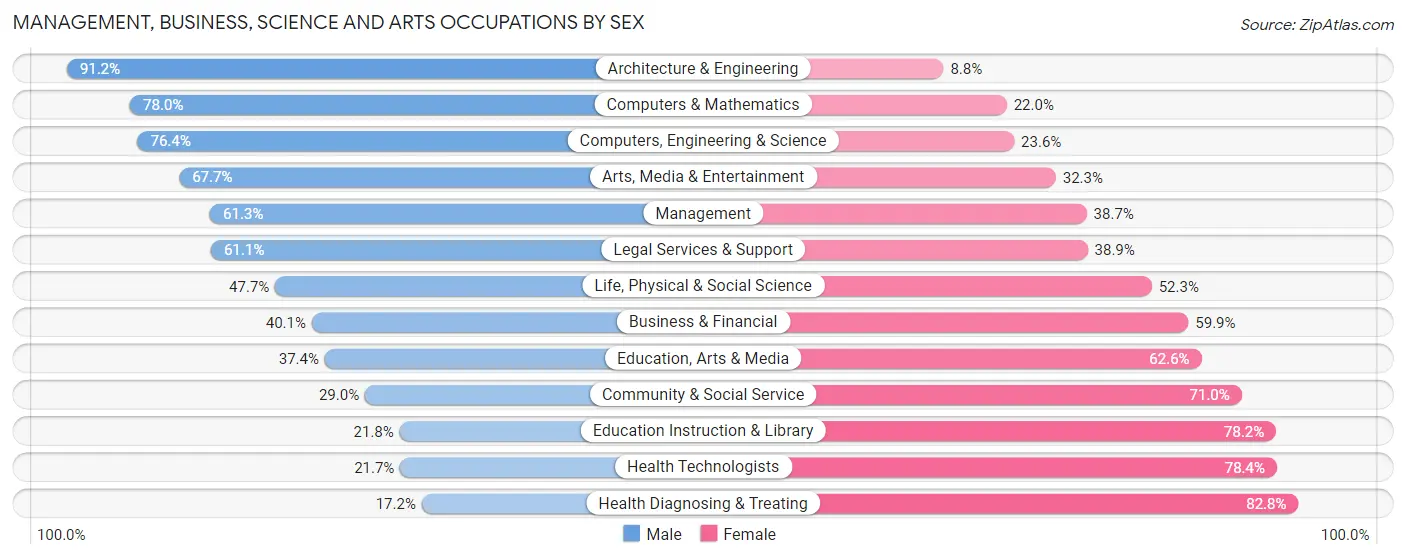
| Occupation | Male | Female |
| Management | 805 (61.3%) | 508 (38.7%) |
| Business & Financial | 180 (40.1%) | 269 (59.9%) |
| Computers, Engineering & Science | 214 (76.4%) | 66 (23.6%) |
| Computers & Mathematics | 131 (78.0%) | 37 (22.0%) |
| Architecture & Engineering | 62 (91.2%) | 6 (8.8%) |
| Life, Physical & Social Science | 21 (47.7%) | 23 (52.3%) |
| Community & Social Service | 425 (29.0%) | 1,041 (71.0%) |
| Education, Arts & Media | 117 (37.4%) | 196 (62.6%) |
| Legal Services & Support | 44 (61.1%) | 28 (38.9%) |
| Education Instruction & Library | 222 (21.8%) | 797 (78.2%) |
| Arts, Media & Entertainment | 42 (67.7%) | 20 (32.3%) |
| Health Diagnosing & Treating | 138 (17.2%) | 666 (82.8%) |
| Health Technologists | 89 (21.6%) | 322 (78.3%) |
| Total (Category) | 1,762 (40.9%) | 2,550 (59.1%) |
| Total (Overall) | 7,940 (52.3%) | 7,243 (47.7%) |
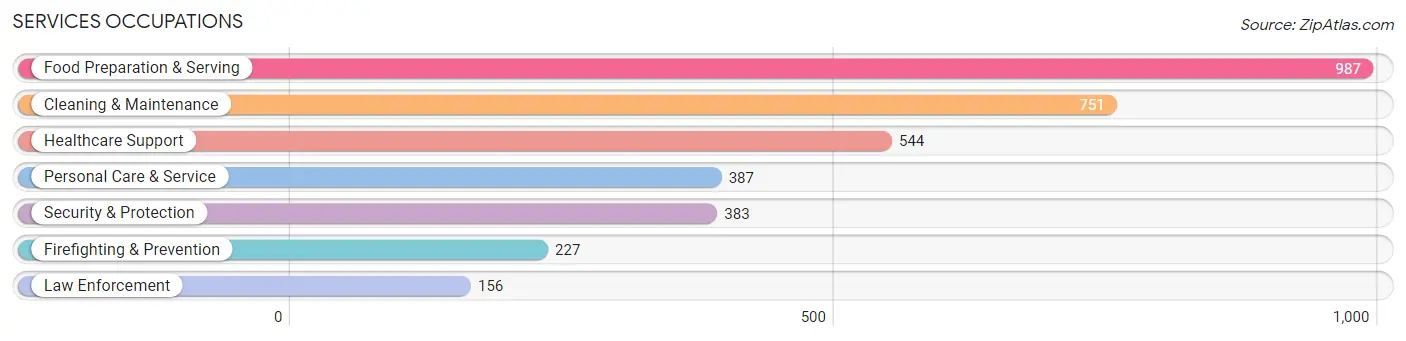
Services Occupations
The most common Services occupations in Sequoyah County are Food Preparation & Serving (987 | 6.5%), Cleaning & Maintenance (751 | 5.0%), Healthcare Support (544 | 3.6%), Personal Care & Service (387 | 2.5%), and Security & Protection (383 | 2.5%).
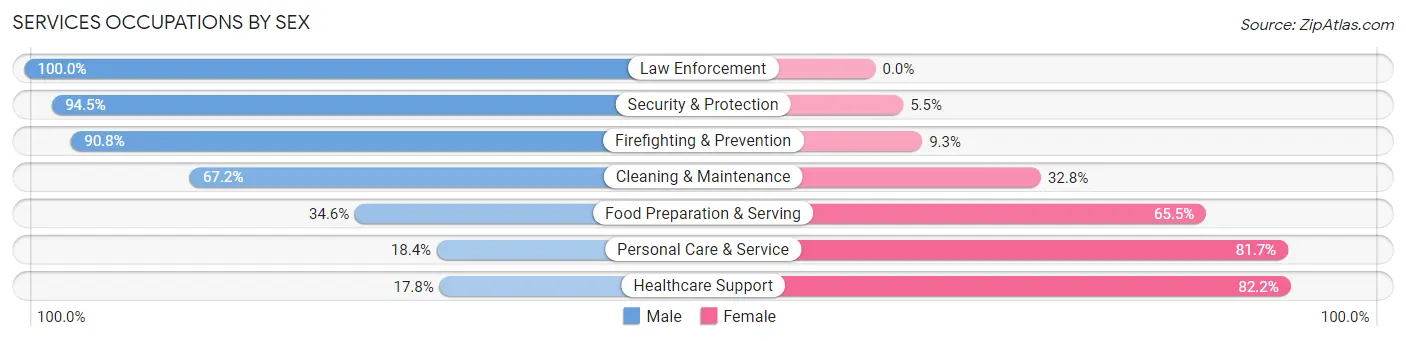
Services Occupations by Sex
Within the Services occupations in Sequoyah County, the most male-oriented occupations are Law Enforcement (100.0%), Security & Protection (94.5%), and Firefighting & Prevention (90.7%), while the most female-oriented occupations are Healthcare Support (82.2%), Personal Care & Service (81.7%), and Food Preparation & Serving (65.4%).
| Occupation | Male | Female |
| Healthcare Support | 97 (17.8%) | 447 (82.2%) |
| Security & Protection | 362 (94.5%) | 21 (5.5%) |
| Firefighting & Prevention | 206 (90.7%) | 21 (9.2%) |
| Law Enforcement | 156 (100.0%) | 0 (0.0%) |
| Food Preparation & Serving | 341 (34.5%) | 646 (65.4%) |
| Cleaning & Maintenance | 505 (67.2%) | 246 (32.8%) |
| Personal Care & Service | 71 (18.3%) | 316 (81.7%) |
| Total (Category) | 1,376 (45.1%) | 1,676 (54.9%) |
| Total (Overall) | 7,940 (52.3%) | 7,243 (47.7%) |
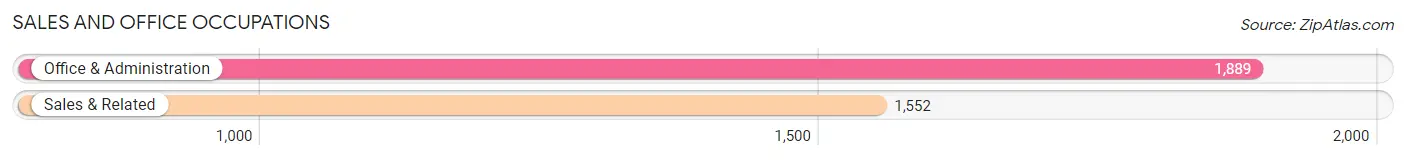
Sales and Office Occupations
The most common Sales and Office occupations in Sequoyah County are Office & Administration (1,889 | 12.4%), and Sales & Related (1,552 | 10.2%).
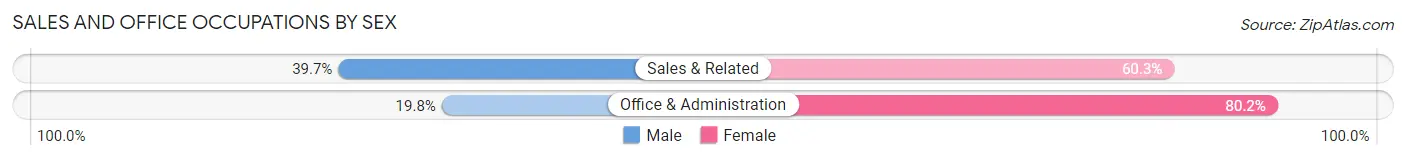
Sales and Office Occupations by Sex
| Occupation | Male | Female |
| Sales & Related | 616 (39.7%) | 936 (60.3%) |
| Office & Administration | 374 (19.8%) | 1,515 (80.2%) |
| Total (Category) | 990 (28.8%) | 2,451 (71.2%) |
| Total (Overall) | 7,940 (52.3%) | 7,243 (47.7%) |
Natural Resources, Construction and Maintenance Occupations
The most common Natural Resources, Construction and Maintenance occupations in Sequoyah County are Construction & Extraction (1,012 | 6.7%), Installation, Maintenance & Repair (625 | 4.1%), and Farming, Fishing & Forestry (145 | 1.0%).

Natural Resources, Construction and Maintenance Occupations by Sex
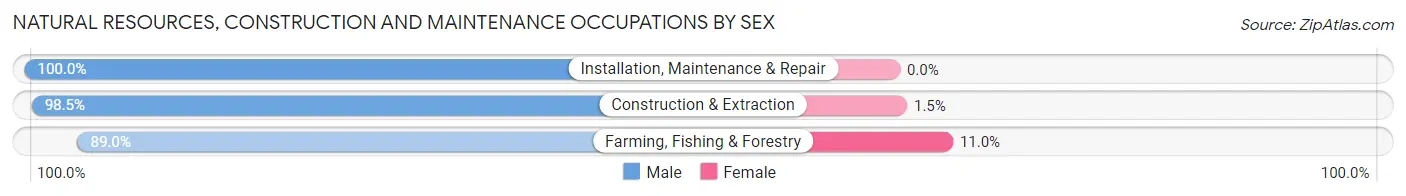
| Occupation | Male | Female |
| Farming, Fishing & Forestry | 129 (89.0%) | 16 (11.0%) |
| Construction & Extraction | 997 (98.5%) | 15 (1.5%) |
| Installation, Maintenance & Repair | 625 (100.0%) | 0 (0.0%) |
| Total (Category) | 1,751 (98.3%) | 31 (1.7%) |
| Total (Overall) | 7,940 (52.3%) | 7,243 (47.7%) |
Production, Transportation and Moving Occupations
The most common Production, Transportation and Moving occupations in Sequoyah County are Production (1,324 | 8.7%), Transportation (754 | 5.0%), and Material Moving (518 | 3.4%).

Production, Transportation and Moving Occupations by Sex
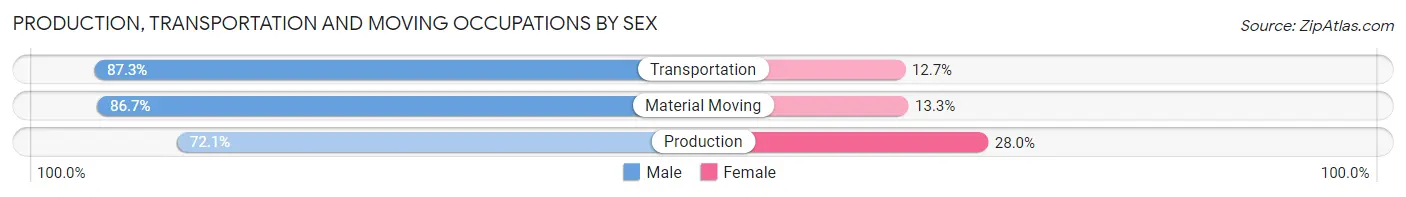
| Occupation | Male | Female |
| Production | 954 (72.1%) | 370 (28.0%) |
| Transportation | 658 (87.3%) | 96 (12.7%) |
| Material Moving | 449 (86.7%) | 69 (13.3%) |
| Total (Category) | 2,061 (79.4%) | 535 (20.6%) |
| Total (Overall) | 7,940 (52.3%) | 7,243 (47.7%) |
Employment Industries by Sex in Sequoyah County
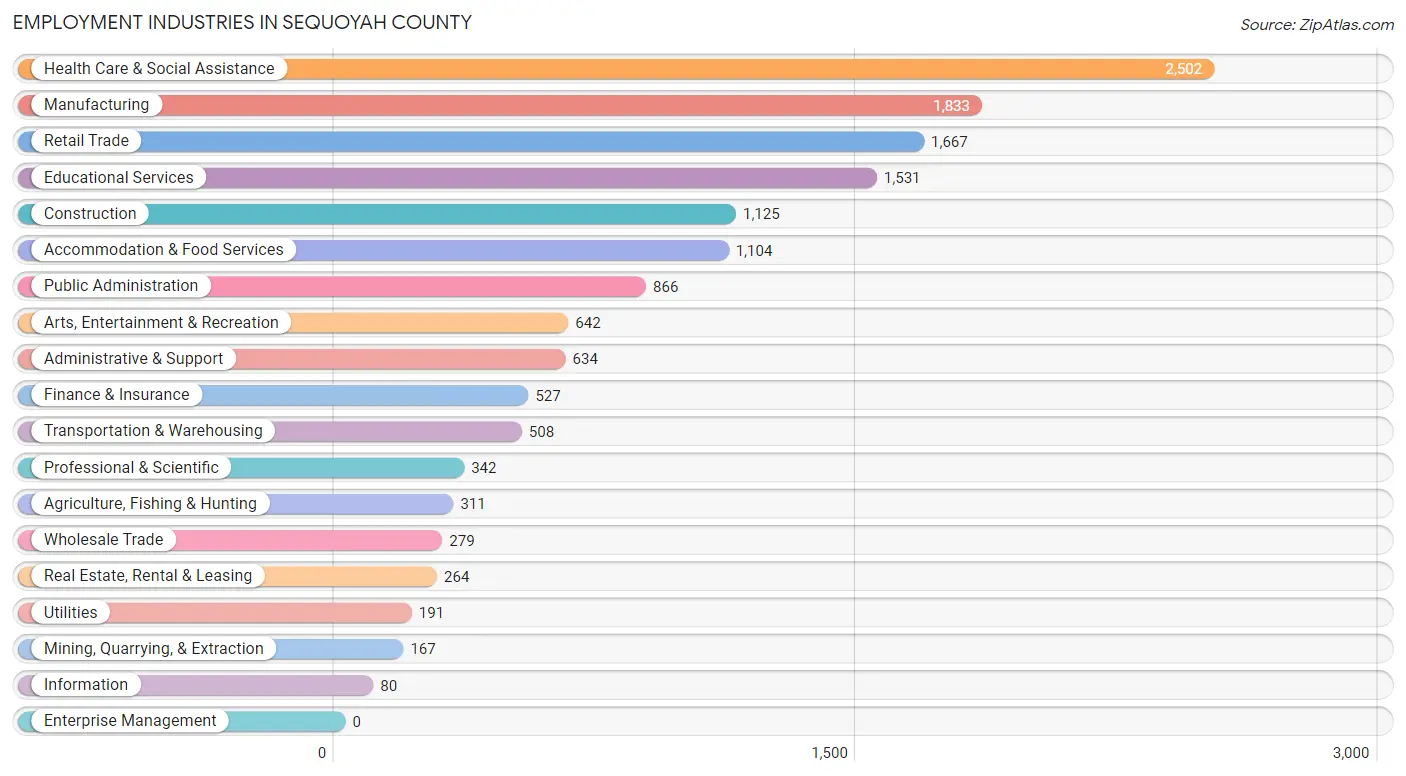
Employment Industries in Sequoyah County
The major employment industries in Sequoyah County include Health Care & Social Assistance (2,502 | 16.5%), Manufacturing (1,833 | 12.1%), Retail Trade (1,667 | 11.0%), Educational Services (1,531 | 10.1%), and Construction (1,125 | 7.4%).
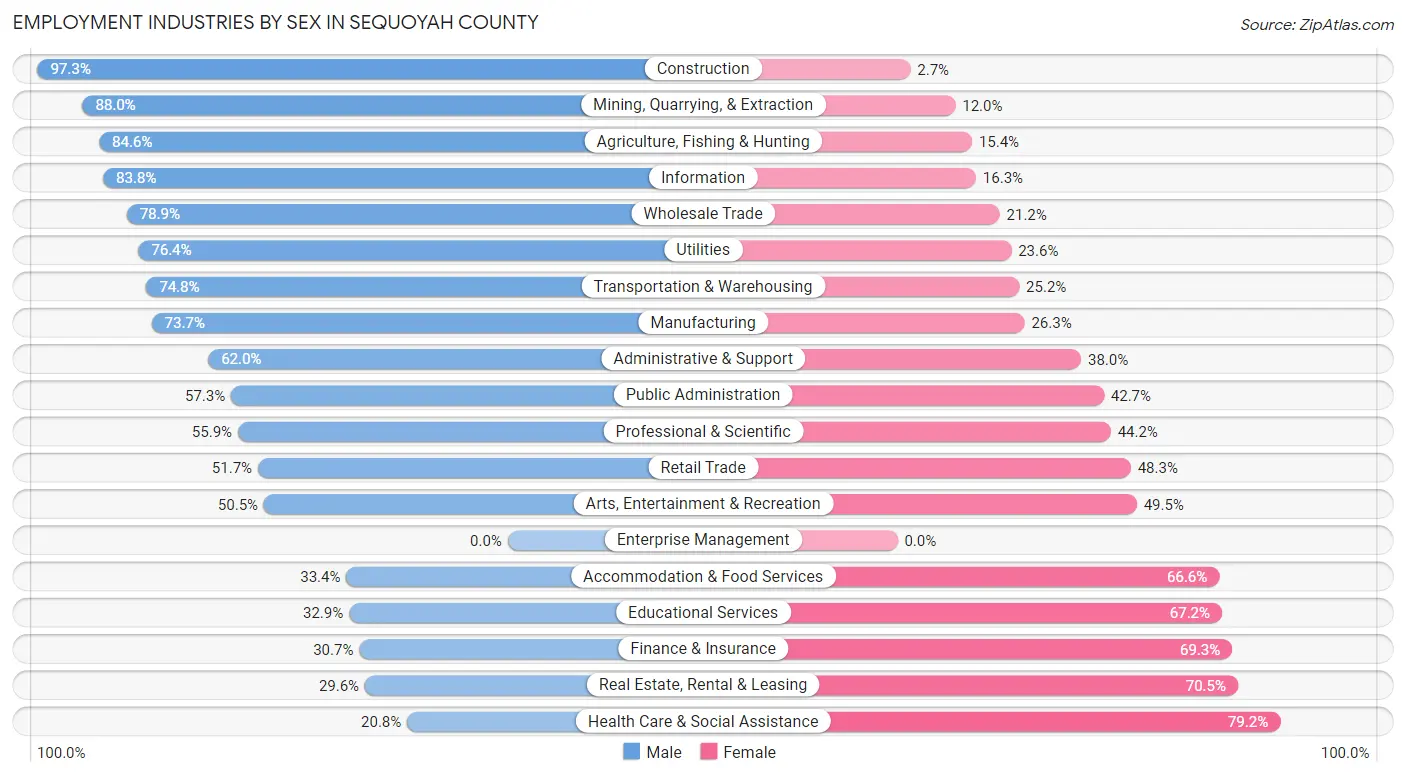
Employment Industries by Sex in Sequoyah County
The Sequoyah County industries that see more men than women are Construction (97.3%), Mining, Quarrying, & Extraction (88.0%), and Agriculture, Fishing & Hunting (84.6%), whereas the industries that tend to have a higher number of women are Health Care & Social Assistance (79.2%), Real Estate, Rental & Leasing (70.5%), and Finance & Insurance (69.3%).
| Industry | Male | Female |
| Agriculture, Fishing & Hunting | 263 (84.6%) | 48 (15.4%) |
| Mining, Quarrying, & Extraction | 147 (88.0%) | 20 (12.0%) |
| Construction | 1,095 (97.3%) | 30 (2.7%) |
| Manufacturing | 1,351 (73.7%) | 482 (26.3%) |
| Wholesale Trade | 220 (78.8%) | 59 (21.1%) |
| Retail Trade | 862 (51.7%) | 805 (48.3%) |
| Transportation & Warehousing | 380 (74.8%) | 128 (25.2%) |
| Utilities | 146 (76.4%) | 45 (23.6%) |
| Information | 67 (83.8%) | 13 (16.3%) |
| Finance & Insurance | 162 (30.7%) | 365 (69.3%) |
| Real Estate, Rental & Leasing | 78 (29.5%) | 186 (70.5%) |
| Professional & Scientific | 191 (55.8%) | 151 (44.2%) |
| Enterprise Management | 0 (0.0%) | 0 (0.0%) |
| Administrative & Support | 393 (62.0%) | 241 (38.0%) |
| Educational Services | 503 (32.9%) | 1,028 (67.1%) |
| Health Care & Social Assistance | 521 (20.8%) | 1,981 (79.2%) |
| Arts, Entertainment & Recreation | 324 (50.5%) | 318 (49.5%) |
| Accommodation & Food Services | 369 (33.4%) | 735 (66.6%) |
| Public Administration | 496 (57.3%) | 370 (42.7%) |
| Total | 7,940 (52.3%) | 7,243 (47.7%) |
Education in Sequoyah County
School Enrollment in Sequoyah County
The most common levels of schooling among the 8,842 students in Sequoyah County are middle school (2,395 | 27.1%), high school (2,163 | 24.5%), and elementary school (1,989 | 22.5%).
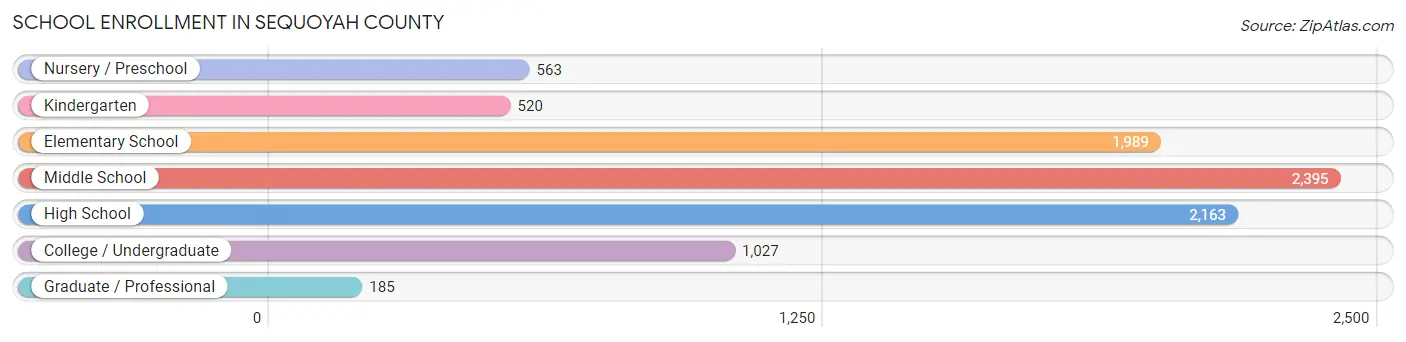
| School Level | # Students | % Students |
| Nursery / Preschool | 563 | 6.4% |
| Kindergarten | 520 | 5.9% |
| Elementary School | 1,989 | 22.5% |
| Middle School | 2,395 | 27.1% |
| High School | 2,163 | 24.5% |
| College / Undergraduate | 1,027 | 11.6% |
| Graduate / Professional | 185 | 2.1% |
| Total | 8,842 | 100.0% |
School Enrollment by Age by Funding Source in Sequoyah County
Out of a total of 8,842 students who are enrolled in schools in Sequoyah County, 566 (6.4%) attend a private institution, while the remaining 8,276 (93.6%) are enrolled in public schools. The age group of 35 years and over has the highest likelihood of being enrolled in private schools, with 87 (30.1% in the age bracket) enrolled. Conversely, the age group of 20 to 24 year olds has the lowest likelihood of being enrolled in a private school, with 539 (97.1% in the age bracket) attending a public institution.
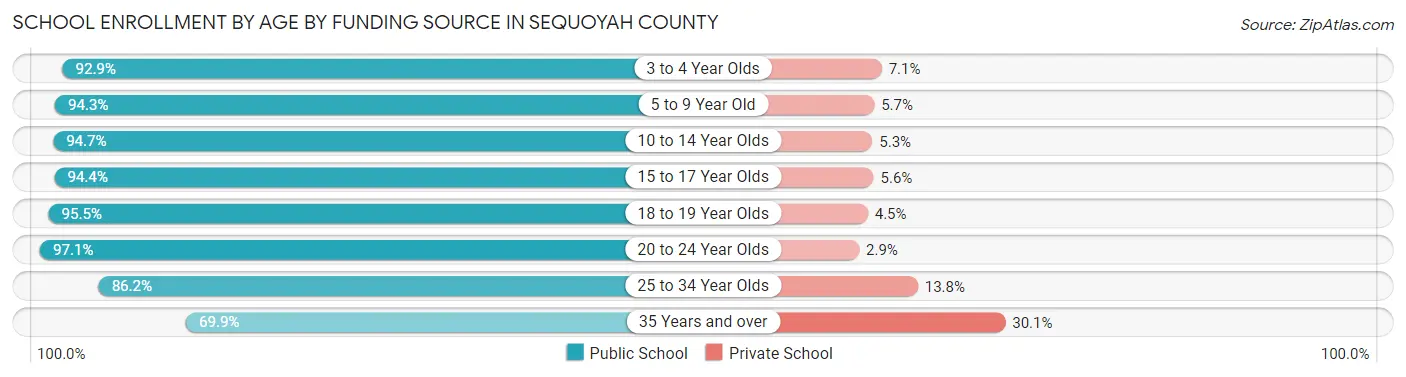
| Age Bracket | Public School | Private School |
| 3 to 4 Year Olds | 498 (92.9%) | 38 (7.1%) |
| 5 to 9 Year Old | 2,056 (94.3%) | 124 (5.7%) |
| 10 to 14 Year Olds | 2,745 (94.7%) | 155 (5.3%) |
| 15 to 17 Year Olds | 1,540 (94.4%) | 91 (5.6%) |
| 18 to 19 Year Olds | 489 (95.5%) | 23 (4.5%) |
| 20 to 24 Year Olds | 539 (97.1%) | 16 (2.9%) |
| 25 to 34 Year Olds | 206 (86.2%) | 33 (13.8%) |
| 35 Years and over | 202 (69.9%) | 87 (30.1%) |
| Total | 8,276 (93.6%) | 566 (6.4%) |
Educational Attainment by Field of Study in Sequoyah County
Education (1,416 | 33.8%), business (679 | 16.2%), science & technology (392 | 9.3%), arts & humanities (249 | 5.9%), and bio, nature & agricultural (245 | 5.8%) are the most common fields of study among 4,195 individuals in Sequoyah County who have obtained a bachelor's degree or higher.
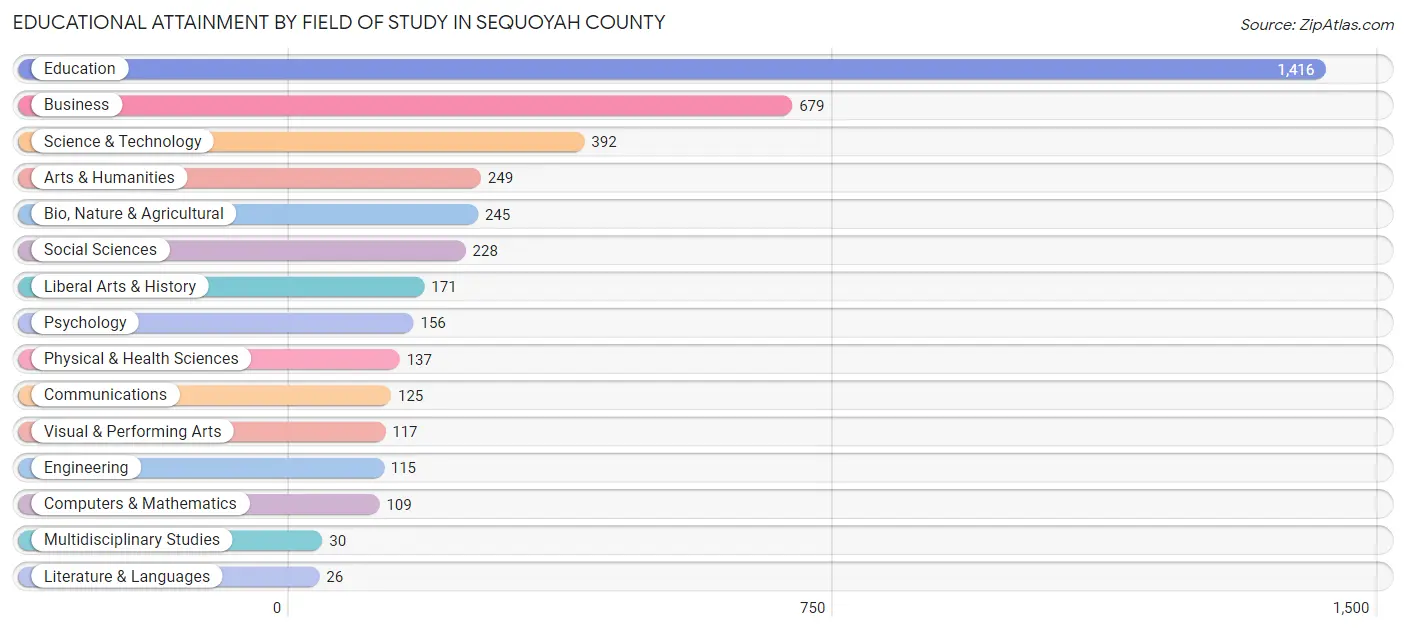
| Field of Study | # Graduates | % Graduates |
| Computers & Mathematics | 109 | 2.6% |
| Bio, Nature & Agricultural | 245 | 5.8% |
| Physical & Health Sciences | 137 | 3.3% |
| Psychology | 156 | 3.7% |
| Social Sciences | 228 | 5.4% |
| Engineering | 115 | 2.7% |
| Multidisciplinary Studies | 30 | 0.7% |
| Science & Technology | 392 | 9.3% |
| Business | 679 | 16.2% |
| Education | 1,416 | 33.8% |
| Literature & Languages | 26 | 0.6% |
| Liberal Arts & History | 171 | 4.1% |
| Visual & Performing Arts | 117 | 2.8% |
| Communications | 125 | 3.0% |
| Arts & Humanities | 249 | 5.9% |
| Total | 4,195 | 100.0% |
Transportation & Commute in Sequoyah County
Vehicle Availability by Sex in Sequoyah County
The most prevalent vehicle ownership categories in Sequoyah County are males with 2 vehicles (3,067, accounting for 38.4%) and females with 2 vehicles (2,613, making up 42.5%).
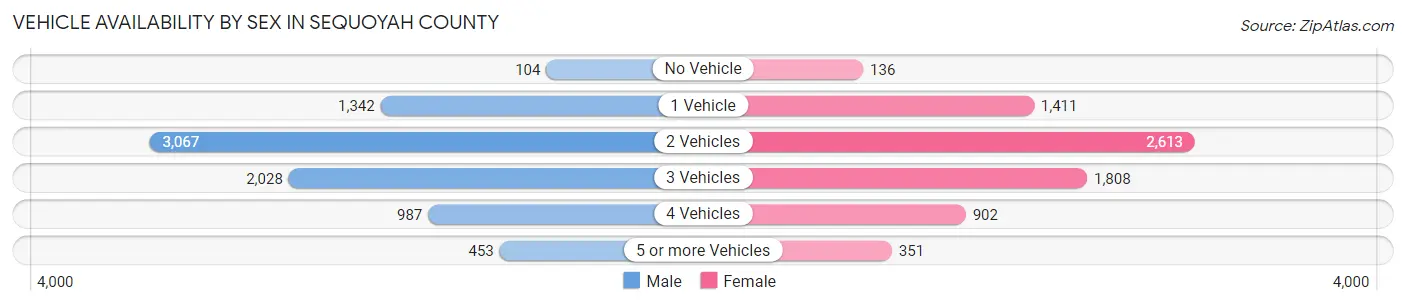
| Vehicles Available | Male | Female |
| No Vehicle | 104 (1.3%) | 136 (1.9%) |
| 1 Vehicle | 1,342 (16.8%) | 1,411 (19.5%) |
| 2 Vehicles | 3,067 (38.4%) | 2,613 (36.2%) |
| 3 Vehicles | 2,028 (25.4%) | 1,808 (25.0%) |
| 4 Vehicles | 987 (12.4%) | 902 (12.5%) |
| 5 or more Vehicles | 453 (5.7%) | 351 (4.9%) |
| Total | 7,981 (100.0%) | 7,221 (100.0%) |
Commute Time in Sequoyah County
The most frequently occuring commute durations in Sequoyah County are 15 to 19 minutes (2,251 commuters, 15.3%), 30 to 34 minutes (1,912 commuters, 13.0%), and 5 to 9 minutes (1,900 commuters, 12.9%).
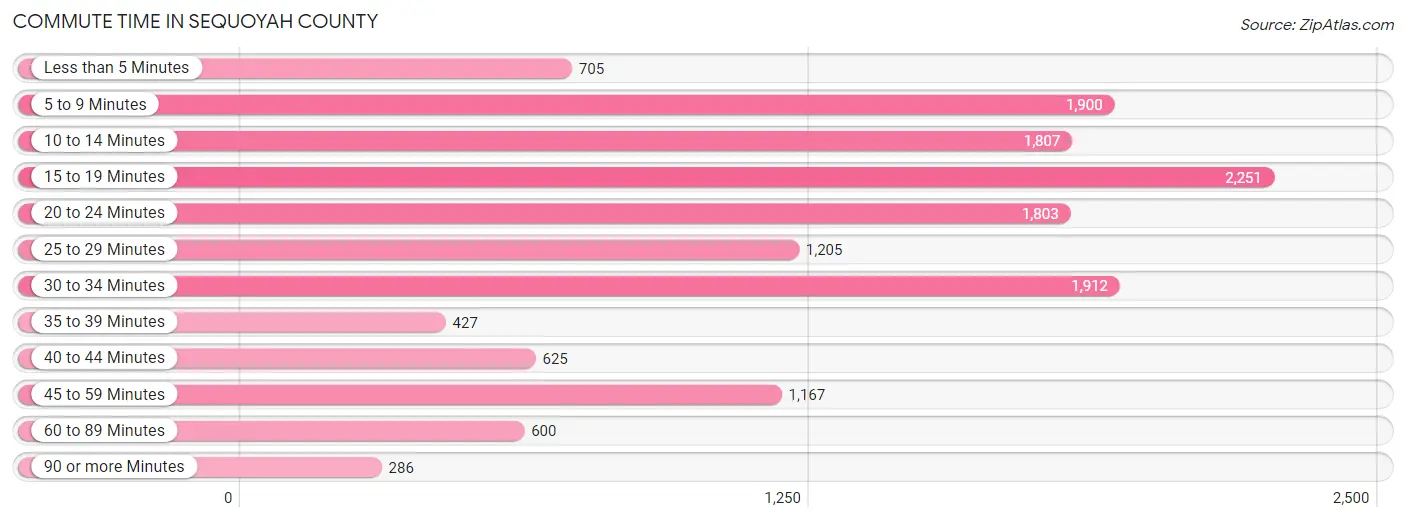
| Commute Time | # Commuters | % Commuters |
| Less than 5 Minutes | 705 | 4.8% |
| 5 to 9 Minutes | 1,900 | 12.9% |
| 10 to 14 Minutes | 1,807 | 12.3% |
| 15 to 19 Minutes | 2,251 | 15.3% |
| 20 to 24 Minutes | 1,803 | 12.3% |
| 25 to 29 Minutes | 1,205 | 8.2% |
| 30 to 34 Minutes | 1,912 | 13.0% |
| 35 to 39 Minutes | 427 | 2.9% |
| 40 to 44 Minutes | 625 | 4.3% |
| 45 to 59 Minutes | 1,167 | 8.0% |
| 60 to 89 Minutes | 600 | 4.1% |
| 90 or more Minutes | 286 | 1.9% |
Commute Time by Sex in Sequoyah County
The most common commute times in Sequoyah County are 15 to 19 minutes (1,098 commuters, 14.1%) for males and 15 to 19 minutes (1,153 commuters, 16.6%) for females.
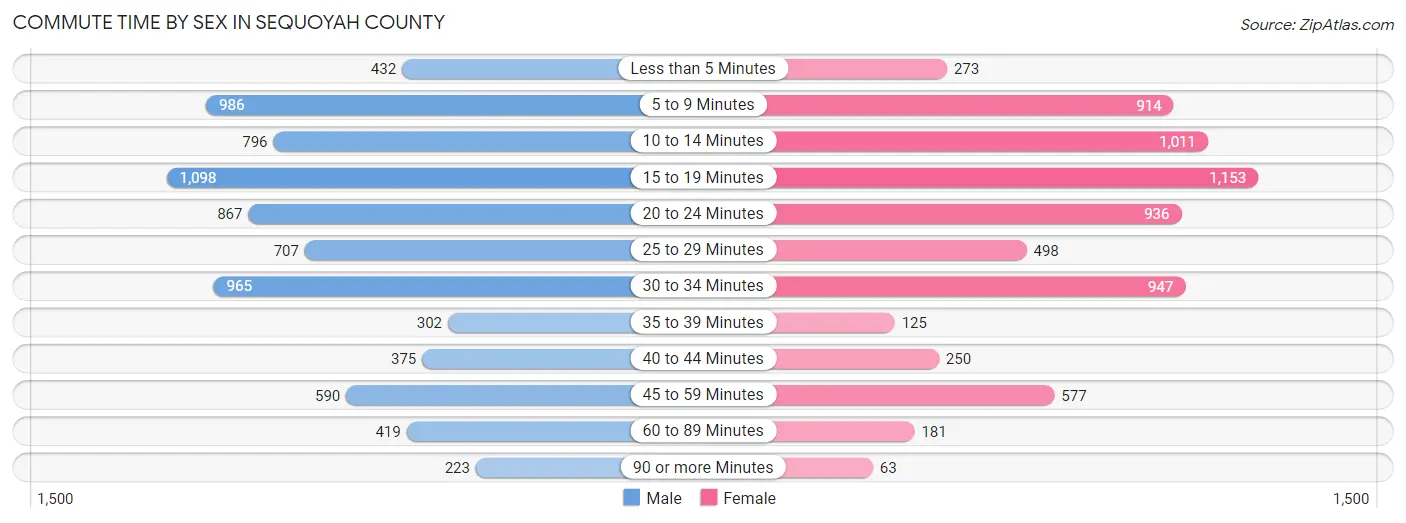
| Commute Time | Male | Female |
| Less than 5 Minutes | 432 (5.6%) | 273 (3.9%) |
| 5 to 9 Minutes | 986 (12.7%) | 914 (13.2%) |
| 10 to 14 Minutes | 796 (10.3%) | 1,011 (14.6%) |
| 15 to 19 Minutes | 1,098 (14.1%) | 1,153 (16.6%) |
| 20 to 24 Minutes | 867 (11.2%) | 936 (13.5%) |
| 25 to 29 Minutes | 707 (9.1%) | 498 (7.2%) |
| 30 to 34 Minutes | 965 (12.4%) | 947 (13.7%) |
| 35 to 39 Minutes | 302 (3.9%) | 125 (1.8%) |
| 40 to 44 Minutes | 375 (4.8%) | 250 (3.6%) |
| 45 to 59 Minutes | 590 (7.6%) | 577 (8.3%) |
| 60 to 89 Minutes | 419 (5.4%) | 181 (2.6%) |
| 90 or more Minutes | 223 (2.9%) | 63 (0.9%) |
Time of Departure to Work by Sex in Sequoyah County
The most frequent times of departure to work in Sequoyah County are 7:00 AM to 7:29 AM (1,264, 16.3%) for males and 7:00 AM to 7:29 AM (1,899, 27.4%) for females.
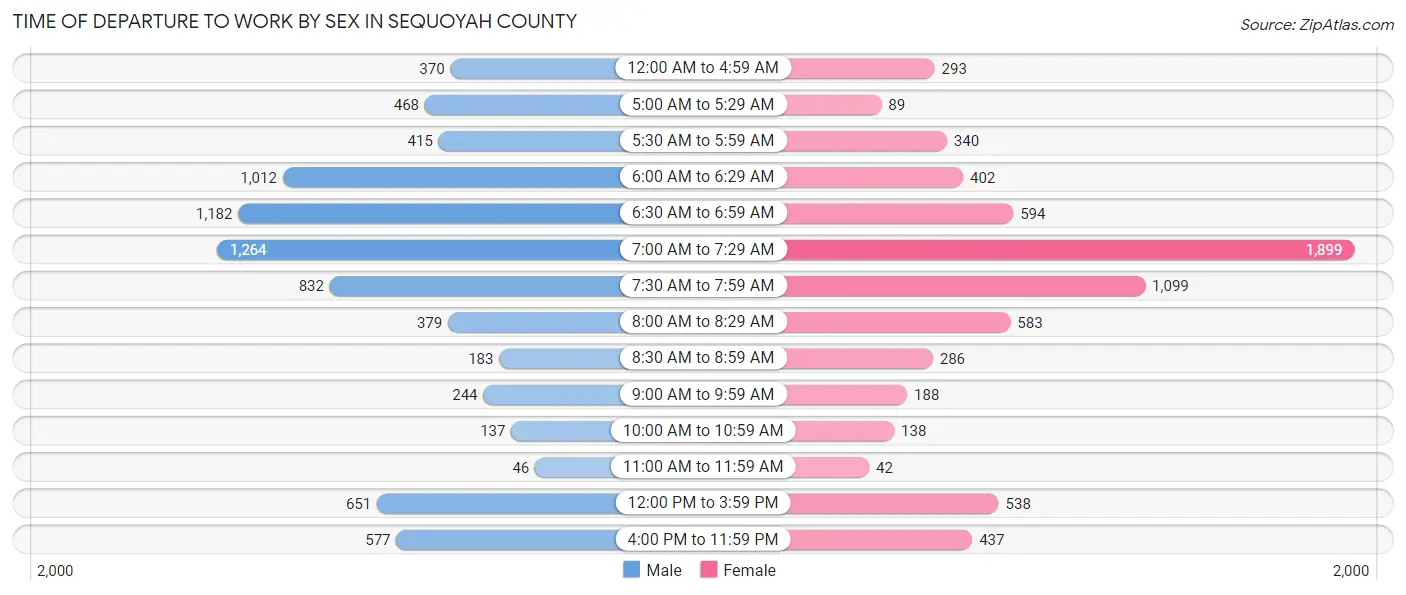
| Time of Departure | Male | Female |
| 12:00 AM to 4:59 AM | 370 (4.8%) | 293 (4.2%) |
| 5:00 AM to 5:29 AM | 468 (6.0%) | 89 (1.3%) |
| 5:30 AM to 5:59 AM | 415 (5.3%) | 340 (4.9%) |
| 6:00 AM to 6:29 AM | 1,012 (13.0%) | 402 (5.8%) |
| 6:30 AM to 6:59 AM | 1,182 (15.2%) | 594 (8.6%) |
| 7:00 AM to 7:29 AM | 1,264 (16.3%) | 1,899 (27.4%) |
| 7:30 AM to 7:59 AM | 832 (10.7%) | 1,099 (15.9%) |
| 8:00 AM to 8:29 AM | 379 (4.9%) | 583 (8.4%) |
| 8:30 AM to 8:59 AM | 183 (2.4%) | 286 (4.1%) |
| 9:00 AM to 9:59 AM | 244 (3.1%) | 188 (2.7%) |
| 10:00 AM to 10:59 AM | 137 (1.8%) | 138 (2.0%) |
| 11:00 AM to 11:59 AM | 46 (0.6%) | 42 (0.6%) |
| 12:00 PM to 3:59 PM | 651 (8.4%) | 538 (7.8%) |
| 4:00 PM to 11:59 PM | 577 (7.4%) | 437 (6.3%) |
| Total | 7,760 (100.0%) | 6,928 (100.0%) |
Housing Occupancy in Sequoyah County
Occupancy by Ownership in Sequoyah County
Of the total 14,960 dwellings in Sequoyah County, owner-occupied units account for 10,717 (71.6%), while renter-occupied units make up 4,243 (28.4%).

| Occupancy | # Housing Units | % Housing Units |
| Owner Occupied Housing Units | 10,717 | 71.6% |
| Renter-Occupied Housing Units | 4,243 | 28.4% |
| Total Occupied Housing Units | 14,960 | 100.0% |
Occupancy by Household Size in Sequoyah County
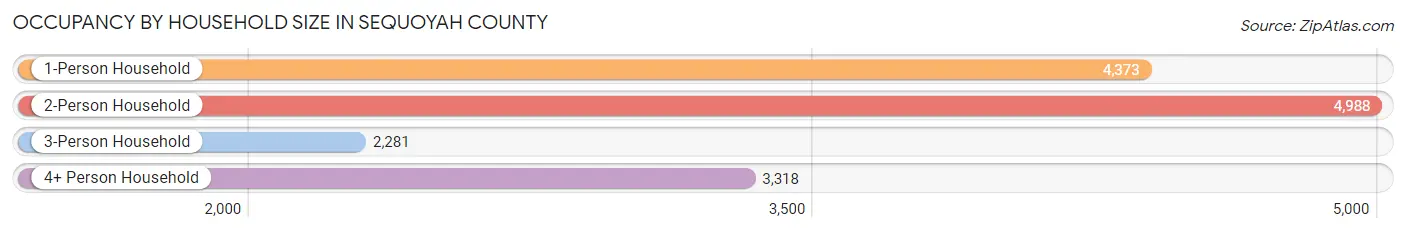
| Household Size | # Housing Units | % Housing Units |
| 1-Person Household | 4,373 | 29.2% |
| 2-Person Household | 4,988 | 33.3% |
| 3-Person Household | 2,281 | 15.2% |
| 4+ Person Household | 3,318 | 22.2% |
| Total Housing Units | 14,960 | 100.0% |
Occupancy by Ownership by Household Size in Sequoyah County
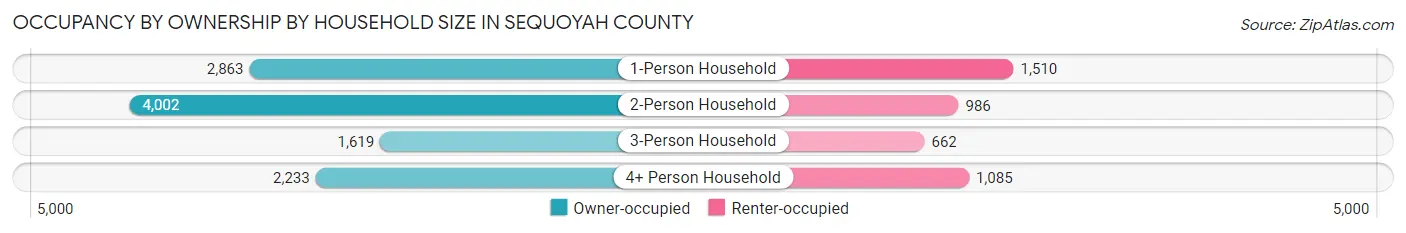
| Household Size | Owner-occupied | Renter-occupied |
| 1-Person Household | 2,863 (65.5%) | 1,510 (34.5%) |
| 2-Person Household | 4,002 (80.2%) | 986 (19.8%) |
| 3-Person Household | 1,619 (71.0%) | 662 (29.0%) |
| 4+ Person Household | 2,233 (67.3%) | 1,085 (32.7%) |
| Total Housing Units | 10,717 (71.6%) | 4,243 (28.4%) |
Occupancy by Educational Attainment in Sequoyah County
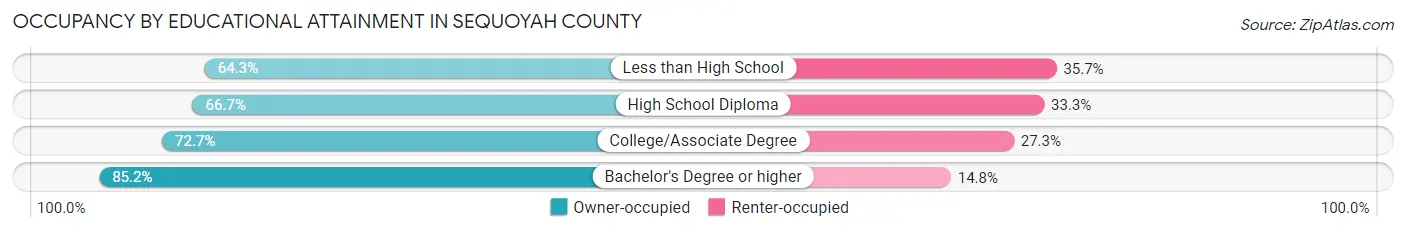
| Household Size | Owner-occupied | Renter-occupied |
| Less than High School | 1,327 (64.3%) | 738 (35.7%) |
| High School Diploma | 3,531 (66.7%) | 1,763 (33.3%) |
| College/Associate Degree | 3,596 (72.7%) | 1,349 (27.3%) |
| Bachelor's Degree or higher | 2,263 (85.2%) | 393 (14.8%) |
Occupancy by Age of Householder in Sequoyah County
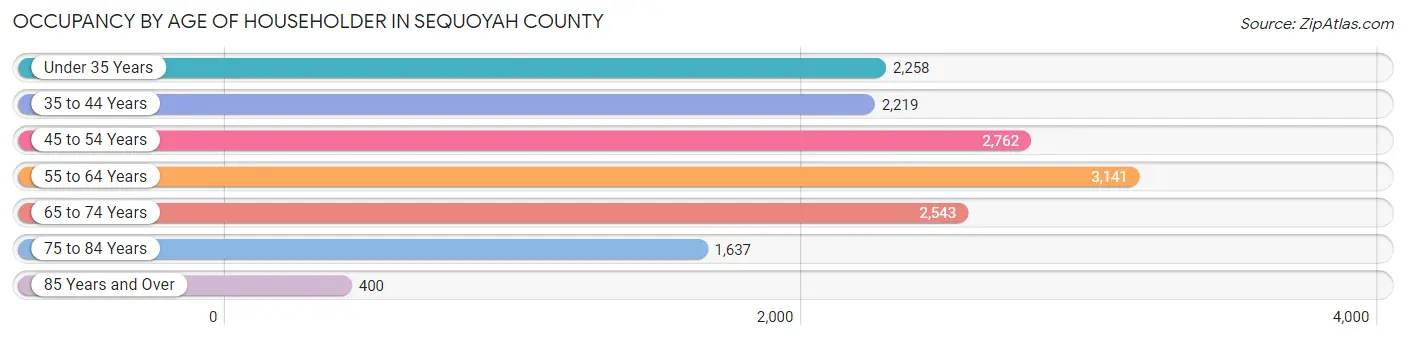
| Age Bracket | # Households | % Households |
| Under 35 Years | 2,258 | 15.1% |
| 35 to 44 Years | 2,219 | 14.8% |
| 45 to 54 Years | 2,762 | 18.5% |
| 55 to 64 Years | 3,141 | 21.0% |
| 65 to 74 Years | 2,543 | 17.0% |
| 75 to 84 Years | 1,637 | 10.9% |
| 85 Years and Over | 400 | 2.7% |
| Total | 14,960 | 100.0% |
Housing Finances in Sequoyah County
Median Income by Occupancy in Sequoyah County
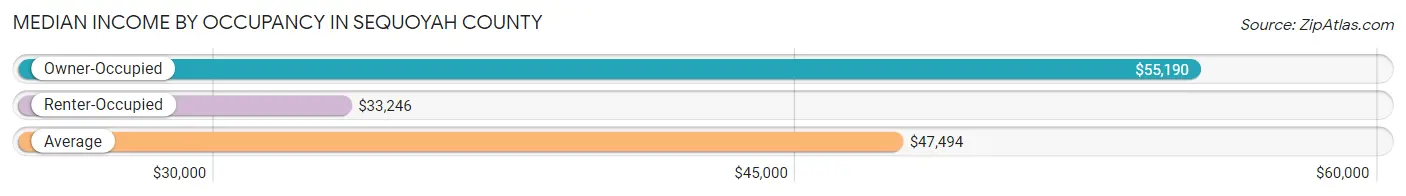
| Occupancy Type | # Households | Median Income |
| Owner-Occupied | 10,717 (71.6%) | $55,190 |
| Renter-Occupied | 4,243 (28.4%) | $33,246 |
| Average | 14,960 (100.0%) | $47,494 |
Occupancy by Householder Income Bracket in Sequoyah County
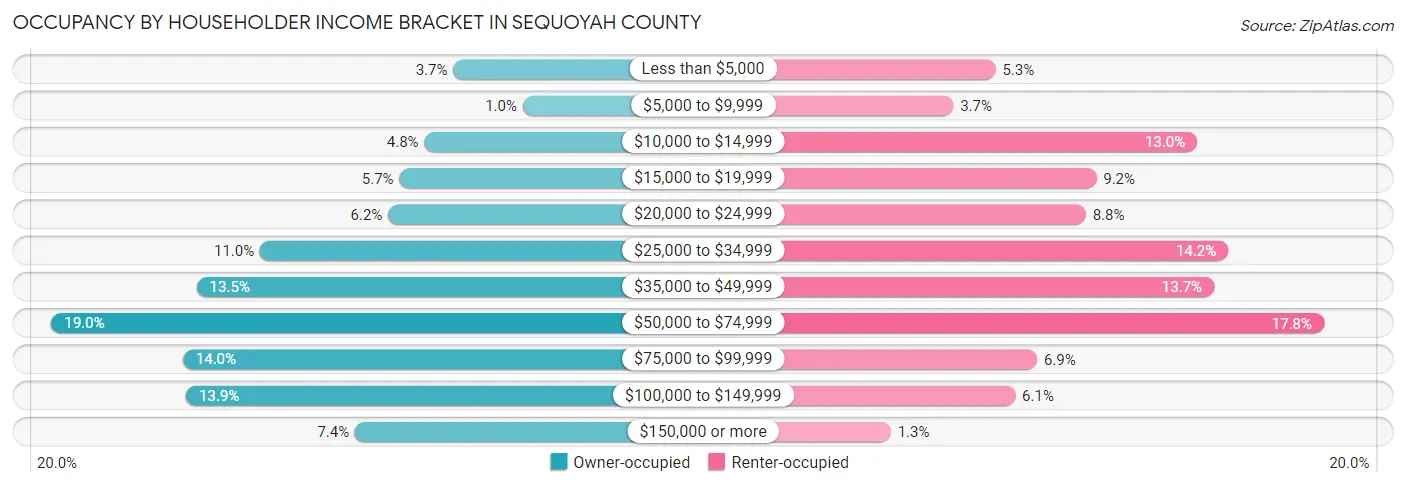
| Income Bracket | Owner-occupied | Renter-occupied |
| Less than $5,000 | 393 (3.7%) | 226 (5.3%) |
| $5,000 to $9,999 | 109 (1.0%) | 158 (3.7%) |
| $10,000 to $14,999 | 511 (4.8%) | 552 (13.0%) |
| $15,000 to $19,999 | 613 (5.7%) | 389 (9.2%) |
| $20,000 to $24,999 | 659 (6.1%) | 372 (8.8%) |
| $25,000 to $34,999 | 1,182 (11.0%) | 602 (14.2%) |
| $35,000 to $49,999 | 1,441 (13.5%) | 579 (13.7%) |
| $50,000 to $74,999 | 2,034 (19.0%) | 757 (17.8%) |
| $75,000 to $99,999 | 1,497 (14.0%) | 293 (6.9%) |
| $100,000 to $149,999 | 1,484 (13.9%) | 258 (6.1%) |
| $150,000 or more | 794 (7.4%) | 57 (1.3%) |
| Total | 10,717 (100.0%) | 4,243 (100.0%) |
Monthly Housing Cost Tiers in Sequoyah County
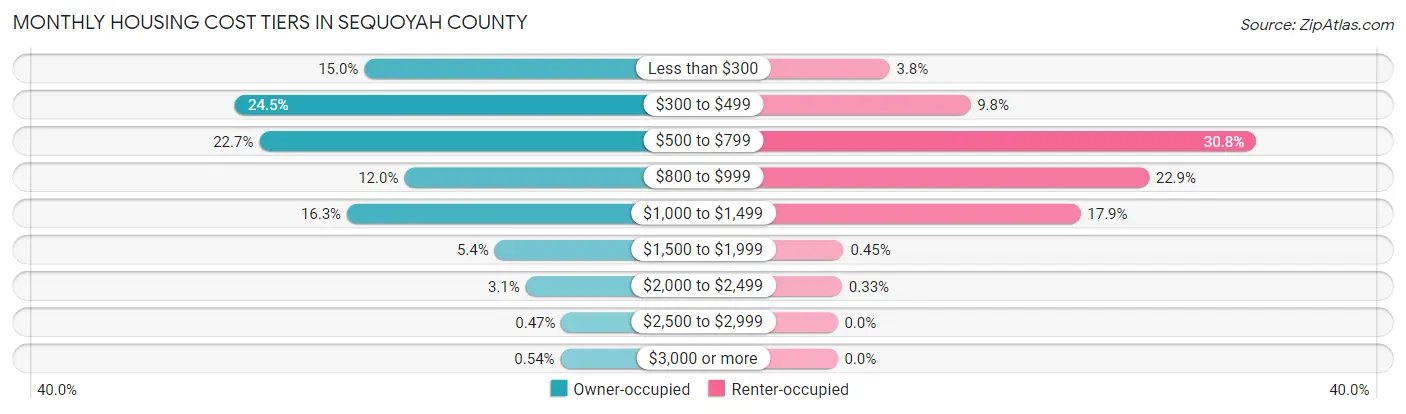
| Monthly Cost | Owner-occupied | Renter-occupied |
| Less than $300 | 1,606 (15.0%) | 163 (3.8%) |
| $300 to $499 | 2,625 (24.5%) | 415 (9.8%) |
| $500 to $799 | 2,435 (22.7%) | 1,308 (30.8%) |
| $800 to $999 | 1,290 (12.0%) | 973 (22.9%) |
| $1,000 to $1,499 | 1,743 (16.3%) | 759 (17.9%) |
| $1,500 to $1,999 | 578 (5.4%) | 19 (0.4%) |
| $2,000 to $2,499 | 332 (3.1%) | 14 (0.3%) |
| $2,500 to $2,999 | 50 (0.5%) | 0 (0.0%) |
| $3,000 or more | 58 (0.5%) | 0 (0.0%) |
| Total | 10,717 (100.0%) | 4,243 (100.0%) |
Physical Housing Characteristics in Sequoyah County
Housing Structures in Sequoyah County
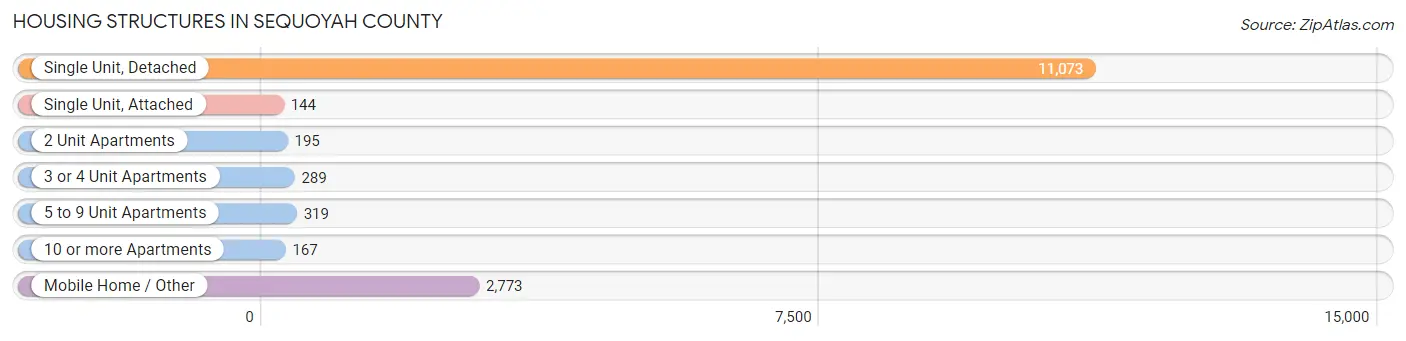
| Structure Type | # Housing Units | % Housing Units |
| Single Unit, Detached | 11,073 | 74.0% |
| Single Unit, Attached | 144 | 1.0% |
| 2 Unit Apartments | 195 | 1.3% |
| 3 or 4 Unit Apartments | 289 | 1.9% |
| 5 to 9 Unit Apartments | 319 | 2.1% |
| 10 or more Apartments | 167 | 1.1% |
| Mobile Home / Other | 2,773 | 18.5% |
| Total | 14,960 | 100.0% |
Housing Structures by Occupancy in Sequoyah County
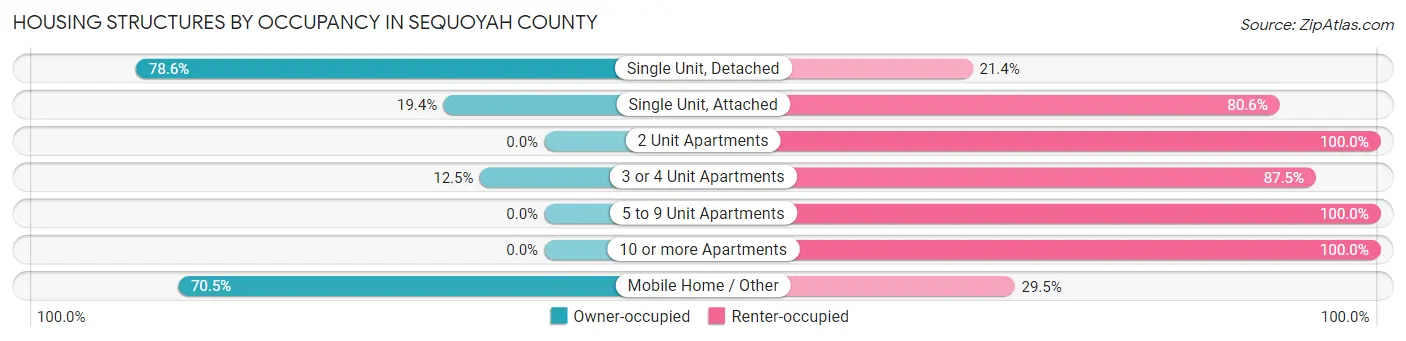
| Structure Type | Owner-occupied | Renter-occupied |
| Single Unit, Detached | 8,699 (78.6%) | 2,374 (21.4%) |
| Single Unit, Attached | 28 (19.4%) | 116 (80.6%) |
| 2 Unit Apartments | 0 (0.0%) | 195 (100.0%) |
| 3 or 4 Unit Apartments | 36 (12.5%) | 253 (87.5%) |
| 5 to 9 Unit Apartments | 0 (0.0%) | 319 (100.0%) |
| 10 or more Apartments | 0 (0.0%) | 167 (100.0%) |
| Mobile Home / Other | 1,954 (70.5%) | 819 (29.5%) |
| Total | 10,717 (71.6%) | 4,243 (28.4%) |
Housing Structures by Number of Rooms in Sequoyah County
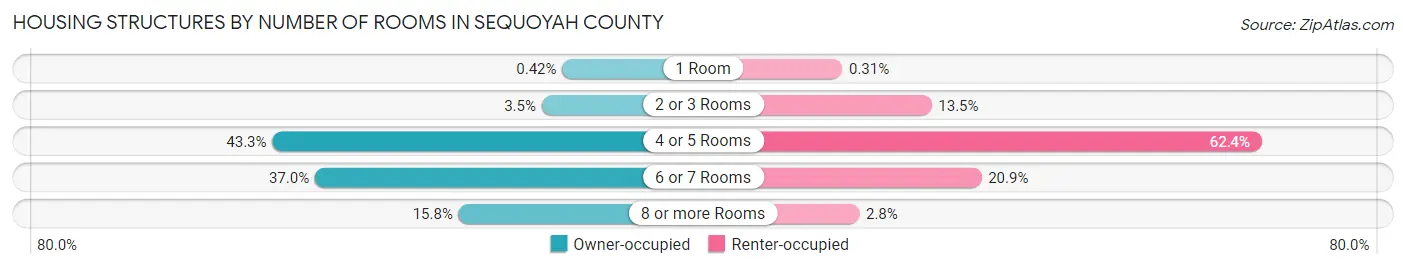
| Number of Rooms | Owner-occupied | Renter-occupied |
| 1 Room | 45 (0.4%) | 13 (0.3%) |
| 2 or 3 Rooms | 371 (3.5%) | 574 (13.5%) |
| 4 or 5 Rooms | 4,645 (43.3%) | 2,649 (62.4%) |
| 6 or 7 Rooms | 3,967 (37.0%) | 887 (20.9%) |
| 8 or more Rooms | 1,689 (15.8%) | 120 (2.8%) |
| Total | 10,717 (100.0%) | 4,243 (100.0%) |
Housing Structure by Heating Type in Sequoyah County
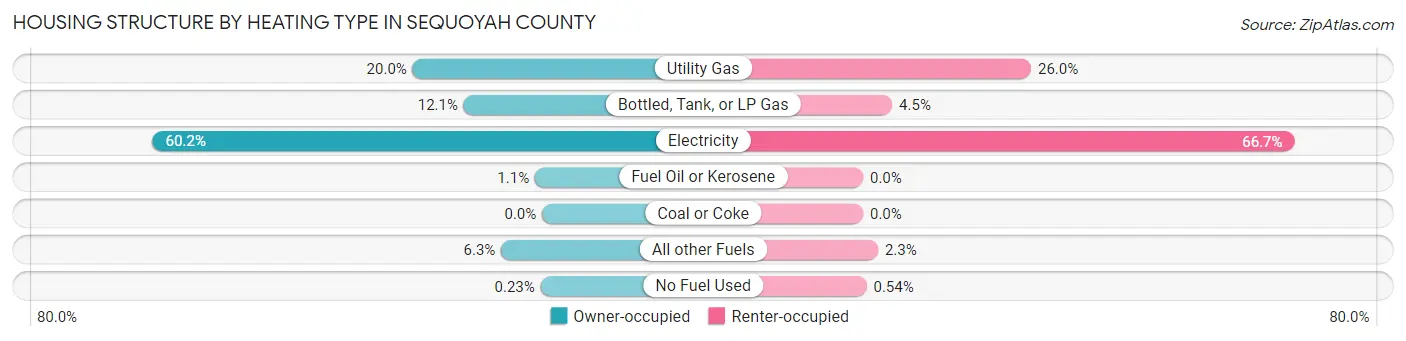
| Heating Type | Owner-occupied | Renter-occupied |
| Utility Gas | 2,145 (20.0%) | 1,102 (26.0%) |
| Bottled, Tank, or LP Gas | 1,297 (12.1%) | 191 (4.5%) |
| Electricity | 6,454 (60.2%) | 2,829 (66.7%) |
| Fuel Oil or Kerosene | 118 (1.1%) | 0 (0.0%) |
| Coal or Coke | 0 (0.0%) | 0 (0.0%) |
| All other Fuels | 678 (6.3%) | 98 (2.3%) |
| No Fuel Used | 25 (0.2%) | 23 (0.5%) |
| Total | 10,717 (100.0%) | 4,243 (100.0%) |
Household Vehicle Usage in Sequoyah County
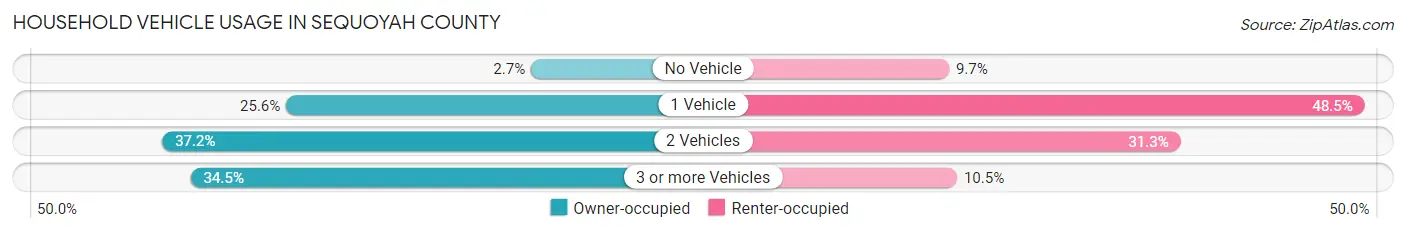
| Vehicles per Household | Owner-occupied | Renter-occupied |
| No Vehicle | 293 (2.7%) | 412 (9.7%) |
| 1 Vehicle | 2,742 (25.6%) | 2,058 (48.5%) |
| 2 Vehicles | 3,984 (37.2%) | 1,329 (31.3%) |
| 3 or more Vehicles | 3,698 (34.5%) | 444 (10.5%) |
| Total | 10,717 (100.0%) | 4,243 (100.0%) |
Real Estate & Mortgages in Sequoyah County
Real Estate and Mortgage Overview in Sequoyah County
| Characteristic | Without Mortgage | With Mortgage |
| Housing Units | 5,815 | 4,902 |
| Median Property Value | $100,800 | $141,000 |
| Median Household Income | $40,064 | $487 |
| Monthly Housing Costs | $394 | $58 |
| Real Estate Taxes | $541 | $297 |
Property Value by Mortgage Status in Sequoyah County
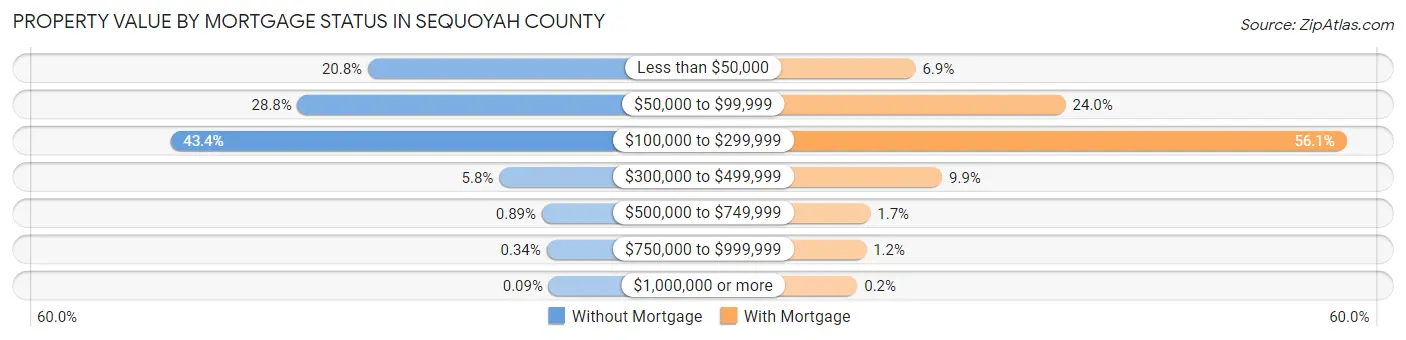
| Property Value | Without Mortgage | With Mortgage |
| Less than $50,000 | 1,207 (20.8%) | 336 (6.9%) |
| $50,000 to $99,999 | 1,675 (28.8%) | 1,177 (24.0%) |
| $100,000 to $299,999 | 2,521 (43.3%) | 2,751 (56.1%) |
| $300,000 to $499,999 | 335 (5.8%) | 485 (9.9%) |
| $500,000 to $749,999 | 52 (0.9%) | 83 (1.7%) |
| $750,000 to $999,999 | 20 (0.3%) | 60 (1.2%) |
| $1,000,000 or more | 5 (0.1%) | 10 (0.2%) |
| Total | 5,815 (100.0%) | 4,902 (100.0%) |
Household Income by Mortgage Status in Sequoyah County
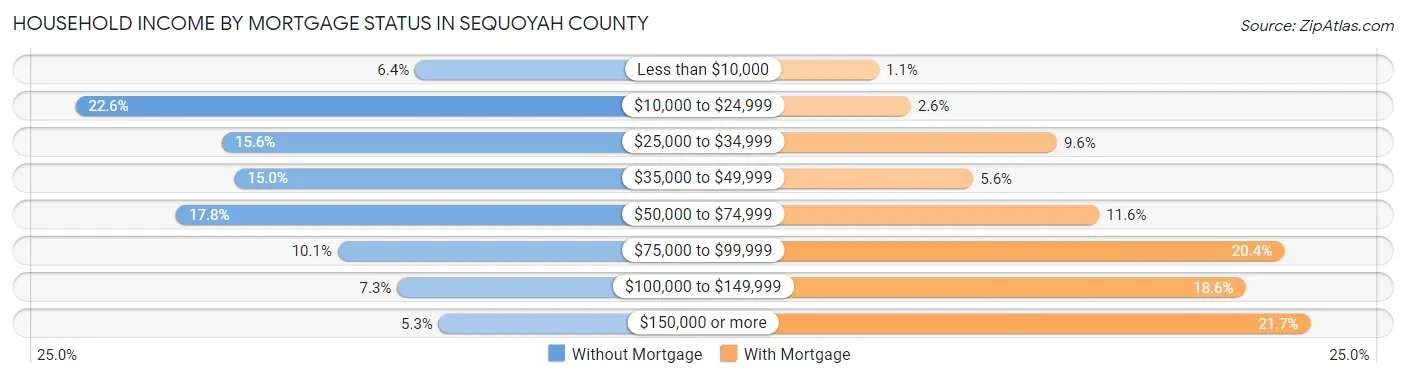
| Household Income | Without Mortgage | With Mortgage |
| Less than $10,000 | 373 (6.4%) | 55 (1.1%) |
| $10,000 to $24,999 | 1,313 (22.6%) | 129 (2.6%) |
| $25,000 to $34,999 | 907 (15.6%) | 470 (9.6%) |
| $35,000 to $49,999 | 872 (15.0%) | 275 (5.6%) |
| $50,000 to $74,999 | 1,034 (17.8%) | 569 (11.6%) |
| $75,000 to $99,999 | 587 (10.1%) | 1,000 (20.4%) |
| $100,000 to $149,999 | 422 (7.3%) | 910 (18.6%) |
| $150,000 or more | 307 (5.3%) | 1,062 (21.7%) |
| Total | 5,815 (100.0%) | 4,902 (100.0%) |
Property Value to Household Income Ratio in Sequoyah County
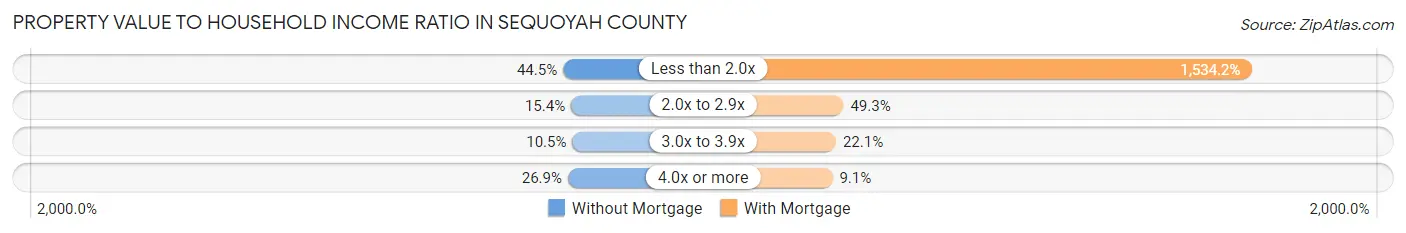
| Value-to-Income Ratio | Without Mortgage | With Mortgage |
| Less than 2.0x | 2,585 (44.5%) | 75,208 (1,534.2%) |
| 2.0x to 2.9x | 894 (15.4%) | 2,416 (49.3%) |
| 3.0x to 3.9x | 611 (10.5%) | 1,083 (22.1%) |
| 4.0x or more | 1,565 (26.9%) | 448 (9.1%) |
| Total | 5,815 (100.0%) | 4,902 (100.0%) |
Real Estate Taxes by Mortgage Status in Sequoyah County

| Property Taxes | Without Mortgage | With Mortgage |
| Less than $800 | 3,565 (61.3%) | 28 (0.6%) |
| $800 to $1,499 | 1,134 (19.5%) | 1,958 (39.9%) |
| $800 to $1,499 | 542 (9.3%) | 1,521 (31.0%) |
| Total | 5,815 (100.0%) | 4,902 (100.0%) |
Health & Disability in Sequoyah County
Health Insurance Coverage by Age in Sequoyah County
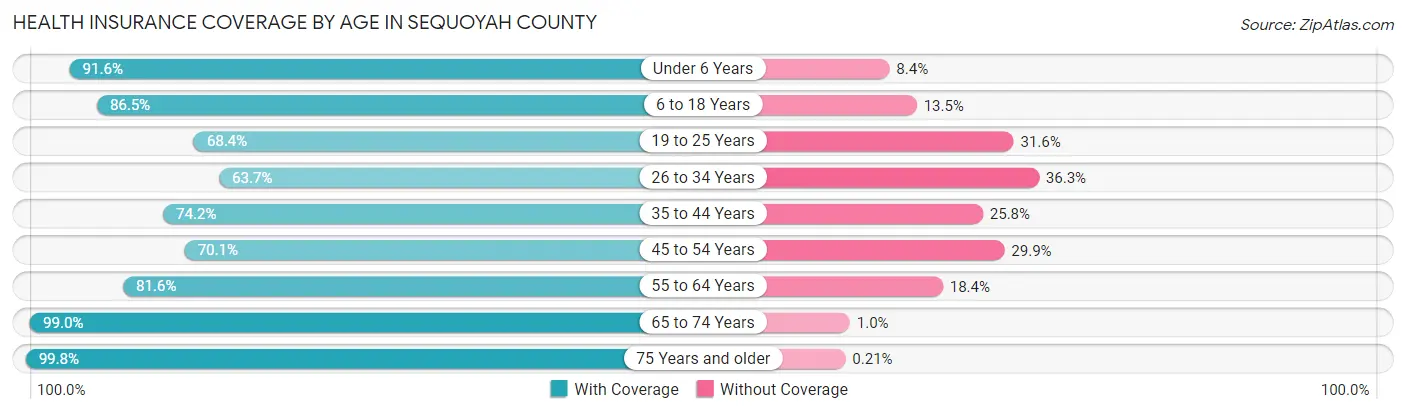
| Age Bracket | With Coverage | Without Coverage |
| Under 6 Years | 2,626 (91.6%) | 241 (8.4%) |
| 6 to 18 Years | 6,035 (86.5%) | 942 (13.5%) |
| 19 to 25 Years | 2,272 (68.4%) | 1,048 (31.6%) |
| 26 to 34 Years | 2,449 (63.7%) | 1,395 (36.3%) |
| 35 to 44 Years | 3,317 (74.2%) | 1,156 (25.8%) |
| 45 to 54 Years | 3,573 (70.1%) | 1,521 (29.9%) |
| 55 to 64 Years | 4,364 (81.6%) | 982 (18.4%) |
| 65 to 74 Years | 4,179 (99.0%) | 44 (1.0%) |
| 75 Years and older | 2,868 (99.8%) | 6 (0.2%) |
| Total | 31,683 (81.2%) | 7,335 (18.8%) |
Health Insurance Coverage by Citizenship Status in Sequoyah County
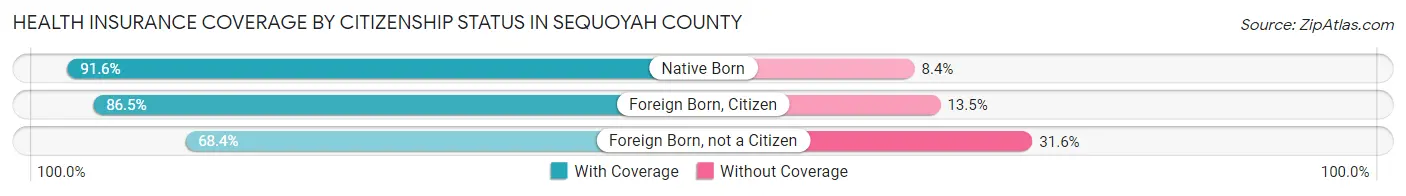
| Citizenship Status | With Coverage | Without Coverage |
| Native Born | 2,626 (91.6%) | 241 (8.4%) |
| Foreign Born, Citizen | 6,035 (86.5%) | 942 (13.5%) |
| Foreign Born, not a Citizen | 2,272 (68.4%) | 1,048 (31.6%) |
Health Insurance Coverage by Household Income in Sequoyah County
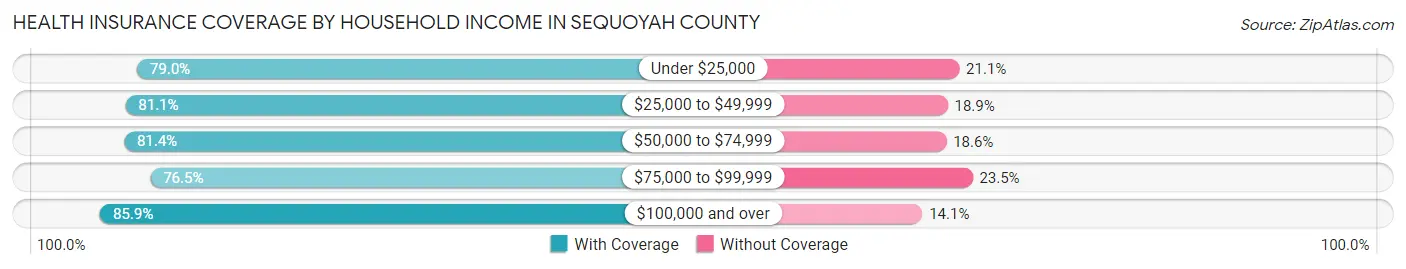
| Household Income | With Coverage | Without Coverage |
| Under $25,000 | 5,938 (78.9%) | 1,583 (21.0%) |
| $25,000 to $49,999 | 7,633 (81.1%) | 1,776 (18.9%) |
| $50,000 to $74,999 | 6,500 (81.4%) | 1,487 (18.6%) |
| $75,000 to $99,999 | 4,098 (76.5%) | 1,262 (23.5%) |
| $100,000 and over | 7,454 (85.9%) | 1,227 (14.1%) |
Public vs Private Health Insurance Coverage by Age in Sequoyah County
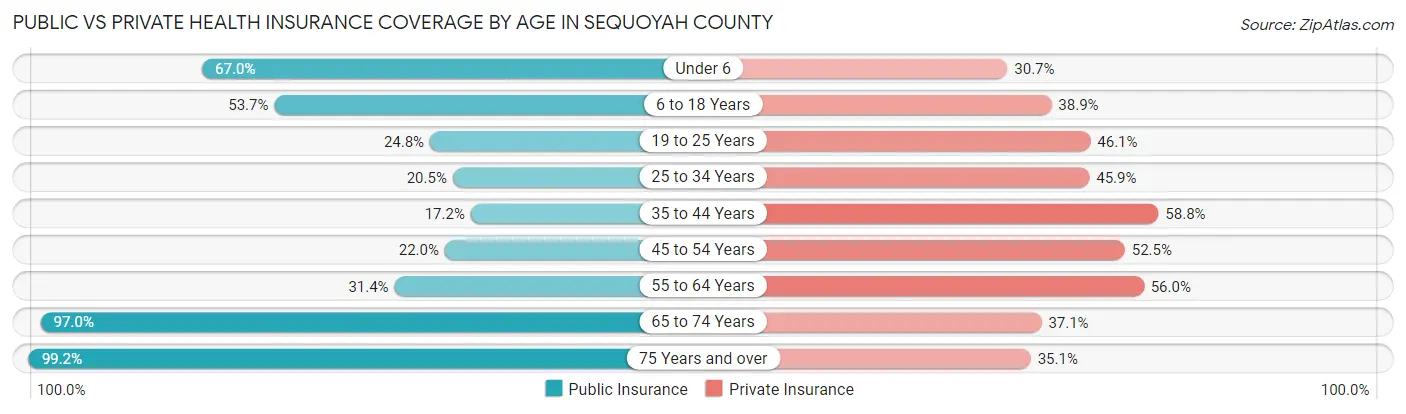
| Age Bracket | Public Insurance | Private Insurance |
| Under 6 | 1,922 (67.0%) | 881 (30.7%) |
| 6 to 18 Years | 3,744 (53.7%) | 2,715 (38.9%) |
| 19 to 25 Years | 822 (24.8%) | 1,532 (46.1%) |
| 25 to 34 Years | 789 (20.5%) | 1,766 (45.9%) |
| 35 to 44 Years | 769 (17.2%) | 2,629 (58.8%) |
| 45 to 54 Years | 1,121 (22.0%) | 2,676 (52.5%) |
| 55 to 64 Years | 1,676 (31.4%) | 2,996 (56.0%) |
| 65 to 74 Years | 4,098 (97.0%) | 1,565 (37.1%) |
| 75 Years and over | 2,852 (99.2%) | 1,008 (35.1%) |
| Total | 17,793 (45.6%) | 17,768 (45.5%) |
Disability Status by Sex by Age in Sequoyah County
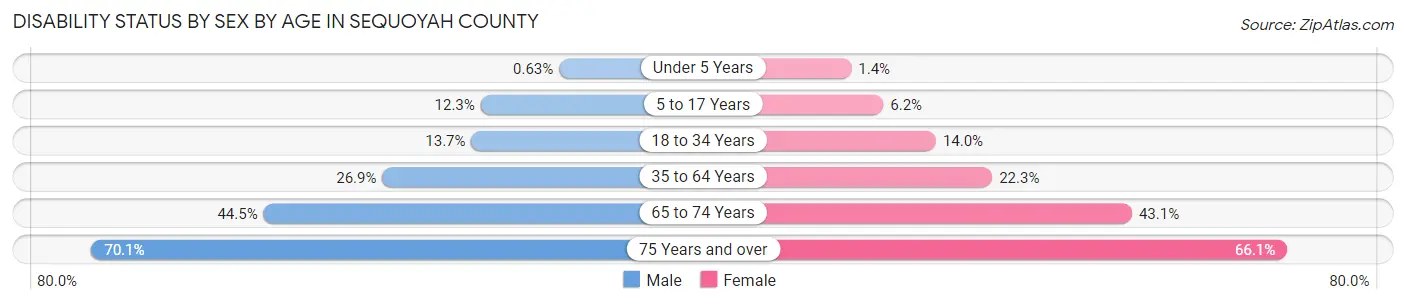
| Age Bracket | Male | Female |
| Under 5 Years | 8 (0.6%) | 17 (1.4%) |
| 5 to 17 Years | 436 (12.3%) | 205 (6.2%) |
| 18 to 34 Years | 526 (13.7%) | 534 (14.0%) |
| 35 to 64 Years | 1,991 (26.9%) | 1,677 (22.3%) |
| 65 to 74 Years | 904 (44.5%) | 945 (43.1%) |
| 75 Years and over | 860 (70.1%) | 1,089 (66.1%) |
Disability Class by Sex by Age in Sequoyah County
Disability Class: Hearing Difficulty
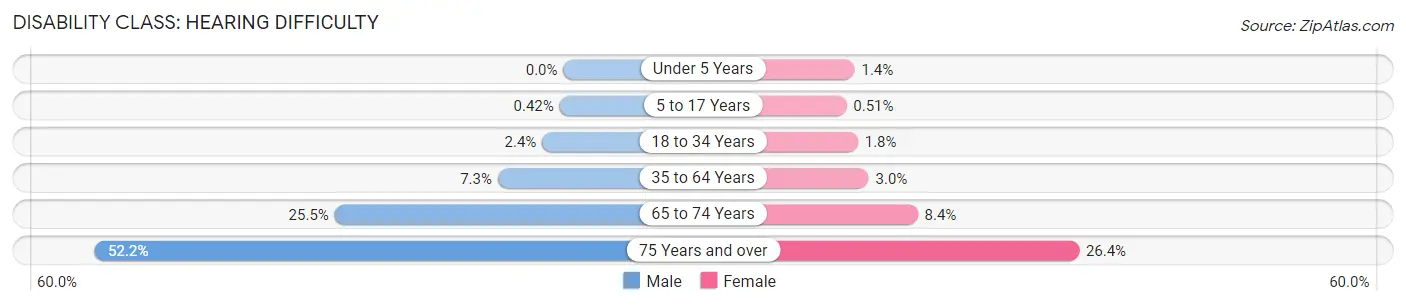
| Age Bracket | Male | Female |
| Under 5 Years | 0 (0.0%) | 17 (1.4%) |
| 5 to 17 Years | 15 (0.4%) | 17 (0.5%) |
| 18 to 34 Years | 91 (2.4%) | 68 (1.8%) |
| 35 to 64 Years | 541 (7.3%) | 224 (3.0%) |
| 65 to 74 Years | 517 (25.5%) | 185 (8.4%) |
| 75 Years and over | 640 (52.2%) | 435 (26.4%) |
Disability Class: Vision Difficulty

| Age Bracket | Male | Female |
| Under 5 Years | 8 (0.6%) | 17 (1.4%) |
| 5 to 17 Years | 87 (2.5%) | 35 (1.1%) |
| 18 to 34 Years | 37 (1.0%) | 109 (2.9%) |
| 35 to 64 Years | 214 (2.9%) | 307 (4.1%) |
| 65 to 74 Years | 127 (6.3%) | 169 (7.7%) |
| 75 Years and over | 164 (13.4%) | 142 (8.6%) |
Disability Class: Cognitive Difficulty
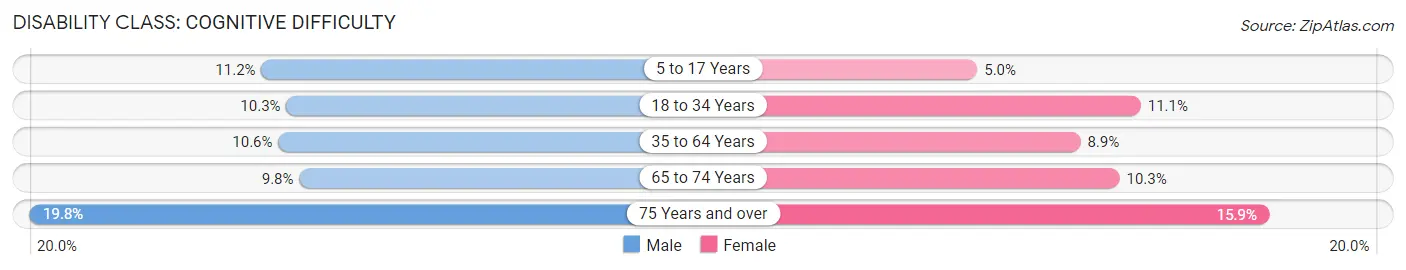
| Age Bracket | Male | Female |
| 5 to 17 Years | 398 (11.2%) | 167 (5.0%) |
| 18 to 34 Years | 396 (10.3%) | 424 (11.1%) |
| 35 to 64 Years | 784 (10.6%) | 665 (8.9%) |
| 65 to 74 Years | 199 (9.8%) | 226 (10.3%) |
| 75 Years and over | 243 (19.8%) | 261 (15.9%) |
Disability Class: Ambulatory Difficulty
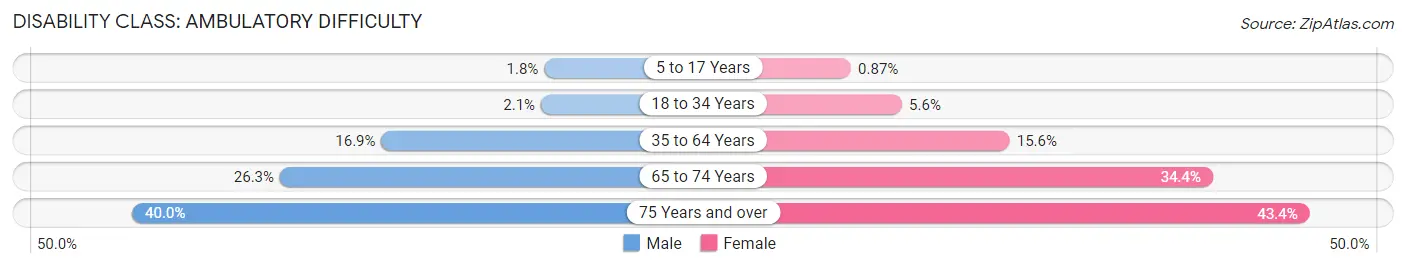
| Age Bracket | Male | Female |
| 5 to 17 Years | 63 (1.8%) | 29 (0.9%) |
| 18 to 34 Years | 80 (2.1%) | 214 (5.6%) |
| 35 to 64 Years | 1,251 (16.9%) | 1,170 (15.6%) |
| 65 to 74 Years | 534 (26.3%) | 755 (34.4%) |
| 75 Years and over | 491 (40.0%) | 715 (43.4%) |
Disability Class: Self-Care Difficulty
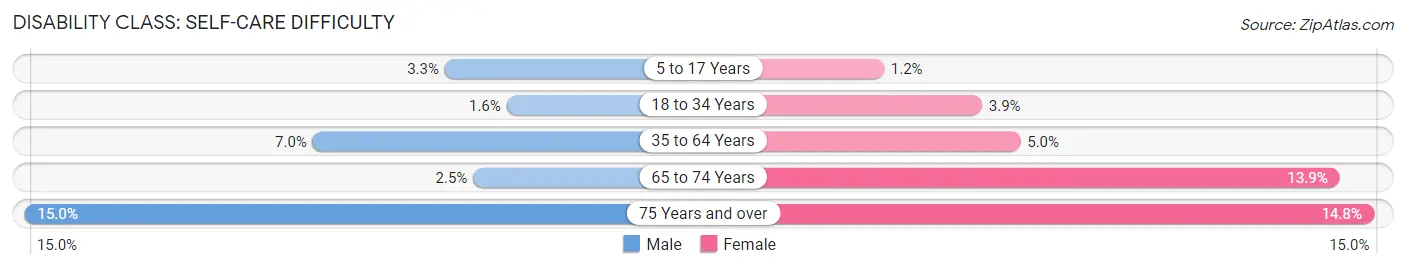
| Age Bracket | Male | Female |
| 5 to 17 Years | 117 (3.3%) | 39 (1.2%) |
| 18 to 34 Years | 61 (1.6%) | 149 (3.9%) |
| 35 to 64 Years | 517 (7.0%) | 373 (5.0%) |
| 65 to 74 Years | 51 (2.5%) | 304 (13.9%) |
| 75 Years and over | 184 (15.0%) | 244 (14.8%) |
Technology Access in Sequoyah County
Computing Device Access in Sequoyah County
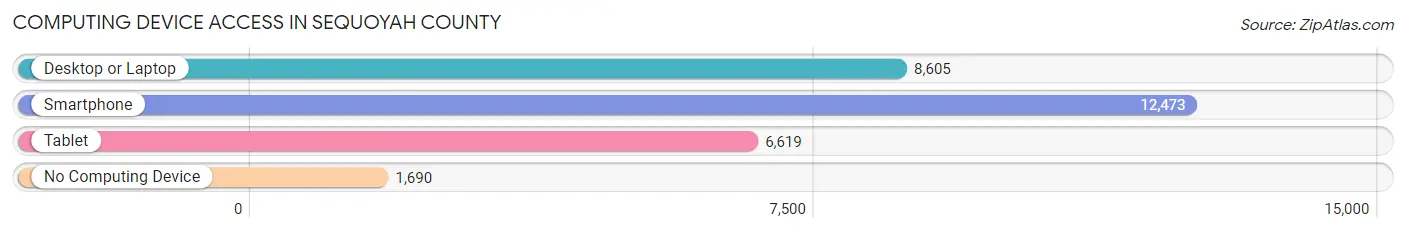
| Device Type | # Households | % Households |
| Desktop or Laptop | 8,605 | 57.5% |
| Smartphone | 12,473 | 83.4% |
| Tablet | 6,619 | 44.2% |
| No Computing Device | 1,690 | 11.3% |
| Total | 14,960 | 100.0% |
Internet Access in Sequoyah County
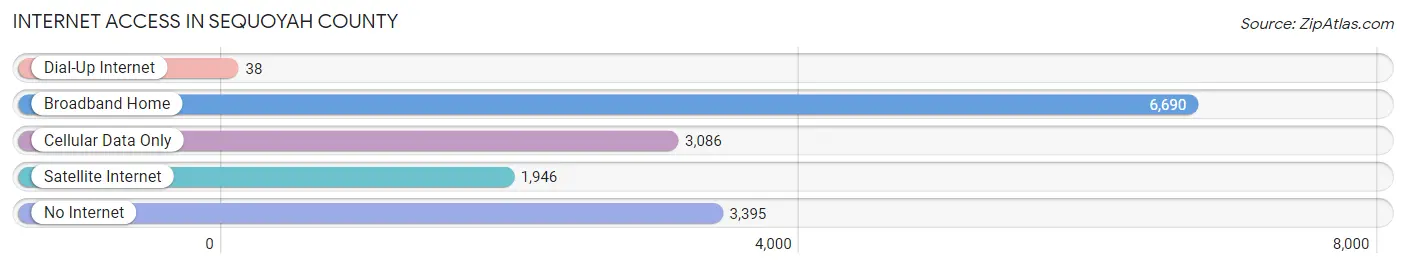
| Internet Type | # Households | % Households |
| Dial-Up Internet | 38 | 0.3% |
| Broadband Home | 6,690 | 44.7% |
| Cellular Data Only | 3,086 | 20.6% |
| Satellite Internet | 1,946 | 13.0% |
| No Internet | 3,395 | 22.7% |
| Total | 14,960 | 100.0% |
Sequoyah County Summary
Situated in the eastern part of Oklahoma, Sequoyah County is a county with a rich history, diverse geography, and a vibrant economy. With a population of 41,079 as of the 2010 census, Sequoyah County is the second most populous county in the state.
History
Sequoyah County was created in 1907 from the former Goingsnake and Illinois Districts of the Cherokee Nation. The county was named after Sequoyah, a Cherokee silversmith who developed the Cherokee syllabary, a writing system for the Cherokee language.
The county was originally home to the Cherokee, Choctaw, and Creek tribes, who were forcibly removed from their ancestral lands in the 1830s as part of the Indian Removal Act. After the removal, the area was opened up to white settlers, who began to move in and establish farms and businesses.
In the early 20th century, the county was a major center of oil production, with the first oil well drilled in the county in 1907. The oil boom brought an influx of people and money to the area, and the county’s population grew rapidly.
Geography
Sequoyah County is located in the eastern part of Oklahoma, bordered by Adair County to the north, Cherokee County to the east, Muskogee County to the south, and Wagoner County to the west. The county covers an area of 745 square miles, with the Arkansas River forming its eastern border.
The county is mostly rural, with the majority of the land used for farming and ranching. The terrain is mostly flat, with some rolling hills in the western part of the county. The highest point in the county is located in the northwest corner, at an elevation of 1,068 feet.
Economy
Sequoyah County’s economy is largely based on agriculture, with the majority of the land used for farming and ranching. The county is also home to several manufacturing and industrial businesses, including a paper mill, a steel mill, and a plastics plant.
The county is also home to several tourist attractions, including the Sequoyah National Wildlife Refuge, the Sequoyah State Park, and the Tenkiller Ferry Lake.
Demographics
As of the 2010 census, the population of Sequoyah County was 41,079, with a population density of 55 people per square mile. The racial makeup of the county was 79.3% White, 8.2% Native American, 5.2% Black or African American, 0.7% Asian, 0.2% Pacific Islander, and 4.6% from other races.
The median household income in the county was $37,945, and the median family income was $45,945. The per capita income was $19,945. About 16.2% of the population was below the poverty line.
Sequoyah County is a diverse and vibrant county with a rich history, diverse geography, and a vibrant economy. The county is home to a variety of industries, tourist attractions, and cultural attractions, making it an attractive place to live and work.
Common Questions
What is the Total Population of Sequoyah County?
Total Population of Sequoyah County is 39,538.
What is the Total Male Population of Sequoyah County?
Total Male Population of Sequoyah County is 19,621.
What is the Total Female Population of Sequoyah County?
Total Female Population of Sequoyah County is 19,917.
What is the Ratio of Males per 100 Females in Sequoyah County?
There are 98.51 Males per 100 Females in Sequoyah County.
What is the Ratio of Females per 100 Males in Sequoyah County?
There are 101.51 Females per 100 Males in Sequoyah County.
What is the Median Population Age in Sequoyah County?
Median Population Age in Sequoyah County is 40.8 Years.
What is the Average Family Size in Sequoyah County
Average Family Size in Sequoyah County is 3.2 People.
What is the Average Household Size in Sequoyah County
Average Household Size in Sequoyah County is 2.6 People.
What is Per Capita Income in Sequoyah County?
Per Capita income in Sequoyah County is $24,708.
What is the Median Family Income in Sequoyah County?
Median Family Income in Sequoyah County is $60,823.
What is the Median Household income in Sequoyah County?
Median Household Income in Sequoyah County is $47,494.
What is Income or Wage Gap in Sequoyah County?
Income or Wage Gap in Sequoyah County is 34.6%.
Women in Sequoyah County earn 65.4 cents for every dollar earned by a man.
What is Family Income Deficit in Sequoyah County?
Family Income Deficit in Sequoyah County is $11,044.
Families that are below poverty line in Sequoyah County earn $11,044 less on average than the poverty threshold level.
What is Inequality or Gini Index in Sequoyah County?
Inequality or Gini Index in Sequoyah County is 0.45.
How Large is the Labor Force in Sequoyah County?
There are 16,187 People in the Labor Forcein in Sequoyah County.
What is the Percentage of People in the Labor Force in Sequoyah County?
51.7% of People are in the Labor Force in Sequoyah County.
What is the Unemployment Rate in Sequoyah County?
Unemployment Rate in Sequoyah County is 5.2%.