Rogers County, OK
Rogers County Map
Rogers County Overview
95,870
TOTAL POPULATION
48,039
MALE POPULATION
47,831
FEMALE POPULATION
100.43
MALES / 100 FEMALES
99.57
FEMALES / 100 MALES
39.3
MEDIAN AGE
3.1
AVG FAMILY SIZE
2.7
AVG HOUSEHOLD SIZE
$36,885
PER CAPITA INCOME
$91,954
AVG FAMILY INCOME
$75,312
AVG HOUSEHOLD INCOME
34.6%
WAGE / INCOME GAP [ % ]
65.4¢/ $1
WAGE / INCOME GAP [ $ ]
$10,494
FAMILY INCOME DEFICIT
0.41
INEQUALITY / GINI INDEX
48,814
LABOR FORCE [ PEOPLE ]
63.9%
PERCENT IN LABOR FORCE
4.7%
UNEMPLOYMENT RATE
Rogers County Area Codes
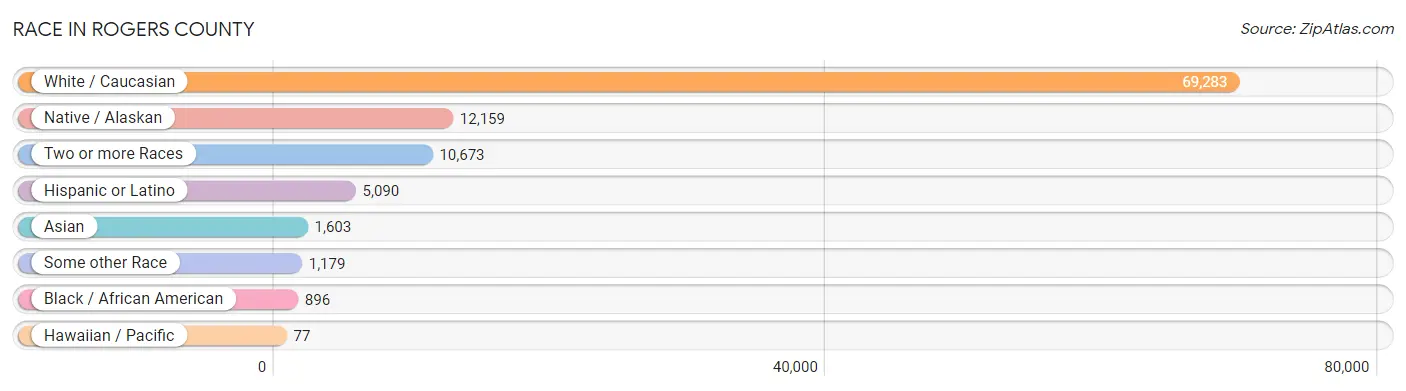
Race in Rogers County
The most populous races in Rogers County are White / Caucasian (69,283 | 72.3%), Native / Alaskan (12,159 | 12.7%), and Two or more Races (10,673 | 11.1%).
| Race | # Population | % Population |
| Asian | 1,603 | 1.7% |
| Black / African American | 896 | 0.9% |
| Hawaiian / Pacific | 77 | 0.1% |
| Hispanic or Latino | 5,090 | 5.3% |
| Native / Alaskan | 12,159 | 12.7% |
| White / Caucasian | 69,283 | 72.3% |
| Two or more Races | 10,673 | 11.1% |
| Some other Race | 1,179 | 1.2% |
| Total | 95,870 | 100.0% |
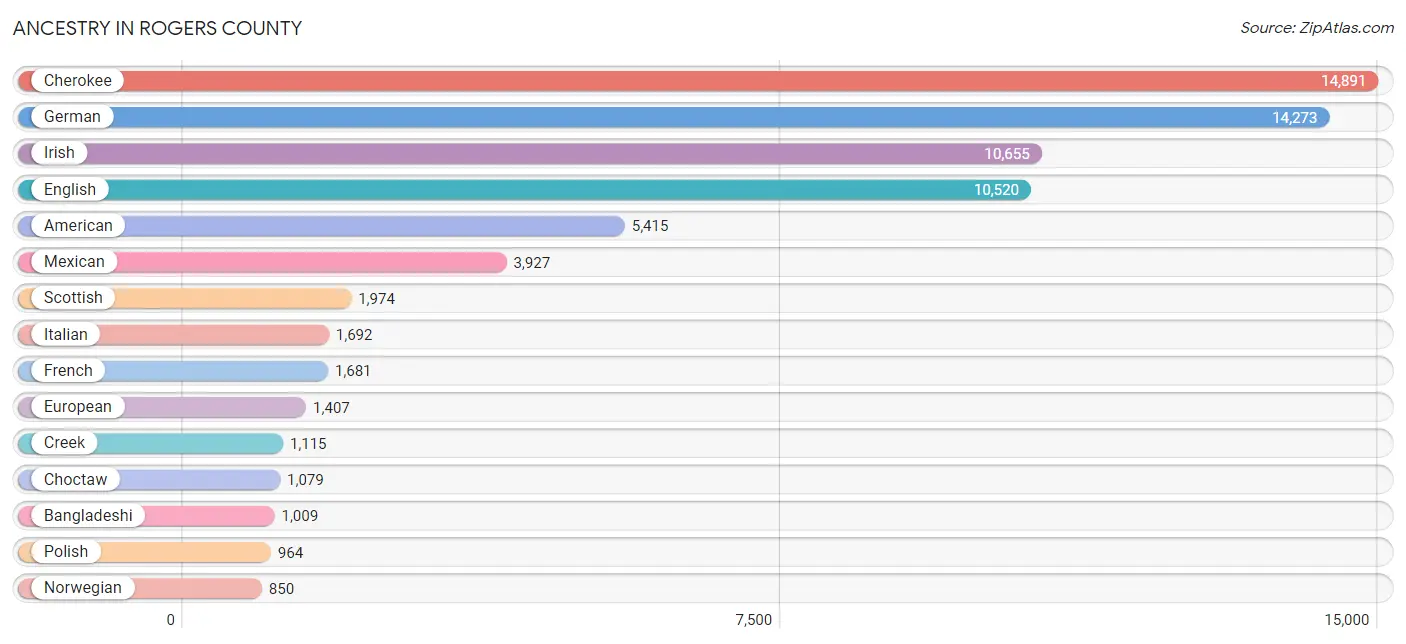
Ancestry in Rogers County
The most populous ancestries reported in Rogers County are Cherokee (14,891 | 15.5%), German (14,273 | 14.9%), Irish (10,655 | 11.1%), English (10,520 | 11.0%), and American (5,415 | 5.7%), together accounting for 58.2% of all Rogers County residents.
| Ancestry | # Population | % Population |
| African | 18 | 0.0% |
| Alaska Native | 5 | 0.0% |
| Albanian | 25 | 0.0% |
| Alsatian | 10 | 0.0% |
| American | 5,415 | 5.7% |
| Apache | 47 | 0.1% |
| Arab | 80 | 0.1% |
| Armenian | 49 | 0.1% |
| Austrian | 32 | 0.0% |
| Bangladeshi | 1,009 | 1.1% |
| Belgian | 78 | 0.1% |
| Belizean | 12 | 0.0% |
| Bhutanese | 89 | 0.1% |
| Blackfeet | 23 | 0.0% |
| Bolivian | 36 | 0.0% |
| Brazilian | 31 | 0.0% |
| British | 502 | 0.5% |
| British West Indian | 8 | 0.0% |
| Bulgarian | 19 | 0.0% |
| Burmese | 118 | 0.1% |
| Cajun | 12 | 0.0% |
| Canadian | 68 | 0.1% |
| Celtic | 6 | 0.0% |
| Central American | 221 | 0.2% |
| Central American Indian | 99 | 0.1% |
| Cherokee | 14,891 | 15.5% |
| Cheyenne | 6 | 0.0% |
| Chickasaw | 263 | 0.3% |
| Chippewa | 153 | 0.2% |
| Choctaw | 1,079 | 1.1% |
| Colombian | 124 | 0.1% |
| Comanche | 60 | 0.1% |
| Costa Rican | 13 | 0.0% |
| Creek | 1,115 | 1.2% |
| Croatian | 15 | 0.0% |
| Cuban | 77 | 0.1% |
| Czech | 255 | 0.3% |
| Czechoslovakian | 69 | 0.1% |
| Danish | 420 | 0.4% |
| Delaware | 191 | 0.2% |
| Dominican | 45 | 0.1% |
| Dutch | 803 | 0.8% |
| Dutch West Indian | 108 | 0.1% |
| Eastern European | 78 | 0.1% |
| Ecuadorian | 7 | 0.0% |
| English | 10,520 | 11.0% |
| Estonian | 36 | 0.0% |
| European | 1,407 | 1.5% |
| Fijian | 20 | 0.0% |
| Finnish | 87 | 0.1% |
| French | 1,681 | 1.8% |
| French American Indian | 19 | 0.0% |
| French Canadian | 210 | 0.2% |
| German | 14,273 | 14.9% |
| Greek | 159 | 0.2% |
| Guamanian / Chamorro | 36 | 0.0% |
| Guatemalan | 16 | 0.0% |
| Haitian | 17 | 0.0% |
| Honduran | 93 | 0.1% |
| Hungarian | 178 | 0.2% |
| Icelander | 8 | 0.0% |
| Indian (Asian) | 95 | 0.1% |
| Inupiat | 69 | 0.1% |
| Iranian | 20 | 0.0% |
| Irish | 10,655 | 11.1% |
| Iroquois | 75 | 0.1% |
| Israeli | 6 | 0.0% |
| Italian | 1,692 | 1.8% |
| Jamaican | 7 | 0.0% |
| Kiowa | 31 | 0.0% |
| Korean | 206 | 0.2% |
| Laotian | 4 | 0.0% |
| Latvian | 14 | 0.0% |
| Lebanese | 58 | 0.1% |
| Liberian | 4 | 0.0% |
| Lithuanian | 47 | 0.1% |
| Lumbee | 7 | 0.0% |
| Malaysian | 66 | 0.1% |
| Mexican | 3,927 | 4.1% |
| Mexican American Indian | 34 | 0.0% |
| Native Hawaiian | 15 | 0.0% |
| Navajo | 68 | 0.1% |
| Nicaraguan | 15 | 0.0% |
| Nigerian | 17 | 0.0% |
| Northern European | 220 | 0.2% |
| Norwegian | 850 | 0.9% |
| Osage | 387 | 0.4% |
| Ottawa | 79 | 0.1% |
| Pakistani | 10 | 0.0% |
| Panamanian | 6 | 0.0% |
| Pennsylvania German | 65 | 0.1% |
| Peruvian | 63 | 0.1% |
| Polish | 964 | 1.0% |
| Portuguese | 191 | 0.2% |
| Potawatomi | 76 | 0.1% |
| Pueblo | 9 | 0.0% |
| Puerto Rican | 328 | 0.3% |
| Romanian | 4 | 0.0% |
| Russian | 282 | 0.3% |
| Salvadoran | 78 | 0.1% |
| Samoan | 18 | 0.0% |
| Scandinavian | 262 | 0.3% |
| Scotch-Irish | 771 | 0.8% |
| Scottish | 1,974 | 2.1% |
| Seminole | 159 | 0.2% |
| Shoshone | 9 | 0.0% |
| Sierra Leonean | 33 | 0.0% |
| Sioux | 64 | 0.1% |
| Slavic | 32 | 0.0% |
| Slovak | 30 | 0.0% |
| Slovene | 21 | 0.0% |
| South African | 2 | 0.0% |
| South American | 230 | 0.2% |
| Spaniard | 80 | 0.1% |
| Spanish | 34 | 0.0% |
| Sri Lankan | 187 | 0.2% |
| Subsaharan African | 85 | 0.1% |
| Swedish | 480 | 0.5% |
| Swiss | 147 | 0.2% |
| Syrian | 4 | 0.0% |
| Thai | 57 | 0.1% |
| Turkish | 6 | 0.0% |
| Ukrainian | 29 | 0.0% |
| Vietnamese | 31 | 0.0% |
| Welsh | 443 | 0.5% |
| Yugoslavian | 29 | 0.0% |
| Yup'ik | 5 | 0.0% | View All 127 Rows |
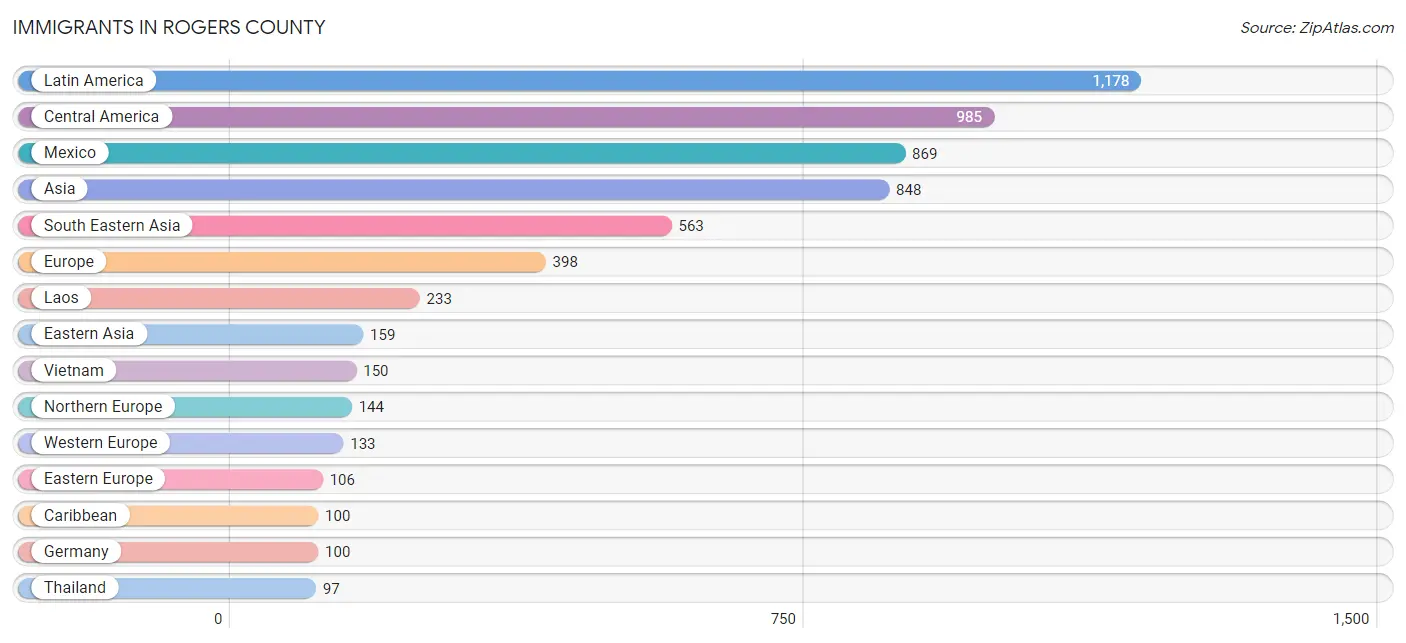
Immigrants in Rogers County
The most numerous immigrant groups reported in Rogers County came from Latin America (1,178 | 1.2%), Central America (985 | 1.0%), Mexico (869 | 0.9%), Asia (848 | 0.9%), and South Eastern Asia (563 | 0.6%), together accounting for 4.6% of all Rogers County residents.
| Immigration Origin | # Population | % Population |
| Africa | 81 | 0.1% |
| Argentina | 7 | 0.0% |
| Asia | 848 | 0.9% |
| Bangladesh | 27 | 0.0% |
| Belize | 12 | 0.0% |
| Bosnia and Herzegovina | 11 | 0.0% |
| Brazil | 10 | 0.0% |
| Bulgaria | 6 | 0.0% |
| Canada | 65 | 0.1% |
| Caribbean | 100 | 0.1% |
| Central America | 985 | 1.0% |
| China | 78 | 0.1% |
| Colombia | 46 | 0.1% |
| Costa Rica | 8 | 0.0% |
| Cuba | 41 | 0.0% |
| Czechoslovakia | 1 | 0.0% |
| Denmark | 8 | 0.0% |
| Dominican Republic | 30 | 0.0% |
| Eastern Africa | 16 | 0.0% |
| Eastern Asia | 159 | 0.2% |
| Eastern Europe | 106 | 0.1% |
| El Salvador | 12 | 0.0% |
| England | 40 | 0.0% |
| Europe | 398 | 0.4% |
| France | 20 | 0.0% |
| Germany | 100 | 0.1% |
| Ghana | 5 | 0.0% |
| Guatemala | 35 | 0.0% |
| Haiti | 7 | 0.0% |
| Honduras | 37 | 0.0% |
| India | 9 | 0.0% |
| Indonesia | 4 | 0.0% |
| Iran | 20 | 0.0% |
| Ireland | 15 | 0.0% |
| Italy | 15 | 0.0% |
| Japan | 18 | 0.0% |
| Korea | 63 | 0.1% |
| Laos | 233 | 0.2% |
| Latin America | 1,178 | 1.2% |
| Latvia | 14 | 0.0% |
| Lebanon | 25 | 0.0% |
| Liberia | 4 | 0.0% |
| Mexico | 869 | 0.9% |
| Netherlands | 13 | 0.0% |
| Nicaragua | 6 | 0.0% |
| Nigeria | 4 | 0.0% |
| Northern Europe | 144 | 0.2% |
| Oceania | 13 | 0.0% |
| Panama | 6 | 0.0% |
| Peru | 30 | 0.0% |
| Philippines | 79 | 0.1% |
| Poland | 3 | 0.0% |
| Russia | 41 | 0.0% |
| Saudi Arabia | 11 | 0.0% |
| Scotland | 22 | 0.0% |
| Sierra Leone | 23 | 0.0% |
| South Africa | 29 | 0.0% |
| South America | 93 | 0.1% |
| South Central Asia | 84 | 0.1% |
| South Eastern Asia | 563 | 0.6% |
| Southern Europe | 15 | 0.0% |
| Sri Lanka | 7 | 0.0% |
| Thailand | 97 | 0.1% |
| Trinidad and Tobago | 22 | 0.0% |
| Turkey | 6 | 0.0% |
| Ukraine | 9 | 0.0% |
| Vietnam | 150 | 0.2% |
| Western Africa | 36 | 0.0% |
| Western Asia | 42 | 0.0% |
| Western Europe | 133 | 0.1% | View All 70 Rows |
Sex and Age in Rogers County
Sex and Age in Rogers County
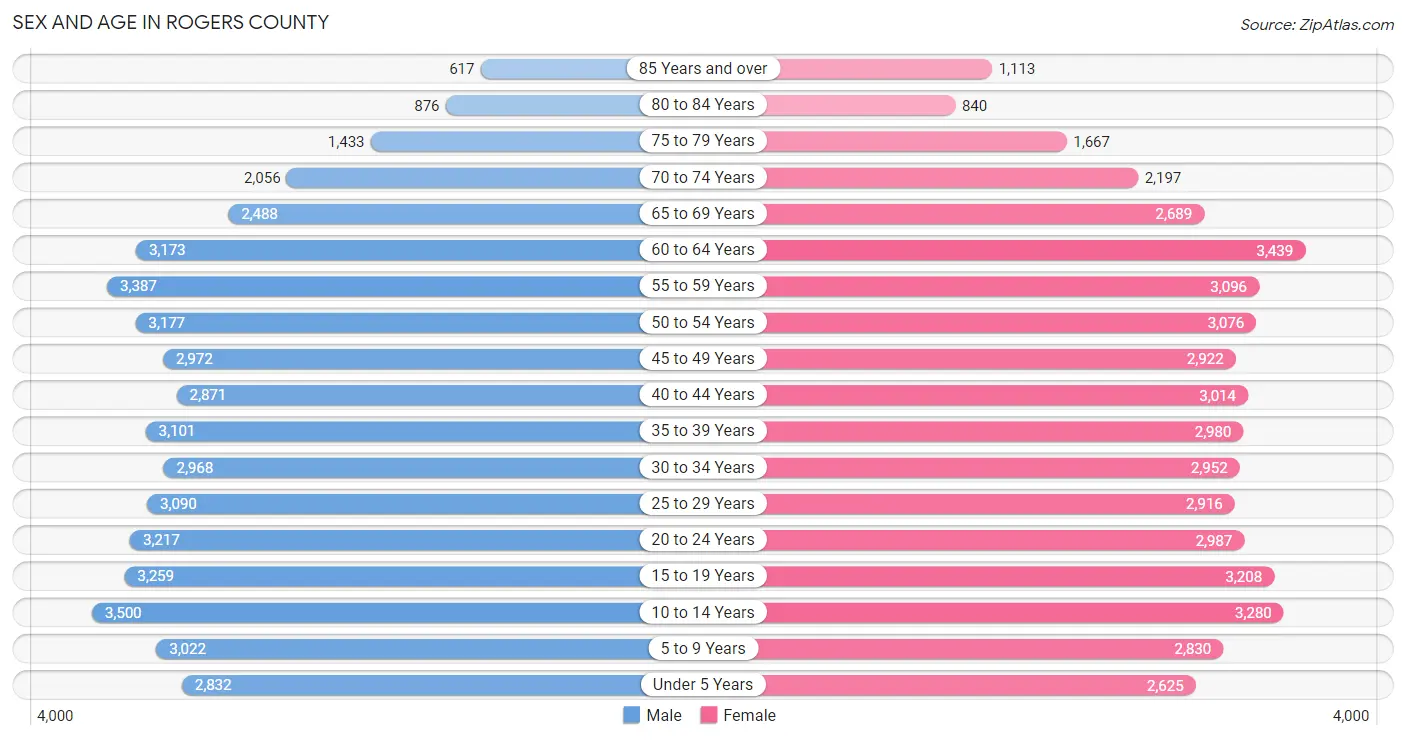
The most populous age groups in Rogers County are 10 to 14 Years (3,500 | 7.3%) for men and 60 to 64 Years (3,439 | 7.2%) for women.
| Age Bracket | Male | Female |
| Under 5 Years | 2,832 (5.9%) | 2,625 (5.5%) |
| 5 to 9 Years | 3,022 (6.3%) | 2,830 (5.9%) |
| 10 to 14 Years | 3,500 (7.3%) | 3,280 (6.9%) |
| 15 to 19 Years | 3,259 (6.8%) | 3,208 (6.7%) |
| 20 to 24 Years | 3,217 (6.7%) | 2,987 (6.2%) |
| 25 to 29 Years | 3,090 (6.4%) | 2,916 (6.1%) |
| 30 to 34 Years | 2,968 (6.2%) | 2,952 (6.2%) |
| 35 to 39 Years | 3,101 (6.5%) | 2,980 (6.2%) |
| 40 to 44 Years | 2,871 (6.0%) | 3,014 (6.3%) |
| 45 to 49 Years | 2,972 (6.2%) | 2,922 (6.1%) |
| 50 to 54 Years | 3,177 (6.6%) | 3,076 (6.4%) |
| 55 to 59 Years | 3,387 (7.0%) | 3,096 (6.5%) |
| 60 to 64 Years | 3,173 (6.6%) | 3,439 (7.2%) |
| 65 to 69 Years | 2,488 (5.2%) | 2,689 (5.6%) |
| 70 to 74 Years | 2,056 (4.3%) | 2,197 (4.6%) |
| 75 to 79 Years | 1,433 (3.0%) | 1,667 (3.5%) |
| 80 to 84 Years | 876 (1.8%) | 840 (1.8%) |
| 85 Years and over | 617 (1.3%) | 1,113 (2.3%) |
| Total | 48,039 (100.0%) | 47,831 (100.0%) |
Families and Households in Rogers County
Median Family Size in Rogers County
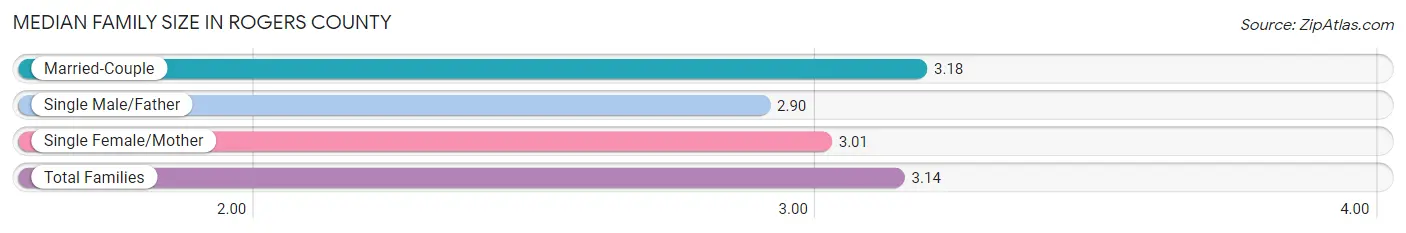
The median family size in Rogers County is 3.14 persons per family, with married-couple families (20,483 | 79.8%) accounting for the largest median family size of 3.18 persons per family. On the other hand, single male/father families (1,743 | 6.8%) represent the smallest median family size with 2.90 persons per family.
| Family Type | # Families | Family Size |
| Married-Couple | 20,483 (79.8%) | 3.18 |
| Single Male/Father | 1,743 (6.8%) | 2.90 |
| Single Female/Mother | 3,434 (13.4%) | 3.01 |
| Total Families | 25,660 (100.0%) | 3.14 |
Median Household Size in Rogers County
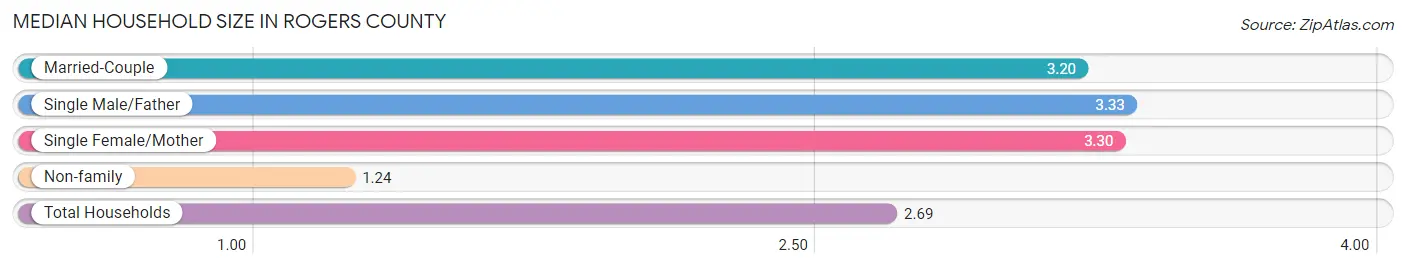
The median household size in Rogers County is 2.69 persons per household, with single male/father households (1,743 | 5.0%) accounting for the largest median household size of 3.33 persons per household. non-family households (9,441 | 26.9%) represent the smallest median household size with 1.24 persons per household.
| Household Type | # Households | Household Size |
| Married-Couple | 20,483 (58.4%) | 3.20 |
| Single Male/Father | 1,743 (5.0%) | 3.33 |
| Single Female/Mother | 3,434 (9.8%) | 3.30 |
| Non-family | 9,441 (26.9%) | 1.24 |
| Total Households | 35,101 (100.0%) | 2.69 |
Household Size by Marriage Status in Rogers County
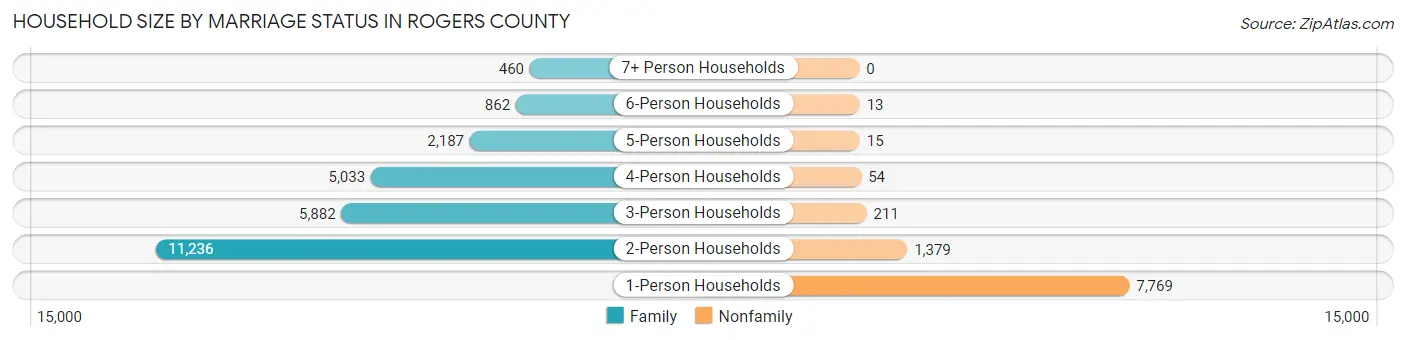
Out of a total of 35,101 households in Rogers County, 25,660 (73.1%) are family households, while 9,441 (26.9%) are nonfamily households. The most numerous type of family households are 2-person households, comprising 11,236, and the most common type of nonfamily households are 1-person households, comprising 7,769.
| Household Size | Family Households | Nonfamily Households |
| 1-Person Households | - | 7,769 (22.1%) |
| 2-Person Households | 11,236 (32.0%) | 1,379 (3.9%) |
| 3-Person Households | 5,882 (16.8%) | 211 (0.6%) |
| 4-Person Households | 5,033 (14.3%) | 54 (0.2%) |
| 5-Person Households | 2,187 (6.2%) | 15 (0.0%) |
| 6-Person Households | 862 (2.5%) | 13 (0.0%) |
| 7+ Person Households | 460 (1.3%) | 0 (0.0%) |
| Total | 25,660 (73.1%) | 9,441 (26.9%) |
Female Fertility in Rogers County
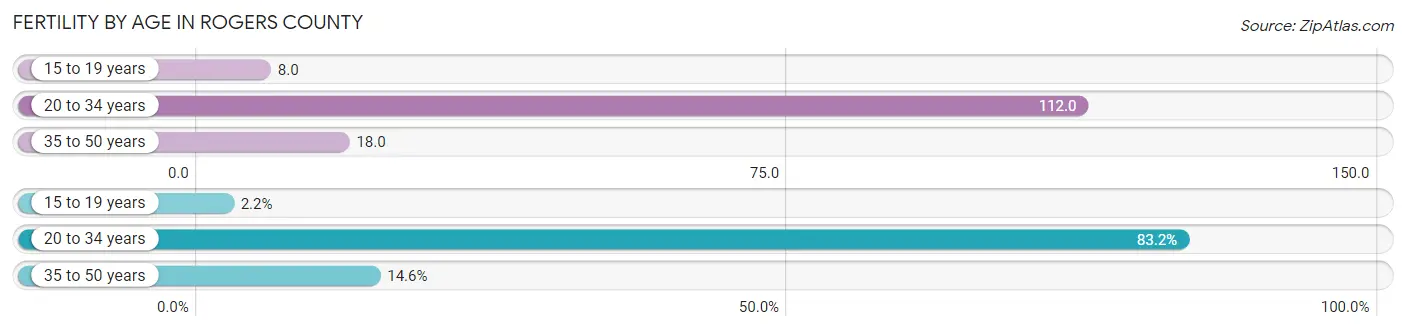
Fertility by Age in Rogers County
Average fertility rate in Rogers County is 55.0 births per 1,000 women. Women in the age bracket of 20 to 34 years have the highest fertility rate with 112.0 births per 1,000 women. Women in the age bracket of 20 to 34 years acount for 83.2% of all women with births.
| Age Bracket | Women with Births | Births / 1,000 Women |
| 15 to 19 years | 26 (2.2%) | 8.0 |
| 20 to 34 years | 991 (83.2%) | 112.0 |
| 35 to 50 years | 174 (14.6%) | 18.0 |
| Total | 1,191 (100.0%) | 55.0 |
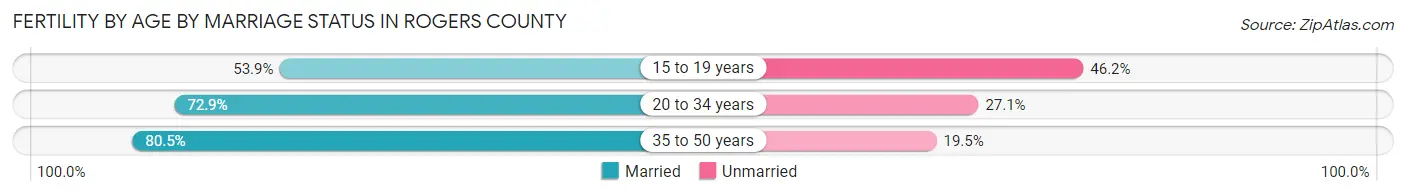
Fertility by Age by Marriage Status in Rogers County
73.6% of women with births (1,191) in Rogers County are married. The highest percentage of unmarried women with births falls into 15 to 19 years age bracket with 46.2% of them unmarried at the time of birth, while the lowest percentage of unmarried women with births belong to 35 to 50 years age bracket with 19.5% of them unmarried.
| Age Bracket | Married | Unmarried |
| 15 to 19 years | 14 (53.8%) | 12 (46.2%) |
| 20 to 34 years | 722 (72.9%) | 269 (27.1%) |
| 35 to 50 years | 140 (80.5%) | 34 (19.5%) |
| Total | 877 (73.6%) | 314 (26.4%) |
Fertility by Education in Rogers County
Average fertility rate in Rogers County is 55.0 births per 1,000 women. Women with the education attainment of high school diploma have the highest fertility rate of 69.0 births per 1,000 women, while women with the education attainment of less than high school have the lowest fertility at 35.0 births per 1,000 women. Women with the education attainment of college or associate's degree represent 32.6% of all women with births.

| Educational Attainment | Women with Births | Births / 1,000 Women |
| Less than High School | 125 (10.5%) | 35.0 |
| High School Diploma | 386 (32.4%) | 69.0 |
| College or Associate's Degree | 388 (32.6%) | 53.0 |
| Bachelor's Degree | 205 (17.2%) | 56.0 |
| Graduate Degree | 87 (7.3%) | 64.0 |
| Total | 1,191 (100.0%) | 55.0 |
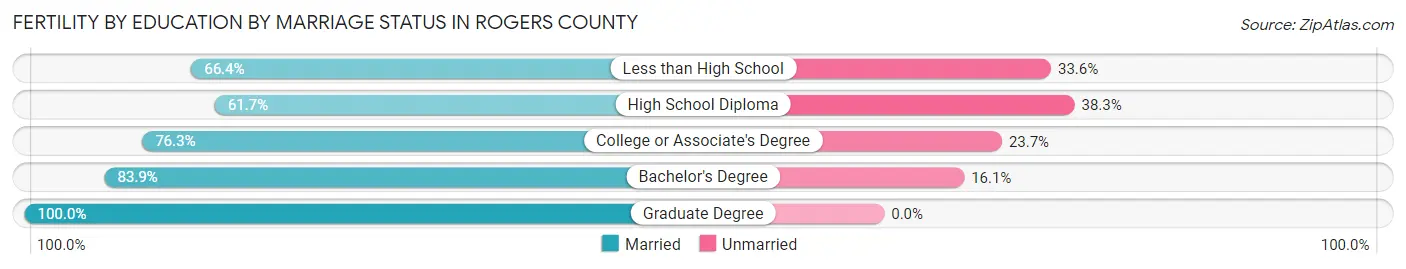
Fertility by Education by Marriage Status in Rogers County
26.4% of women with births in Rogers County are unmarried. Women with the educational attainment of graduate degree are most likely to be married with 100.0% of them married at childbirth, while women with the educational attainment of high school diploma are least likely to be married with 38.3% of them unmarried at childbirth.
| Educational Attainment | Married | Unmarried |
| Less than High School | 83 (66.4%) | 42 (33.6%) |
| High School Diploma | 238 (61.7%) | 148 (38.3%) |
| College or Associate's Degree | 296 (76.3%) | 92 (23.7%) |
| Bachelor's Degree | 172 (83.9%) | 33 (16.1%) |
| Graduate Degree | 87 (100.0%) | 0 (0.0%) |
| Total | 877 (73.6%) | 314 (26.4%) |
Income in Rogers County
Income Overview in Rogers County
Per Capita Income in Rogers County is $36,885, while median incomes of families and households are $91,954 and $75,312 respectively.
| Characteristic | Number | Measure |
| Per Capita Income | 95,870 | $36,885 |
| Median Family Income | 25,660 | $91,954 |
| Mean Family Income | 25,660 | $110,176 |
| Median Household Income | 35,101 | $75,312 |
| Mean Household Income | 35,101 | $96,448 |
| Income Deficit | 25,660 | $10,494 |
| Wage / Income Gap (%) | 95,870 | 34.59% |
| Wage / Income Gap ($) | 95,870 | 65.41¢ per $1 |
| Gini / Inequality Index | 95,870 | 0.41 |
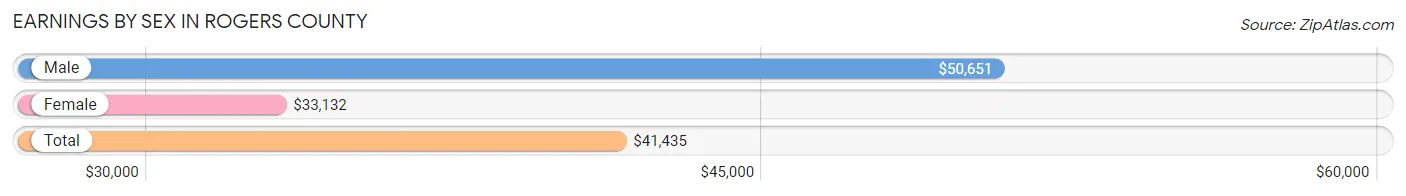
Earnings by Sex in Rogers County
Average Earnings in Rogers County are $41,435, $50,651 for men and $33,132 for women, a difference of 34.6%.
| Sex | Number | Average Earnings |
| Male | 27,570 (54.4%) | $50,651 |
| Female | 23,096 (45.6%) | $33,132 |
| Total | 50,666 (100.0%) | $41,435 |
Earnings by Sex by Income Bracket in Rogers County
The most common earnings brackets in Rogers County are $100,000+ for men (5,199 | 18.9%) and $25,000 to $29,999 for women (1,789 | 7.7%).
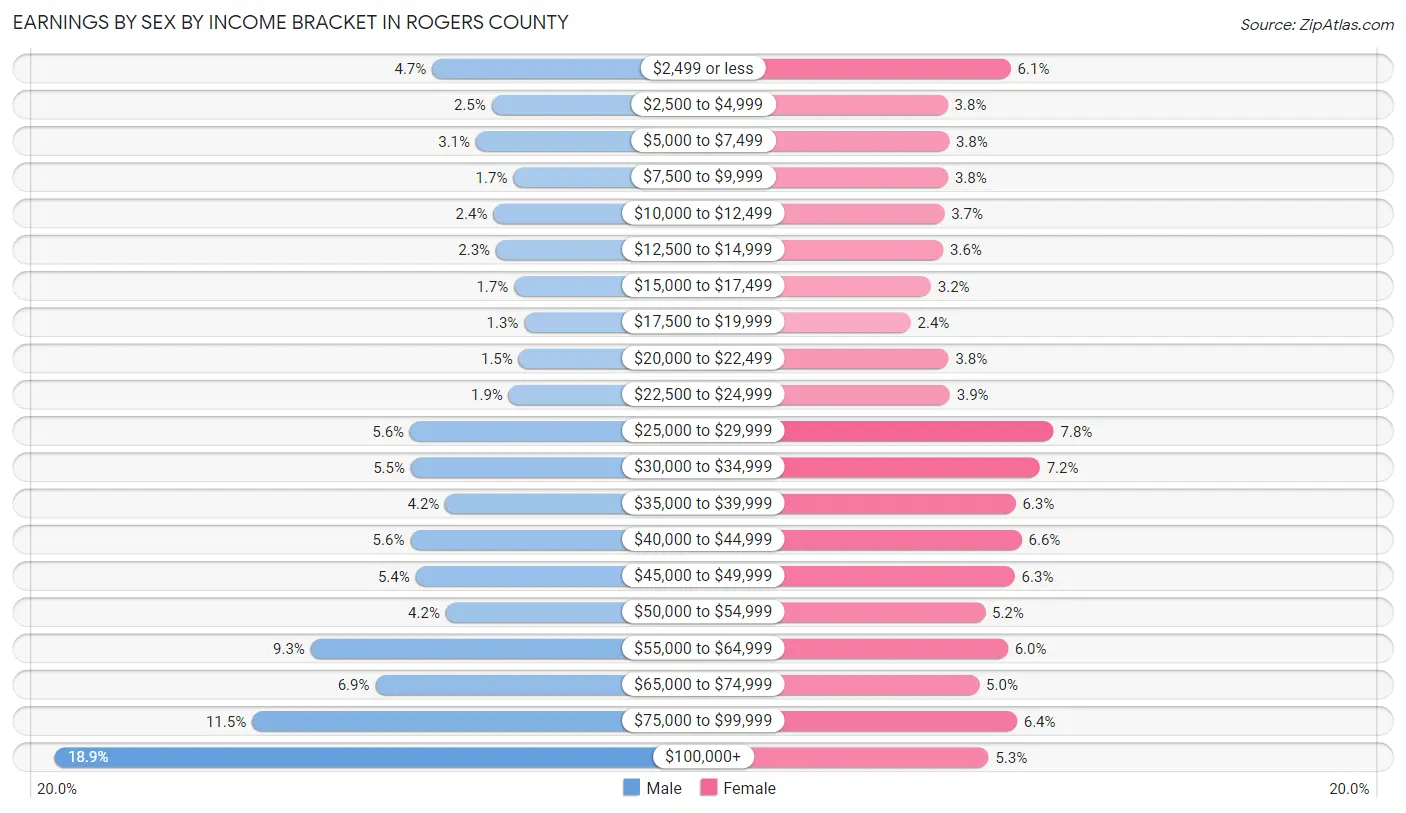
| Income | Male | Female |
| $2,499 or less | 1,303 (4.7%) | 1,417 (6.1%) |
| $2,500 to $4,999 | 688 (2.5%) | 874 (3.8%) |
| $5,000 to $7,499 | 851 (3.1%) | 885 (3.8%) |
| $7,500 to $9,999 | 465 (1.7%) | 876 (3.8%) |
| $10,000 to $12,499 | 674 (2.4%) | 844 (3.6%) |
| $12,500 to $14,999 | 646 (2.3%) | 834 (3.6%) |
| $15,000 to $17,499 | 457 (1.7%) | 727 (3.2%) |
| $17,500 to $19,999 | 353 (1.3%) | 551 (2.4%) |
| $20,000 to $22,499 | 412 (1.5%) | 880 (3.8%) |
| $22,500 to $24,999 | 514 (1.9%) | 891 (3.9%) |
| $25,000 to $29,999 | 1,534 (5.6%) | 1,789 (7.7%) |
| $30,000 to $34,999 | 1,525 (5.5%) | 1,669 (7.2%) |
| $35,000 to $39,999 | 1,169 (4.2%) | 1,460 (6.3%) |
| $40,000 to $44,999 | 1,529 (5.6%) | 1,513 (6.6%) |
| $45,000 to $49,999 | 1,476 (5.3%) | 1,452 (6.3%) |
| $50,000 to $54,999 | 1,163 (4.2%) | 1,197 (5.2%) |
| $55,000 to $64,999 | 2,558 (9.3%) | 1,392 (6.0%) |
| $65,000 to $74,999 | 1,890 (6.9%) | 1,146 (5.0%) |
| $75,000 to $99,999 | 3,164 (11.5%) | 1,472 (6.4%) |
| $100,000+ | 5,199 (18.9%) | 1,227 (5.3%) |
| Total | 27,570 (100.0%) | 23,096 (100.0%) |
Earnings by Sex by Educational Attainment in Rogers County
Average earnings in Rogers County are $57,330 for men and $38,298 for women, a difference of 33.2%. Men with an educational attainment of graduate degree enjoy the highest average annual earnings of $102,143, while those with less than high school education earn the least with $45,272. Women with an educational attainment of graduate degree earn the most with the average annual earnings of $58,566, while those with less than high school education have the smallest earnings of $15,943.
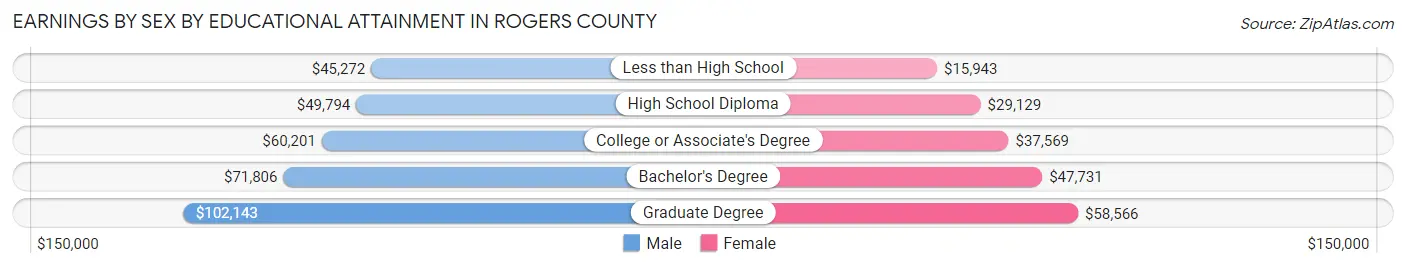
| Educational Attainment | Male Income | Female Income |
| Less than High School | $45,272 | $15,943 |
| High School Diploma | $49,794 | $29,129 |
| College or Associate's Degree | $60,201 | $37,569 |
| Bachelor's Degree | $71,806 | $47,731 |
| Graduate Degree | $102,143 | $58,566 |
| Total | $57,330 | $38,298 |
Family Income in Rogers County
Family Income Brackets in Rogers County
According to the Rogers County family income data, there are 5,902 families falling into the $100,000 to $149,999 income range, which is the most common income bracket and makes up 23.0% of all families. Conversely, the $10,000 to $14,999 income bracket is the least frequent group with only 385 families (1.5%) belonging to this category.
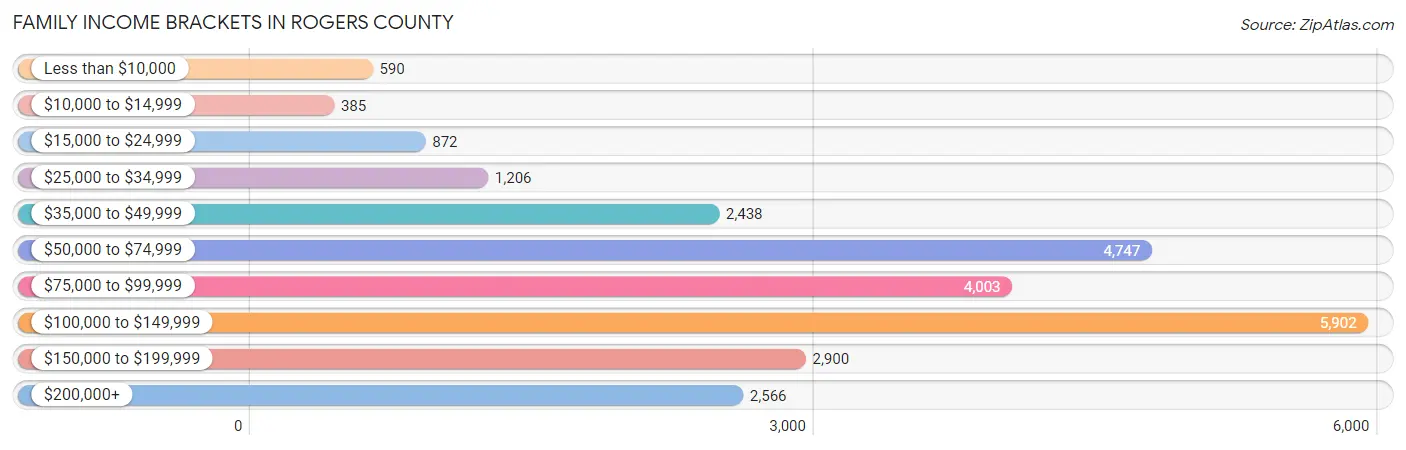
| Income Bracket | # Families | % Families |
| Less than $10,000 | 590 | 2.3% |
| $10,000 to $14,999 | 385 | 1.5% |
| $15,000 to $24,999 | 872 | 3.4% |
| $25,000 to $34,999 | 1,206 | 4.7% |
| $35,000 to $49,999 | 2,438 | 9.5% |
| $50,000 to $74,999 | 4,747 | 18.5% |
| $75,000 to $99,999 | 4,003 | 15.6% |
| $100,000 to $149,999 | 5,902 | 23.0% |
| $150,000 to $199,999 | 2,900 | 11.3% |
| $200,000+ | 2,566 | 10.0% |
Family Income by Famaliy Size in Rogers County
5-person families (2,198 | 8.6%) account for the highest median family income in Rogers County with $107,969 per family, while 2-person families (11,951 | 46.6%) have the highest median income of $39,942 per family member.
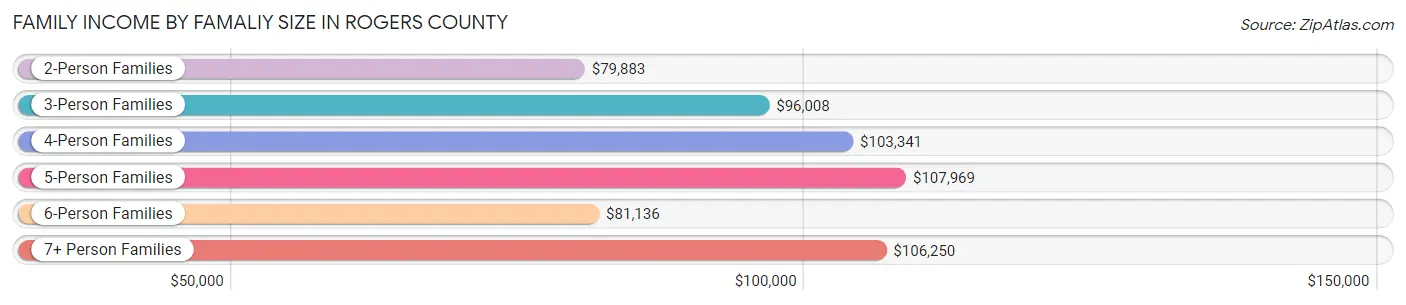
| Income Bracket | # Families | Median Income |
| 2-Person Families | 11,951 (46.6%) | $79,883 |
| 3-Person Families | 5,762 (22.5%) | $96,008 |
| 4-Person Families | 4,730 (18.4%) | $103,341 |
| 5-Person Families | 2,198 (8.6%) | $107,969 |
| 6-Person Families | 650 (2.5%) | $81,136 |
| 7+ Person Families | 369 (1.4%) | $106,250 |
| Total | 25,660 (100.0%) | $91,954 |
Family Income by Number of Earners in Rogers County
The median family income in Rogers County is $91,954, with families comprising 3+ earners (2,939) having the highest median family income of $139,462, while families with no earners (3,525) have the lowest median family income of $56,273, accounting for 11.5% and 13.7% of families, respectively.
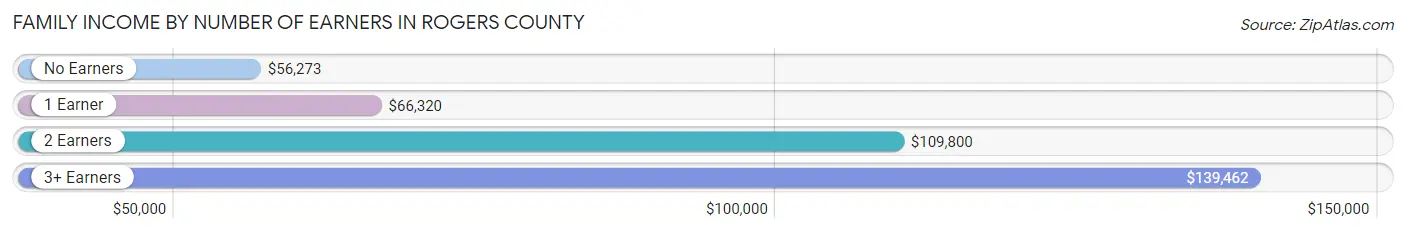
| Number of Earners | # Families | Median Income |
| No Earners | 3,525 (13.7%) | $56,273 |
| 1 Earner | 8,222 (32.0%) | $66,320 |
| 2 Earners | 10,974 (42.8%) | $109,800 |
| 3+ Earners | 2,939 (11.5%) | $139,462 |
| Total | 25,660 (100.0%) | $91,954 |
Household Income in Rogers County
Household Income Brackets in Rogers County
With 7,055 households falling in the category, the $50,000 to $74,999 income range is the most frequent in Rogers County, accounting for 20.1% of all households. In contrast, only 948 households (2.7%) fall into the $10,000 to $14,999 income bracket, making it the least populous group.
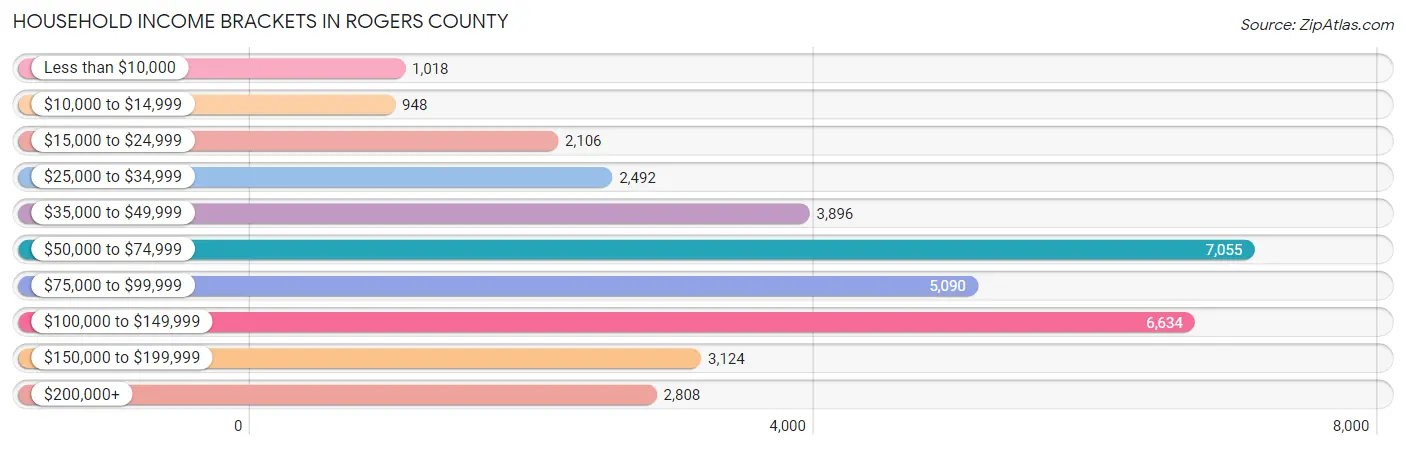
| Income Bracket | # Households | % Households |
| Less than $10,000 | 1,018 | 2.9% |
| $10,000 to $14,999 | 948 | 2.7% |
| $15,000 to $24,999 | 2,106 | 6.0% |
| $25,000 to $34,999 | 2,492 | 7.1% |
| $35,000 to $49,999 | 3,896 | 11.1% |
| $50,000 to $74,999 | 7,055 | 20.1% |
| $75,000 to $99,999 | 5,090 | 14.5% |
| $100,000 to $149,999 | 6,634 | 18.9% |
| $150,000 to $199,999 | 3,124 | 8.9% |
| $200,000+ | 2,808 | 8.0% |
Household Income by Householder Age in Rogers County
The median household income in Rogers County is $75,312, with the highest median household income of $94,977 found in the 45 to 64 years age bracket for the primary householder. A total of 13,674 households (39.0%) fall into this category. Meanwhile, the 15 to 24 years age bracket for the primary householder has the lowest median household income of $48,591, with 1,143 households (3.3%) in this group.

| Income Bracket | # Households | Median Income |
| 15 to 24 Years | 1,143 (3.3%) | $48,591 |
| 25 to 44 Years | 10,830 (30.8%) | $78,994 |
| 45 to 64 Years | 13,674 (39.0%) | $94,977 |
| 65+ Years | 9,454 (26.9%) | $58,301 |
| Total | 35,101 (100.0%) | $75,312 |
Poverty in Rogers County
Income Below Poverty by Sex and Age in Rogers County
With 8.4% poverty level for males and 10.7% for females among the residents of Rogers County, 5 year old males and 5 year old females are the most vulnerable to poverty, with 88 males (17.5%) and 120 females (22.9%) in their respective age groups living below the poverty level.
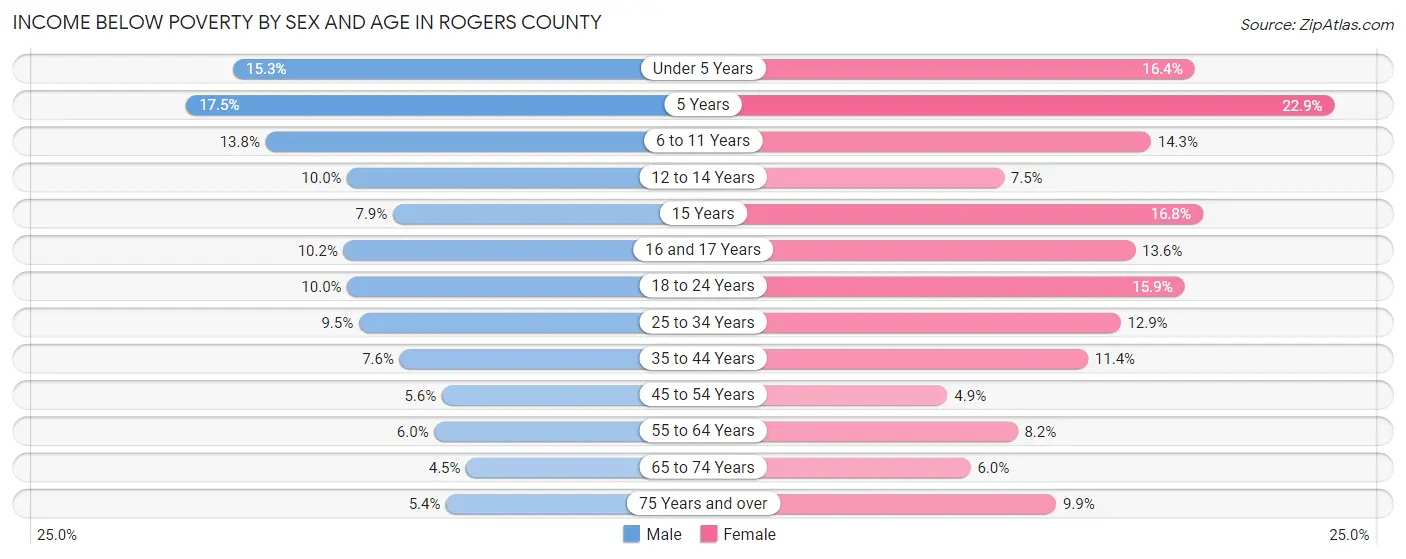
| Age Bracket | Male | Female |
| Under 5 Years | 425 (15.3%) | 418 (16.4%) |
| 5 Years | 88 (17.5%) | 120 (22.9%) |
| 6 to 11 Years | 510 (13.8%) | 526 (14.3%) |
| 12 to 14 Years | 214 (10.0%) | 133 (7.5%) |
| 15 Years | 59 (7.9%) | 106 (16.8%) |
| 16 and 17 Years | 131 (10.2%) | 180 (13.6%) |
| 18 to 24 Years | 424 (10.0%) | 666 (15.9%) |
| 25 to 34 Years | 567 (9.5%) | 756 (12.9%) |
| 35 to 44 Years | 450 (7.6%) | 681 (11.4%) |
| 45 to 54 Years | 344 (5.6%) | 294 (4.9%) |
| 55 to 64 Years | 385 (6.0%) | 531 (8.2%) |
| 65 to 74 Years | 195 (4.5%) | 289 (6.0%) |
| 75 Years and over | 147 (5.4%) | 341 (9.9%) |
| Total | 3,939 (8.4%) | 5,041 (10.7%) |
Income Above Poverty by Sex and Age in Rogers County
According to the poverty statistics in Rogers County, males aged 65 to 74 years and females aged 45 to 54 years are the age groups that are most secure financially, with 95.5% of males and 95.1% of females in these age groups living above the poverty line.
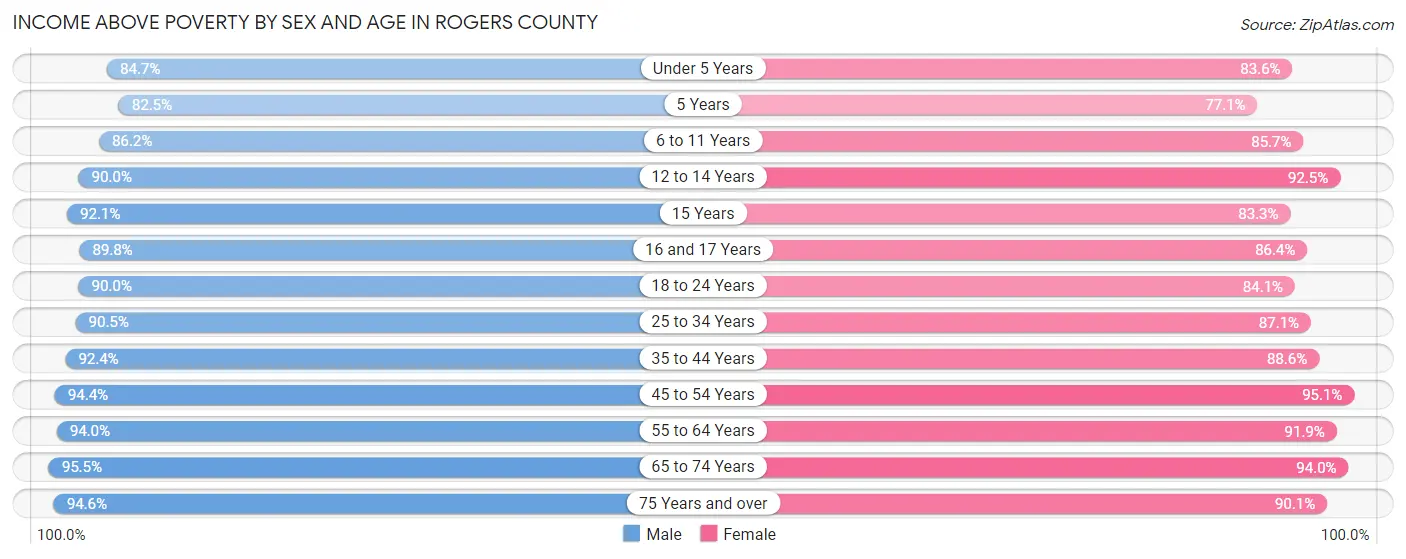
| Age Bracket | Male | Female |
| Under 5 Years | 2,349 (84.7%) | 2,135 (83.6%) |
| 5 Years | 415 (82.5%) | 405 (77.1%) |
| 6 to 11 Years | 3,182 (86.2%) | 3,143 (85.7%) |
| 12 to 14 Years | 1,922 (90.0%) | 1,636 (92.5%) |
| 15 Years | 688 (92.1%) | 527 (83.3%) |
| 16 and 17 Years | 1,155 (89.8%) | 1,143 (86.4%) |
| 18 to 24 Years | 3,809 (90.0%) | 3,522 (84.1%) |
| 25 to 34 Years | 5,411 (90.5%) | 5,092 (87.1%) |
| 35 to 44 Years | 5,478 (92.4%) | 5,284 (88.6%) |
| 45 to 54 Years | 5,769 (94.4%) | 5,700 (95.1%) |
| 55 to 64 Years | 6,057 (94.0%) | 5,984 (91.8%) |
| 65 to 74 Years | 4,137 (95.5%) | 4,551 (94.0%) |
| 75 Years and over | 2,558 (94.6%) | 3,091 (90.1%) |
| Total | 42,930 (91.6%) | 42,213 (89.3%) |
Income Below Poverty Among Married-Couple Families in Rogers County
The poverty statistics for married-couple families in Rogers County show that 4.0% or 824 of the total 20,483 families live below the poverty line. Families with 5 or more children have the highest poverty rate of 16.0%, comprising of 26 families. On the other hand, families with no children have the lowest poverty rate of 3.1%, which includes 371 families.
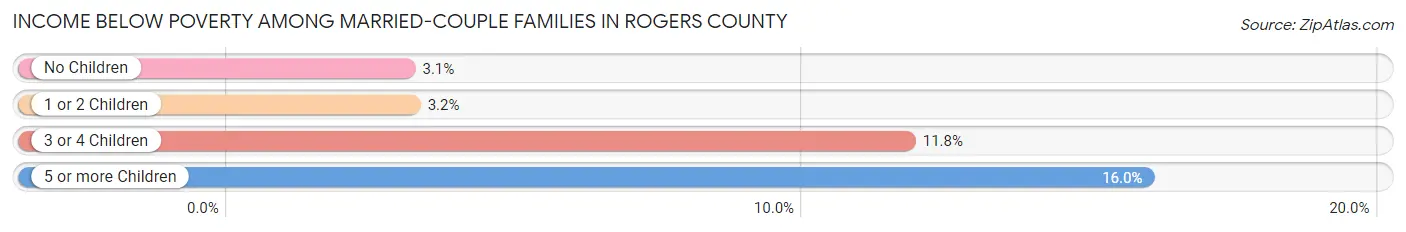
| Children | Above Poverty | Below Poverty |
| No Children | 11,634 (96.9%) | 371 (3.1%) |
| 1 or 2 Children | 6,221 (96.8%) | 204 (3.2%) |
| 3 or 4 Children | 1,667 (88.2%) | 223 (11.8%) |
| 5 or more Children | 137 (84.1%) | 26 (16.0%) |
| Total | 19,659 (96.0%) | 824 (4.0%) |
Income Below Poverty Among Single-Parent Households in Rogers County
According to the poverty data in Rogers County, 9.3% or 163 single-father households and 23.8% or 819 single-mother households are living below the poverty line. Among single-father households, those with 3 or 4 children have the highest poverty rate, with 66 households (40.5%) experiencing poverty. Likewise, among single-mother households, those with 5 or more children have the highest poverty rate, with 15 households (100.0%) falling below the poverty line.
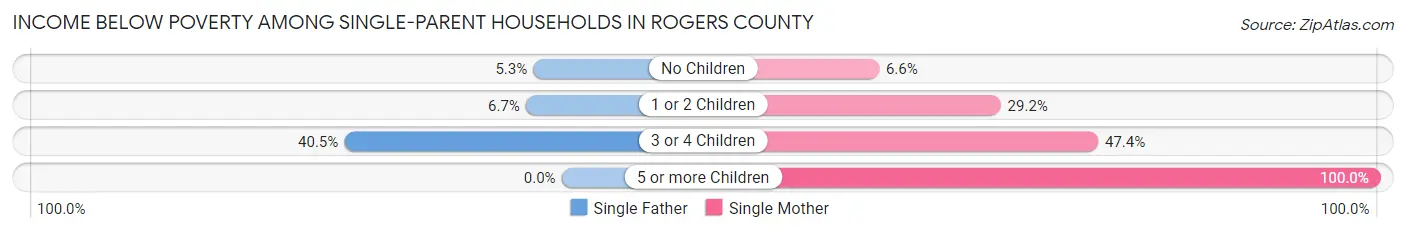
| Children | Single Father | Single Mother |
| No Children | 32 (5.3%) | 77 (6.6%) |
| 1 or 2 Children | 65 (6.7%) | 546 (29.2%) |
| 3 or 4 Children | 66 (40.5%) | 181 (47.4%) |
| 5 or more Children | 0 (0.0%) | 15 (100.0%) |
| Total | 163 (9.3%) | 819 (23.8%) |
Income Below Poverty Among Married-Couple vs Single-Parent Households in Rogers County
The poverty data for Rogers County shows that 824 of the married-couple family households (4.0%) and 982 of the single-parent households (19.0%) are living below the poverty level. Within the married-couple family households, those with 5 or more children have the highest poverty rate, with 26 households (16.0%) falling below the poverty line. Among the single-parent households, those with 5 or more children have the highest poverty rate, with 15 household (100.0%) living below poverty.
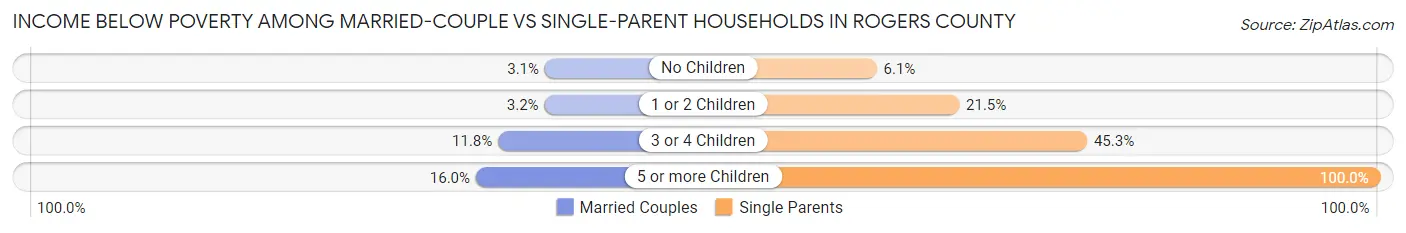
| Children | Married-Couple Families | Single-Parent Households |
| No Children | 371 (3.1%) | 109 (6.1%) |
| 1 or 2 Children | 204 (3.2%) | 611 (21.5%) |
| 3 or 4 Children | 223 (11.8%) | 247 (45.3%) |
| 5 or more Children | 26 (16.0%) | 15 (100.0%) |
| Total | 824 (4.0%) | 982 (19.0%) |
Employment Characteristics in Rogers County
Employment by Class of Employer in Rogers County
Among the 45,762 employed individuals in Rogers County, private company employees (33,028 | 72.2%), local government employees (2,842 | 6.2%), and self-employed (not incorporated) (2,743 | 6.0%) make up the most common classes of employment.
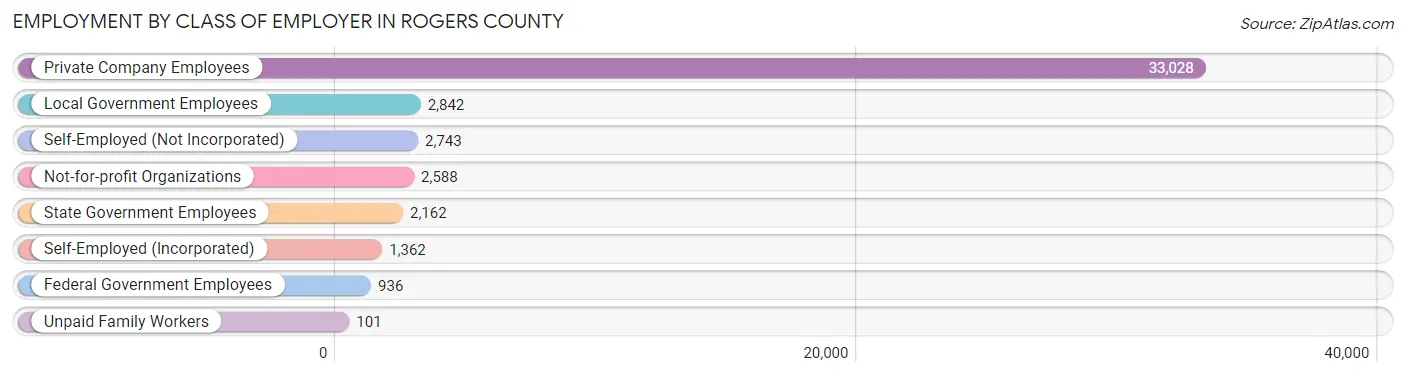
| Employer Class | # Employees | % Employees |
| Private Company Employees | 33,028 | 72.2% |
| Self-Employed (Incorporated) | 1,362 | 3.0% |
| Self-Employed (Not Incorporated) | 2,743 | 6.0% |
| Not-for-profit Organizations | 2,588 | 5.7% |
| Local Government Employees | 2,842 | 6.2% |
| State Government Employees | 2,162 | 4.7% |
| Federal Government Employees | 936 | 2.1% |
| Unpaid Family Workers | 101 | 0.2% |
| Total | 45,762 | 100.0% |
Employment Status by Age in Rogers County
According to the labor force statistics for Rogers County, out of the total population over 16 years of age (76,392), 63.9% or 48,814 individuals are in the labor force, with 4.7% or 2,294 of them unemployed. The age group with the highest labor force participation rate is 25 to 29 years, with 84.2% or 5,057 individuals in the labor force. Within the labor force, the 16 to 19 years age range has the highest percentage of unemployed individuals, with 10.4% or 249 of them being unemployed.
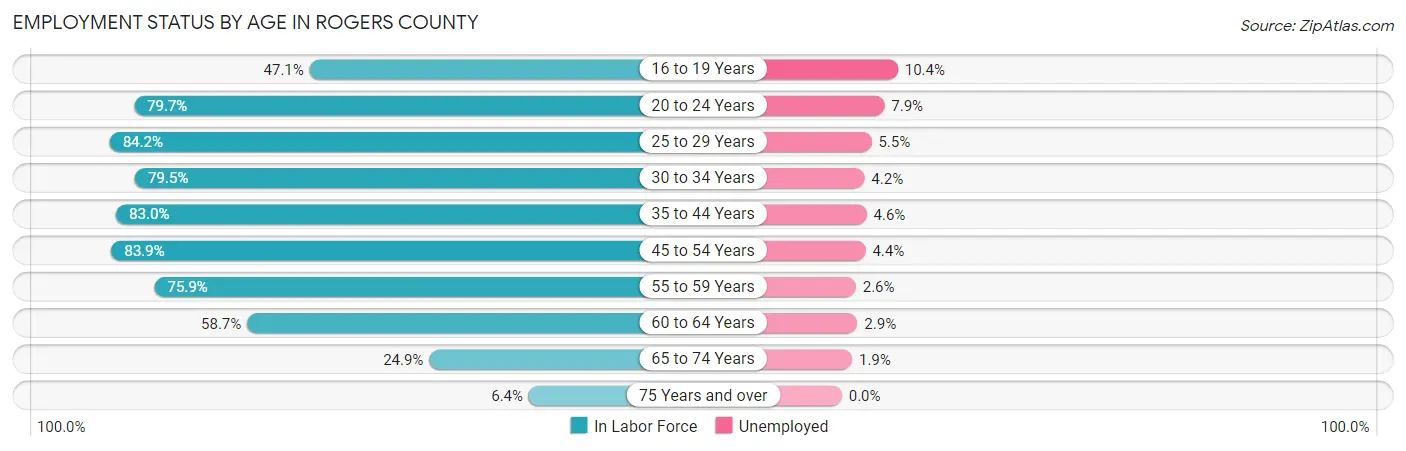
| Age Bracket | In Labor Force | Unemployed |
| 16 to 19 Years | 2,392 (47.1%) | 249 (10.4%) |
| 20 to 24 Years | 4,945 (79.7%) | 391 (7.9%) |
| 25 to 29 Years | 5,057 (84.2%) | 278 (5.5%) |
| 30 to 34 Years | 4,706 (79.5%) | 198 (4.2%) |
| 35 to 44 Years | 9,932 (83.0%) | 457 (4.6%) |
| 45 to 54 Years | 10,191 (83.9%) | 448 (4.4%) |
| 55 to 59 Years | 4,921 (75.9%) | 128 (2.6%) |
| 60 to 64 Years | 3,881 (58.7%) | 113 (2.9%) |
| 65 to 74 Years | 2,348 (24.9%) | 45 (1.9%) |
| 75 Years and over | 419 (6.4%) | 0 (0.0%) |
| Total | 48,814 (63.9%) | 2,294 (4.7%) |
Employment Status by Educational Attainment in Rogers County
According to labor force statistics for Rogers County, 78.8% of individuals (38,718) out of the total population between 25 and 64 years of age (49,134) are in the labor force, with 4.2% or 1,626 of them being unemployed. The group with the highest labor force participation rate are those with the educational attainment of bachelor's degree or higher, with 85.7% or 10,664 individuals in the labor force. Within the labor force, individuals with less than high school education have the highest percentage of unemployment, with 9.8% or 208 of them being unemployed.
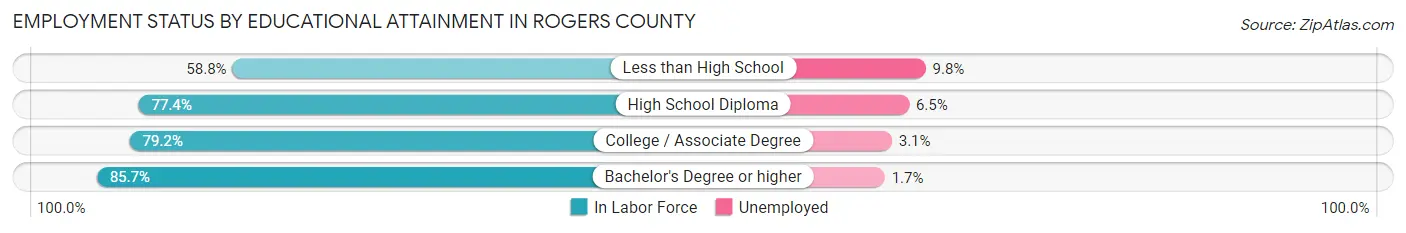
| Educational Attainment | In Labor Force | Unemployed |
| Less than High School | 2,127 (58.8%) | 354 (9.8%) |
| High School Diploma | 12,467 (77.4%) | 1,047 (6.5%) |
| College / Associate Degree | 13,438 (79.2%) | 526 (3.1%) |
| Bachelor's Degree or higher | 10,664 (85.7%) | 212 (1.7%) |
| Total | 38,718 (78.8%) | 2,064 (4.2%) |
Employment Occupations by Sex in Rogers County
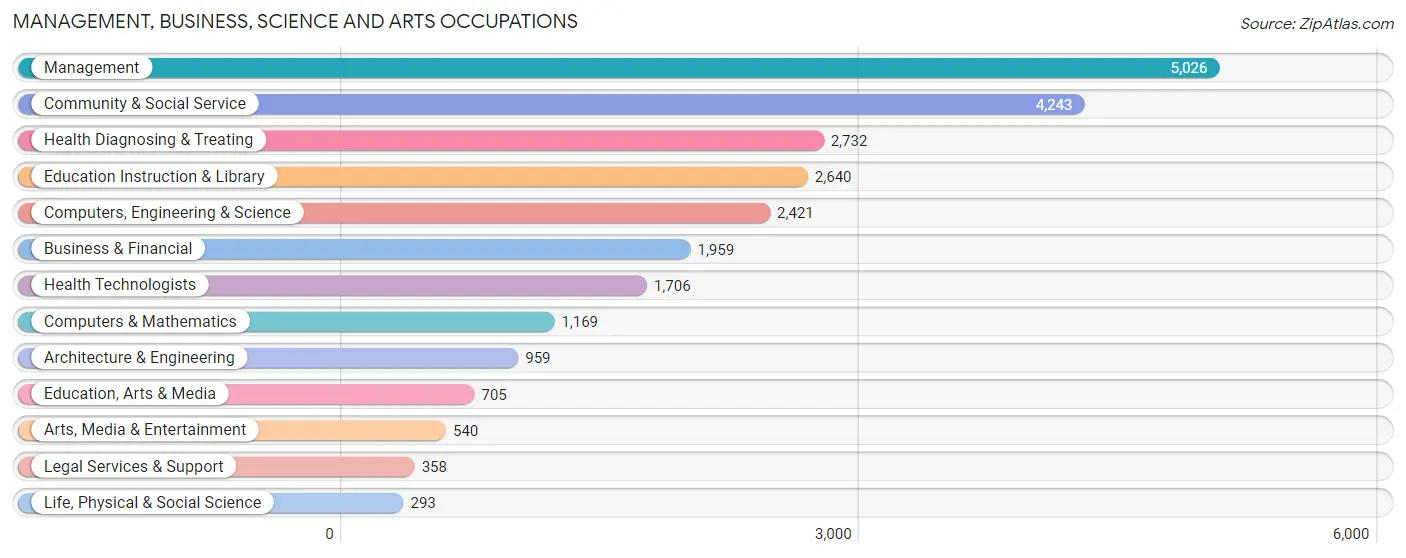
Management, Business, Science and Arts Occupations
The most common Management, Business, Science and Arts occupations in Rogers County are Management (5,026 | 10.8%), Community & Social Service (4,243 | 9.1%), Health Diagnosing & Treating (2,732 | 5.9%), Education Instruction & Library (2,640 | 5.7%), and Computers, Engineering & Science (2,421 | 5.2%).
Management, Business, Science and Arts Occupations by Sex
Within the Management, Business, Science and Arts occupations in Rogers County, the most male-oriented occupations are Architecture & Engineering (91.0%), Computers, Engineering & Science (82.0%), and Computers & Mathematics (78.9%), while the most female-oriented occupations are Education Instruction & Library (82.1%), Health Diagnosing & Treating (82.0%), and Health Technologists (79.4%).
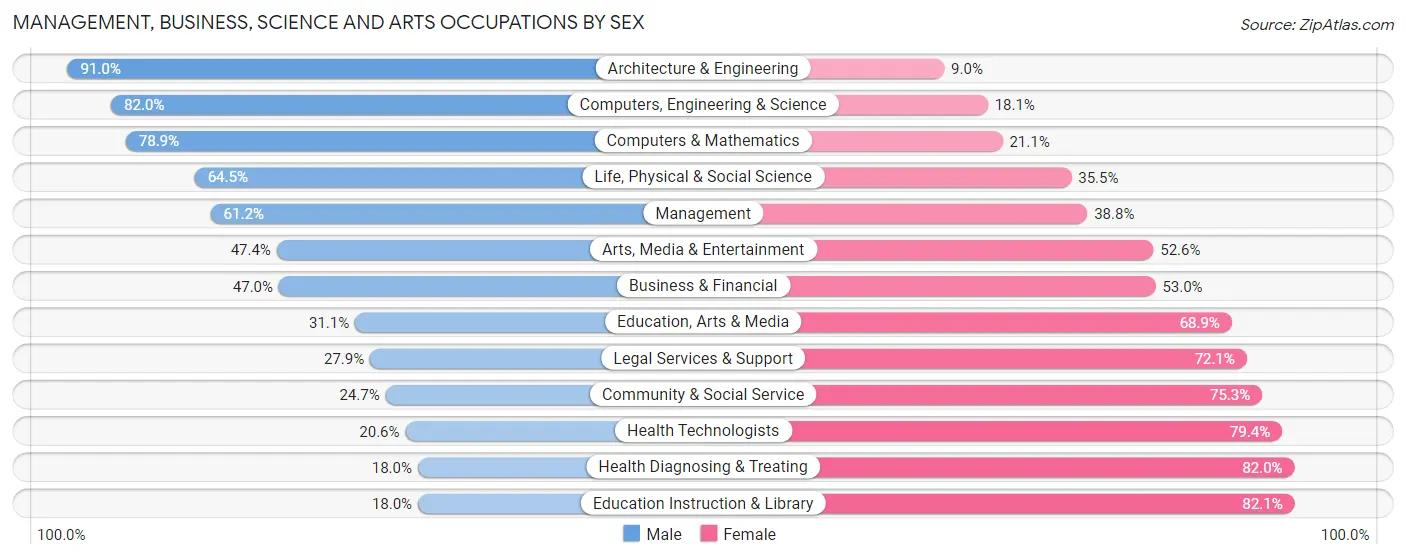
| Occupation | Male | Female |
| Management | 3,075 (61.2%) | 1,951 (38.8%) |
| Business & Financial | 920 (47.0%) | 1,039 (53.0%) |
| Computers, Engineering & Science | 1,984 (82.0%) | 437 (18.0%) |
| Computers & Mathematics | 922 (78.9%) | 247 (21.1%) |
| Architecture & Engineering | 873 (91.0%) | 86 (9.0%) |
| Life, Physical & Social Science | 189 (64.5%) | 104 (35.5%) |
| Community & Social Service | 1,049 (24.7%) | 3,194 (75.3%) |
| Education, Arts & Media | 219 (31.1%) | 486 (68.9%) |
| Legal Services & Support | 100 (27.9%) | 258 (72.1%) |
| Education Instruction & Library | 474 (17.9%) | 2,166 (82.1%) |
| Arts, Media & Entertainment | 256 (47.4%) | 284 (52.6%) |
| Health Diagnosing & Treating | 491 (18.0%) | 2,241 (82.0%) |
| Health Technologists | 351 (20.6%) | 1,355 (79.4%) |
| Total (Category) | 7,519 (45.9%) | 8,862 (54.1%) |
| Total (Overall) | 25,304 (54.5%) | 21,118 (45.5%) |
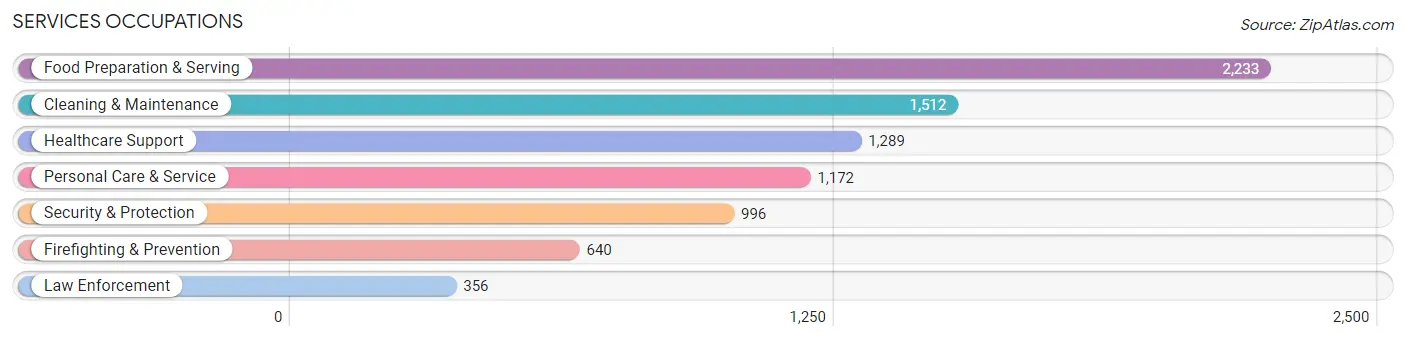
Services Occupations
The most common Services occupations in Rogers County are Food Preparation & Serving (2,233 | 4.8%), Cleaning & Maintenance (1,512 | 3.3%), Healthcare Support (1,289 | 2.8%), Personal Care & Service (1,172 | 2.5%), and Security & Protection (996 | 2.1%).
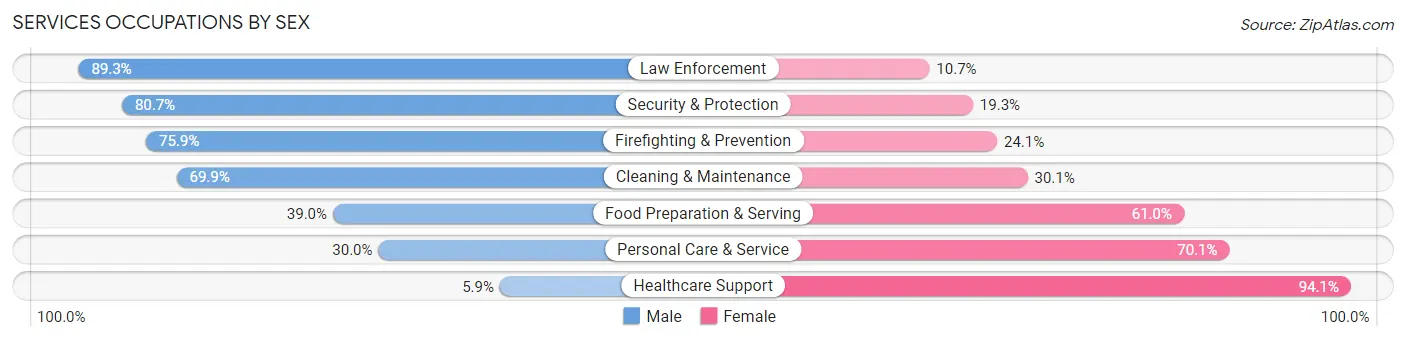
Services Occupations by Sex
Within the Services occupations in Rogers County, the most male-oriented occupations are Law Enforcement (89.3%), Security & Protection (80.7%), and Firefighting & Prevention (75.9%), while the most female-oriented occupations are Healthcare Support (94.1%), Personal Care & Service (70.1%), and Food Preparation & Serving (61.0%).
| Occupation | Male | Female |
| Healthcare Support | 76 (5.9%) | 1,213 (94.1%) |
| Security & Protection | 804 (80.7%) | 192 (19.3%) |
| Firefighting & Prevention | 486 (75.9%) | 154 (24.1%) |
| Law Enforcement | 318 (89.3%) | 38 (10.7%) |
| Food Preparation & Serving | 870 (39.0%) | 1,363 (61.0%) |
| Cleaning & Maintenance | 1,057 (69.9%) | 455 (30.1%) |
| Personal Care & Service | 351 (29.9%) | 821 (70.1%) |
| Total (Category) | 3,158 (43.9%) | 4,044 (56.1%) |
| Total (Overall) | 25,304 (54.5%) | 21,118 (45.5%) |
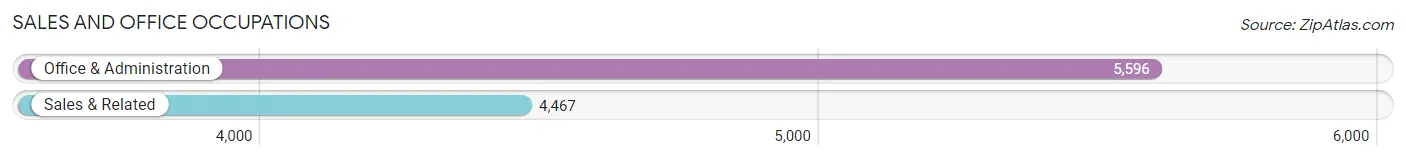
Sales and Office Occupations
The most common Sales and Office occupations in Rogers County are Office & Administration (5,596 | 12.0%), and Sales & Related (4,467 | 9.6%).
Sales and Office Occupations by Sex
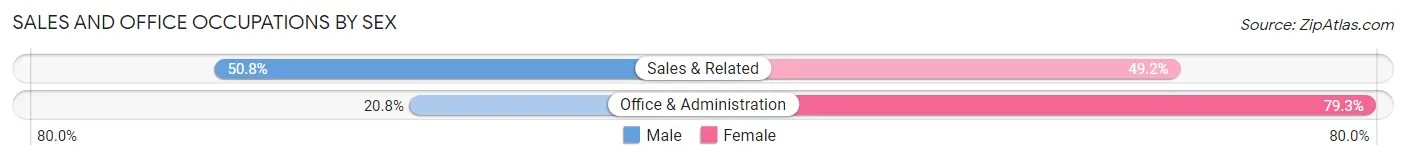
| Occupation | Male | Female |
| Sales & Related | 2,269 (50.8%) | 2,198 (49.2%) |
| Office & Administration | 1,161 (20.7%) | 4,435 (79.2%) |
| Total (Category) | 3,430 (34.1%) | 6,633 (65.9%) |
| Total (Overall) | 25,304 (54.5%) | 21,118 (45.5%) |
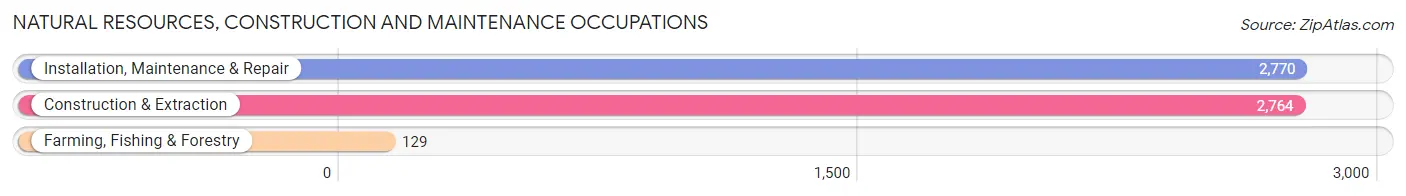
Natural Resources, Construction and Maintenance Occupations
The most common Natural Resources, Construction and Maintenance occupations in Rogers County are Installation, Maintenance & Repair (2,770 | 6.0%), Construction & Extraction (2,764 | 5.9%), and Farming, Fishing & Forestry (129 | 0.3%).
Natural Resources, Construction and Maintenance Occupations by Sex
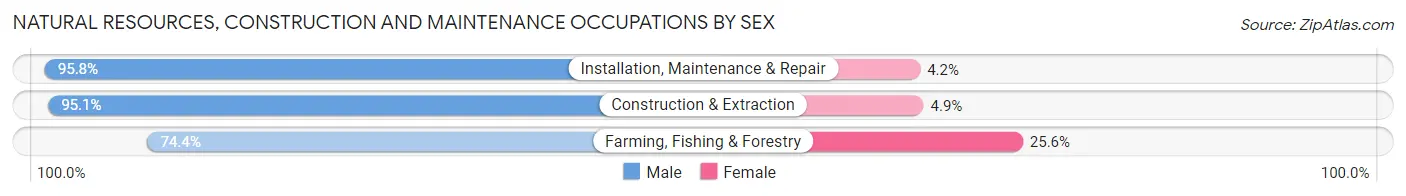
| Occupation | Male | Female |
| Farming, Fishing & Forestry | 96 (74.4%) | 33 (25.6%) |
| Construction & Extraction | 2,628 (95.1%) | 136 (4.9%) |
| Installation, Maintenance & Repair | 2,653 (95.8%) | 117 (4.2%) |
| Total (Category) | 5,377 (95.0%) | 286 (5.1%) |
| Total (Overall) | 25,304 (54.5%) | 21,118 (45.5%) |
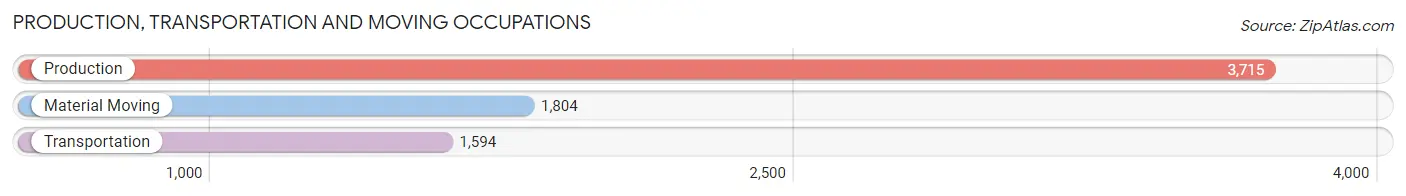
Production, Transportation and Moving Occupations
The most common Production, Transportation and Moving occupations in Rogers County are Production (3,715 | 8.0%), Material Moving (1,804 | 3.9%), and Transportation (1,594 | 3.4%).
Production, Transportation and Moving Occupations by Sex
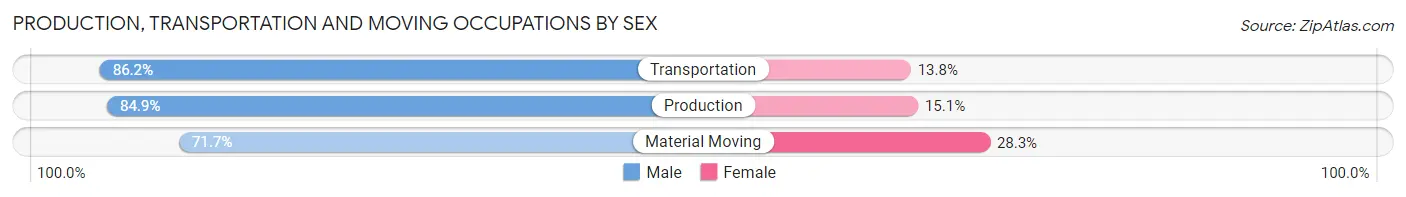
| Occupation | Male | Female |
| Production | 3,153 (84.9%) | 562 (15.1%) |
| Transportation | 1,374 (86.2%) | 220 (13.8%) |
| Material Moving | 1,293 (71.7%) | 511 (28.3%) |
| Total (Category) | 5,820 (81.8%) | 1,293 (18.2%) |
| Total (Overall) | 25,304 (54.5%) | 21,118 (45.5%) |
Employment Industries by Sex in Rogers County
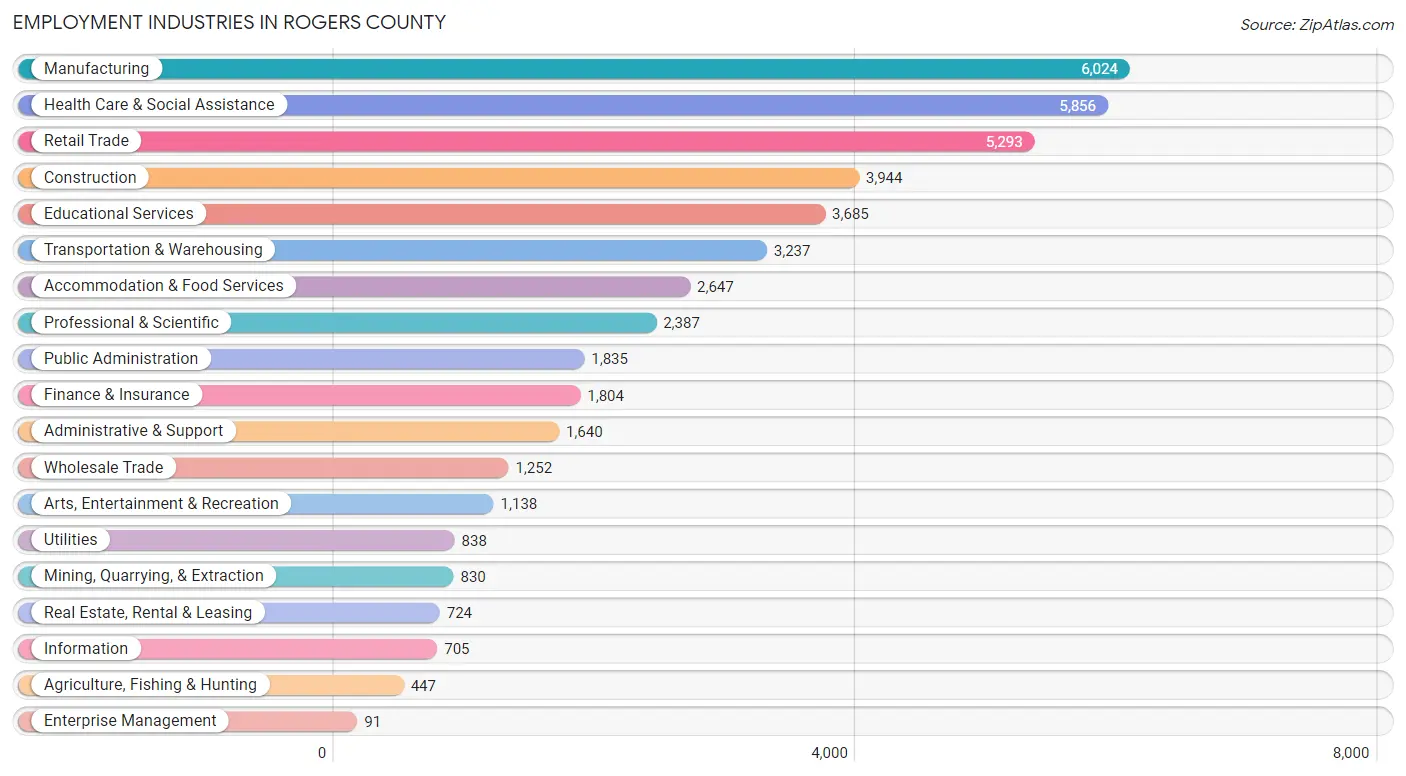
Employment Industries in Rogers County
The major employment industries in Rogers County include Manufacturing (6,024 | 13.0%), Health Care & Social Assistance (5,856 | 12.6%), Retail Trade (5,293 | 11.4%), Construction (3,944 | 8.5%), and Educational Services (3,685 | 7.9%).
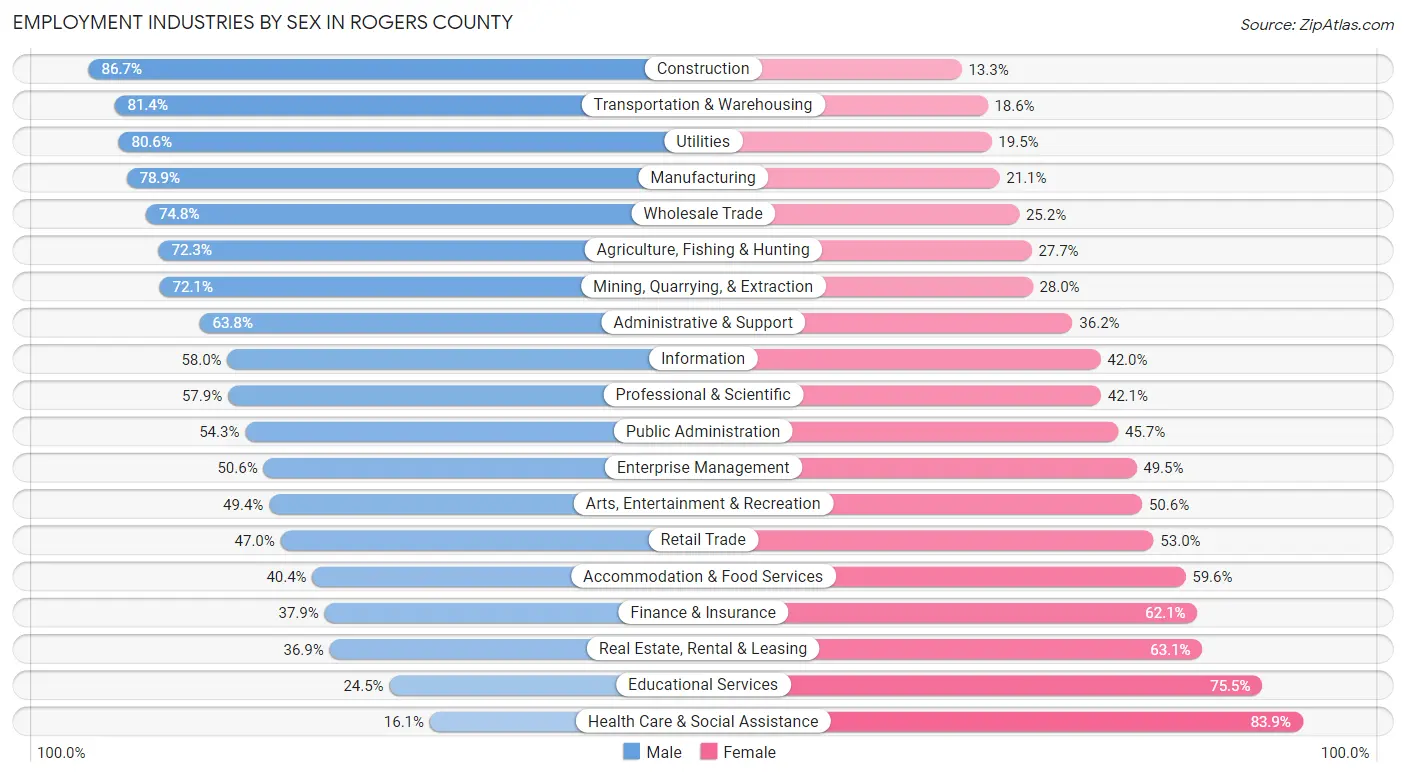
Employment Industries by Sex in Rogers County
The Rogers County industries that see more men than women are Construction (86.7%), Transportation & Warehousing (81.4%), and Utilities (80.5%), whereas the industries that tend to have a higher number of women are Health Care & Social Assistance (83.9%), Educational Services (75.5%), and Real Estate, Rental & Leasing (63.1%).
| Industry | Male | Female |
| Agriculture, Fishing & Hunting | 323 (72.3%) | 124 (27.7%) |
| Mining, Quarrying, & Extraction | 598 (72.1%) | 232 (28.0%) |
| Construction | 3,421 (86.7%) | 523 (13.3%) |
| Manufacturing | 4,753 (78.9%) | 1,271 (21.1%) |
| Wholesale Trade | 937 (74.8%) | 315 (25.2%) |
| Retail Trade | 2,488 (47.0%) | 2,805 (53.0%) |
| Transportation & Warehousing | 2,634 (81.4%) | 603 (18.6%) |
| Utilities | 675 (80.5%) | 163 (19.5%) |
| Information | 409 (58.0%) | 296 (42.0%) |
| Finance & Insurance | 684 (37.9%) | 1,120 (62.1%) |
| Real Estate, Rental & Leasing | 267 (36.9%) | 457 (63.1%) |
| Professional & Scientific | 1,382 (57.9%) | 1,005 (42.1%) |
| Enterprise Management | 46 (50.5%) | 45 (49.4%) |
| Administrative & Support | 1,046 (63.8%) | 594 (36.2%) |
| Educational Services | 902 (24.5%) | 2,783 (75.5%) |
| Health Care & Social Assistance | 944 (16.1%) | 4,912 (83.9%) |
| Arts, Entertainment & Recreation | 562 (49.4%) | 576 (50.6%) |
| Accommodation & Food Services | 1,070 (40.4%) | 1,577 (59.6%) |
| Public Administration | 997 (54.3%) | 838 (45.7%) |
| Total | 25,304 (54.5%) | 21,118 (45.5%) |
Education in Rogers County
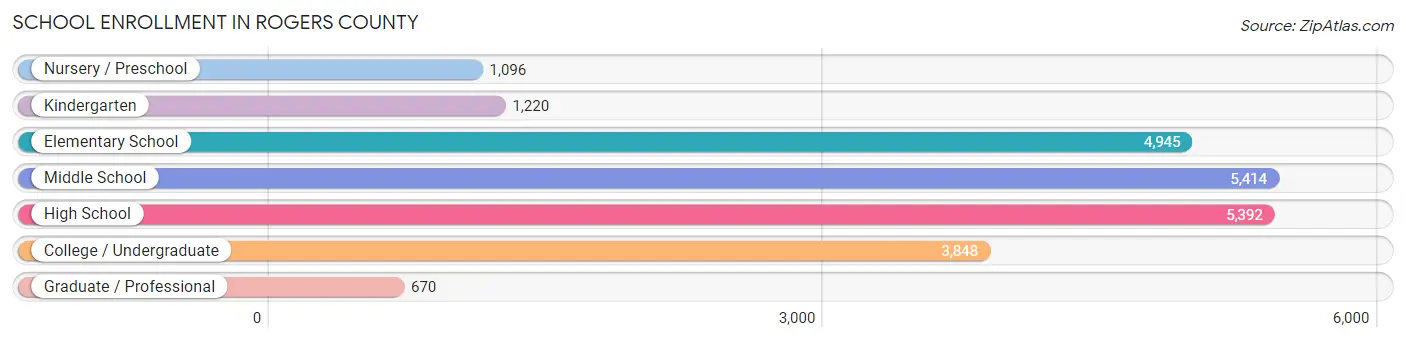
School Enrollment in Rogers County
The most common levels of schooling among the 22,585 students in Rogers County are middle school (5,414 | 24.0%), high school (5,392 | 23.9%), and elementary school (4,945 | 21.9%).
| School Level | # Students | % Students |
| Nursery / Preschool | 1,096 | 4.9% |
| Kindergarten | 1,220 | 5.4% |
| Elementary School | 4,945 | 21.9% |
| Middle School | 5,414 | 24.0% |
| High School | 5,392 | 23.9% |
| College / Undergraduate | 3,848 | 17.0% |
| Graduate / Professional | 670 | 3.0% |
| Total | 22,585 | 100.0% |
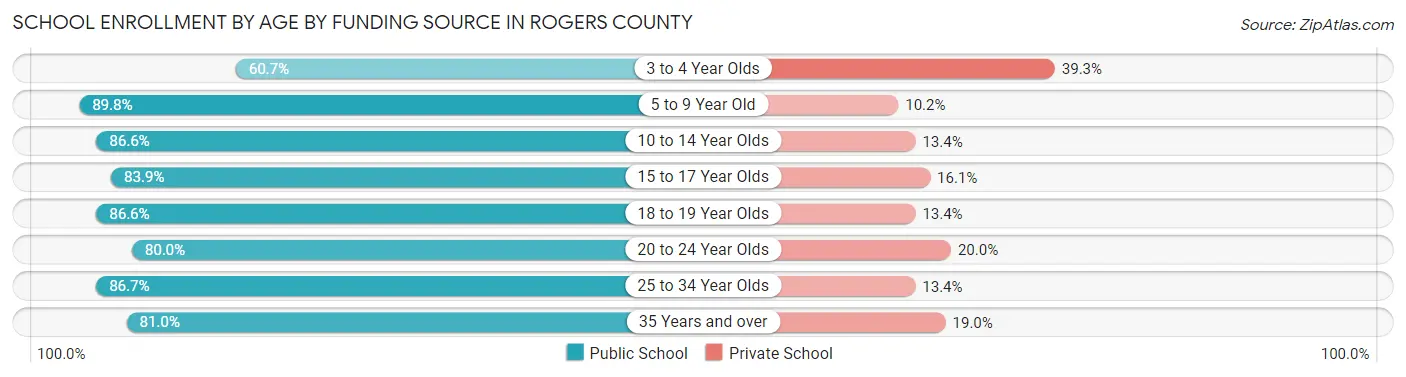
School Enrollment by Age by Funding Source in Rogers County
Out of a total of 22,585 students who are enrolled in schools in Rogers County, 3,343 (14.8%) attend a private institution, while the remaining 19,242 (85.2%) are enrolled in public schools. The age group of 3 to 4 year olds has the highest likelihood of being enrolled in private schools, with 312 (39.3% in the age bracket) enrolled. Conversely, the age group of 5 to 9 year old has the lowest likelihood of being enrolled in a private school, with 5,036 (89.8% in the age bracket) attending a public institution.
| Age Bracket | Public School | Private School |
| 3 to 4 Year Olds | 481 (60.7%) | 312 (39.3%) |
| 5 to 9 Year Old | 5,036 (89.8%) | 571 (10.2%) |
| 10 to 14 Year Olds | 5,755 (86.6%) | 889 (13.4%) |
| 15 to 17 Year Olds | 3,264 (83.9%) | 627 (16.1%) |
| 18 to 19 Year Olds | 1,503 (86.6%) | 232 (13.4%) |
| 20 to 24 Year Olds | 1,645 (80.0%) | 411 (20.0%) |
| 25 to 34 Year Olds | 876 (86.7%) | 135 (13.4%) |
| 35 Years and over | 687 (81.0%) | 161 (19.0%) |
| Total | 19,242 (85.2%) | 3,343 (14.8%) |
Educational Attainment by Field of Study in Rogers County
Business (4,440 | 25.3%), education (3,161 | 18.0%), science & technology (2,097 | 12.0%), arts & humanities (1,346 | 7.7%), and engineering (1,156 | 6.6%) are the most common fields of study among 17,529 individuals in Rogers County who have obtained a bachelor's degree or higher.
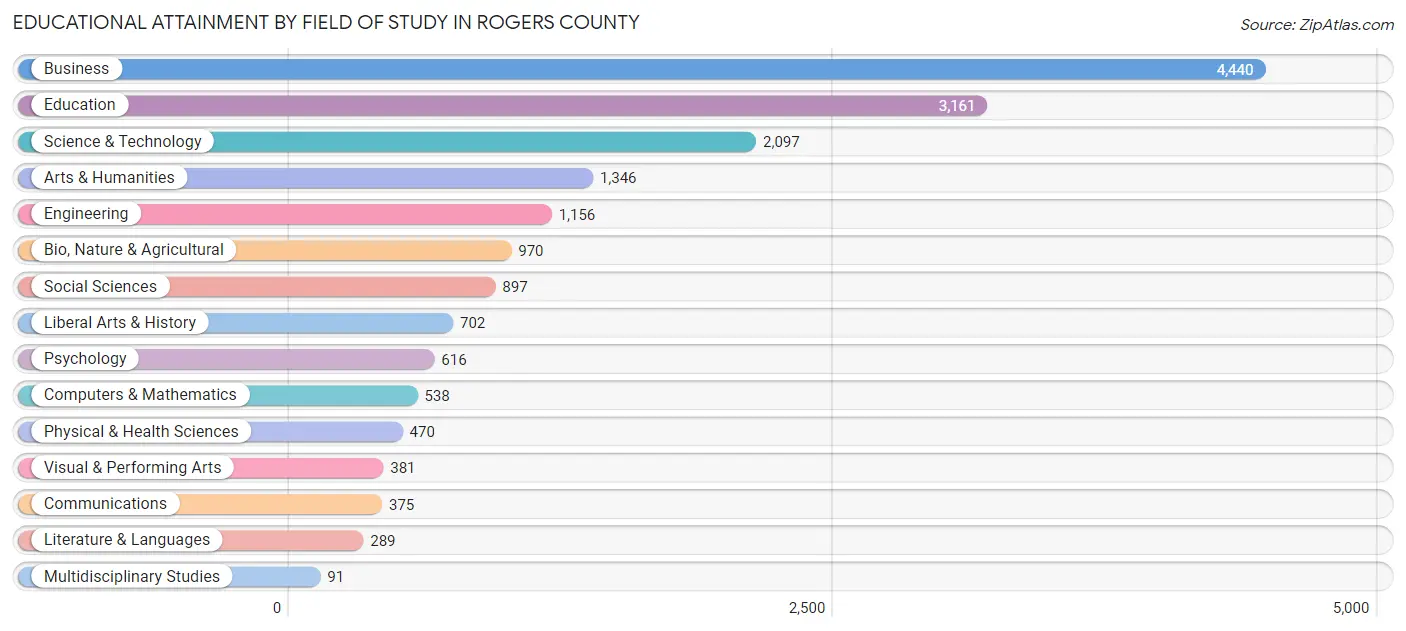
| Field of Study | # Graduates | % Graduates |
| Computers & Mathematics | 538 | 3.1% |
| Bio, Nature & Agricultural | 970 | 5.5% |
| Physical & Health Sciences | 470 | 2.7% |
| Psychology | 616 | 3.5% |
| Social Sciences | 897 | 5.1% |
| Engineering | 1,156 | 6.6% |
| Multidisciplinary Studies | 91 | 0.5% |
| Science & Technology | 2,097 | 12.0% |
| Business | 4,440 | 25.3% |
| Education | 3,161 | 18.0% |
| Literature & Languages | 289 | 1.7% |
| Liberal Arts & History | 702 | 4.0% |
| Visual & Performing Arts | 381 | 2.2% |
| Communications | 375 | 2.1% |
| Arts & Humanities | 1,346 | 7.7% |
| Total | 17,529 | 100.0% |
Transportation & Commute in Rogers County
Vehicle Availability by Sex in Rogers County
The most prevalent vehicle ownership categories in Rogers County are males with 2 vehicles (9,732, accounting for 39.3%) and females with 2 vehicles (7,973, making up 46.9%).
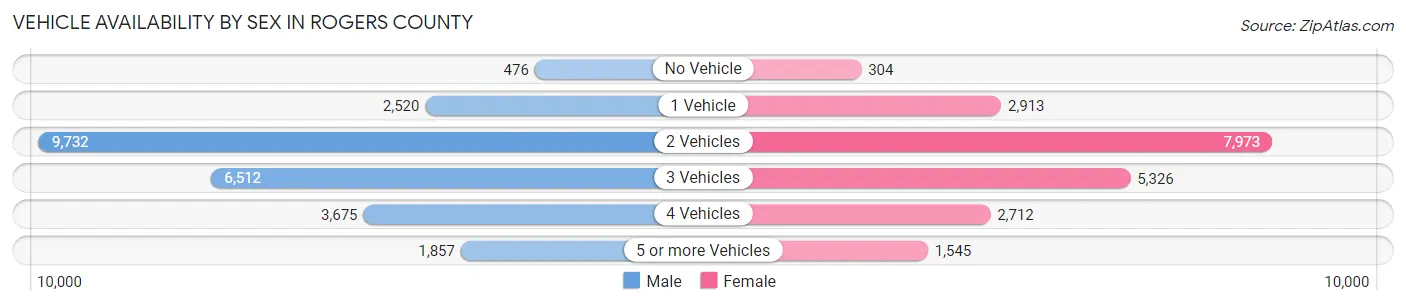
| Vehicles Available | Male | Female |
| No Vehicle | 476 (1.9%) | 304 (1.5%) |
| 1 Vehicle | 2,520 (10.2%) | 2,913 (14.0%) |
| 2 Vehicles | 9,732 (39.3%) | 7,973 (38.4%) |
| 3 Vehicles | 6,512 (26.3%) | 5,326 (25.6%) |
| 4 Vehicles | 3,675 (14.8%) | 2,712 (13.1%) |
| 5 or more Vehicles | 1,857 (7.5%) | 1,545 (7.4%) |
| Total | 24,772 (100.0%) | 20,773 (100.0%) |
Commute Time in Rogers County
The most frequently occuring commute durations in Rogers County are 30 to 34 minutes (7,501 commuters, 17.8%), 20 to 24 minutes (5,751 commuters, 13.7%), and 10 to 14 minutes (5,560 commuters, 13.2%).
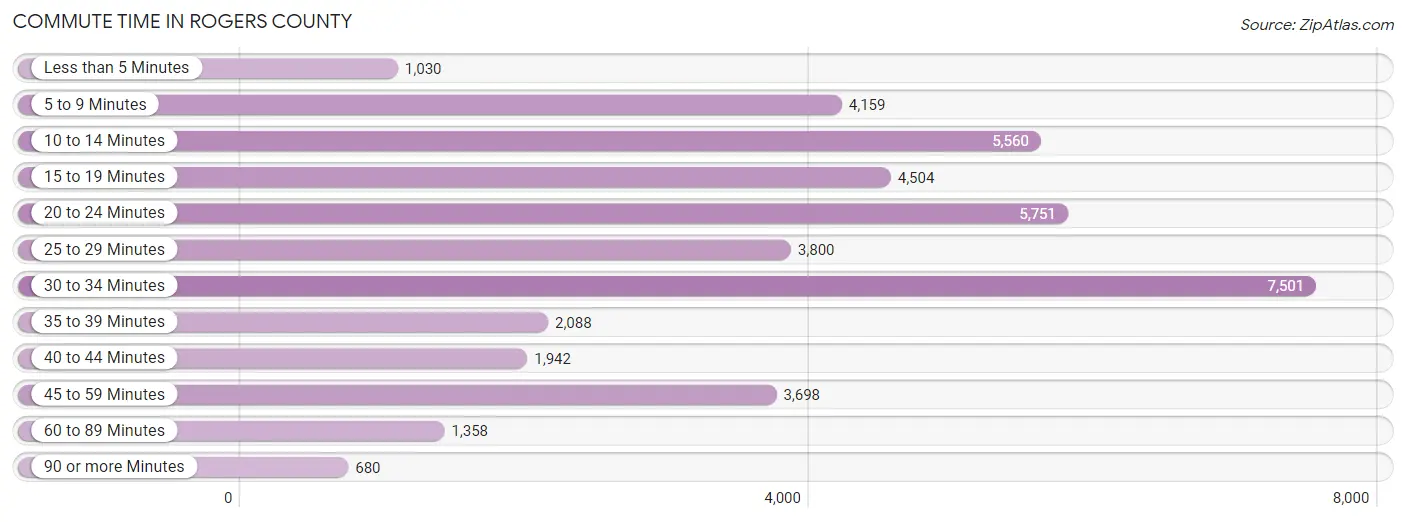
| Commute Time | # Commuters | % Commuters |
| Less than 5 Minutes | 1,030 | 2.5% |
| 5 to 9 Minutes | 4,159 | 9.9% |
| 10 to 14 Minutes | 5,560 | 13.2% |
| 15 to 19 Minutes | 4,504 | 10.7% |
| 20 to 24 Minutes | 5,751 | 13.7% |
| 25 to 29 Minutes | 3,800 | 9.0% |
| 30 to 34 Minutes | 7,501 | 17.8% |
| 35 to 39 Minutes | 2,088 | 5.0% |
| 40 to 44 Minutes | 1,942 | 4.6% |
| 45 to 59 Minutes | 3,698 | 8.8% |
| 60 to 89 Minutes | 1,358 | 3.2% |
| 90 or more Minutes | 680 | 1.6% |
Commute Time by Sex in Rogers County
The most common commute times in Rogers County are 30 to 34 minutes (4,354 commuters, 18.8%) for males and 30 to 34 minutes (3,147 commuters, 16.6%) for females.
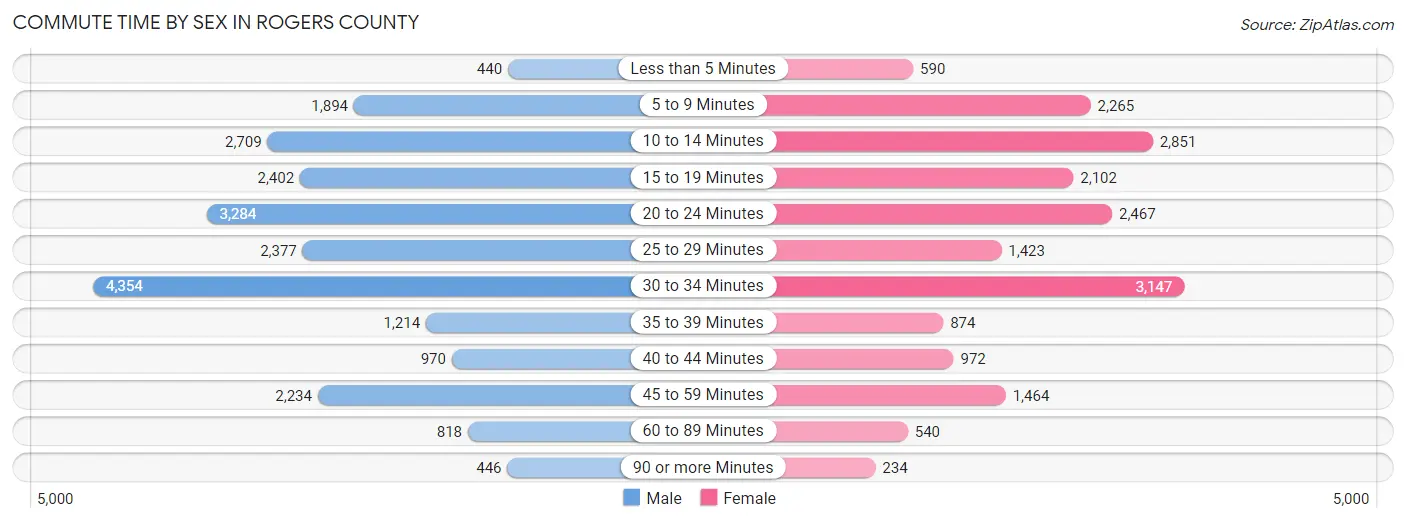
| Commute Time | Male | Female |
| Less than 5 Minutes | 440 (1.9%) | 590 (3.1%) |
| 5 to 9 Minutes | 1,894 (8.2%) | 2,265 (12.0%) |
| 10 to 14 Minutes | 2,709 (11.7%) | 2,851 (15.1%) |
| 15 to 19 Minutes | 2,402 (10.4%) | 2,102 (11.1%) |
| 20 to 24 Minutes | 3,284 (14.2%) | 2,467 (13.0%) |
| 25 to 29 Minutes | 2,377 (10.3%) | 1,423 (7.5%) |
| 30 to 34 Minutes | 4,354 (18.8%) | 3,147 (16.6%) |
| 35 to 39 Minutes | 1,214 (5.2%) | 874 (4.6%) |
| 40 to 44 Minutes | 970 (4.2%) | 972 (5.1%) |
| 45 to 59 Minutes | 2,234 (9.7%) | 1,464 (7.7%) |
| 60 to 89 Minutes | 818 (3.5%) | 540 (2.9%) |
| 90 or more Minutes | 446 (1.9%) | 234 (1.2%) |
Time of Departure to Work by Sex in Rogers County
The most frequent times of departure to work in Rogers County are 7:00 AM to 7:29 AM (3,142, 13.6%) for males and 7:00 AM to 7:29 AM (3,420, 18.1%) for females.
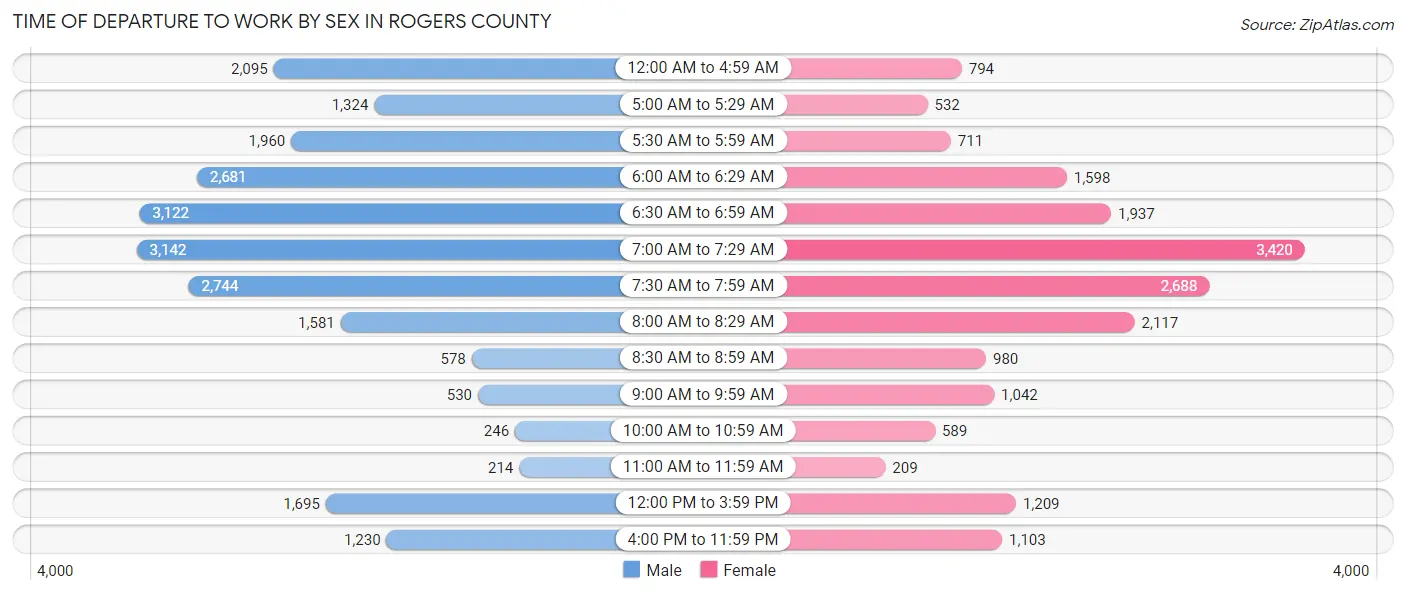
| Time of Departure | Male | Female |
| 12:00 AM to 4:59 AM | 2,095 (9.0%) | 794 (4.2%) |
| 5:00 AM to 5:29 AM | 1,324 (5.7%) | 532 (2.8%) |
| 5:30 AM to 5:59 AM | 1,960 (8.5%) | 711 (3.8%) |
| 6:00 AM to 6:29 AM | 2,681 (11.6%) | 1,598 (8.4%) |
| 6:30 AM to 6:59 AM | 3,122 (13.5%) | 1,937 (10.2%) |
| 7:00 AM to 7:29 AM | 3,142 (13.6%) | 3,420 (18.1%) |
| 7:30 AM to 7:59 AM | 2,744 (11.9%) | 2,688 (14.2%) |
| 8:00 AM to 8:29 AM | 1,581 (6.8%) | 2,117 (11.2%) |
| 8:30 AM to 8:59 AM | 578 (2.5%) | 980 (5.2%) |
| 9:00 AM to 9:59 AM | 530 (2.3%) | 1,042 (5.5%) |
| 10:00 AM to 10:59 AM | 246 (1.1%) | 589 (3.1%) |
| 11:00 AM to 11:59 AM | 214 (0.9%) | 209 (1.1%) |
| 12:00 PM to 3:59 PM | 1,695 (7.3%) | 1,209 (6.4%) |
| 4:00 PM to 11:59 PM | 1,230 (5.3%) | 1,103 (5.8%) |
| Total | 23,142 (100.0%) | 18,929 (100.0%) |
Housing Occupancy in Rogers County
Occupancy by Ownership in Rogers County
Of the total 35,101 dwellings in Rogers County, owner-occupied units account for 27,149 (77.3%), while renter-occupied units make up 7,952 (22.7%).
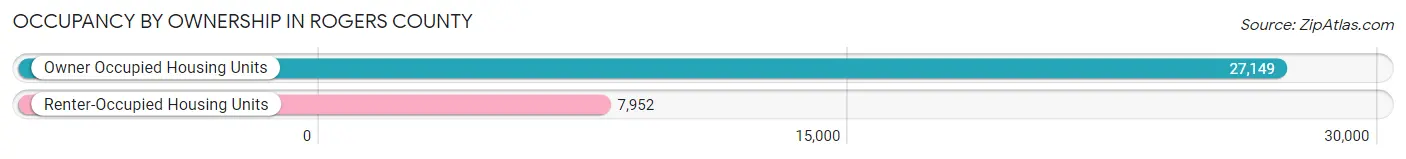
| Occupancy | # Housing Units | % Housing Units |
| Owner Occupied Housing Units | 27,149 | 77.3% |
| Renter-Occupied Housing Units | 7,952 | 22.7% |
| Total Occupied Housing Units | 35,101 | 100.0% |
Occupancy by Household Size in Rogers County
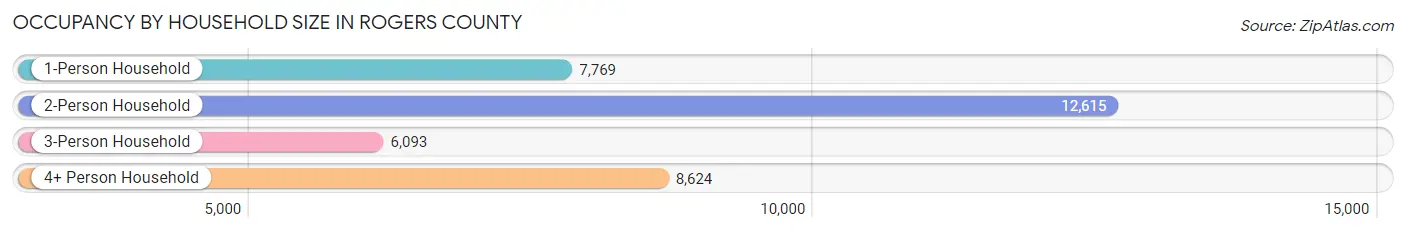
| Household Size | # Housing Units | % Housing Units |
| 1-Person Household | 7,769 | 22.1% |
| 2-Person Household | 12,615 | 35.9% |
| 3-Person Household | 6,093 | 17.4% |
| 4+ Person Household | 8,624 | 24.6% |
| Total Housing Units | 35,101 | 100.0% |
Occupancy by Ownership by Household Size in Rogers County
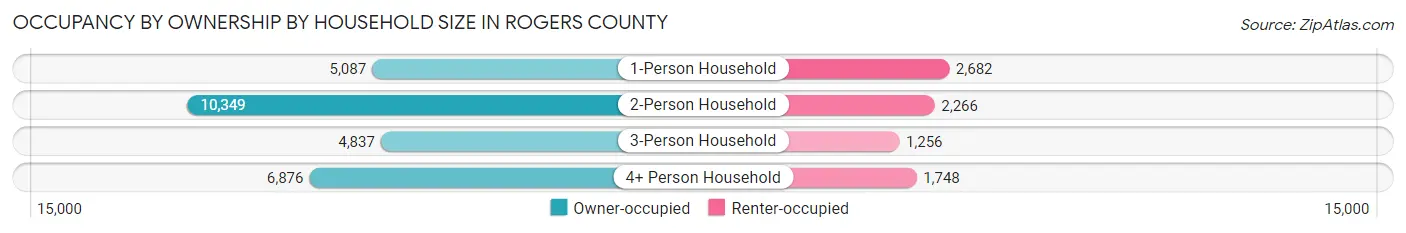
| Household Size | Owner-occupied | Renter-occupied |
| 1-Person Household | 5,087 (65.5%) | 2,682 (34.5%) |
| 2-Person Household | 10,349 (82.0%) | 2,266 (18.0%) |
| 3-Person Household | 4,837 (79.4%) | 1,256 (20.6%) |
| 4+ Person Household | 6,876 (79.7%) | 1,748 (20.3%) |
| Total Housing Units | 27,149 (77.3%) | 7,952 (22.7%) |
Occupancy by Educational Attainment in Rogers County
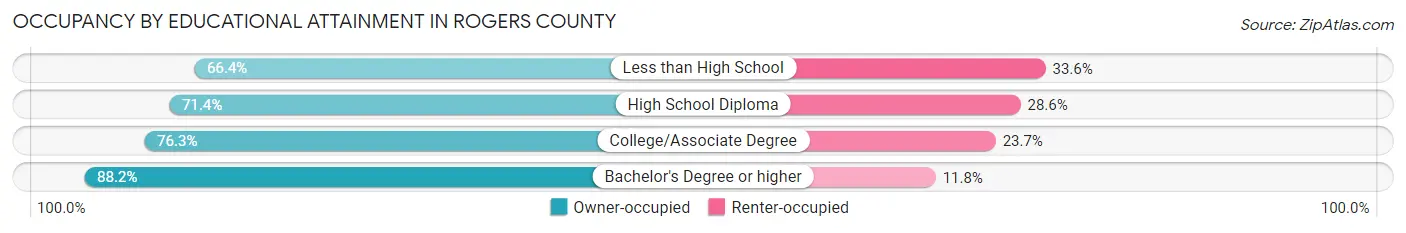
| Household Size | Owner-occupied | Renter-occupied |
| Less than High School | 1,596 (66.4%) | 807 (33.6%) |
| High School Diploma | 7,333 (71.4%) | 2,941 (28.6%) |
| College/Associate Degree | 9,992 (76.3%) | 3,103 (23.7%) |
| Bachelor's Degree or higher | 8,228 (88.2%) | 1,101 (11.8%) |
Occupancy by Age of Householder in Rogers County
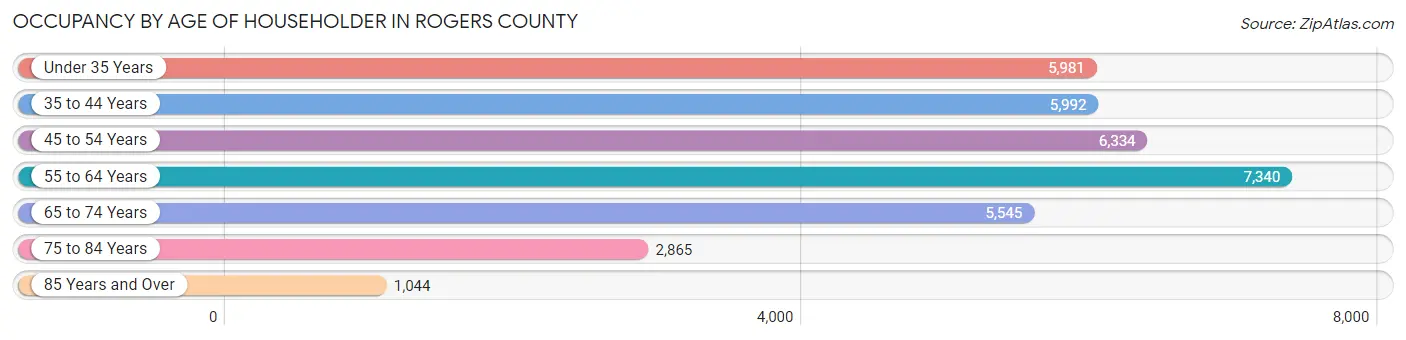
| Age Bracket | # Households | % Households |
| Under 35 Years | 5,981 | 17.0% |
| 35 to 44 Years | 5,992 | 17.1% |
| 45 to 54 Years | 6,334 | 18.0% |
| 55 to 64 Years | 7,340 | 20.9% |
| 65 to 74 Years | 5,545 | 15.8% |
| 75 to 84 Years | 2,865 | 8.2% |
| 85 Years and Over | 1,044 | 3.0% |
| Total | 35,101 | 100.0% |
Housing Finances in Rogers County
Median Income by Occupancy in Rogers County
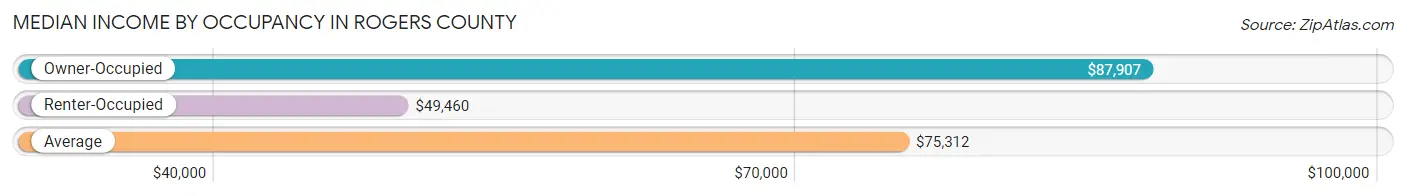
| Occupancy Type | # Households | Median Income |
| Owner-Occupied | 27,149 (77.3%) | $87,907 |
| Renter-Occupied | 7,952 (22.7%) | $49,460 |
| Average | 35,101 (100.0%) | $75,312 |
Occupancy by Householder Income Bracket in Rogers County
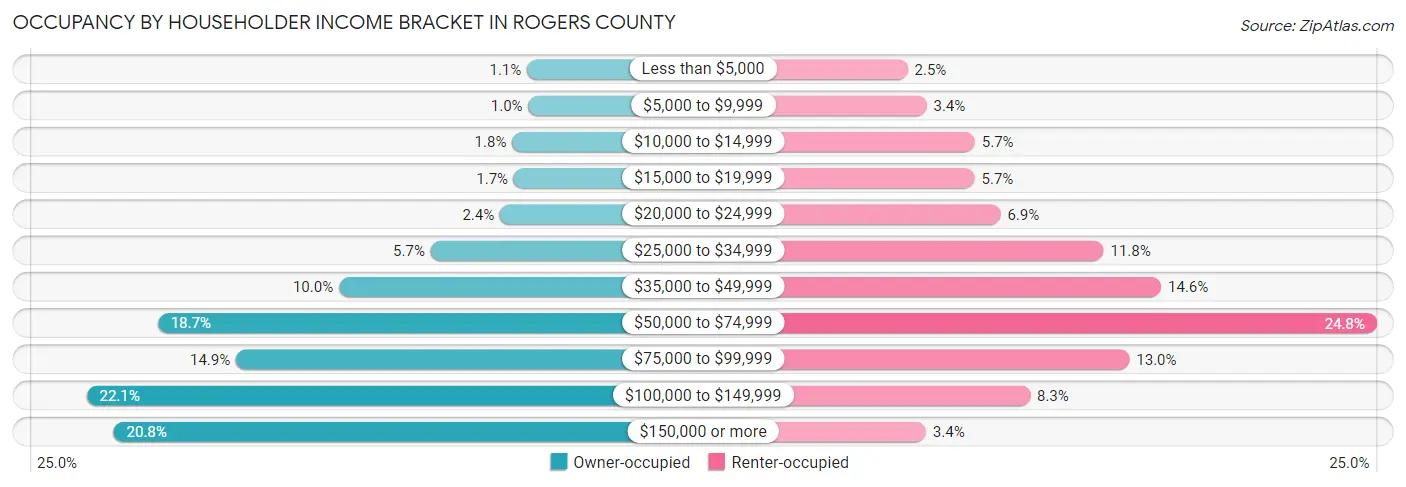
| Income Bracket | Owner-occupied | Renter-occupied |
| Less than $5,000 | 291 (1.1%) | 197 (2.5%) |
| $5,000 to $9,999 | 273 (1.0%) | 269 (3.4%) |
| $10,000 to $14,999 | 482 (1.8%) | 452 (5.7%) |
| $15,000 to $19,999 | 462 (1.7%) | 451 (5.7%) |
| $20,000 to $24,999 | 642 (2.4%) | 549 (6.9%) |
| $25,000 to $34,999 | 1,537 (5.7%) | 939 (11.8%) |
| $35,000 to $49,999 | 2,723 (10.0%) | 1,157 (14.5%) |
| $50,000 to $74,999 | 5,065 (18.7%) | 1,974 (24.8%) |
| $75,000 to $99,999 | 4,052 (14.9%) | 1,037 (13.0%) |
| $100,000 to $149,999 | 5,987 (22.1%) | 661 (8.3%) |
| $150,000 or more | 5,635 (20.8%) | 266 (3.4%) |
| Total | 27,149 (100.0%) | 7,952 (100.0%) |
Monthly Housing Cost Tiers in Rogers County
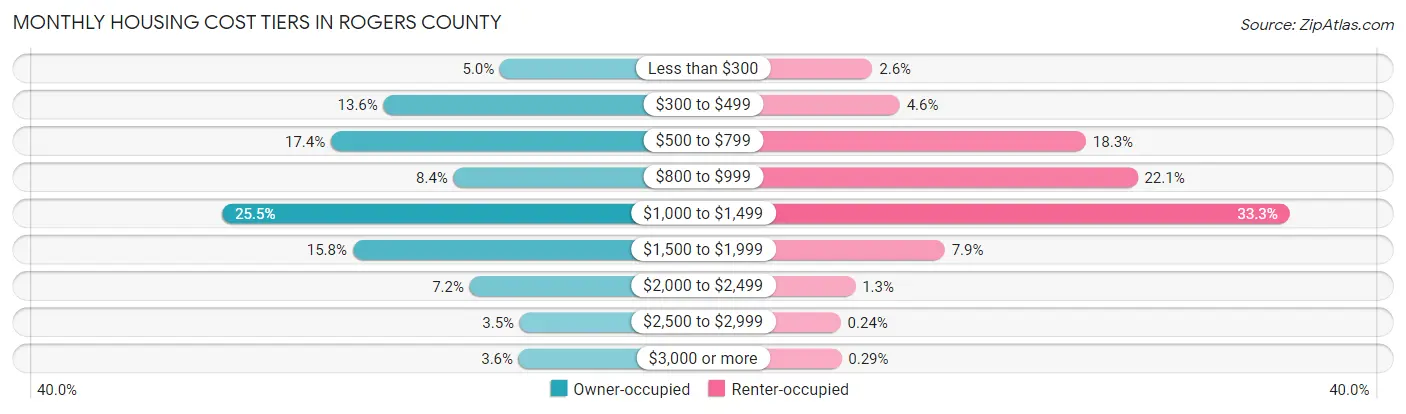
| Monthly Cost | Owner-occupied | Renter-occupied |
| Less than $300 | 1,353 (5.0%) | 204 (2.6%) |
| $300 to $499 | 3,681 (13.6%) | 365 (4.6%) |
| $500 to $799 | 4,732 (17.4%) | 1,455 (18.3%) |
| $800 to $999 | 2,280 (8.4%) | 1,757 (22.1%) |
| $1,000 to $1,499 | 6,913 (25.5%) | 2,648 (33.3%) |
| $1,500 to $1,999 | 4,297 (15.8%) | 628 (7.9%) |
| $2,000 to $2,499 | 1,958 (7.2%) | 104 (1.3%) |
| $2,500 to $2,999 | 957 (3.5%) | 19 (0.2%) |
| $3,000 or more | 978 (3.6%) | 23 (0.3%) |
| Total | 27,149 (100.0%) | 7,952 (100.0%) |
Physical Housing Characteristics in Rogers County
Housing Structures in Rogers County
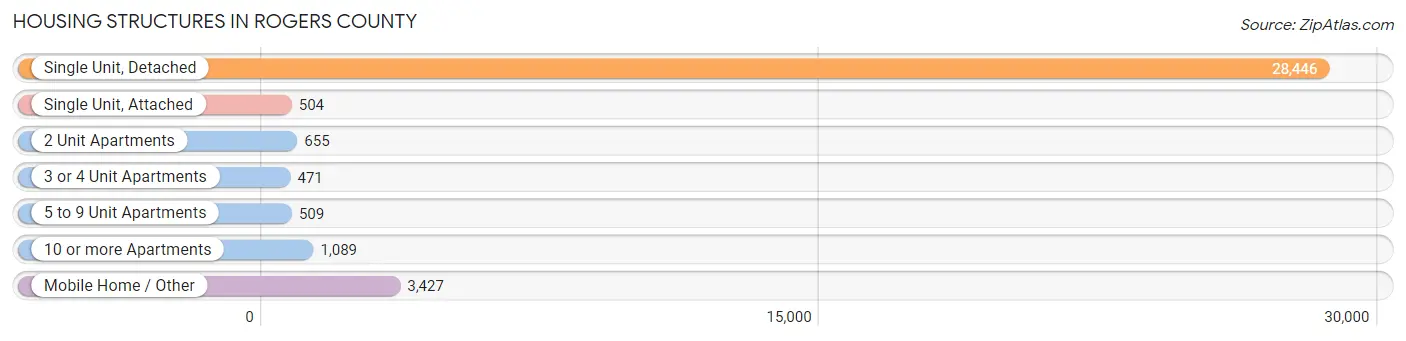
| Structure Type | # Housing Units | % Housing Units |
| Single Unit, Detached | 28,446 | 81.0% |
| Single Unit, Attached | 504 | 1.4% |
| 2 Unit Apartments | 655 | 1.9% |
| 3 or 4 Unit Apartments | 471 | 1.3% |
| 5 to 9 Unit Apartments | 509 | 1.5% |
| 10 or more Apartments | 1,089 | 3.1% |
| Mobile Home / Other | 3,427 | 9.8% |
| Total | 35,101 | 100.0% |
Housing Structures by Occupancy in Rogers County
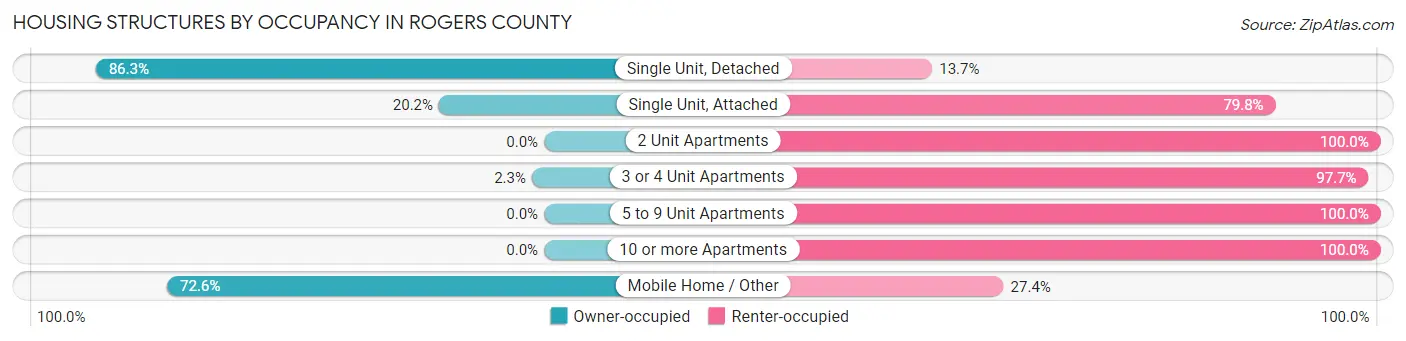
| Structure Type | Owner-occupied | Renter-occupied |
| Single Unit, Detached | 24,549 (86.3%) | 3,897 (13.7%) |
| Single Unit, Attached | 102 (20.2%) | 402 (79.8%) |
| 2 Unit Apartments | 0 (0.0%) | 655 (100.0%) |
| 3 or 4 Unit Apartments | 11 (2.3%) | 460 (97.7%) |
| 5 to 9 Unit Apartments | 0 (0.0%) | 509 (100.0%) |
| 10 or more Apartments | 0 (0.0%) | 1,089 (100.0%) |
| Mobile Home / Other | 2,487 (72.6%) | 940 (27.4%) |
| Total | 27,149 (77.3%) | 7,952 (22.7%) |
Housing Structures by Number of Rooms in Rogers County
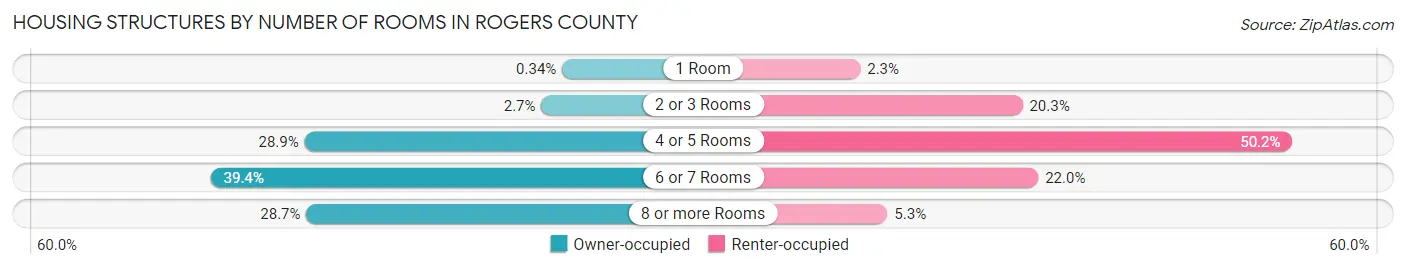
| Number of Rooms | Owner-occupied | Renter-occupied |
| 1 Room | 92 (0.3%) | 180 (2.3%) |
| 2 or 3 Rooms | 720 (2.6%) | 1,611 (20.3%) |
| 4 or 5 Rooms | 7,853 (28.9%) | 3,992 (50.2%) |
| 6 or 7 Rooms | 10,683 (39.4%) | 1,750 (22.0%) |
| 8 or more Rooms | 7,801 (28.7%) | 419 (5.3%) |
| Total | 27,149 (100.0%) | 7,952 (100.0%) |
Housing Structure by Heating Type in Rogers County
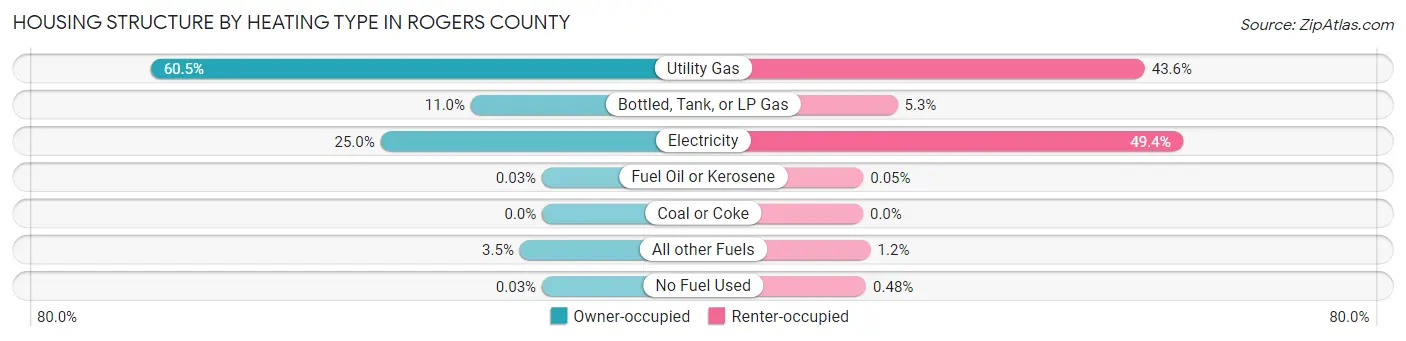
| Heating Type | Owner-occupied | Renter-occupied |
| Utility Gas | 16,424 (60.5%) | 3,464 (43.6%) |
| Bottled, Tank, or LP Gas | 2,990 (11.0%) | 425 (5.3%) |
| Electricity | 6,779 (25.0%) | 3,927 (49.4%) |
| Fuel Oil or Kerosene | 9 (0.0%) | 4 (0.1%) |
| Coal or Coke | 0 (0.0%) | 0 (0.0%) |
| All other Fuels | 938 (3.5%) | 94 (1.2%) |
| No Fuel Used | 9 (0.0%) | 38 (0.5%) |
| Total | 27,149 (100.0%) | 7,952 (100.0%) |
Household Vehicle Usage in Rogers County
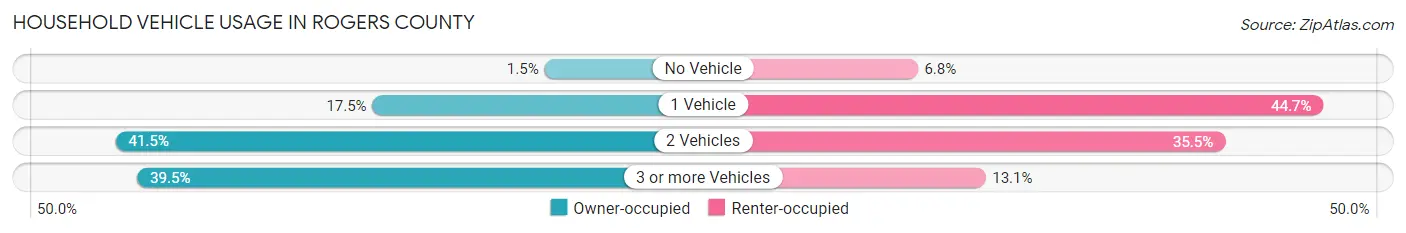
| Vehicles per Household | Owner-occupied | Renter-occupied |
| No Vehicle | 400 (1.5%) | 538 (6.8%) |
| 1 Vehicle | 4,759 (17.5%) | 3,551 (44.7%) |
| 2 Vehicles | 11,270 (41.5%) | 2,821 (35.5%) |
| 3 or more Vehicles | 10,720 (39.5%) | 1,042 (13.1%) |
| Total | 27,149 (100.0%) | 7,952 (100.0%) |
Real Estate & Mortgages in Rogers County
Real Estate and Mortgage Overview in Rogers County
| Characteristic | Without Mortgage | With Mortgage |
| Housing Units | 10,191 | 16,958 |
| Median Property Value | $191,200 | $214,800 |
| Median Household Income | $64,888 | $4,361 |
| Monthly Housing Costs | $510 | $971 |
| Real Estate Taxes | $1,421 | $770 |
Property Value by Mortgage Status in Rogers County
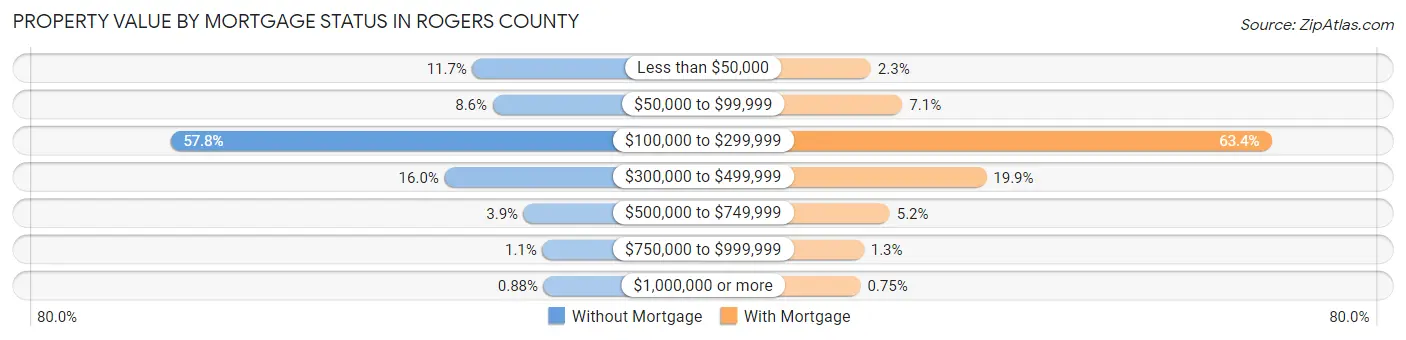
| Property Value | Without Mortgage | With Mortgage |
| Less than $50,000 | 1,194 (11.7%) | 397 (2.3%) |
| $50,000 to $99,999 | 880 (8.6%) | 1,210 (7.1%) |
| $100,000 to $299,999 | 5,891 (57.8%) | 10,747 (63.4%) |
| $300,000 to $499,999 | 1,630 (16.0%) | 3,379 (19.9%) |
| $500,000 to $749,999 | 398 (3.9%) | 885 (5.2%) |
| $750,000 to $999,999 | 108 (1.1%) | 212 (1.3%) |
| $1,000,000 or more | 90 (0.9%) | 128 (0.7%) |
| Total | 10,191 (100.0%) | 16,958 (100.0%) |
Household Income by Mortgage Status in Rogers County
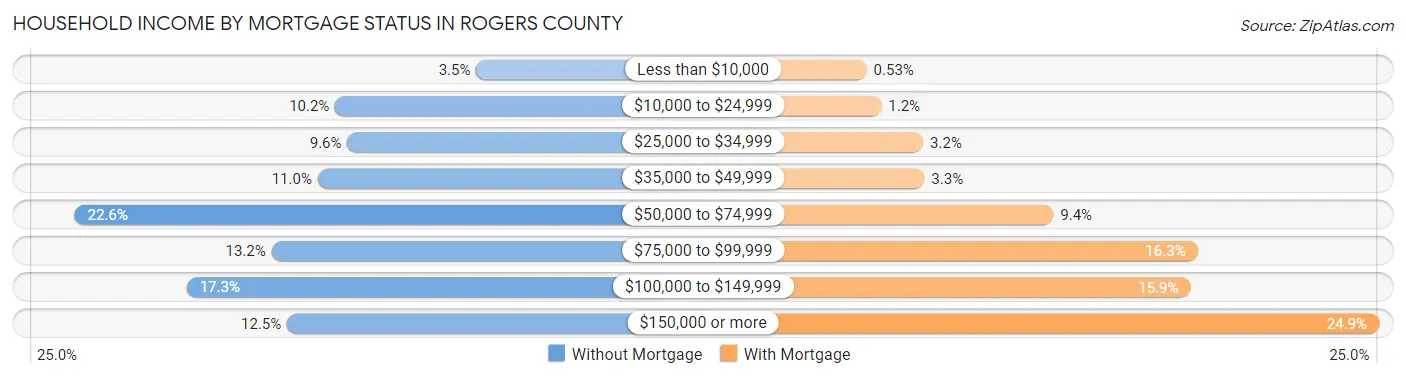
| Household Income | Without Mortgage | With Mortgage |
| Less than $10,000 | 356 (3.5%) | 90 (0.5%) |
| $10,000 to $24,999 | 1,040 (10.2%) | 208 (1.2%) |
| $25,000 to $34,999 | 981 (9.6%) | 546 (3.2%) |
| $35,000 to $49,999 | 1,125 (11.0%) | 556 (3.3%) |
| $50,000 to $74,999 | 2,305 (22.6%) | 1,598 (9.4%) |
| $75,000 to $99,999 | 1,349 (13.2%) | 2,760 (16.3%) |
| $100,000 to $149,999 | 1,761 (17.3%) | 2,703 (15.9%) |
| $150,000 or more | 1,274 (12.5%) | 4,226 (24.9%) |
| Total | 10,191 (100.0%) | 16,958 (100.0%) |
Property Value to Household Income Ratio in Rogers County
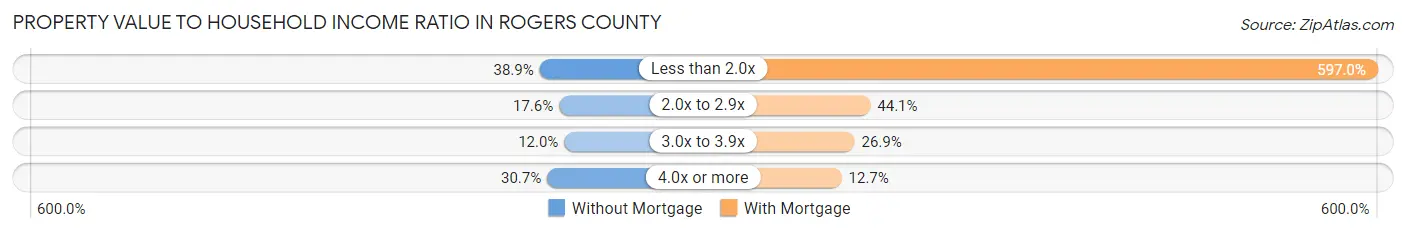
| Value-to-Income Ratio | Without Mortgage | With Mortgage |
| Less than 2.0x | 3,959 (38.9%) | 101,233 (597.0%) |
| 2.0x to 2.9x | 1,795 (17.6%) | 7,477 (44.1%) |
| 3.0x to 3.9x | 1,224 (12.0%) | 4,553 (26.9%) |
| 4.0x or more | 3,131 (30.7%) | 2,156 (12.7%) |
| Total | 10,191 (100.0%) | 16,958 (100.0%) |
Real Estate Taxes by Mortgage Status in Rogers County
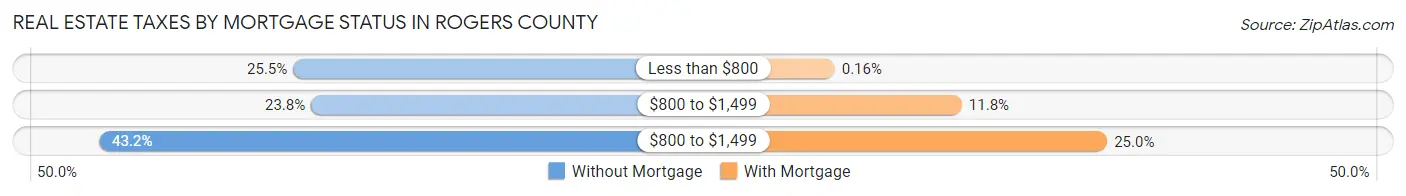
| Property Taxes | Without Mortgage | With Mortgage |
| Less than $800 | 2,597 (25.5%) | 27 (0.2%) |
| $800 to $1,499 | 2,430 (23.8%) | 1,996 (11.8%) |
| $800 to $1,499 | 4,401 (43.2%) | 4,246 (25.0%) |
| Total | 10,191 (100.0%) | 16,958 (100.0%) |
Health & Disability in Rogers County
Health Insurance Coverage by Age in Rogers County
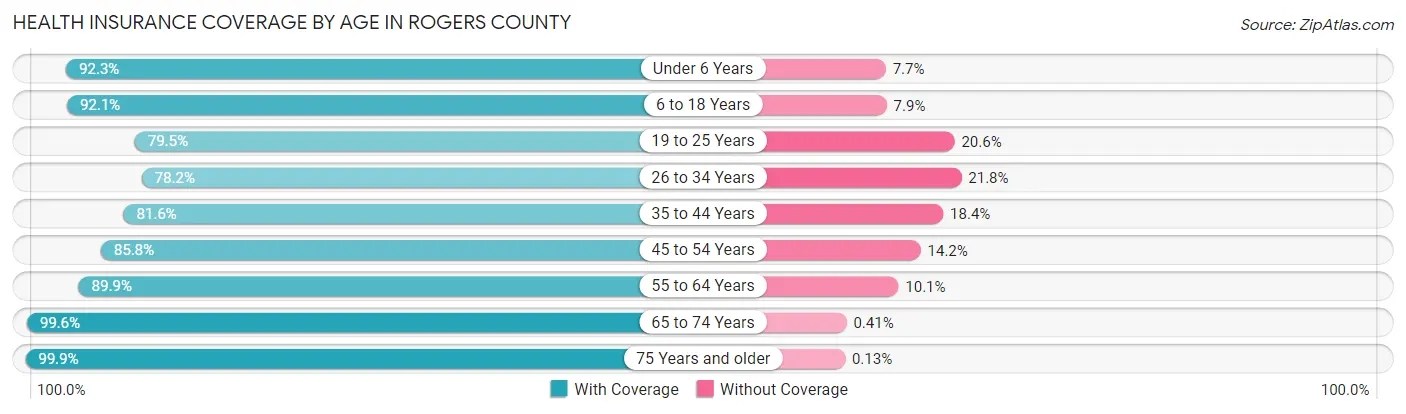
| Age Bracket | With Coverage | Without Coverage |
| Under 6 Years | 6,011 (92.3%) | 503 (7.7%) |
| 6 to 18 Years | 15,583 (92.1%) | 1,336 (7.9%) |
| 19 to 25 Years | 6,764 (79.4%) | 1,750 (20.5%) |
| 26 to 34 Years | 8,251 (78.2%) | 2,304 (21.8%) |
| 35 to 44 Years | 9,691 (81.6%) | 2,191 (18.4%) |
| 45 to 54 Years | 10,382 (85.8%) | 1,722 (14.2%) |
| 55 to 64 Years | 11,644 (89.9%) | 1,306 (10.1%) |
| 65 to 74 Years | 9,134 (99.6%) | 38 (0.4%) |
| 75 Years and older | 6,129 (99.9%) | 8 (0.1%) |
| Total | 83,589 (88.2%) | 11,158 (11.8%) |
Health Insurance Coverage by Citizenship Status in Rogers County
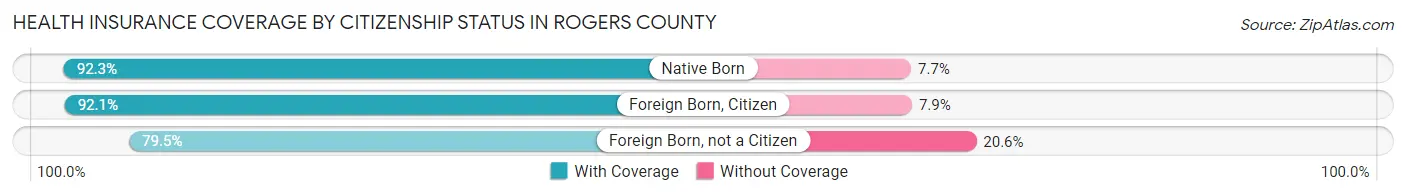
| Citizenship Status | With Coverage | Without Coverage |
| Native Born | 6,011 (92.3%) | 503 (7.7%) |
| Foreign Born, Citizen | 15,583 (92.1%) | 1,336 (7.9%) |
| Foreign Born, not a Citizen | 6,764 (79.4%) | 1,750 (20.5%) |
Health Insurance Coverage by Household Income in Rogers County
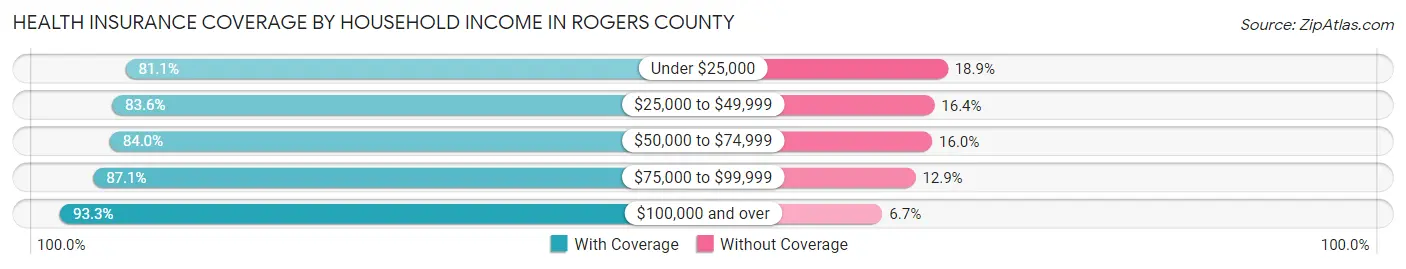
| Household Income | With Coverage | Without Coverage |
| Under $25,000 | 5,878 (81.1%) | 1,371 (18.9%) |
| $25,000 to $49,999 | 11,642 (83.6%) | 2,285 (16.4%) |
| $50,000 to $74,999 | 14,807 (84.0%) | 2,817 (16.0%) |
| $75,000 to $99,999 | 12,825 (87.1%) | 1,892 (12.9%) |
| $100,000 and over | 38,126 (93.3%) | 2,725 (6.7%) |
Public vs Private Health Insurance Coverage by Age in Rogers County
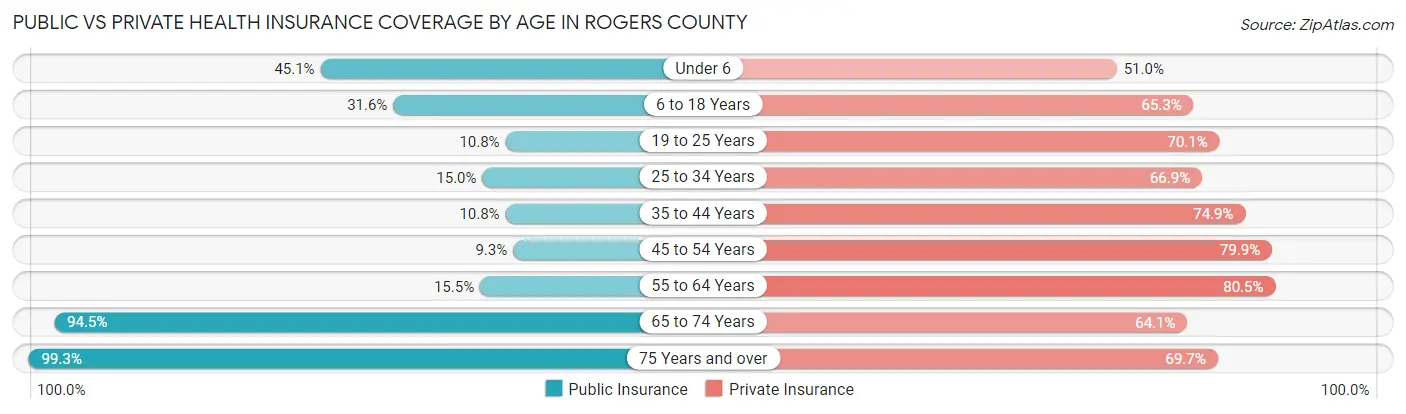
| Age Bracket | Public Insurance | Private Insurance |
| Under 6 | 2,937 (45.1%) | 3,324 (51.0%) |
| 6 to 18 Years | 5,343 (31.6%) | 11,046 (65.3%) |
| 19 to 25 Years | 915 (10.7%) | 5,969 (70.1%) |
| 25 to 34 Years | 1,586 (15.0%) | 7,056 (66.8%) |
| 35 to 44 Years | 1,277 (10.7%) | 8,898 (74.9%) |
| 45 to 54 Years | 1,131 (9.3%) | 9,667 (79.9%) |
| 55 to 64 Years | 2,003 (15.5%) | 10,418 (80.4%) |
| 65 to 74 Years | 8,670 (94.5%) | 5,881 (64.1%) |
| 75 Years and over | 6,092 (99.3%) | 4,280 (69.7%) |
| Total | 29,954 (31.6%) | 66,539 (70.2%) |
Disability Status by Sex by Age in Rogers County
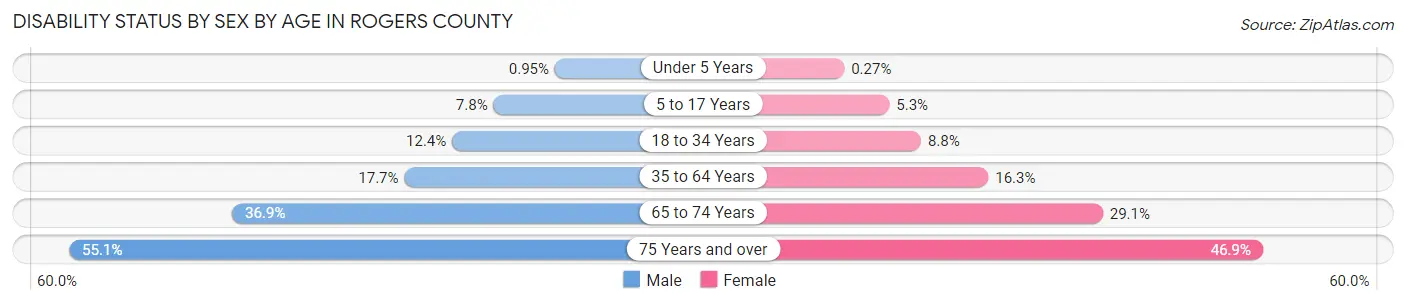
| Age Bracket | Male | Female |
| Under 5 Years | 27 (0.9%) | 7 (0.3%) |
| 5 to 17 Years | 666 (7.8%) | 427 (5.3%) |
| 18 to 34 Years | 1,287 (12.4%) | 885 (8.8%) |
| 35 to 64 Years | 3,270 (17.7%) | 3,015 (16.3%) |
| 65 to 74 Years | 1,598 (36.9%) | 1,407 (29.1%) |
| 75 Years and over | 1,489 (55.0%) | 1,609 (46.9%) |
Disability Class by Sex by Age in Rogers County
Disability Class: Hearing Difficulty
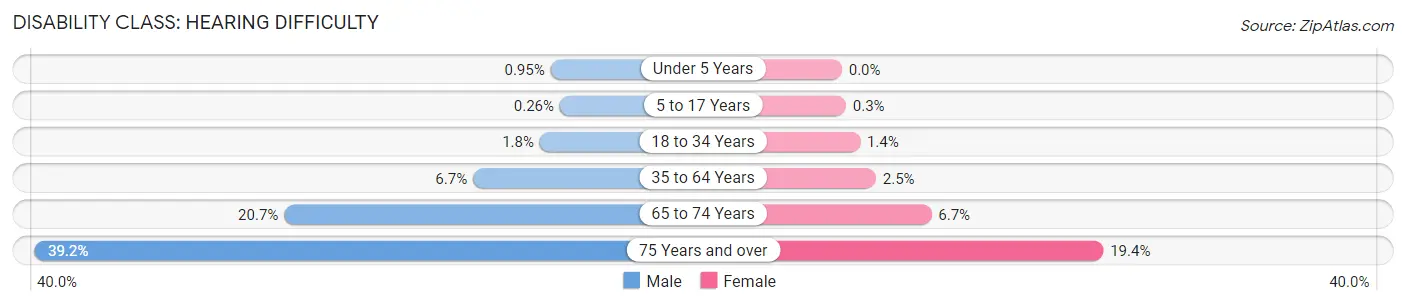
| Age Bracket | Male | Female |
| Under 5 Years | 27 (0.9%) | 0 (0.0%) |
| 5 to 17 Years | 22 (0.3%) | 24 (0.3%) |
| 18 to 34 Years | 182 (1.8%) | 136 (1.3%) |
| 35 to 64 Years | 1,239 (6.7%) | 467 (2.5%) |
| 65 to 74 Years | 898 (20.7%) | 322 (6.7%) |
| 75 Years and over | 1,061 (39.2%) | 666 (19.4%) |
Disability Class: Vision Difficulty
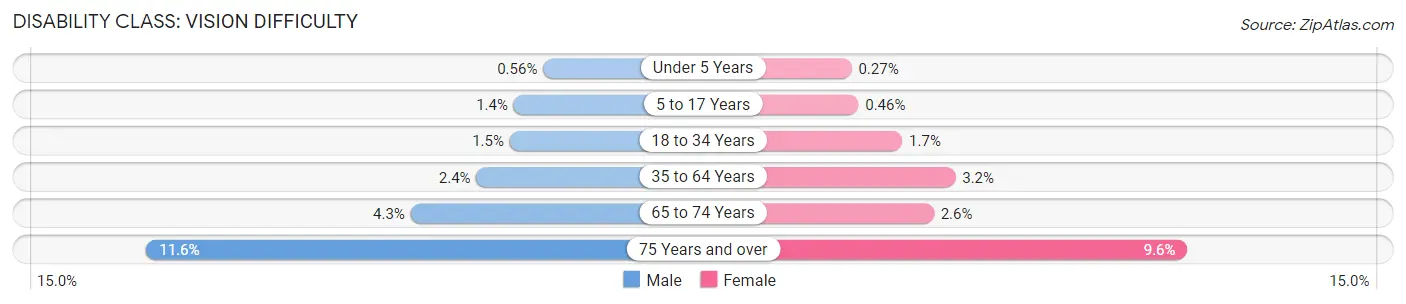
| Age Bracket | Male | Female |
| Under 5 Years | 16 (0.6%) | 7 (0.3%) |
| 5 to 17 Years | 118 (1.4%) | 37 (0.5%) |
| 18 to 34 Years | 155 (1.5%) | 169 (1.7%) |
| 35 to 64 Years | 446 (2.4%) | 584 (3.2%) |
| 65 to 74 Years | 184 (4.3%) | 124 (2.6%) |
| 75 Years and over | 314 (11.6%) | 330 (9.6%) |
Disability Class: Cognitive Difficulty
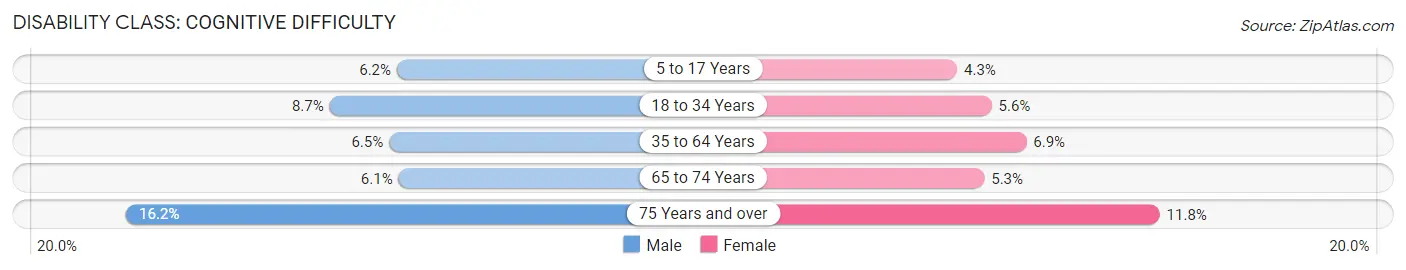
| Age Bracket | Male | Female |
| 5 to 17 Years | 529 (6.2%) | 345 (4.3%) |
| 18 to 34 Years | 902 (8.7%) | 558 (5.6%) |
| 35 to 64 Years | 1,195 (6.5%) | 1,265 (6.9%) |
| 65 to 74 Years | 265 (6.1%) | 256 (5.3%) |
| 75 Years and over | 439 (16.2%) | 405 (11.8%) |
Disability Class: Ambulatory Difficulty
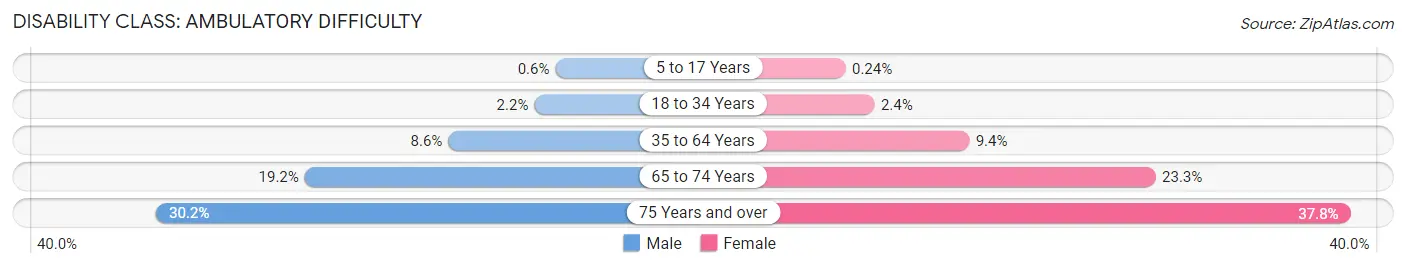
| Age Bracket | Male | Female |
| 5 to 17 Years | 51 (0.6%) | 19 (0.2%) |
| 18 to 34 Years | 224 (2.2%) | 240 (2.4%) |
| 35 to 64 Years | 1,579 (8.6%) | 1,741 (9.4%) |
| 65 to 74 Years | 832 (19.2%) | 1,126 (23.3%) |
| 75 Years and over | 818 (30.2%) | 1,296 (37.8%) |
Disability Class: Self-Care Difficulty
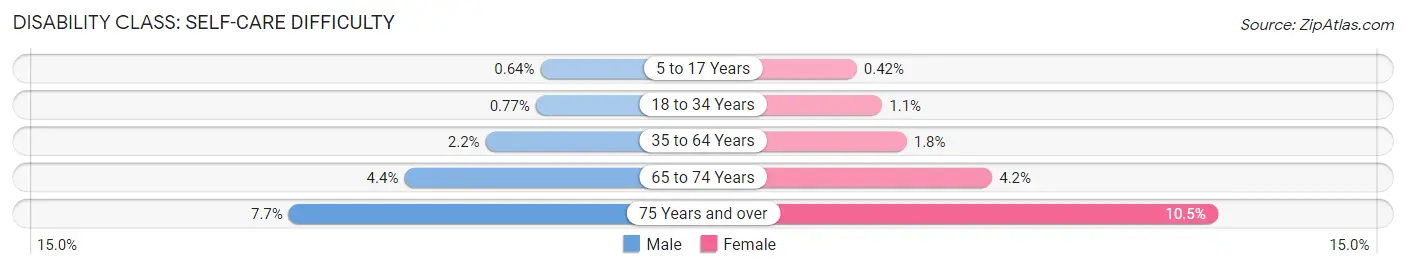
| Age Bracket | Male | Female |
| 5 to 17 Years | 55 (0.6%) | 34 (0.4%) |
| 18 to 34 Years | 80 (0.8%) | 113 (1.1%) |
| 35 to 64 Years | 400 (2.2%) | 334 (1.8%) |
| 65 to 74 Years | 192 (4.4%) | 203 (4.2%) |
| 75 Years and over | 207 (7.6%) | 359 (10.5%) |
Technology Access in Rogers County
Computing Device Access in Rogers County
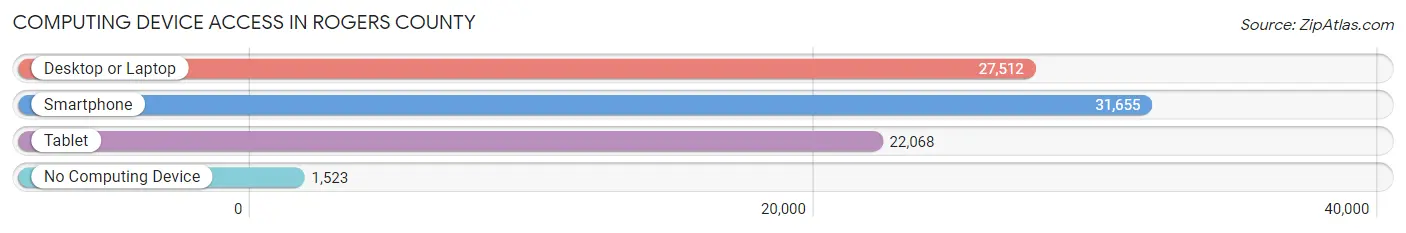
| Device Type | # Households | % Households |
| Desktop or Laptop | 27,512 | 78.4% |
| Smartphone | 31,655 | 90.2% |
| Tablet | 22,068 | 62.9% |
| No Computing Device | 1,523 | 4.3% |
| Total | 35,101 | 100.0% |
Internet Access in Rogers County
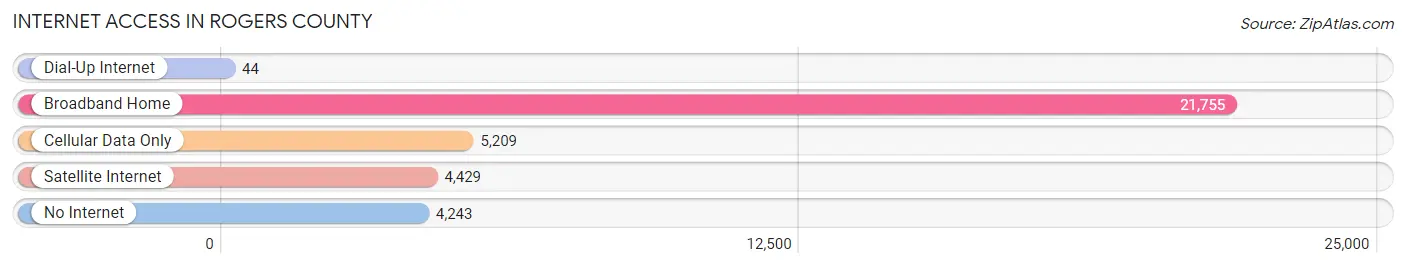
| Internet Type | # Households | % Households |
| Dial-Up Internet | 44 | 0.1% |
| Broadband Home | 21,755 | 62.0% |
| Cellular Data Only | 5,209 | 14.8% |
| Satellite Internet | 4,429 | 12.6% |
| No Internet | 4,243 | 12.1% |
| Total | 35,101 | 100.0% |
Rogers County Summary
Rogers County is located in the northeastern part of Oklahoma and is part of the Tulsa Metropolitan Statistical Area. It is bordered by Tulsa County to the north, Mayes County to the east, Wagoner County to the south, and Washington County to the west. The county seat is Claremore, and the largest city is Owasso. The county was named for Clement Vann Rogers, a prominent Cherokee leader and Confederate colonel.
Geography
Rogers County covers an area of 745 square miles and is located in the Ozark Plateau region of Oklahoma. The terrain is mostly rolling hills and wooded areas, with some flatlands in the northern part of the county. The Verdigris River runs through the county, and there are several small lakes and reservoirs. The highest point in the county is located in the northwest corner, at an elevation of 1,072 feet.
Climate
Rogers County has a humid subtropical climate, with hot summers and mild winters. The average annual temperature is around 63°F, and the average annual precipitation is around 40 inches.
Demographics
As of the 2010 census, there were 86,905 people, 32,945 households, and 23,845 families living in the county. The population density was 117 people per square mile. The racial makeup of the county was 79.2% White, 5.3% African American, 8.2% Native American, 1.3% Asian, 0.1% Pacific Islander, 2.7% from other races, and 3.2% from two or more races. Hispanic or Latino of any race were 6.3% of the population.
The median income for a household in the county was $45,837, and the median income for a family was $53,845. The per capita income for the county was $22,845. About 8.7% of families and 11.7% of the population were below the poverty line, including 15.2% of those under age 18 and 8.2% of those age 65 or over.
Economy
The economy of Rogers County is largely based on agriculture, manufacturing, and services. The county is home to several large companies, including the Tulsa-based Williams Companies, which is one of the largest energy companies in the United States. Other major employers in the county include the Tulsa Airports Authority, the Tulsa Port of Catoosa, and the Tulsa Technology Center.
Agriculture is an important part of the economy, with the county producing a variety of crops, including wheat, corn, soybeans, and hay. Livestock production is also important, with cattle, hogs, and poultry being the main animals raised.
Manufacturing is also an important part of the economy, with the county producing a variety of products, including aircraft parts, automotive parts, and food products. The county is also home to several large distribution centers, including the Tulsa Port of Catoosa, which is the largest inland port in the United States.
The service sector is also an important part of the economy, with the county being home to several large hospitals, universities, and other service-oriented businesses. The county is also home to several tourist attractions, including the Will Rogers Memorial Museum, the Tulsa Zoo, and the Tulsa Air and Space Museum.
Conclusion
Rogers County is a diverse and vibrant county located in northeastern Oklahoma. It is home to a variety of industries, including agriculture, manufacturing, and services. The county is also home to several tourist attractions, making it a popular destination for visitors. With its diverse economy and attractions, Rogers County is an ideal place to live, work, and play.
Common Questions
What is the Total Population of Rogers County?
Total Population of Rogers County is 95,870.
What is the Total Male Population of Rogers County?
Total Male Population of Rogers County is 48,039.
What is the Total Female Population of Rogers County?
Total Female Population of Rogers County is 47,831.
What is the Ratio of Males per 100 Females in Rogers County?
There are 100.43 Males per 100 Females in Rogers County.
What is the Ratio of Females per 100 Males in Rogers County?
There are 99.57 Females per 100 Males in Rogers County.
What is the Median Population Age in Rogers County?
Median Population Age in Rogers County is 39.3 Years.
What is the Average Family Size in Rogers County
Average Family Size in Rogers County is 3.1 People.
What is the Average Household Size in Rogers County
Average Household Size in Rogers County is 2.7 People.
What is Per Capita Income in Rogers County?
Per Capita income in Rogers County is $36,885.
What is the Median Family Income in Rogers County?
Median Family Income in Rogers County is $91,954.
What is the Median Household income in Rogers County?
Median Household Income in Rogers County is $75,312.
What is Income or Wage Gap in Rogers County?
Income or Wage Gap in Rogers County is 34.6%.
Women in Rogers County earn 65.4 cents for every dollar earned by a man.
What is Family Income Deficit in Rogers County?
Family Income Deficit in Rogers County is $10,494.
Families that are below poverty line in Rogers County earn $10,494 less on average than the poverty threshold level.
What is Inequality or Gini Index in Rogers County?
Inequality or Gini Index in Rogers County is 0.41.
How Large is the Labor Force in Rogers County?
There are 48,814 People in the Labor Forcein in Rogers County.
What is the Percentage of People in the Labor Force in Rogers County?
63.9% of People are in the Labor Force in Rogers County.
What is the Unemployment Rate in Rogers County?
Unemployment Rate in Rogers County is 4.7%.