Pottawatomie County, OK
Pottawatomie County Map
Pottawatomie County Overview
72,734
TOTAL POPULATION
34,941
MALE POPULATION
37,793
FEMALE POPULATION
92.45
MALES / 100 FEMALES
108.16
FEMALES / 100 MALES
37.7
MEDIAN AGE
3.2
AVG FAMILY SIZE
2.6
AVG HOUSEHOLD SIZE
$28,106
PER CAPITA INCOME
$72,149
AVG FAMILY INCOME
$58,270
AVG HOUSEHOLD INCOME
35.1%
WAGE / INCOME GAP [ % ]
64.9¢/ $1
WAGE / INCOME GAP [ $ ]
$11,467
FAMILY INCOME DEFICIT
0.45
INEQUALITY / GINI INDEX
31,610
LABOR FORCE [ PEOPLE ]
54.5%
PERCENT IN LABOR FORCE
5.8%
UNEMPLOYMENT RATE
Pottawatomie County Area Codes
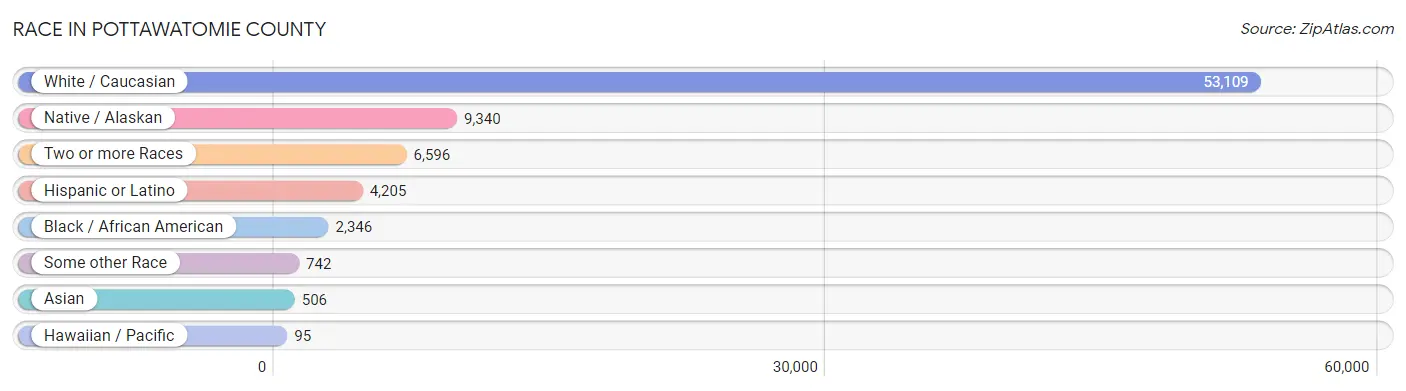
Race in Pottawatomie County
The most populous races in Pottawatomie County are White / Caucasian (53,109 | 73.0%), Native / Alaskan (9,340 | 12.8%), and Two or more Races (6,596 | 9.1%).
| Race | # Population | % Population |
| Asian | 506 | 0.7% |
| Black / African American | 2,346 | 3.2% |
| Hawaiian / Pacific | 95 | 0.1% |
| Hispanic or Latino | 4,205 | 5.8% |
| Native / Alaskan | 9,340 | 12.8% |
| White / Caucasian | 53,109 | 73.0% |
| Two or more Races | 6,596 | 9.1% |
| Some other Race | 742 | 1.0% |
| Total | 72,734 | 100.0% |
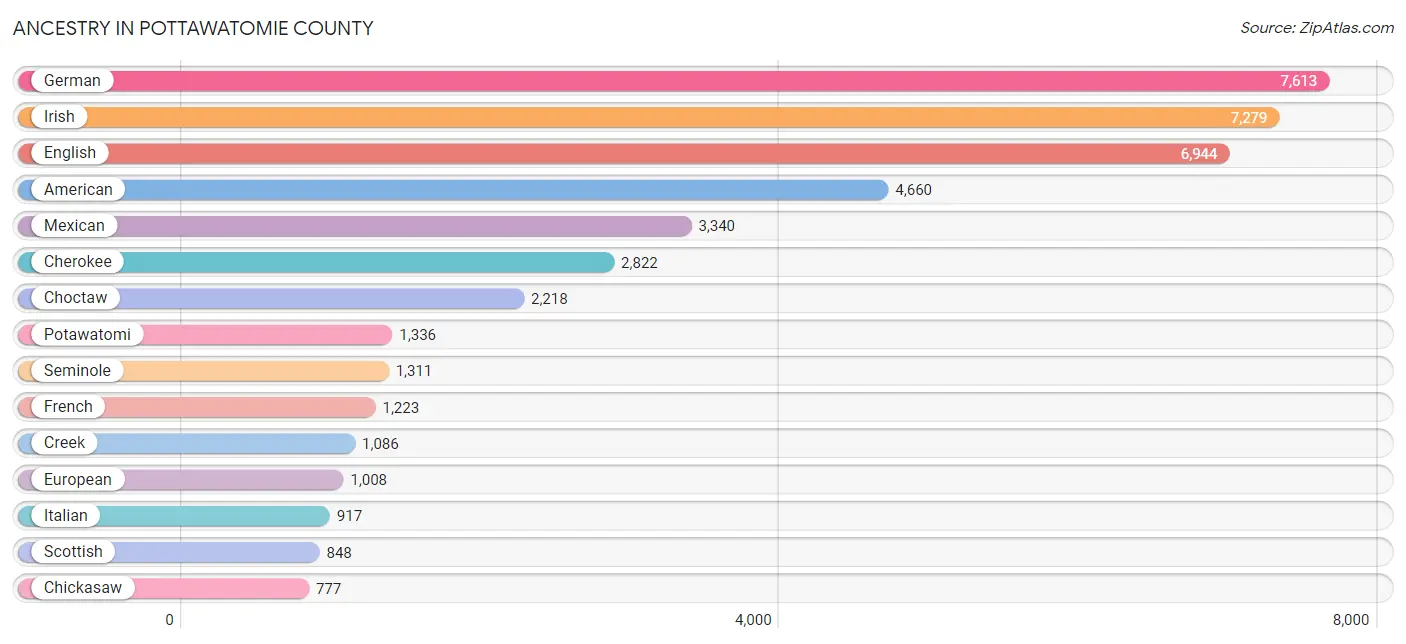
Ancestry in Pottawatomie County
The most populous ancestries reported in Pottawatomie County are German (7,613 | 10.5%), Irish (7,279 | 10.0%), English (6,944 | 9.6%), American (4,660 | 6.4%), and Mexican (3,340 | 4.6%), together accounting for 41.0% of all Pottawatomie County residents.
| Ancestry | # Population | % Population |
| African | 105 | 0.1% |
| Albanian | 11 | 0.0% |
| American | 4,660 | 6.4% |
| Apache | 134 | 0.2% |
| Arab | 80 | 0.1% |
| Arapaho | 47 | 0.1% |
| Austrian | 18 | 0.0% |
| Belgian | 19 | 0.0% |
| Bhutanese | 104 | 0.1% |
| Blackfeet | 17 | 0.0% |
| British | 477 | 0.7% |
| Burmese | 133 | 0.2% |
| Canadian | 12 | 0.0% |
| Carpatho Rusyn | 8 | 0.0% |
| Celtic | 73 | 0.1% |
| Central American | 96 | 0.1% |
| Central American Indian | 16 | 0.0% |
| Cherokee | 2,822 | 3.9% |
| Cheyenne | 107 | 0.2% |
| Chickasaw | 777 | 1.1% |
| Chippewa | 63 | 0.1% |
| Choctaw | 2,218 | 3.0% |
| Colombian | 24 | 0.0% |
| Comanche | 99 | 0.1% |
| Costa Rican | 26 | 0.0% |
| Creek | 1,086 | 1.5% |
| Croatian | 32 | 0.0% |
| Cuban | 7 | 0.0% |
| Czech | 253 | 0.4% |
| Czechoslovakian | 38 | 0.1% |
| Danish | 215 | 0.3% |
| Delaware | 45 | 0.1% |
| Dominican | 5 | 0.0% |
| Dutch | 542 | 0.7% |
| Dutch West Indian | 124 | 0.2% |
| Eastern European | 128 | 0.2% |
| Egyptian | 12 | 0.0% |
| English | 6,944 | 9.6% |
| Ethiopian | 15 | 0.0% |
| European | 1,008 | 1.4% |
| Fijian | 35 | 0.1% |
| Finnish | 22 | 0.0% |
| French | 1,223 | 1.7% |
| French American Indian | 18 | 0.0% |
| French Canadian | 248 | 0.3% |
| German | 7,613 | 10.5% |
| Greek | 23 | 0.0% |
| Guatemalan | 3 | 0.0% |
| Honduran | 25 | 0.0% |
| Hungarian | 59 | 0.1% |
| Icelander | 11 | 0.0% |
| Indian (Asian) | 105 | 0.1% |
| Inupiat | 19 | 0.0% |
| Iranian | 91 | 0.1% |
| Irish | 7,279 | 10.0% |
| Iroquois | 75 | 0.1% |
| Italian | 917 | 1.3% |
| Jamaican | 79 | 0.1% |
| Japanese | 12 | 0.0% |
| Kiowa | 98 | 0.1% |
| Korean | 297 | 0.4% |
| Laotian | 23 | 0.0% |
| Latvian | 10 | 0.0% |
| Lebanese | 68 | 0.1% |
| Lithuanian | 31 | 0.0% |
| Malaysian | 6 | 0.0% |
| Mexican | 3,340 | 4.6% |
| Native Hawaiian | 19 | 0.0% |
| Navajo | 29 | 0.0% |
| Northern European | 89 | 0.1% |
| Norwegian | 296 | 0.4% |
| Osage | 44 | 0.1% |
| Pakistani | 123 | 0.2% |
| Panamanian | 25 | 0.0% |
| Pennsylvania German | 8 | 0.0% |
| Polish | 354 | 0.5% |
| Portuguese | 39 | 0.1% |
| Potawatomi | 1,336 | 1.8% |
| Pueblo | 31 | 0.0% |
| Puerto Rican | 217 | 0.3% |
| Romanian | 29 | 0.0% |
| Russian | 213 | 0.3% |
| Salvadoran | 17 | 0.0% |
| Samoan | 9 | 0.0% |
| Scandinavian | 179 | 0.3% |
| Scotch-Irish | 571 | 0.8% |
| Scottish | 848 | 1.2% |
| Seminole | 1,311 | 1.8% |
| Senegalese | 7 | 0.0% |
| Serbian | 14 | 0.0% |
| Shoshone | 12 | 0.0% |
| Sioux | 155 | 0.2% |
| Slavic | 16 | 0.0% |
| Slovak | 4 | 0.0% |
| South American | 40 | 0.1% |
| South American Indian | 7 | 0.0% |
| Spaniard | 213 | 0.3% |
| Spanish | 115 | 0.2% |
| Sri Lankan | 47 | 0.1% |
| Subsaharan African | 127 | 0.2% |
| Swedish | 405 | 0.6% |
| Swiss | 71 | 0.1% |
| Thai | 55 | 0.1% |
| Tlingit-Haida | 11 | 0.0% |
| Trinidadian and Tobagonian | 6 | 0.0% |
| Ukrainian | 24 | 0.0% |
| Ute | 27 | 0.0% |
| Venezuelan | 16 | 0.0% |
| Welsh | 243 | 0.3% |
| Yaqui | 11 | 0.0% |
| Yugoslavian | 15 | 0.0% |
| Yuman | 5 | 0.0% | View All 112 Rows |
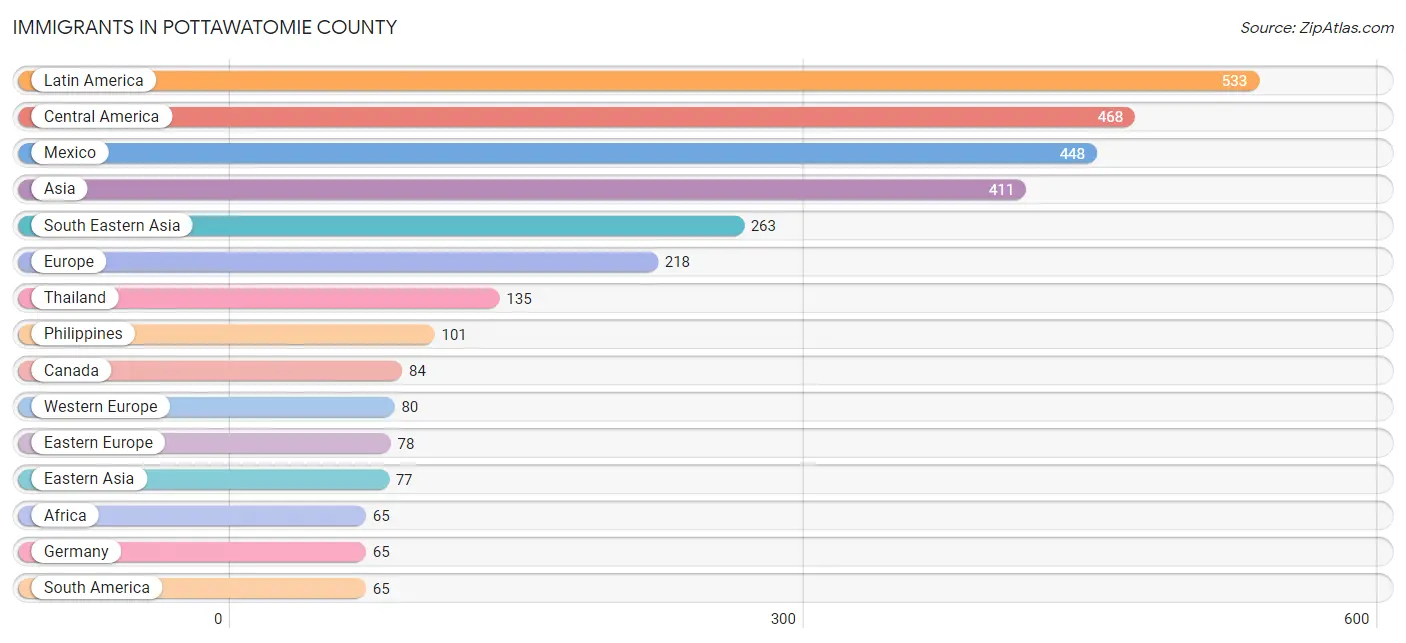
Immigrants in Pottawatomie County
The most numerous immigrant groups reported in Pottawatomie County came from Latin America (533 | 0.7%), Central America (468 | 0.6%), Mexico (448 | 0.6%), Asia (411 | 0.6%), and South Eastern Asia (263 | 0.4%), together accounting for 2.9% of all Pottawatomie County residents.
| Immigration Origin | # Population | % Population |
| Africa | 65 | 0.1% |
| Asia | 411 | 0.6% |
| Australia | 24 | 0.0% |
| Austria | 15 | 0.0% |
| Bosnia and Herzegovina | 15 | 0.0% |
| Canada | 84 | 0.1% |
| Central America | 468 | 0.6% |
| China | 55 | 0.1% |
| Colombia | 17 | 0.0% |
| Eastern Africa | 49 | 0.1% |
| Eastern Asia | 77 | 0.1% |
| Eastern Europe | 78 | 0.1% |
| Egypt | 12 | 0.0% |
| El Salvador | 17 | 0.0% |
| England | 20 | 0.0% |
| Europe | 218 | 0.3% |
| Germany | 65 | 0.1% |
| Guatemala | 3 | 0.0% |
| Hungary | 2 | 0.0% |
| India | 28 | 0.0% |
| Iran | 31 | 0.0% |
| Japan | 17 | 0.0% |
| Kenya | 28 | 0.0% |
| Korea | 5 | 0.0% |
| Latin America | 533 | 0.7% |
| Latvia | 10 | 0.0% |
| Mexico | 448 | 0.6% |
| Micronesia | 30 | 0.0% |
| Northern Africa | 12 | 0.0% |
| Northern Europe | 60 | 0.1% |
| Oceania | 54 | 0.1% |
| Philippines | 101 | 0.1% |
| Russia | 19 | 0.0% |
| South Africa | 4 | 0.0% |
| South America | 65 | 0.1% |
| South Central Asia | 59 | 0.1% |
| South Eastern Asia | 263 | 0.4% |
| Thailand | 135 | 0.2% |
| Ukraine | 22 | 0.0% |
| Venezuela | 48 | 0.1% |
| Vietnam | 27 | 0.0% |
| Western Asia | 12 | 0.0% |
| Western Europe | 80 | 0.1% | View All 43 Rows |
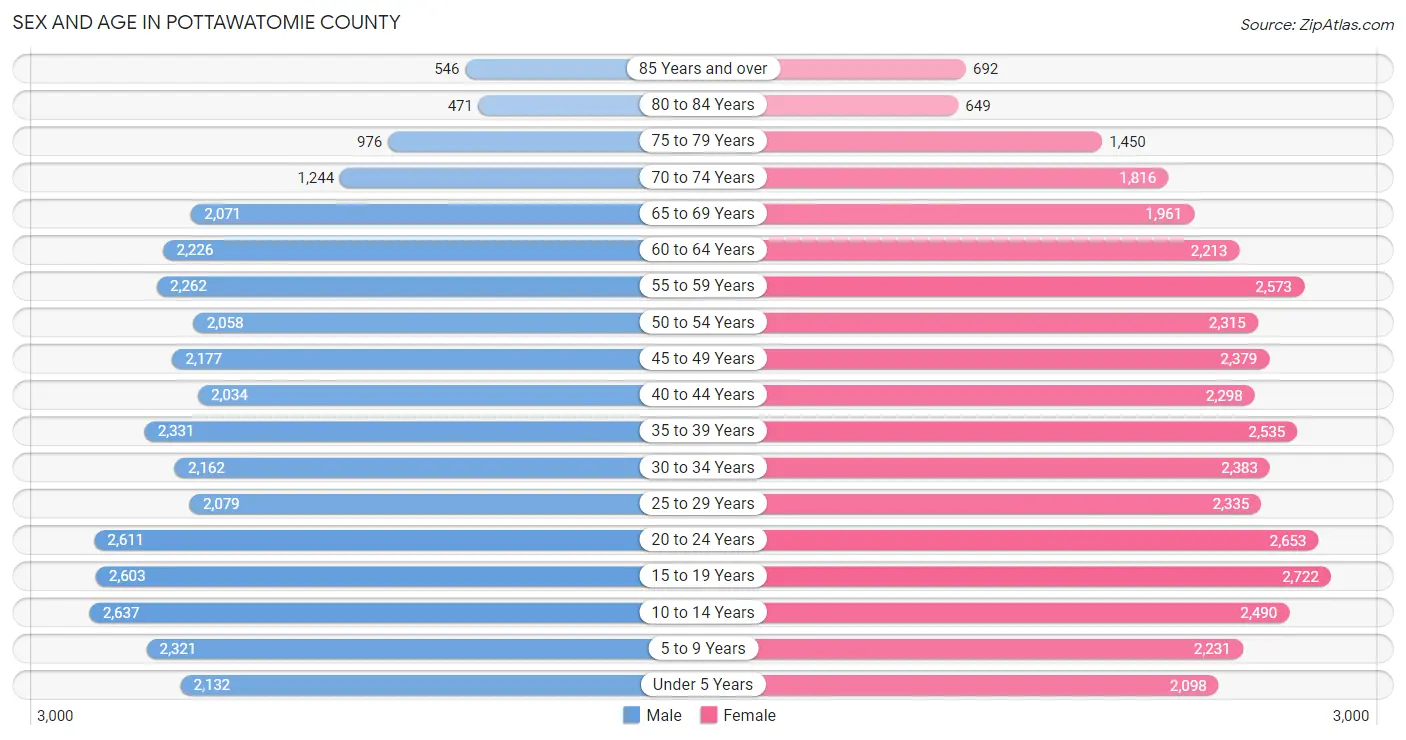
Sex and Age in Pottawatomie County
Sex and Age in Pottawatomie County
The most populous age groups in Pottawatomie County are 10 to 14 Years (2,637 | 7.5%) for men and 15 to 19 Years (2,722 | 7.2%) for women.
| Age Bracket | Male | Female |
| Under 5 Years | 2,132 (6.1%) | 2,098 (5.6%) |
| 5 to 9 Years | 2,321 (6.6%) | 2,231 (5.9%) |
| 10 to 14 Years | 2,637 (7.5%) | 2,490 (6.6%) |
| 15 to 19 Years | 2,603 (7.4%) | 2,722 (7.2%) |
| 20 to 24 Years | 2,611 (7.5%) | 2,653 (7.0%) |
| 25 to 29 Years | 2,079 (5.9%) | 2,335 (6.2%) |
| 30 to 34 Years | 2,162 (6.2%) | 2,383 (6.3%) |
| 35 to 39 Years | 2,331 (6.7%) | 2,535 (6.7%) |
| 40 to 44 Years | 2,034 (5.8%) | 2,298 (6.1%) |
| 45 to 49 Years | 2,177 (6.2%) | 2,379 (6.3%) |
| 50 to 54 Years | 2,058 (5.9%) | 2,315 (6.1%) |
| 55 to 59 Years | 2,262 (6.5%) | 2,573 (6.8%) |
| 60 to 64 Years | 2,226 (6.4%) | 2,213 (5.9%) |
| 65 to 69 Years | 2,071 (5.9%) | 1,961 (5.2%) |
| 70 to 74 Years | 1,244 (3.6%) | 1,816 (4.8%) |
| 75 to 79 Years | 976 (2.8%) | 1,450 (3.8%) |
| 80 to 84 Years | 471 (1.3%) | 649 (1.7%) |
| 85 Years and over | 546 (1.6%) | 692 (1.8%) |
| Total | 34,941 (100.0%) | 37,793 (100.0%) |
Families and Households in Pottawatomie County
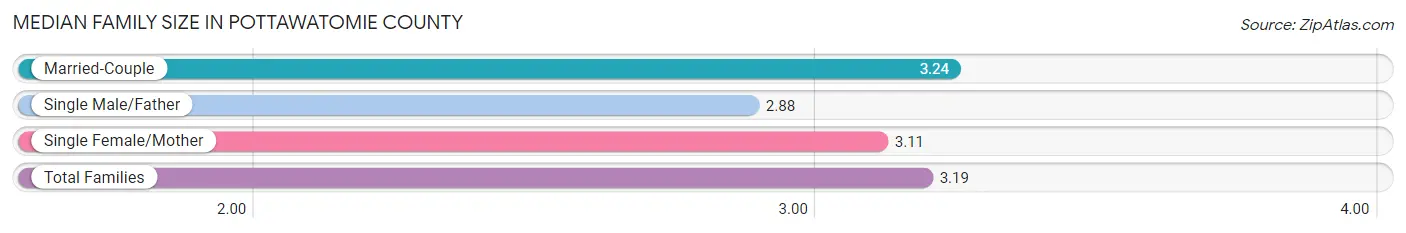
Median Family Size in Pottawatomie County
The median family size in Pottawatomie County is 3.19 persons per family, with married-couple families (13,381 | 73.7%) accounting for the largest median family size of 3.24 persons per family. On the other hand, single male/father families (1,286 | 7.1%) represent the smallest median family size with 2.88 persons per family.
| Family Type | # Families | Family Size |
| Married-Couple | 13,381 (73.7%) | 3.24 |
| Single Male/Father | 1,286 (7.1%) | 2.88 |
| Single Female/Mother | 3,495 (19.2%) | 3.11 |
| Total Families | 18,162 (100.0%) | 3.19 |
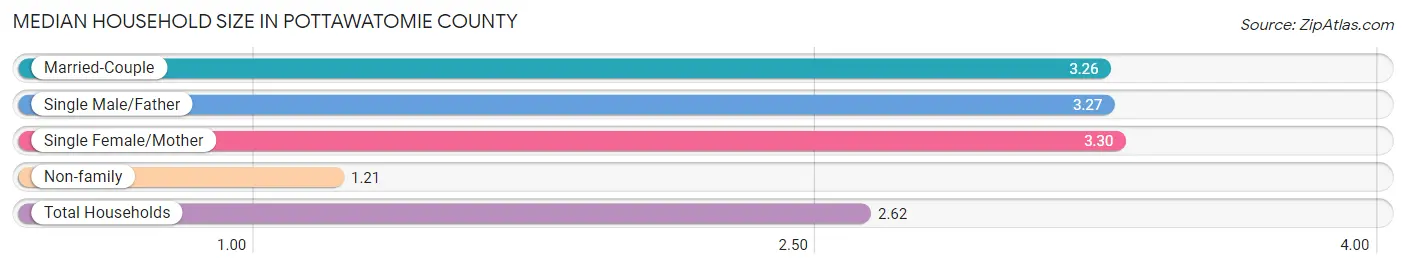
Median Household Size in Pottawatomie County
The median household size in Pottawatomie County is 2.62 persons per household, with single female/mother households (3,495 | 13.2%) accounting for the largest median household size of 3.3 persons per household. non-family households (8,260 | 31.3%) represent the smallest median household size with 1.21 persons per household.
| Household Type | # Households | Household Size |
| Married-Couple | 13,381 (50.6%) | 3.26 |
| Single Male/Father | 1,286 (4.9%) | 3.27 |
| Single Female/Mother | 3,495 (13.2%) | 3.30 |
| Non-family | 8,260 (31.3%) | 1.21 |
| Total Households | 26,422 (100.0%) | 2.62 |
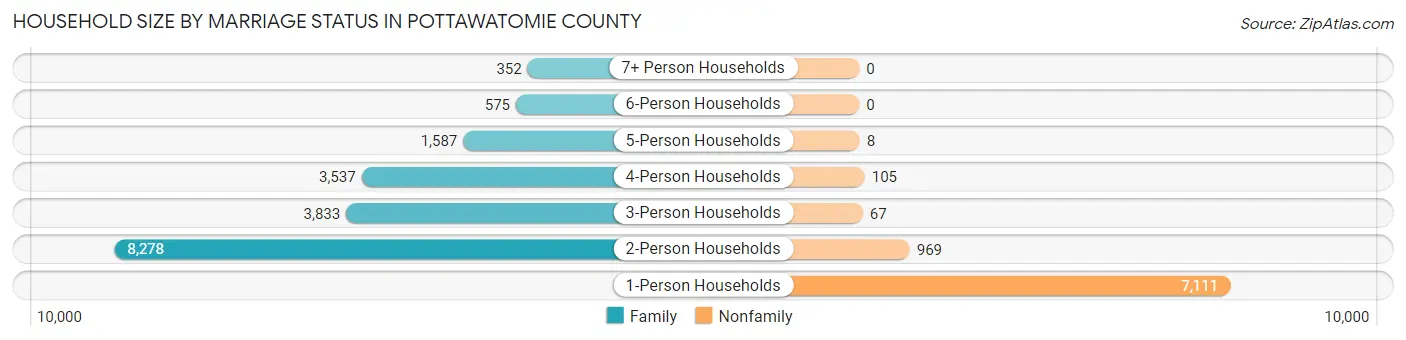
Household Size by Marriage Status in Pottawatomie County
Out of a total of 26,422 households in Pottawatomie County, 18,162 (68.7%) are family households, while 8,260 (31.3%) are nonfamily households. The most numerous type of family households are 2-person households, comprising 8,278, and the most common type of nonfamily households are 1-person households, comprising 7,111.
| Household Size | Family Households | Nonfamily Households |
| 1-Person Households | - | 7,111 (26.9%) |
| 2-Person Households | 8,278 (31.3%) | 969 (3.7%) |
| 3-Person Households | 3,833 (14.5%) | 67 (0.3%) |
| 4-Person Households | 3,537 (13.4%) | 105 (0.4%) |
| 5-Person Households | 1,587 (6.0%) | 8 (0.0%) |
| 6-Person Households | 575 (2.2%) | 0 (0.0%) |
| 7+ Person Households | 352 (1.3%) | 0 (0.0%) |
| Total | 18,162 (68.7%) | 8,260 (31.3%) |
Female Fertility in Pottawatomie County
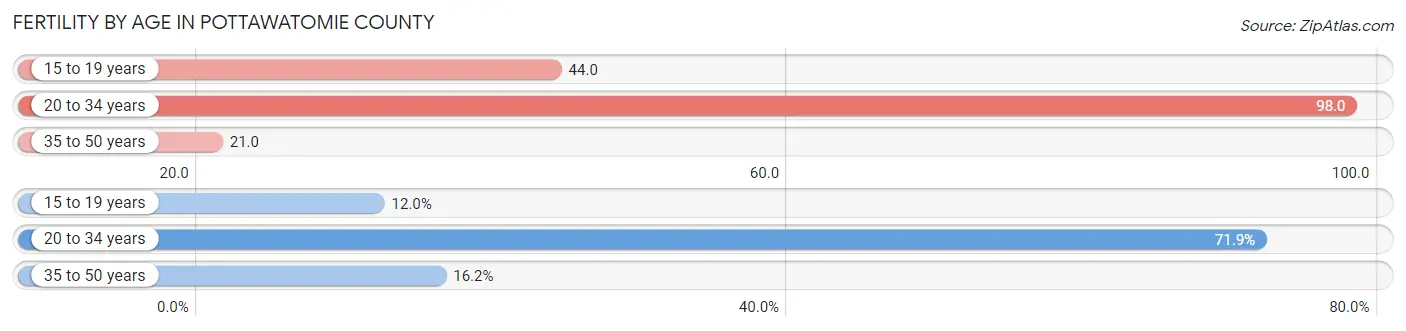
Fertility by Age in Pottawatomie County
Average fertility rate in Pottawatomie County is 56.0 births per 1,000 women. Women in the age bracket of 20 to 34 years have the highest fertility rate with 98.0 births per 1,000 women. Women in the age bracket of 20 to 34 years acount for 71.9% of all women with births.
| Age Bracket | Women with Births | Births / 1,000 Women |
| 15 to 19 years | 120 (12.0%) | 44.0 |
| 20 to 34 years | 720 (71.9%) | 98.0 |
| 35 to 50 years | 162 (16.2%) | 21.0 |
| Total | 1,002 (100.0%) | 56.0 |
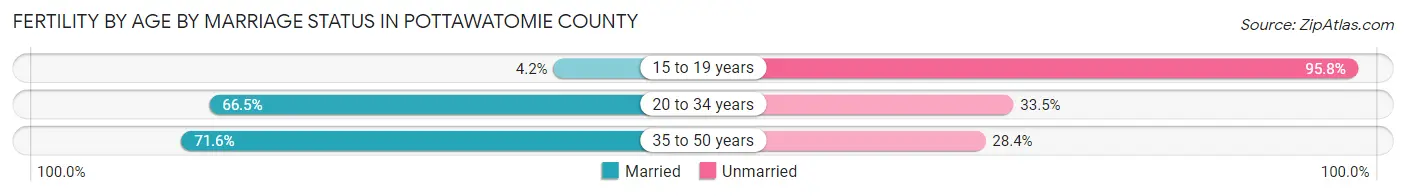
Fertility by Age by Marriage Status in Pottawatomie County
59.9% of women with births (1,002) in Pottawatomie County are married. The highest percentage of unmarried women with births falls into 15 to 19 years age bracket with 95.8% of them unmarried at the time of birth, while the lowest percentage of unmarried women with births belong to 35 to 50 years age bracket with 28.4% of them unmarried.
| Age Bracket | Married | Unmarried |
| 15 to 19 years | 5 (4.2%) | 115 (95.8%) |
| 20 to 34 years | 479 (66.5%) | 241 (33.5%) |
| 35 to 50 years | 116 (71.6%) | 46 (28.4%) |
| Total | 600 (59.9%) | 402 (40.1%) |
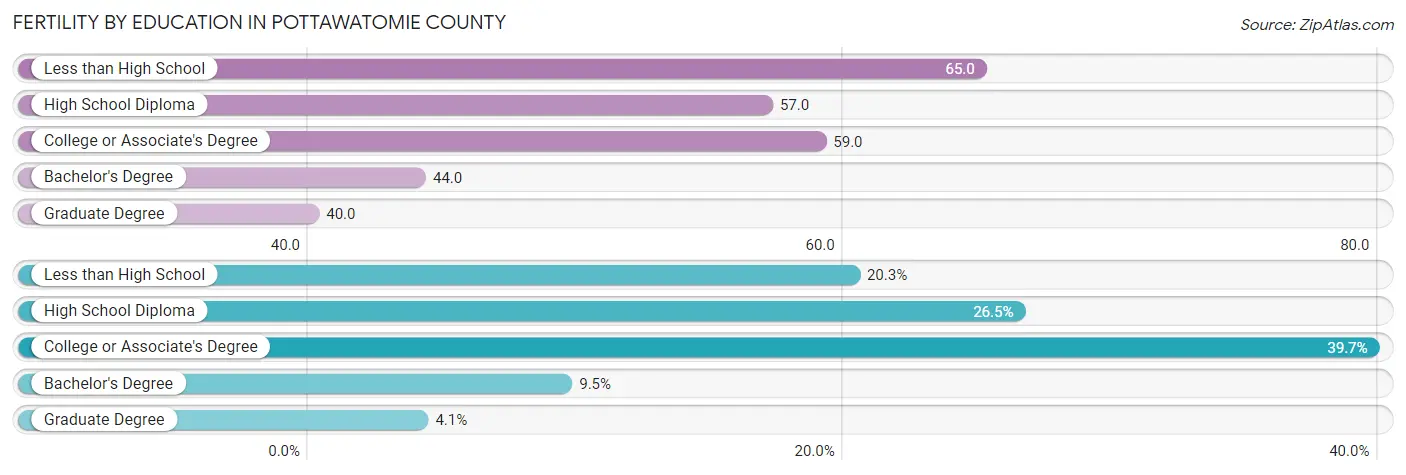
Fertility by Education in Pottawatomie County
Average fertility rate in Pottawatomie County is 56.0 births per 1,000 women. Women with the education attainment of less than high school have the highest fertility rate of 65.0 births per 1,000 women, while women with the education attainment of graduate degree have the lowest fertility at 40.0 births per 1,000 women. Women with the education attainment of college or associate's degree represent 39.7% of all women with births.
| Educational Attainment | Women with Births | Births / 1,000 Women |
| Less than High School | 203 (20.3%) | 65.0 |
| High School Diploma | 265 (26.5%) | 57.0 |
| College or Associate's Degree | 398 (39.7%) | 59.0 |
| Bachelor's Degree | 95 (9.5%) | 44.0 |
| Graduate Degree | 41 (4.1%) | 40.0 |
| Total | 1,002 (100.0%) | 56.0 |
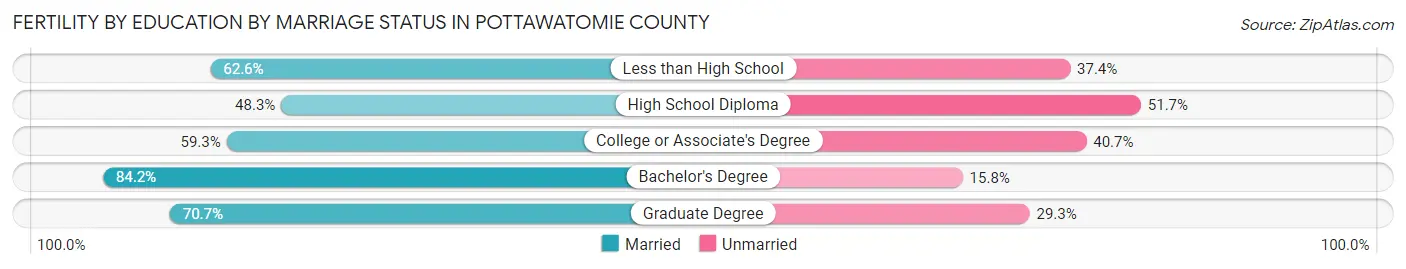
Fertility by Education by Marriage Status in Pottawatomie County
40.1% of women with births in Pottawatomie County are unmarried. Women with the educational attainment of bachelor's degree are most likely to be married with 84.2% of them married at childbirth, while women with the educational attainment of high school diploma are least likely to be married with 51.7% of them unmarried at childbirth.
| Educational Attainment | Married | Unmarried |
| Less than High School | 127 (62.6%) | 76 (37.4%) |
| High School Diploma | 128 (48.3%) | 137 (51.7%) |
| College or Associate's Degree | 236 (59.3%) | 162 (40.7%) |
| Bachelor's Degree | 80 (84.2%) | 15 (15.8%) |
| Graduate Degree | 29 (70.7%) | 12 (29.3%) |
| Total | 600 (59.9%) | 402 (40.1%) |
Income in Pottawatomie County
Income Overview in Pottawatomie County
Per Capita Income in Pottawatomie County is $28,106, while median incomes of families and households are $72,149 and $58,270 respectively.
| Characteristic | Number | Measure |
| Per Capita Income | 72,734 | $28,106 |
| Median Family Income | 18,162 | $72,149 |
| Mean Family Income | 18,162 | $88,106 |
| Median Household Income | 26,422 | $58,270 |
| Mean Household Income | 26,422 | $74,237 |
| Income Deficit | 18,162 | $11,467 |
| Wage / Income Gap (%) | 72,734 | 35.07% |
| Wage / Income Gap ($) | 72,734 | 64.93¢ per $1 |
| Gini / Inequality Index | 72,734 | 0.45 |
Earnings by Sex in Pottawatomie County
Average Earnings in Pottawatomie County are $34,436, $43,919 for men and $28,515 for women, a difference of 35.1%.
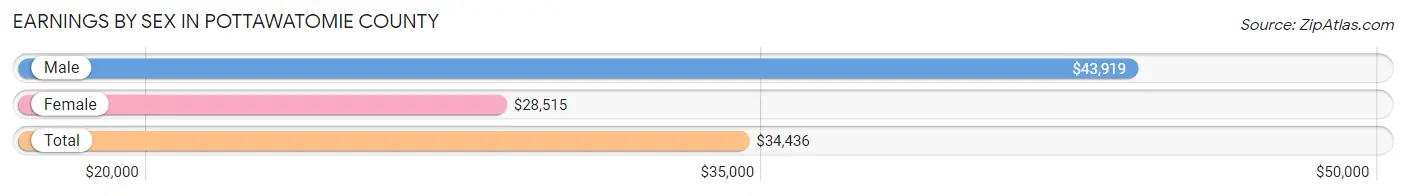
| Sex | Number | Average Earnings |
| Male | 17,320 (52.0%) | $43,919 |
| Female | 16,010 (48.0%) | $28,515 |
| Total | 33,330 (100.0%) | $34,436 |
Earnings by Sex by Income Bracket in Pottawatomie County
The most common earnings brackets in Pottawatomie County are $55,000 to $64,999 for men (1,886 | 10.9%) and $25,000 to $29,999 for women (1,499 | 9.4%).
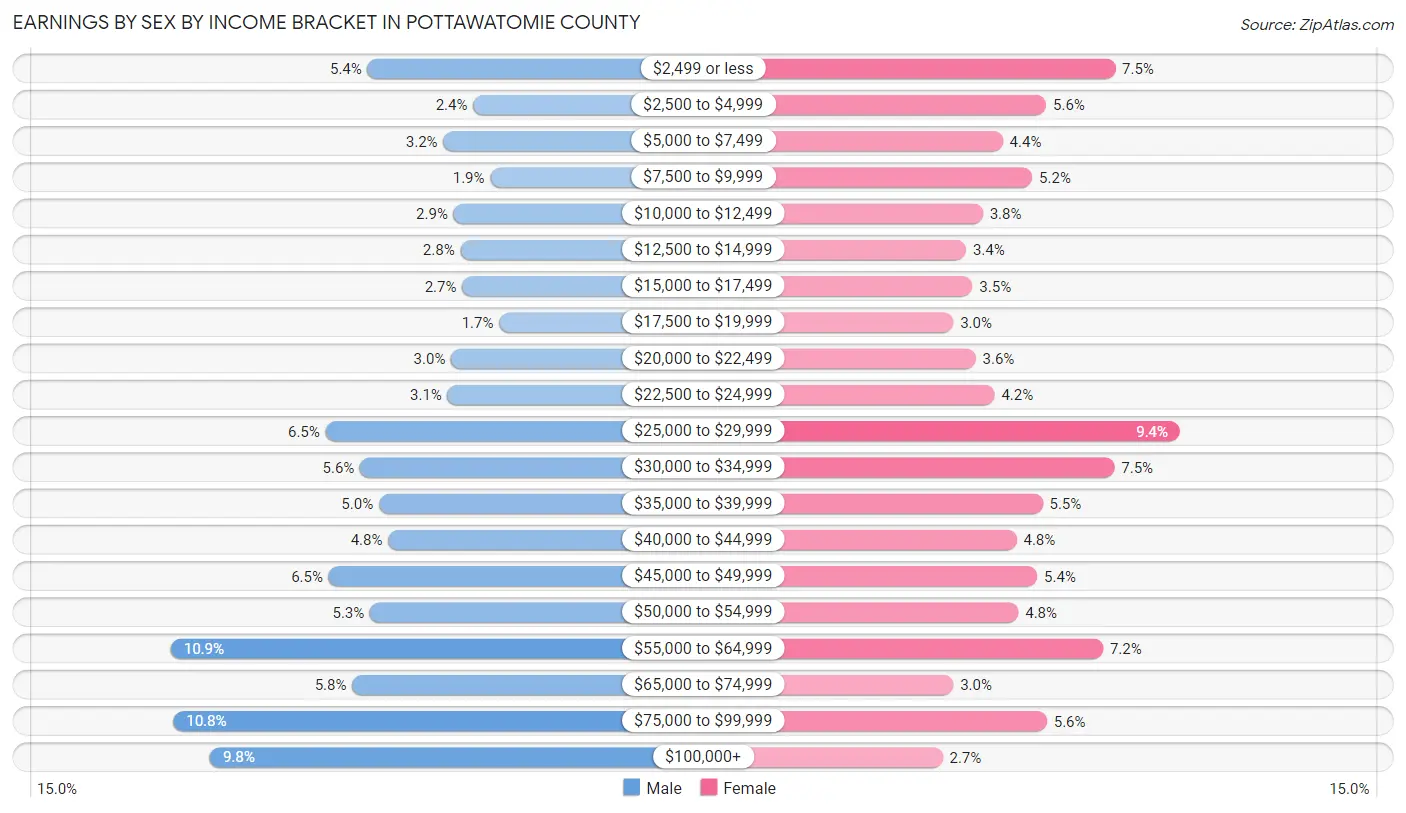
| Income | Male | Female |
| $2,499 or less | 928 (5.4%) | 1,207 (7.5%) |
| $2,500 to $4,999 | 414 (2.4%) | 897 (5.6%) |
| $5,000 to $7,499 | 559 (3.2%) | 701 (4.4%) |
| $7,500 to $9,999 | 330 (1.9%) | 834 (5.2%) |
| $10,000 to $12,499 | 509 (2.9%) | 611 (3.8%) |
| $12,500 to $14,999 | 477 (2.8%) | 536 (3.4%) |
| $15,000 to $17,499 | 467 (2.7%) | 565 (3.5%) |
| $17,500 to $19,999 | 288 (1.7%) | 479 (3.0%) |
| $20,000 to $22,499 | 522 (3.0%) | 580 (3.6%) |
| $22,500 to $24,999 | 538 (3.1%) | 665 (4.2%) |
| $25,000 to $29,999 | 1,132 (6.5%) | 1,499 (9.4%) |
| $30,000 to $34,999 | 965 (5.6%) | 1,204 (7.5%) |
| $35,000 to $39,999 | 873 (5.0%) | 880 (5.5%) |
| $40,000 to $44,999 | 828 (4.8%) | 763 (4.8%) |
| $45,000 to $49,999 | 1,117 (6.5%) | 856 (5.3%) |
| $50,000 to $54,999 | 916 (5.3%) | 772 (4.8%) |
| $55,000 to $64,999 | 1,886 (10.9%) | 1,152 (7.2%) |
| $65,000 to $74,999 | 1,002 (5.8%) | 479 (3.0%) |
| $75,000 to $99,999 | 1,874 (10.8%) | 899 (5.6%) |
| $100,000+ | 1,695 (9.8%) | 431 (2.7%) |
| Total | 17,320 (100.0%) | 16,010 (100.0%) |
Earnings by Sex by Educational Attainment in Pottawatomie County
Average earnings in Pottawatomie County are $49,273 for men and $32,142 for women, a difference of 34.8%. Men with an educational attainment of graduate degree enjoy the highest average annual earnings of $75,156, while those with less than high school education earn the least with $35,172. Women with an educational attainment of graduate degree earn the most with the average annual earnings of $51,472, while those with less than high school education have the smallest earnings of $21,034.
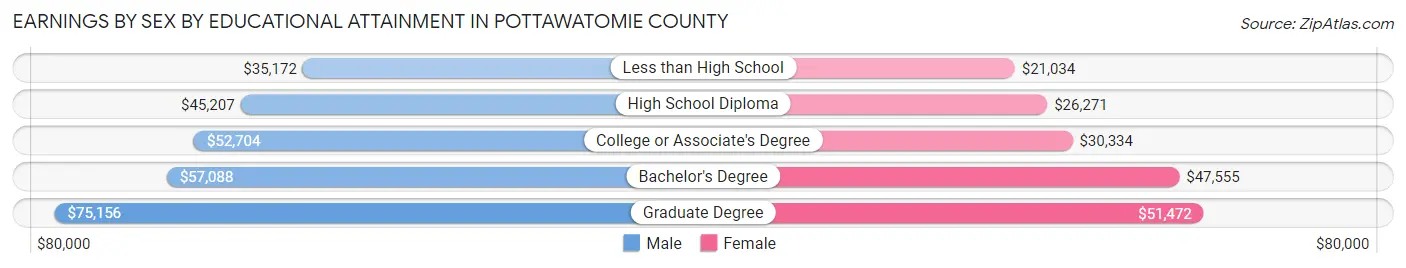
| Educational Attainment | Male Income | Female Income |
| Less than High School | $35,172 | $21,034 |
| High School Diploma | $45,207 | $26,271 |
| College or Associate's Degree | $52,704 | $30,334 |
| Bachelor's Degree | $57,088 | $47,555 |
| Graduate Degree | $75,156 | $51,472 |
| Total | $49,273 | $32,142 |
Family Income in Pottawatomie County
Family Income Brackets in Pottawatomie County
According to the Pottawatomie County family income data, there are 3,723 families falling into the $50,000 to $74,999 income range, which is the most common income bracket and makes up 20.5% of all families. Conversely, the $10,000 to $14,999 income bracket is the least frequent group with only 454 families (2.5%) belonging to this category.
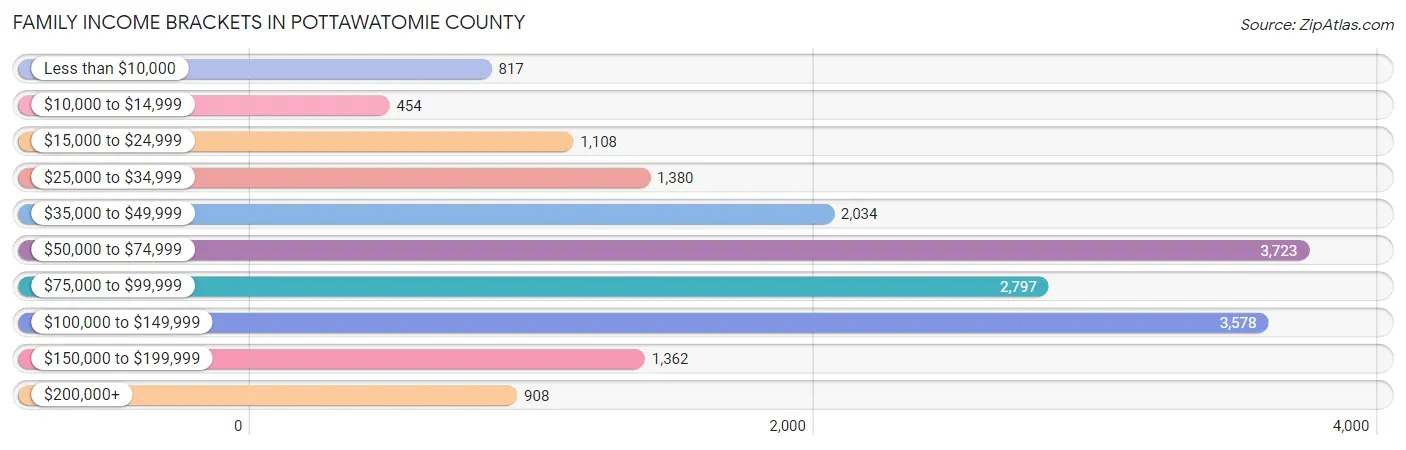
| Income Bracket | # Families | % Families |
| Less than $10,000 | 817 | 4.5% |
| $10,000 to $14,999 | 454 | 2.5% |
| $15,000 to $24,999 | 1,108 | 6.1% |
| $25,000 to $34,999 | 1,380 | 7.6% |
| $35,000 to $49,999 | 2,034 | 11.2% |
| $50,000 to $74,999 | 3,723 | 20.5% |
| $75,000 to $99,999 | 2,797 | 15.4% |
| $100,000 to $149,999 | 3,578 | 19.7% |
| $150,000 to $199,999 | 1,362 | 7.5% |
| $200,000+ | 908 | 5.0% |
Family Income by Famaliy Size in Pottawatomie County
4-person families (3,186 | 17.5%) account for the highest median family income in Pottawatomie County with $94,788 per family, while 2-person families (8,752 | 48.2%) have the highest median income of $32,242 per family member.
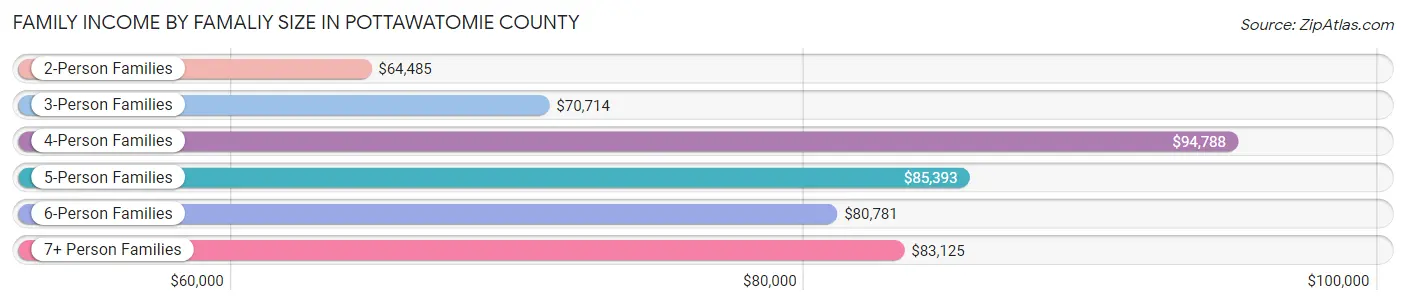
| Income Bracket | # Families | Median Income |
| 2-Person Families | 8,752 (48.2%) | $64,485 |
| 3-Person Families | 3,852 (21.2%) | $70,714 |
| 4-Person Families | 3,186 (17.5%) | $94,788 |
| 5-Person Families | 1,529 (8.4%) | $85,393 |
| 6-Person Families | 515 (2.8%) | $80,781 |
| 7+ Person Families | 328 (1.8%) | $83,125 |
| Total | 18,162 (100.0%) | $72,149 |
Family Income by Number of Earners in Pottawatomie County
The median family income in Pottawatomie County is $72,149, with families comprising 3+ earners (1,608) having the highest median family income of $139,917, while families with no earners (3,476) have the lowest median family income of $42,857, accounting for 8.8% and 19.1% of families, respectively.
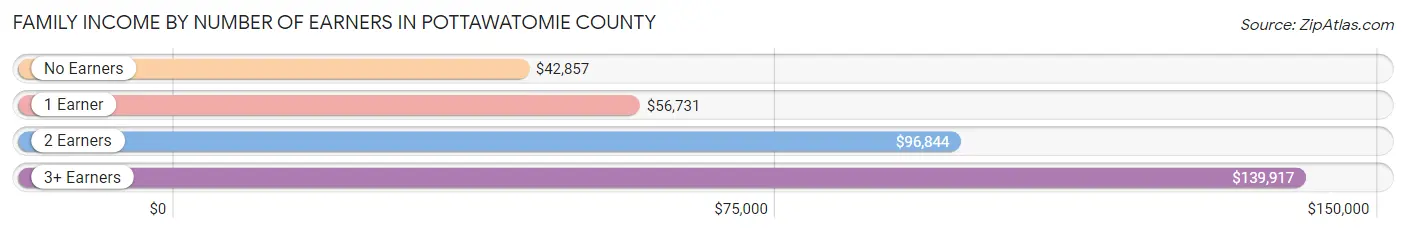
| Number of Earners | # Families | Median Income |
| No Earners | 3,476 (19.1%) | $42,857 |
| 1 Earner | 6,399 (35.2%) | $56,731 |
| 2 Earners | 6,679 (36.8%) | $96,844 |
| 3+ Earners | 1,608 (8.8%) | $139,917 |
| Total | 18,162 (100.0%) | $72,149 |
Household Income in Pottawatomie County
Household Income Brackets in Pottawatomie County
With 4,967 households falling in the category, the $50,000 to $74,999 income range is the most frequent in Pottawatomie County, accounting for 18.8% of all households. In contrast, only 978 households (3.7%) fall into the $200,000+ income bracket, making it the least populous group.
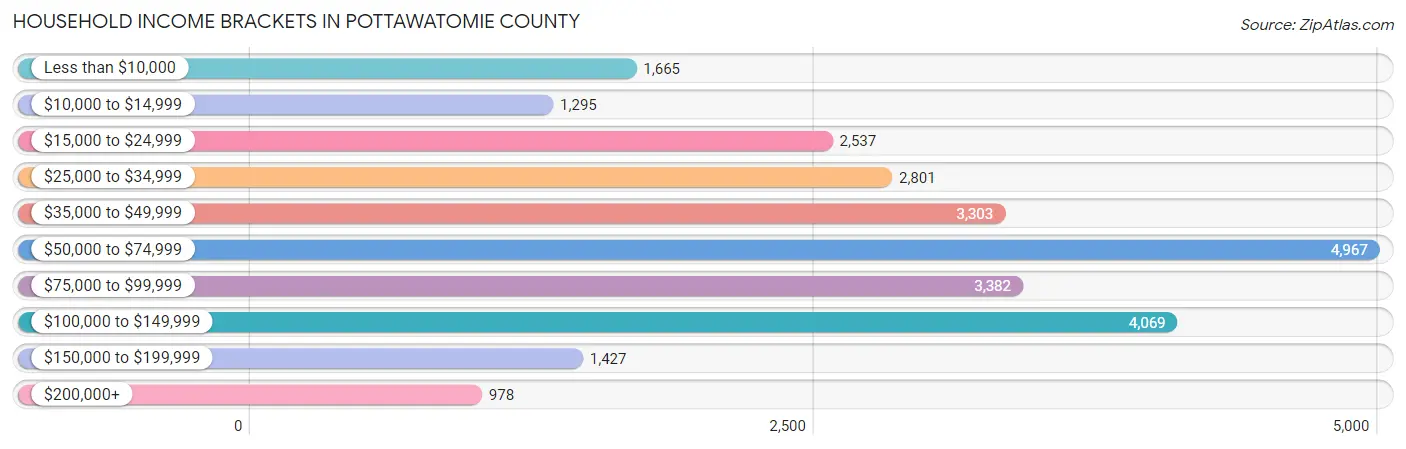
| Income Bracket | # Households | % Households |
| Less than $10,000 | 1,665 | 6.3% |
| $10,000 to $14,999 | 1,295 | 4.9% |
| $15,000 to $24,999 | 2,537 | 9.6% |
| $25,000 to $34,999 | 2,801 | 10.6% |
| $35,000 to $49,999 | 3,303 | 12.5% |
| $50,000 to $74,999 | 4,967 | 18.8% |
| $75,000 to $99,999 | 3,382 | 12.8% |
| $100,000 to $149,999 | 4,069 | 15.4% |
| $150,000 to $199,999 | 1,427 | 5.4% |
| $200,000+ | 978 | 3.7% |
Household Income by Householder Age in Pottawatomie County
The median household income in Pottawatomie County is $58,270, with the highest median household income of $68,047 found in the 25 to 44 years age bracket for the primary householder. A total of 7,961 households (30.1%) fall into this category. Meanwhile, the 15 to 24 years age bracket for the primary householder has the lowest median household income of $34,403, with 994 households (3.8%) in this group.
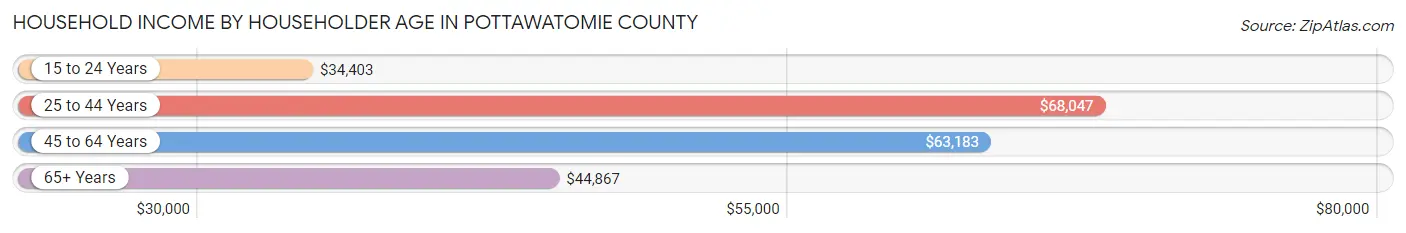
| Income Bracket | # Households | Median Income |
| 15 to 24 Years | 994 (3.8%) | $34,403 |
| 25 to 44 Years | 7,961 (30.1%) | $68,047 |
| 45 to 64 Years | 9,748 (36.9%) | $63,183 |
| 65+ Years | 7,719 (29.2%) | $44,867 |
| Total | 26,422 (100.0%) | $58,270 |
Poverty in Pottawatomie County
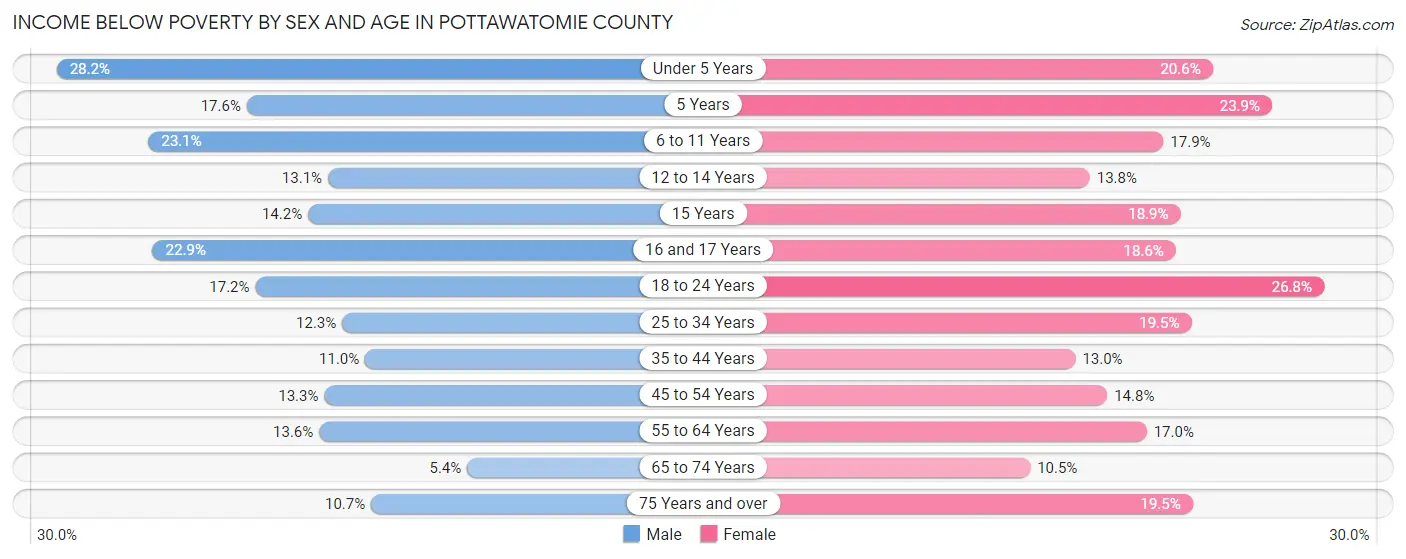
Income Below Poverty by Sex and Age in Pottawatomie County
With 14.4% poverty level for males and 17.1% for females among the residents of Pottawatomie County, under 5 year old males and 18 to 24 year old females are the most vulnerable to poverty, with 589 males (28.2%) and 787 females (26.8%) in their respective age groups living below the poverty level.
| Age Bracket | Male | Female |
| Under 5 Years | 589 (28.2%) | 420 (20.6%) |
| 5 Years | 67 (17.6%) | 90 (23.9%) |
| 6 to 11 Years | 631 (23.1%) | 518 (17.9%) |
| 12 to 14 Years | 228 (13.1%) | 196 (13.8%) |
| 15 Years | 61 (14.2%) | 72 (18.9%) |
| 16 and 17 Years | 233 (22.9%) | 206 (18.6%) |
| 18 to 24 Years | 560 (17.2%) | 787 (26.8%) |
| 25 to 34 Years | 518 (12.3%) | 823 (19.5%) |
| 35 to 44 Years | 476 (11.0%) | 570 (13.0%) |
| 45 to 54 Years | 561 (13.3%) | 670 (14.8%) |
| 55 to 64 Years | 602 (13.6%) | 794 (17.0%) |
| 65 to 74 Years | 177 (5.4%) | 385 (10.5%) |
| 75 Years and over | 200 (10.7%) | 521 (19.5%) |
| Total | 4,903 (14.4%) | 6,052 (17.1%) |
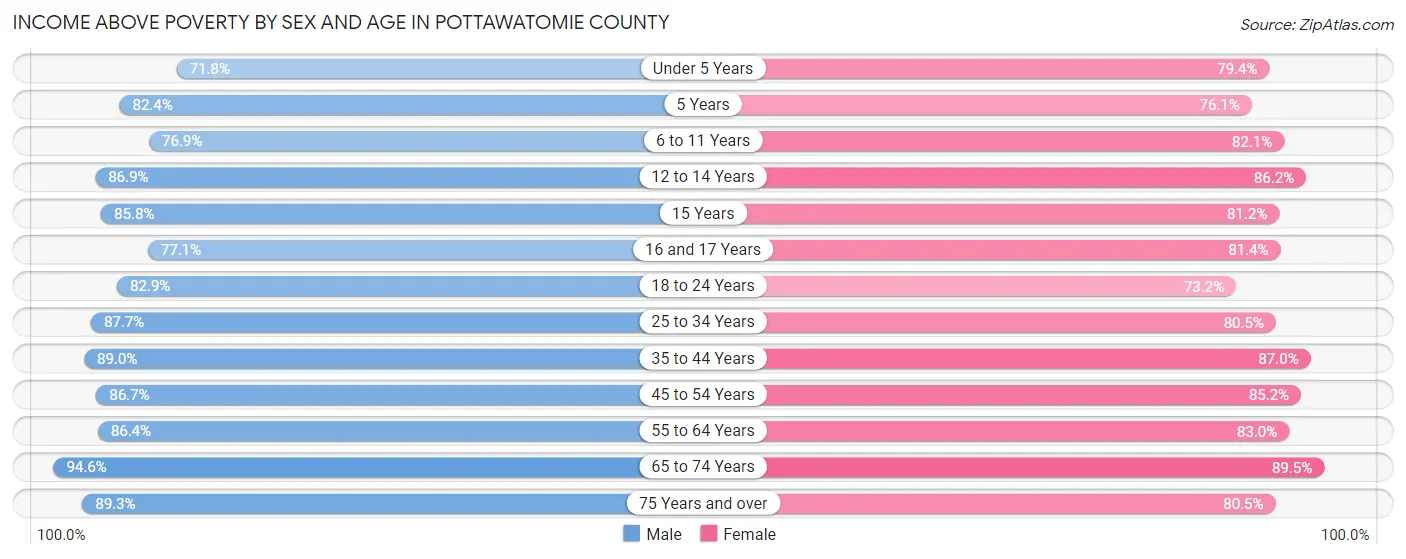
Income Above Poverty by Sex and Age in Pottawatomie County
According to the poverty statistics in Pottawatomie County, males aged 65 to 74 years and females aged 65 to 74 years are the age groups that are most secure financially, with 94.6% of males and 89.5% of females in these age groups living above the poverty line.
| Age Bracket | Male | Female |
| Under 5 Years | 1,499 (71.8%) | 1,615 (79.4%) |
| 5 Years | 313 (82.4%) | 286 (76.1%) |
| 6 to 11 Years | 2,100 (76.9%) | 2,374 (82.1%) |
| 12 to 14 Years | 1,511 (86.9%) | 1,223 (86.2%) |
| 15 Years | 368 (85.8%) | 310 (81.1%) |
| 16 and 17 Years | 786 (77.1%) | 902 (81.4%) |
| 18 to 24 Years | 2,706 (82.9%) | 2,145 (73.2%) |
| 25 to 34 Years | 3,687 (87.7%) | 3,406 (80.5%) |
| 35 to 44 Years | 3,835 (89.0%) | 3,811 (87.0%) |
| 45 to 54 Years | 3,655 (86.7%) | 3,863 (85.2%) |
| 55 to 64 Years | 3,825 (86.4%) | 3,882 (83.0%) |
| 65 to 74 Years | 3,126 (94.6%) | 3,284 (89.5%) |
| 75 Years and over | 1,668 (89.3%) | 2,147 (80.5%) |
| Total | 29,079 (85.6%) | 29,248 (82.9%) |
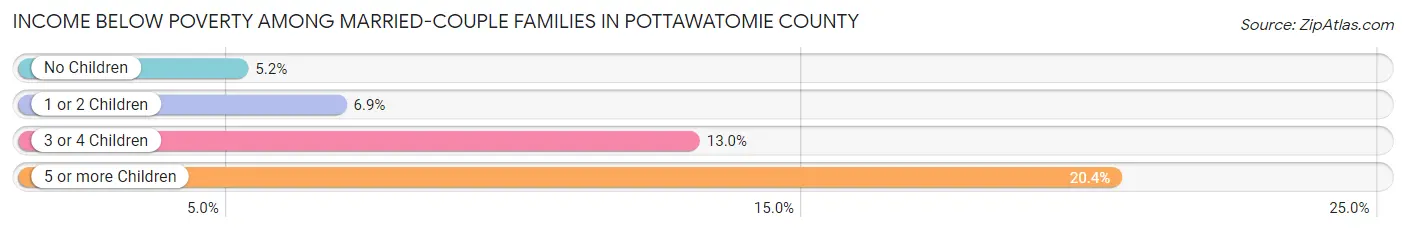
Income Below Poverty Among Married-Couple Families in Pottawatomie County
The poverty statistics for married-couple families in Pottawatomie County show that 6.6% or 887 of the total 13,381 families live below the poverty line. Families with 5 or more children have the highest poverty rate of 20.4%, comprising of 42 families. On the other hand, families with no children have the lowest poverty rate of 5.2%, which includes 414 families.
| Children | Above Poverty | Below Poverty |
| No Children | 7,573 (94.8%) | 414 (5.2%) |
| 1 or 2 Children | 3,717 (93.1%) | 275 (6.9%) |
| 3 or 4 Children | 1,040 (87.0%) | 156 (13.0%) |
| 5 or more Children | 164 (79.6%) | 42 (20.4%) |
| Total | 12,494 (93.4%) | 887 (6.6%) |
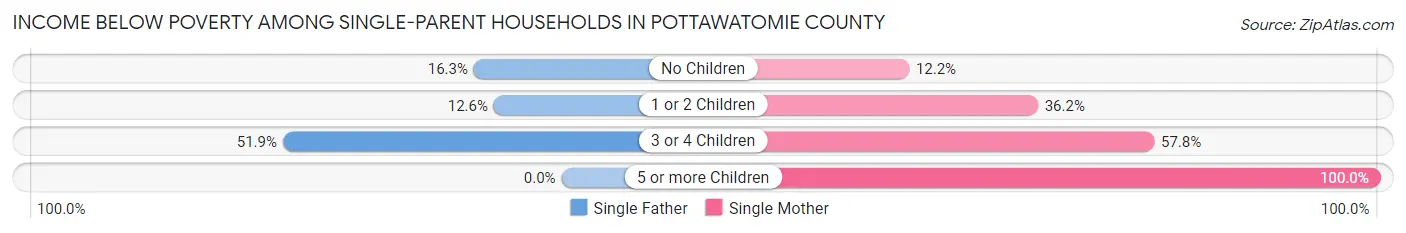
Income Below Poverty Among Single-Parent Households in Pottawatomie County
According to the poverty data in Pottawatomie County, 16.7% or 215 single-father households and 30.0% or 1,047 single-mother households are living below the poverty line. Among single-father households, those with 3 or 4 children have the highest poverty rate, with 41 households (51.9%) experiencing poverty. Likewise, among single-mother households, those with 5 or more children have the highest poverty rate, with 16 households (100.0%) falling below the poverty line.
| Children | Single Father | Single Mother |
| No Children | 96 (16.3%) | 164 (12.2%) |
| 1 or 2 Children | 78 (12.6%) | 608 (36.1%) |
| 3 or 4 Children | 41 (51.9%) | 259 (57.8%) |
| 5 or more Children | 0 (0.0%) | 16 (100.0%) |
| Total | 215 (16.7%) | 1,047 (30.0%) |
Income Below Poverty Among Married-Couple vs Single-Parent Households in Pottawatomie County
The poverty data for Pottawatomie County shows that 887 of the married-couple family households (6.6%) and 1,262 of the single-parent households (26.4%) are living below the poverty level. Within the married-couple family households, those with 5 or more children have the highest poverty rate, with 42 households (20.4%) falling below the poverty line. Among the single-parent households, those with 5 or more children have the highest poverty rate, with 16 household (100.0%) living below poverty.
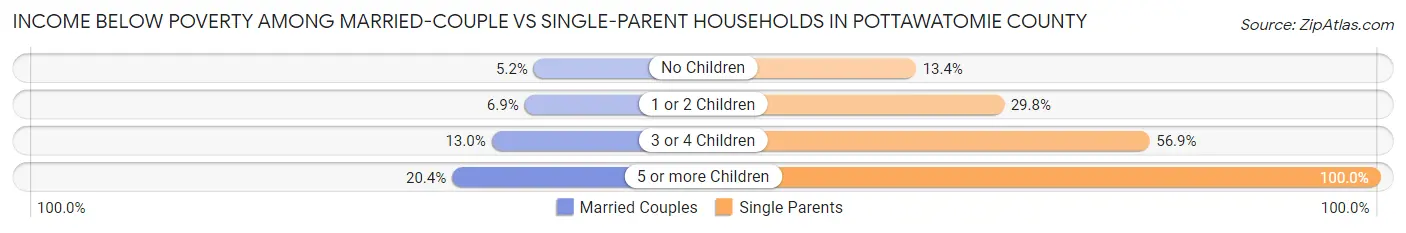
| Children | Married-Couple Families | Single-Parent Households |
| No Children | 414 (5.2%) | 260 (13.4%) |
| 1 or 2 Children | 275 (6.9%) | 686 (29.8%) |
| 3 or 4 Children | 156 (13.0%) | 300 (56.9%) |
| 5 or more Children | 42 (20.4%) | 16 (100.0%) |
| Total | 887 (6.6%) | 1,262 (26.4%) |
Employment Characteristics in Pottawatomie County
Employment by Class of Employer in Pottawatomie County
Among the 29,303 employed individuals in Pottawatomie County, private company employees (17,350 | 59.2%), local government employees (2,680 | 9.1%), and federal government employees (2,357 | 8.0%) make up the most common classes of employment.
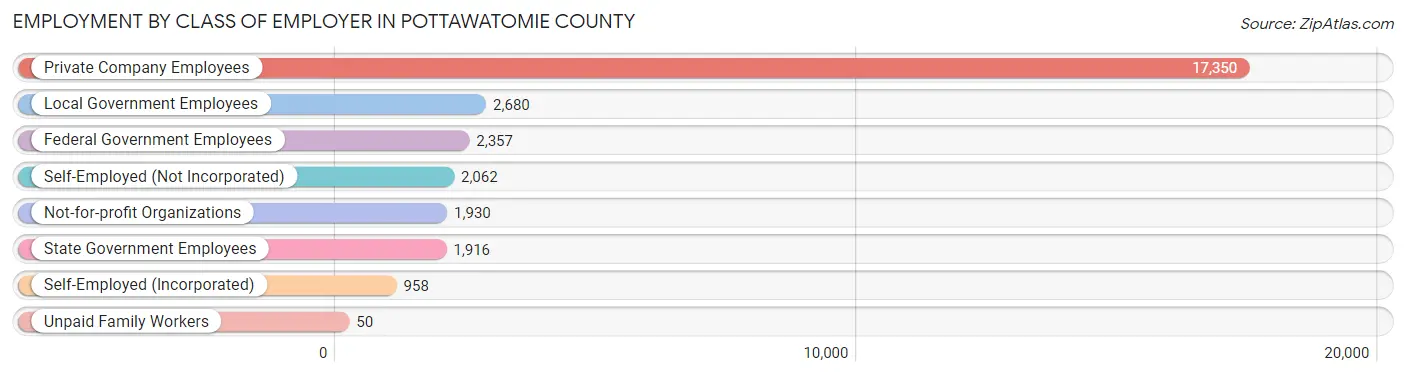
| Employer Class | # Employees | % Employees |
| Private Company Employees | 17,350 | 59.2% |
| Self-Employed (Incorporated) | 958 | 3.3% |
| Self-Employed (Not Incorporated) | 2,062 | 7.0% |
| Not-for-profit Organizations | 1,930 | 6.6% |
| Local Government Employees | 2,680 | 9.1% |
| State Government Employees | 1,916 | 6.5% |
| Federal Government Employees | 2,357 | 8.0% |
| Unpaid Family Workers | 50 | 0.2% |
| Total | 29,303 | 100.0% |
Employment Status by Age in Pottawatomie County
According to the labor force statistics for Pottawatomie County, out of the total population over 16 years of age (58,000), 54.5% or 31,610 individuals are in the labor force, with 5.8% or 1,833 of them unemployed. The age group with the highest labor force participation rate is 25 to 29 years, with 74.6% or 3,293 individuals in the labor force. Within the labor force, the 16 to 19 years age range has the highest percentage of unemployed individuals, with 15.3% or 233 of them being unemployed.
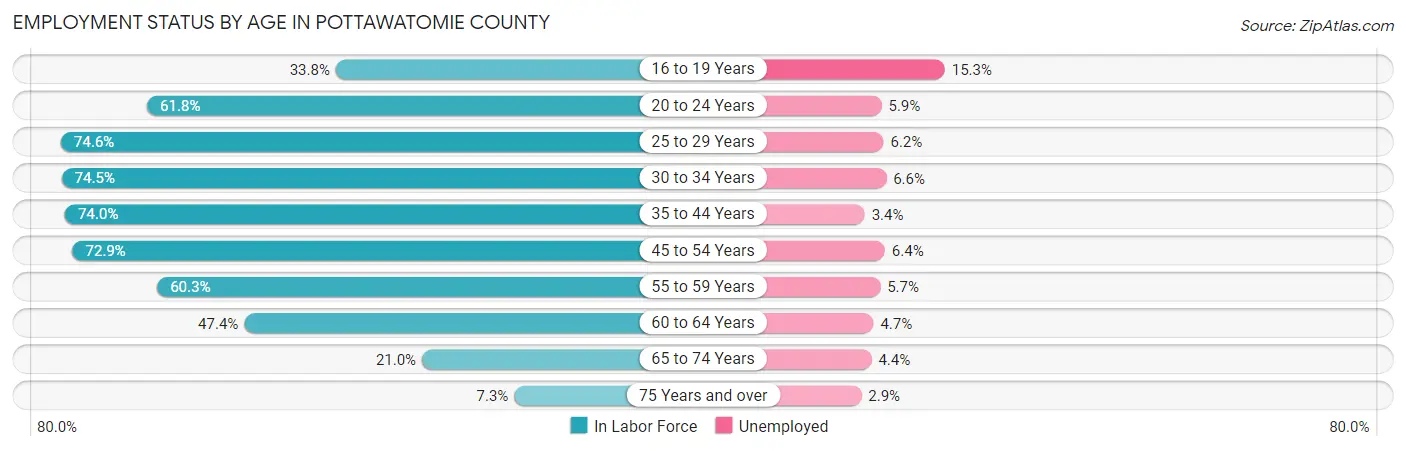
| Age Bracket | In Labor Force | Unemployed |
| 16 to 19 Years | 1,521 (33.8%) | 233 (15.3%) |
| 20 to 24 Years | 3,253 (61.8%) | 192 (5.9%) |
| 25 to 29 Years | 3,293 (74.6%) | 204 (6.2%) |
| 30 to 34 Years | 3,386 (74.5%) | 223 (6.6%) |
| 35 to 44 Years | 6,807 (74.0%) | 231 (3.4%) |
| 45 to 54 Years | 6,509 (72.9%) | 417 (6.4%) |
| 55 to 59 Years | 2,916 (60.3%) | 166 (5.7%) |
| 60 to 64 Years | 2,104 (47.4%) | 99 (4.7%) |
| 65 to 74 Years | 1,489 (21.0%) | 66 (4.4%) |
| 75 Years and over | 349 (7.3%) | 10 (2.9%) |
| Total | 31,610 (54.5%) | 1,833 (5.8%) |
Employment Status by Educational Attainment in Pottawatomie County
According to labor force statistics for Pottawatomie County, 68.8% of individuals (25,016) out of the total population between 25 and 64 years of age (36,360) are in the labor force, with 5.4% or 1,351 of them being unemployed. The group with the highest labor force participation rate are those with the educational attainment of bachelor's degree or higher, with 85.1% or 6,325 individuals in the labor force. Within the labor force, individuals with less than high school education have the highest percentage of unemployment, with 8.1% or 164 of them being unemployed.
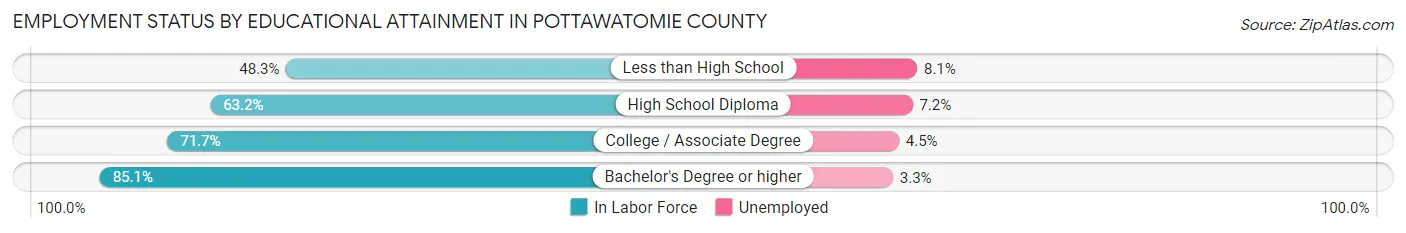
| Educational Attainment | In Labor Force | Unemployed |
| Less than High School | 2,019 (48.3%) | 339 (8.1%) |
| High School Diploma | 8,056 (63.2%) | 918 (7.2%) |
| College / Associate Degree | 8,604 (71.7%) | 540 (4.5%) |
| Bachelor's Degree or higher | 6,325 (85.1%) | 245 (3.3%) |
| Total | 25,016 (68.8%) | 1,963 (5.4%) |
Employment Occupations by Sex in Pottawatomie County
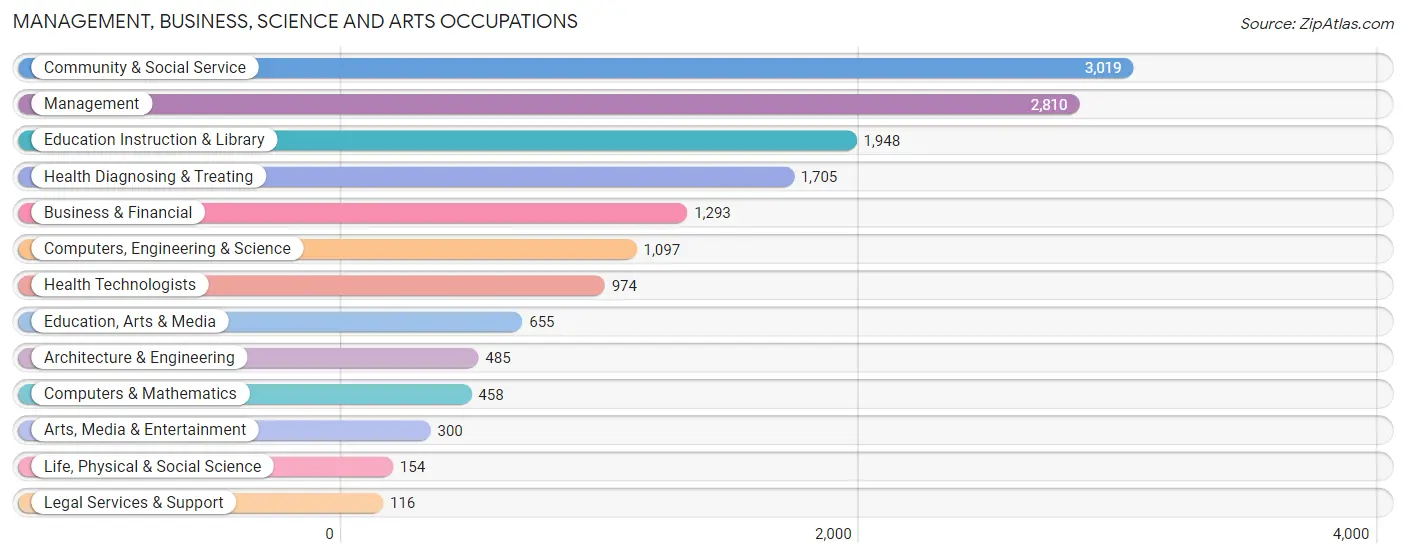
Management, Business, Science and Arts Occupations
The most common Management, Business, Science and Arts occupations in Pottawatomie County are Community & Social Service (3,019 | 10.2%), Management (2,810 | 9.5%), Education Instruction & Library (1,948 | 6.6%), Health Diagnosing & Treating (1,705 | 5.7%), and Business & Financial (1,293 | 4.3%).
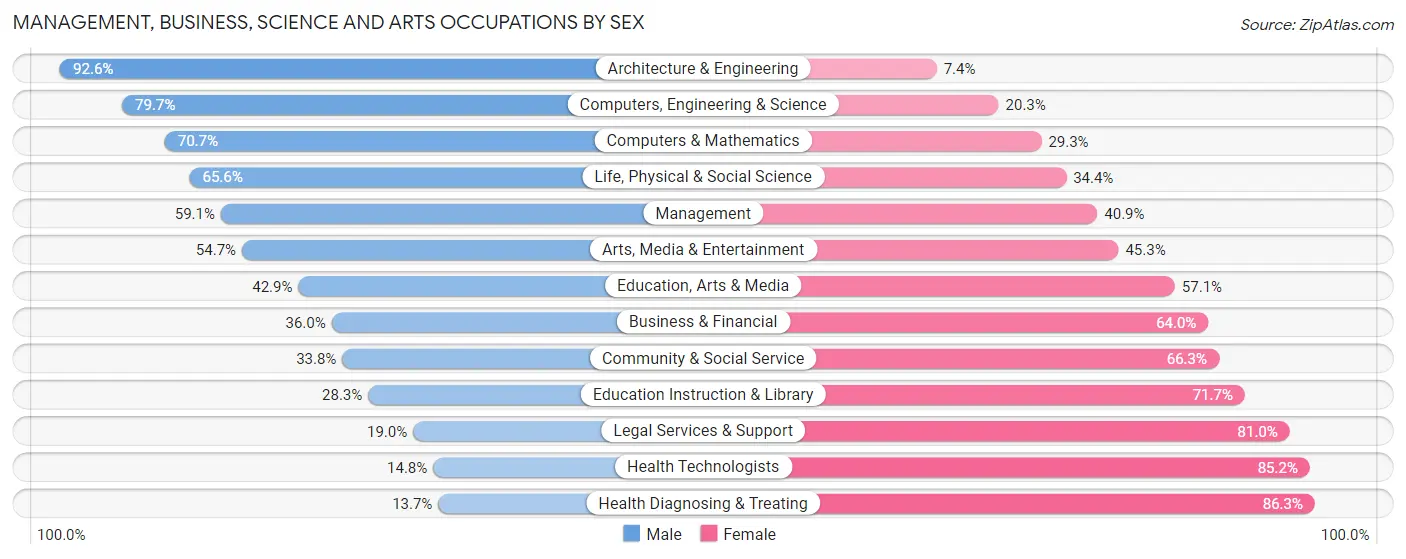
Management, Business, Science and Arts Occupations by Sex
Within the Management, Business, Science and Arts occupations in Pottawatomie County, the most male-oriented occupations are Architecture & Engineering (92.6%), Computers, Engineering & Science (79.7%), and Computers & Mathematics (70.7%), while the most female-oriented occupations are Health Diagnosing & Treating (86.3%), Health Technologists (85.2%), and Legal Services & Support (81.0%).
| Occupation | Male | Female |
| Management | 1,660 (59.1%) | 1,150 (40.9%) |
| Business & Financial | 465 (36.0%) | 828 (64.0%) |
| Computers, Engineering & Science | 874 (79.7%) | 223 (20.3%) |
| Computers & Mathematics | 324 (70.7%) | 134 (29.3%) |
| Architecture & Engineering | 449 (92.6%) | 36 (7.4%) |
| Life, Physical & Social Science | 101 (65.6%) | 53 (34.4%) |
| Community & Social Service | 1,019 (33.8%) | 2,000 (66.2%) |
| Education, Arts & Media | 281 (42.9%) | 374 (57.1%) |
| Legal Services & Support | 22 (19.0%) | 94 (81.0%) |
| Education Instruction & Library | 552 (28.3%) | 1,396 (71.7%) |
| Arts, Media & Entertainment | 164 (54.7%) | 136 (45.3%) |
| Health Diagnosing & Treating | 234 (13.7%) | 1,471 (86.3%) |
| Health Technologists | 144 (14.8%) | 830 (85.2%) |
| Total (Category) | 4,252 (42.8%) | 5,672 (57.2%) |
| Total (Overall) | 15,843 (53.3%) | 13,878 (46.7%) |
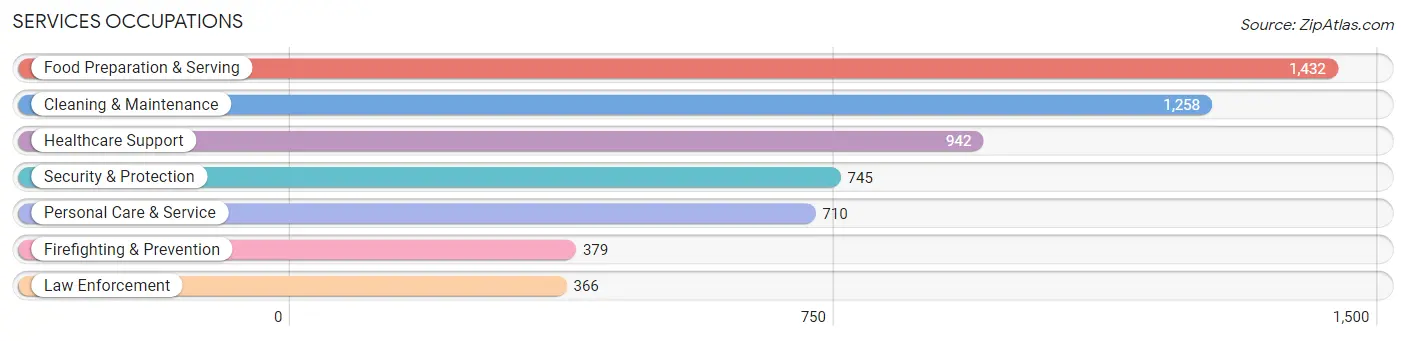
Services Occupations
The most common Services occupations in Pottawatomie County are Food Preparation & Serving (1,432 | 4.8%), Cleaning & Maintenance (1,258 | 4.2%), Healthcare Support (942 | 3.2%), Security & Protection (745 | 2.5%), and Personal Care & Service (710 | 2.4%).
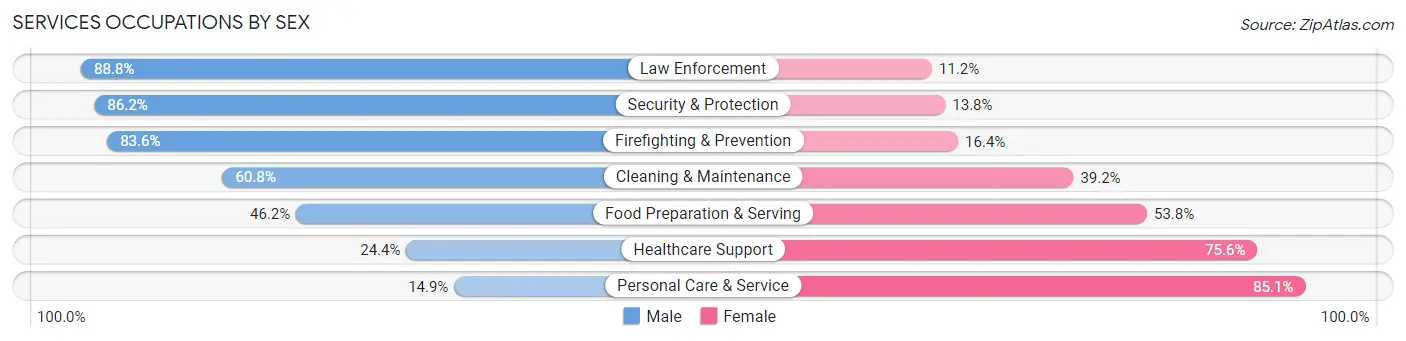
Services Occupations by Sex
Within the Services occupations in Pottawatomie County, the most male-oriented occupations are Law Enforcement (88.8%), Security & Protection (86.2%), and Firefighting & Prevention (83.6%), while the most female-oriented occupations are Personal Care & Service (85.1%), Healthcare Support (75.6%), and Food Preparation & Serving (53.8%).
| Occupation | Male | Female |
| Healthcare Support | 230 (24.4%) | 712 (75.6%) |
| Security & Protection | 642 (86.2%) | 103 (13.8%) |
| Firefighting & Prevention | 317 (83.6%) | 62 (16.4%) |
| Law Enforcement | 325 (88.8%) | 41 (11.2%) |
| Food Preparation & Serving | 662 (46.2%) | 770 (53.8%) |
| Cleaning & Maintenance | 765 (60.8%) | 493 (39.2%) |
| Personal Care & Service | 106 (14.9%) | 604 (85.1%) |
| Total (Category) | 2,405 (47.3%) | 2,682 (52.7%) |
| Total (Overall) | 15,843 (53.3%) | 13,878 (46.7%) |
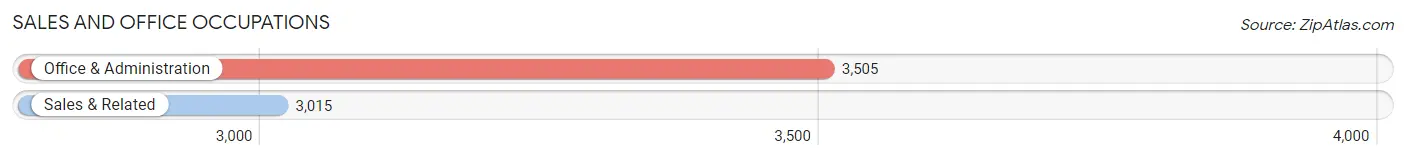
Sales and Office Occupations
The most common Sales and Office occupations in Pottawatomie County are Office & Administration (3,505 | 11.8%), and Sales & Related (3,015 | 10.1%).
Sales and Office Occupations by Sex
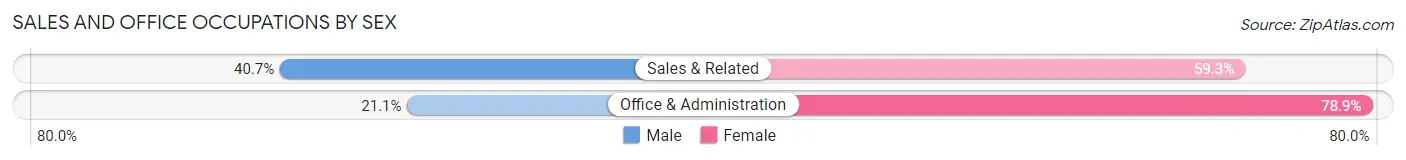
| Occupation | Male | Female |
| Sales & Related | 1,227 (40.7%) | 1,788 (59.3%) |
| Office & Administration | 740 (21.1%) | 2,765 (78.9%) |
| Total (Category) | 1,967 (30.2%) | 4,553 (69.8%) |
| Total (Overall) | 15,843 (53.3%) | 13,878 (46.7%) |
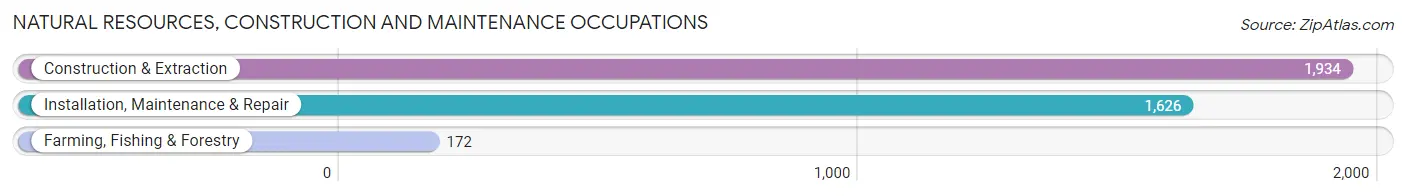
Natural Resources, Construction and Maintenance Occupations
The most common Natural Resources, Construction and Maintenance occupations in Pottawatomie County are Construction & Extraction (1,934 | 6.5%), Installation, Maintenance & Repair (1,626 | 5.5%), and Farming, Fishing & Forestry (172 | 0.6%).
Natural Resources, Construction and Maintenance Occupations by Sex
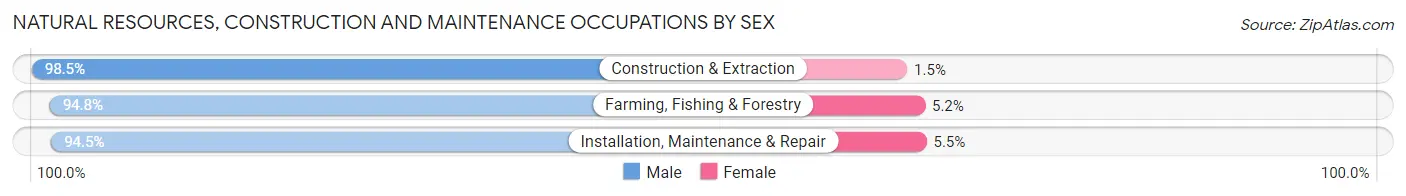
| Occupation | Male | Female |
| Farming, Fishing & Forestry | 163 (94.8%) | 9 (5.2%) |
| Construction & Extraction | 1,905 (98.5%) | 29 (1.5%) |
| Installation, Maintenance & Repair | 1,536 (94.5%) | 90 (5.5%) |
| Total (Category) | 3,604 (96.6%) | 128 (3.4%) |
| Total (Overall) | 15,843 (53.3%) | 13,878 (46.7%) |
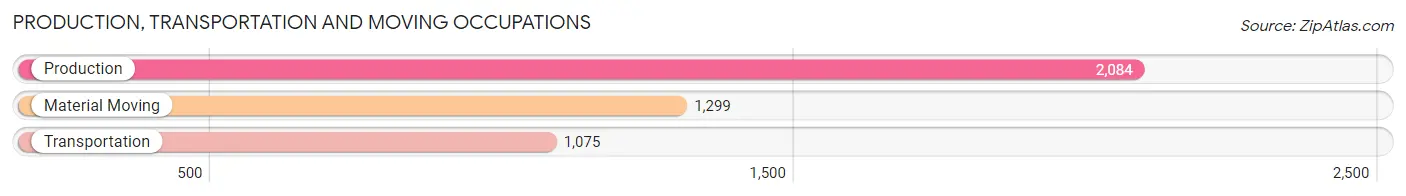
Production, Transportation and Moving Occupations
The most common Production, Transportation and Moving occupations in Pottawatomie County are Production (2,084 | 7.0%), Material Moving (1,299 | 4.4%), and Transportation (1,075 | 3.6%).
Production, Transportation and Moving Occupations by Sex
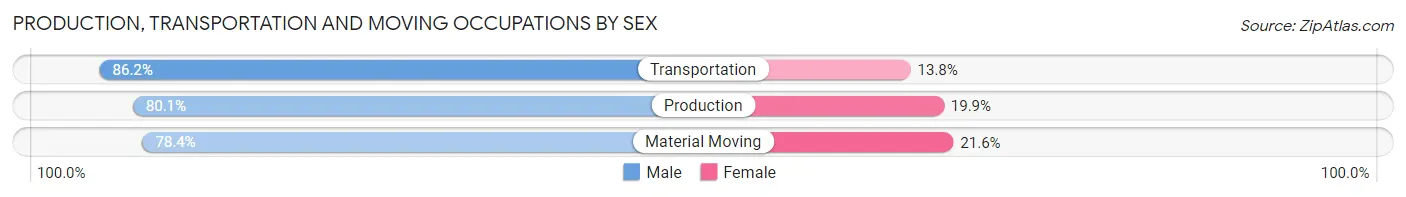
| Occupation | Male | Female |
| Production | 1,670 (80.1%) | 414 (19.9%) |
| Transportation | 927 (86.2%) | 148 (13.8%) |
| Material Moving | 1,018 (78.4%) | 281 (21.6%) |
| Total (Category) | 3,615 (81.1%) | 843 (18.9%) |
| Total (Overall) | 15,843 (53.3%) | 13,878 (46.7%) |
Employment Industries by Sex in Pottawatomie County
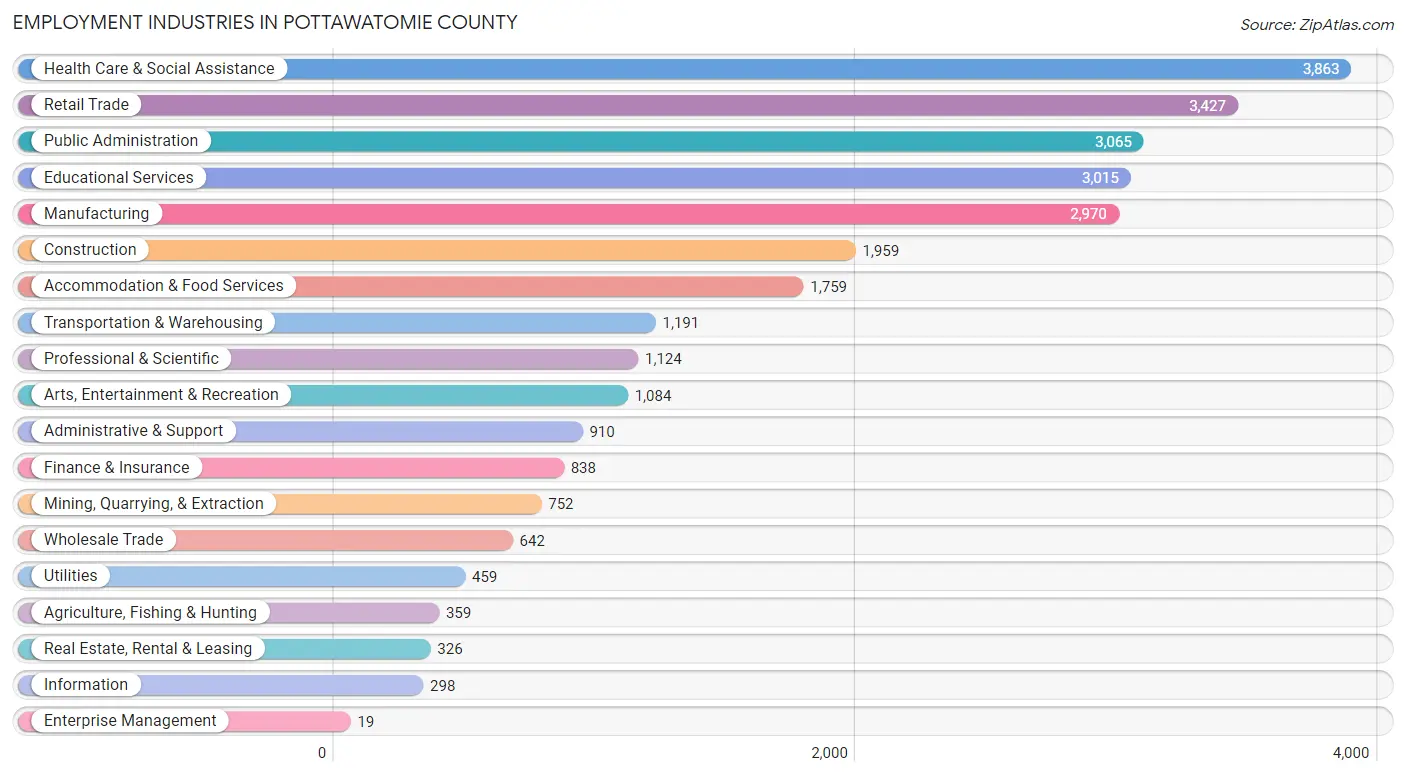
Employment Industries in Pottawatomie County
The major employment industries in Pottawatomie County include Health Care & Social Assistance (3,863 | 13.0%), Retail Trade (3,427 | 11.5%), Public Administration (3,065 | 10.3%), Educational Services (3,015 | 10.1%), and Manufacturing (2,970 | 10.0%).
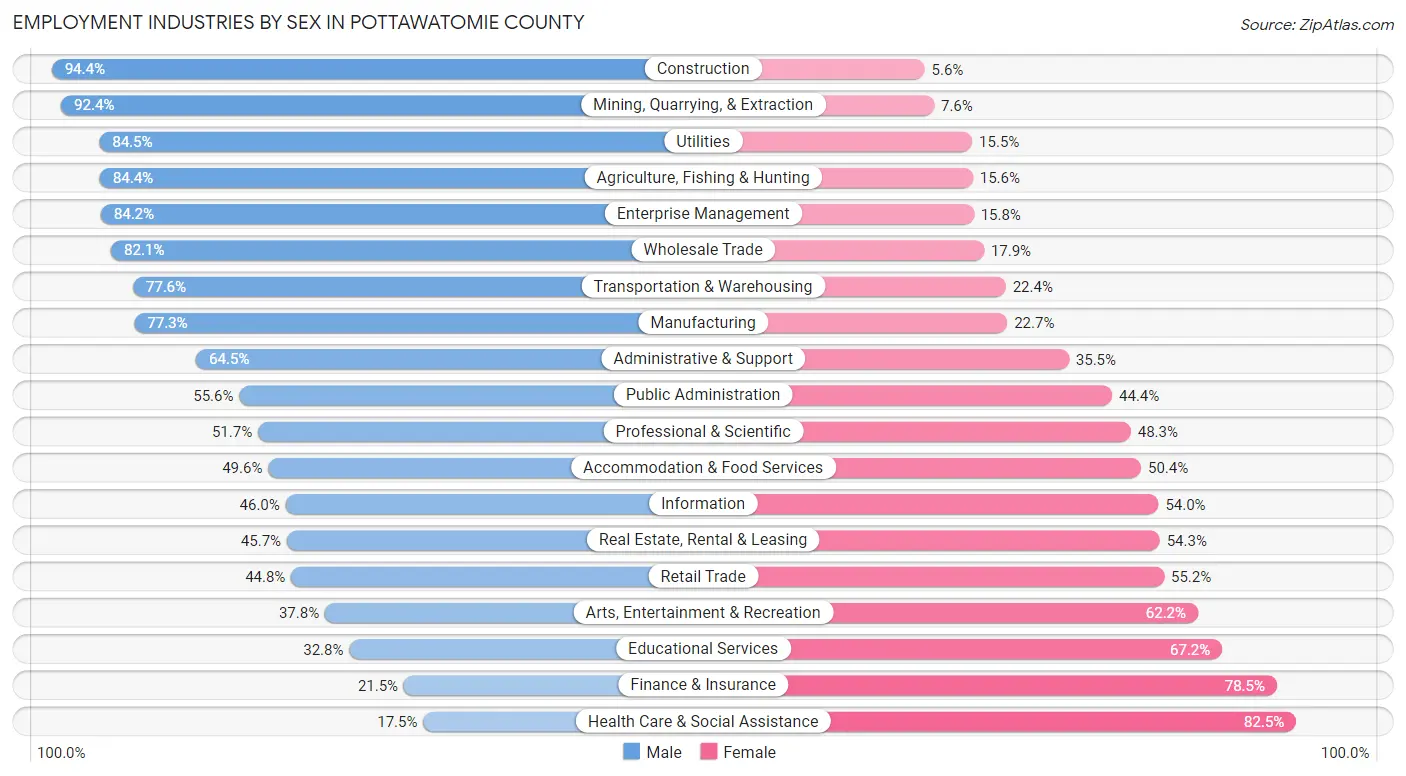
Employment Industries by Sex in Pottawatomie County
The Pottawatomie County industries that see more men than women are Construction (94.4%), Mining, Quarrying, & Extraction (92.4%), and Utilities (84.5%), whereas the industries that tend to have a higher number of women are Health Care & Social Assistance (82.5%), Finance & Insurance (78.5%), and Educational Services (67.2%).
| Industry | Male | Female |
| Agriculture, Fishing & Hunting | 303 (84.4%) | 56 (15.6%) |
| Mining, Quarrying, & Extraction | 695 (92.4%) | 57 (7.6%) |
| Construction | 1,849 (94.4%) | 110 (5.6%) |
| Manufacturing | 2,295 (77.3%) | 675 (22.7%) |
| Wholesale Trade | 527 (82.1%) | 115 (17.9%) |
| Retail Trade | 1,536 (44.8%) | 1,891 (55.2%) |
| Transportation & Warehousing | 924 (77.6%) | 267 (22.4%) |
| Utilities | 388 (84.5%) | 71 (15.5%) |
| Information | 137 (46.0%) | 161 (54.0%) |
| Finance & Insurance | 180 (21.5%) | 658 (78.5%) |
| Real Estate, Rental & Leasing | 149 (45.7%) | 177 (54.3%) |
| Professional & Scientific | 581 (51.7%) | 543 (48.3%) |
| Enterprise Management | 16 (84.2%) | 3 (15.8%) |
| Administrative & Support | 587 (64.5%) | 323 (35.5%) |
| Educational Services | 989 (32.8%) | 2,026 (67.2%) |
| Health Care & Social Assistance | 675 (17.5%) | 3,188 (82.5%) |
| Arts, Entertainment & Recreation | 410 (37.8%) | 674 (62.2%) |
| Accommodation & Food Services | 872 (49.6%) | 887 (50.4%) |
| Public Administration | 1,703 (55.6%) | 1,362 (44.4%) |
| Total | 15,843 (53.3%) | 13,878 (46.7%) |
Education in Pottawatomie County
School Enrollment in Pottawatomie County
The most common levels of schooling among the 18,651 students in Pottawatomie County are high school (4,360 | 23.4%), college / undergraduate (4,054 | 21.7%), and middle school (3,959 | 21.2%).
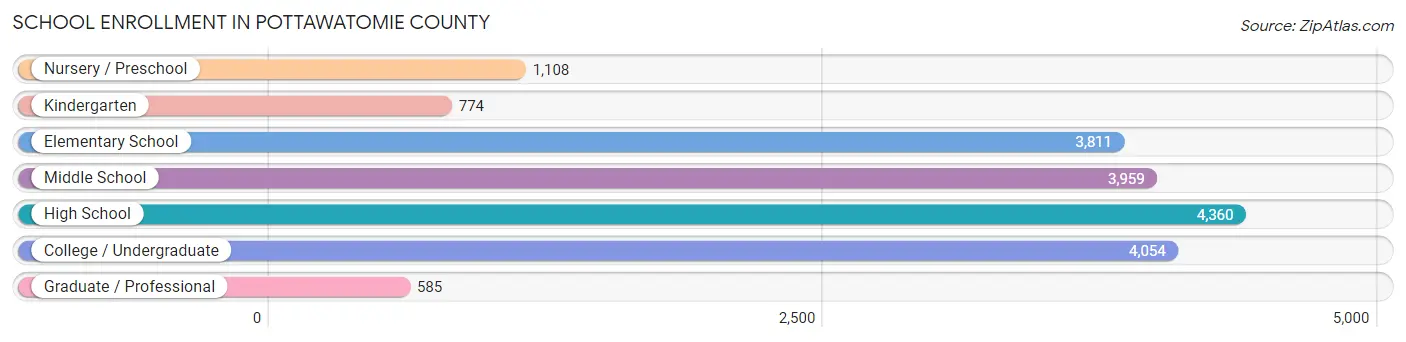
| School Level | # Students | % Students |
| Nursery / Preschool | 1,108 | 5.9% |
| Kindergarten | 774 | 4.2% |
| Elementary School | 3,811 | 20.4% |
| Middle School | 3,959 | 21.2% |
| High School | 4,360 | 23.4% |
| College / Undergraduate | 4,054 | 21.7% |
| Graduate / Professional | 585 | 3.1% |
| Total | 18,651 | 100.0% |
School Enrollment by Age by Funding Source in Pottawatomie County
Out of a total of 18,651 students who are enrolled in schools in Pottawatomie County, 3,469 (18.6%) attend a private institution, while the remaining 15,182 (81.4%) are enrolled in public schools. The age group of 20 to 24 year olds has the highest likelihood of being enrolled in private schools, with 1,069 (51.6% in the age bracket) enrolled. Conversely, the age group of 15 to 17 year olds has the lowest likelihood of being enrolled in a private school, with 2,587 (89.0% in the age bracket) attending a public institution.
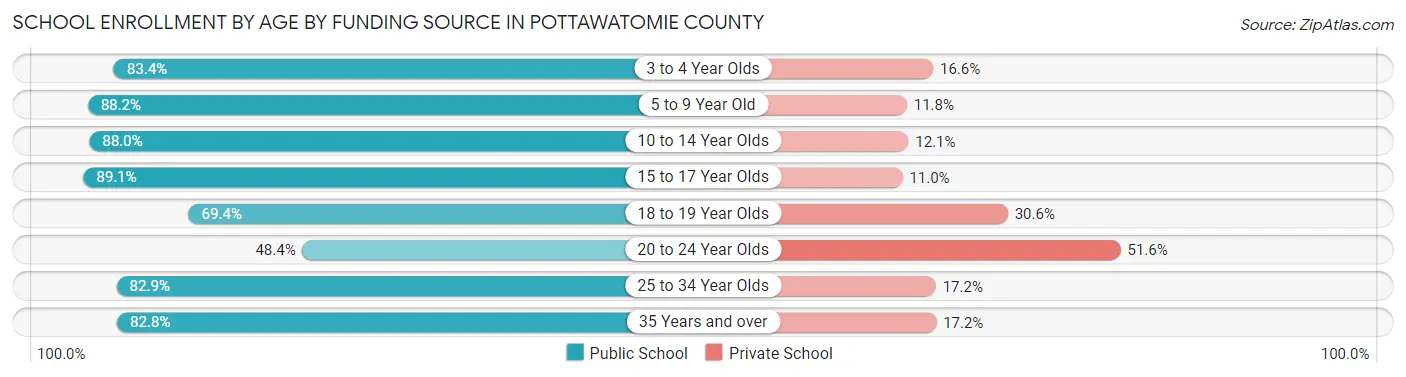
| Age Bracket | Public School | Private School |
| 3 to 4 Year Olds | 636 (83.4%) | 127 (16.6%) |
| 5 to 9 Year Old | 3,849 (88.2%) | 513 (11.8%) |
| 10 to 14 Year Olds | 4,385 (87.9%) | 601 (12.0%) |
| 15 to 17 Year Olds | 2,587 (89.0%) | 318 (11.0%) |
| 18 to 19 Year Olds | 1,161 (69.4%) | 511 (30.6%) |
| 20 to 24 Year Olds | 1,004 (48.4%) | 1,069 (51.6%) |
| 25 to 34 Year Olds | 681 (82.9%) | 141 (17.2%) |
| 35 Years and over | 884 (82.8%) | 184 (17.2%) |
| Total | 15,182 (81.4%) | 3,469 (18.6%) |
Educational Attainment by Field of Study in Pottawatomie County
Business (2,399 | 22.1%), education (2,324 | 21.4%), science & technology (1,157 | 10.7%), arts & humanities (809 | 7.5%), and liberal arts & history (685 | 6.3%) are the most common fields of study among 10,835 individuals in Pottawatomie County who have obtained a bachelor's degree or higher.
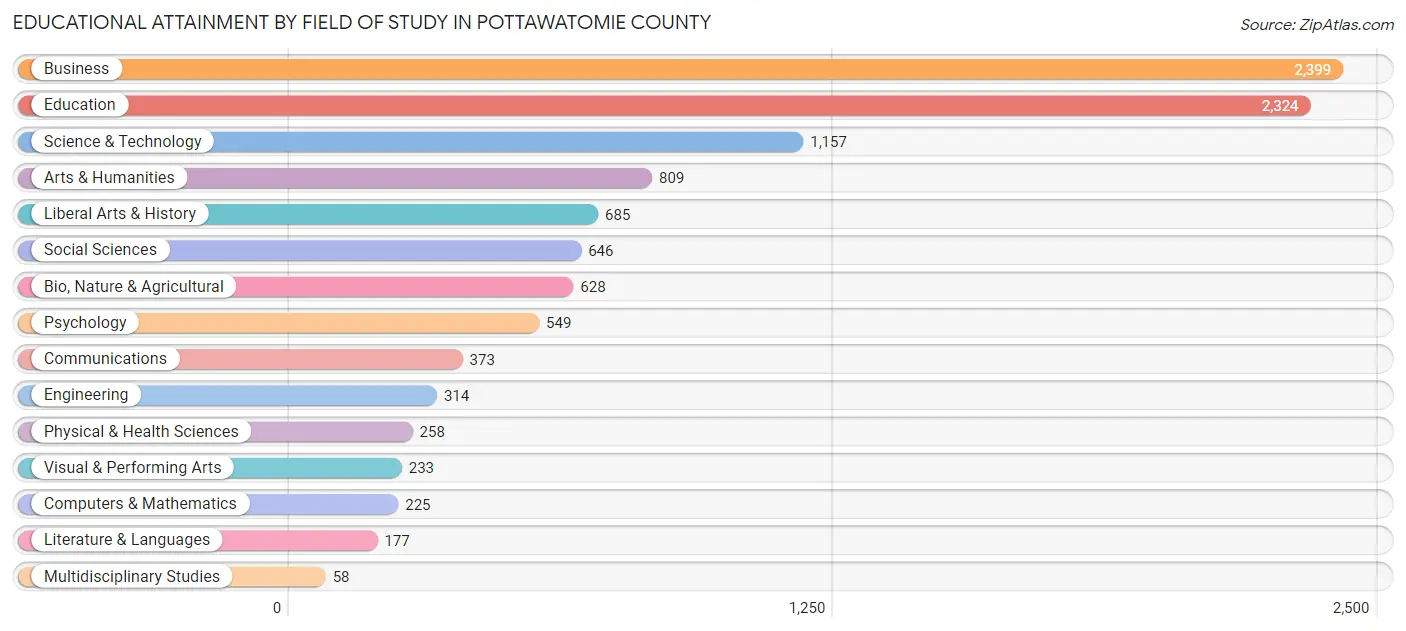
| Field of Study | # Graduates | % Graduates |
| Computers & Mathematics | 225 | 2.1% |
| Bio, Nature & Agricultural | 628 | 5.8% |
| Physical & Health Sciences | 258 | 2.4% |
| Psychology | 549 | 5.1% |
| Social Sciences | 646 | 6.0% |
| Engineering | 314 | 2.9% |
| Multidisciplinary Studies | 58 | 0.5% |
| Science & Technology | 1,157 | 10.7% |
| Business | 2,399 | 22.1% |
| Education | 2,324 | 21.4% |
| Literature & Languages | 177 | 1.6% |
| Liberal Arts & History | 685 | 6.3% |
| Visual & Performing Arts | 233 | 2.1% |
| Communications | 373 | 3.4% |
| Arts & Humanities | 809 | 7.5% |
| Total | 10,835 | 100.0% |
Transportation & Commute in Pottawatomie County
Vehicle Availability by Sex in Pottawatomie County
The most prevalent vehicle ownership categories in Pottawatomie County are males with 2 vehicles (6,463, accounting for 41.5%) and females with 2 vehicles (5,451, making up 47.6%).
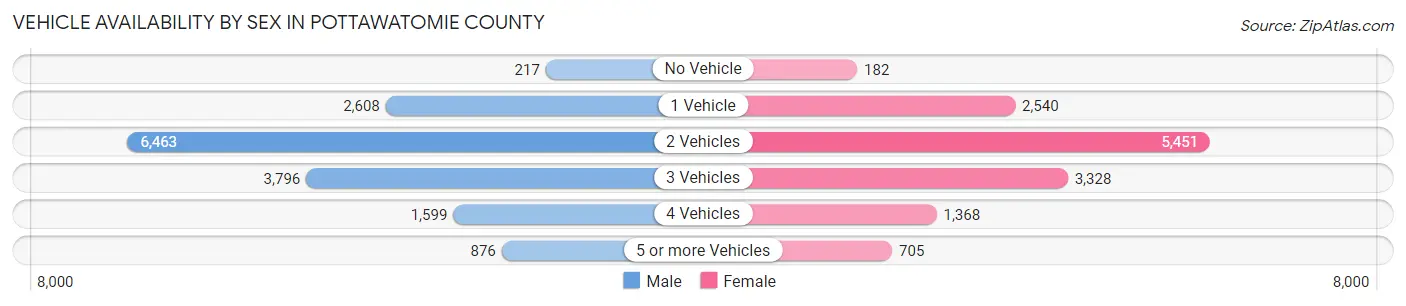
| Vehicles Available | Male | Female |
| No Vehicle | 217 (1.4%) | 182 (1.3%) |
| 1 Vehicle | 2,608 (16.8%) | 2,540 (18.7%) |
| 2 Vehicles | 6,463 (41.5%) | 5,451 (40.2%) |
| 3 Vehicles | 3,796 (24.4%) | 3,328 (24.5%) |
| 4 Vehicles | 1,599 (10.3%) | 1,368 (10.1%) |
| 5 or more Vehicles | 876 (5.6%) | 705 (5.2%) |
| Total | 15,559 (100.0%) | 13,574 (100.0%) |
Commute Time in Pottawatomie County
The most frequently occuring commute durations in Pottawatomie County are 5 to 9 minutes (4,391 commuters, 15.9%), 10 to 14 minutes (4,299 commuters, 15.6%), and 15 to 19 minutes (4,247 commuters, 15.4%).
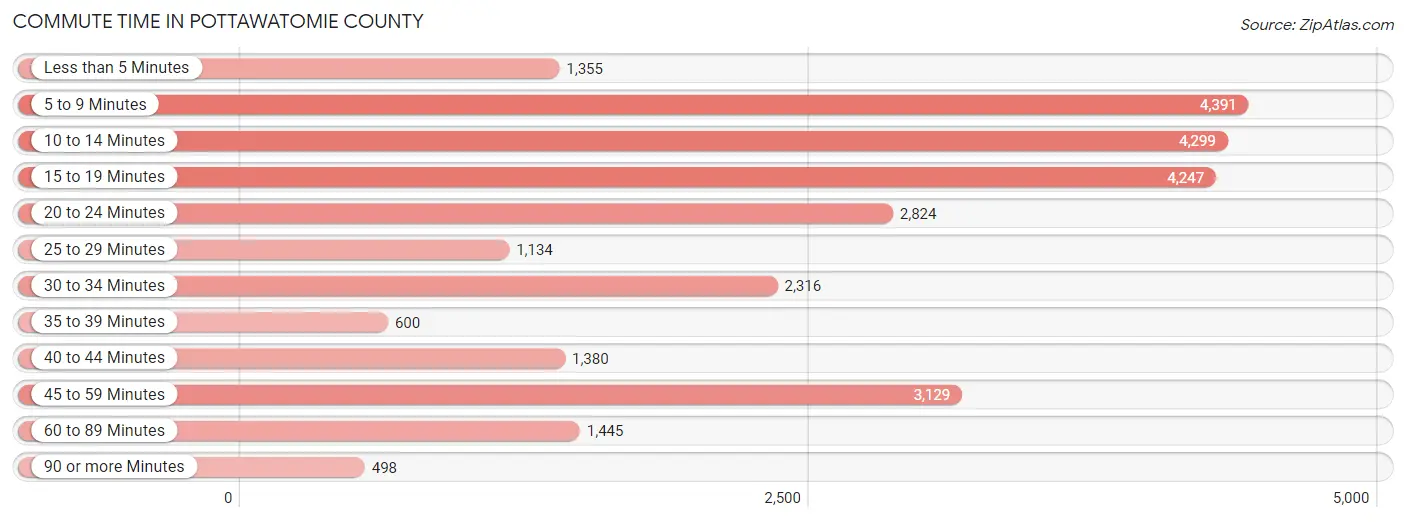
| Commute Time | # Commuters | % Commuters |
| Less than 5 Minutes | 1,355 | 4.9% |
| 5 to 9 Minutes | 4,391 | 15.9% |
| 10 to 14 Minutes | 4,299 | 15.6% |
| 15 to 19 Minutes | 4,247 | 15.4% |
| 20 to 24 Minutes | 2,824 | 10.2% |
| 25 to 29 Minutes | 1,134 | 4.1% |
| 30 to 34 Minutes | 2,316 | 8.4% |
| 35 to 39 Minutes | 600 | 2.2% |
| 40 to 44 Minutes | 1,380 | 5.0% |
| 45 to 59 Minutes | 3,129 | 11.3% |
| 60 to 89 Minutes | 1,445 | 5.2% |
| 90 or more Minutes | 498 | 1.8% |
Commute Time by Sex in Pottawatomie County
The most common commute times in Pottawatomie County are 15 to 19 minutes (2,177 commuters, 14.8%) for males and 5 to 9 minutes (2,405 commuters, 18.6%) for females.
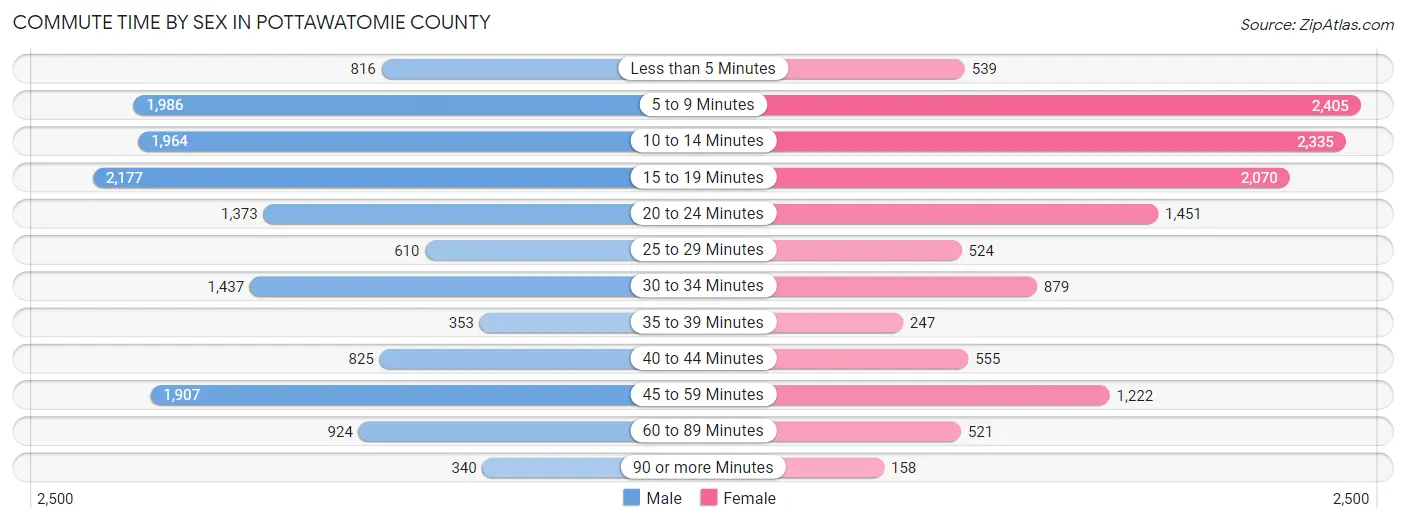
| Commute Time | Male | Female |
| Less than 5 Minutes | 816 (5.6%) | 539 (4.2%) |
| 5 to 9 Minutes | 1,986 (13.5%) | 2,405 (18.6%) |
| 10 to 14 Minutes | 1,964 (13.4%) | 2,335 (18.1%) |
| 15 to 19 Minutes | 2,177 (14.8%) | 2,070 (16.0%) |
| 20 to 24 Minutes | 1,373 (9.3%) | 1,451 (11.2%) |
| 25 to 29 Minutes | 610 (4.2%) | 524 (4.1%) |
| 30 to 34 Minutes | 1,437 (9.8%) | 879 (6.8%) |
| 35 to 39 Minutes | 353 (2.4%) | 247 (1.9%) |
| 40 to 44 Minutes | 825 (5.6%) | 555 (4.3%) |
| 45 to 59 Minutes | 1,907 (13.0%) | 1,222 (9.5%) |
| 60 to 89 Minutes | 924 (6.3%) | 521 (4.0%) |
| 90 or more Minutes | 340 (2.3%) | 158 (1.2%) |
Time of Departure to Work by Sex in Pottawatomie County
The most frequent times of departure to work in Pottawatomie County are 7:00 AM to 7:29 AM (2,140, 14.5%) for males and 7:30 AM to 7:59 AM (2,385, 18.5%) for females.
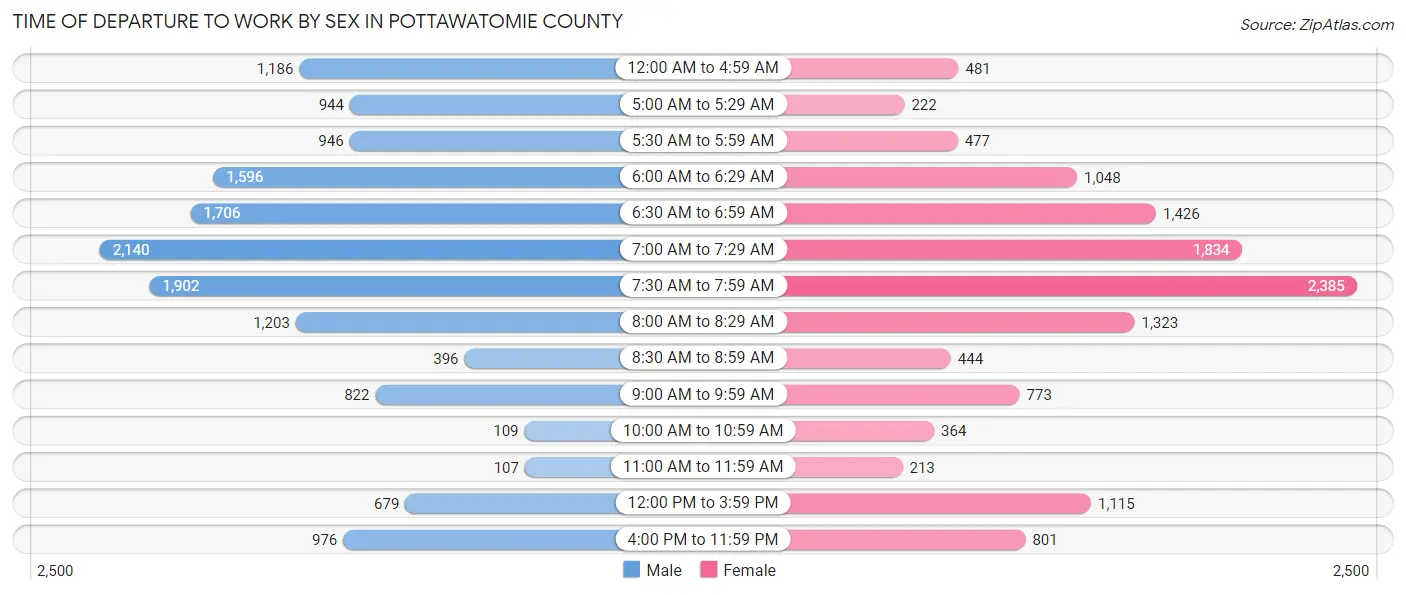
| Time of Departure | Male | Female |
| 12:00 AM to 4:59 AM | 1,186 (8.1%) | 481 (3.7%) |
| 5:00 AM to 5:29 AM | 944 (6.4%) | 222 (1.7%) |
| 5:30 AM to 5:59 AM | 946 (6.4%) | 477 (3.7%) |
| 6:00 AM to 6:29 AM | 1,596 (10.8%) | 1,048 (8.1%) |
| 6:30 AM to 6:59 AM | 1,706 (11.6%) | 1,426 (11.1%) |
| 7:00 AM to 7:29 AM | 2,140 (14.5%) | 1,834 (14.2%) |
| 7:30 AM to 7:59 AM | 1,902 (12.9%) | 2,385 (18.5%) |
| 8:00 AM to 8:29 AM | 1,203 (8.2%) | 1,323 (10.2%) |
| 8:30 AM to 8:59 AM | 396 (2.7%) | 444 (3.4%) |
| 9:00 AM to 9:59 AM | 822 (5.6%) | 773 (6.0%) |
| 10:00 AM to 10:59 AM | 109 (0.7%) | 364 (2.8%) |
| 11:00 AM to 11:59 AM | 107 (0.7%) | 213 (1.7%) |
| 12:00 PM to 3:59 PM | 679 (4.6%) | 1,115 (8.6%) |
| 4:00 PM to 11:59 PM | 976 (6.6%) | 801 (6.2%) |
| Total | 14,712 (100.0%) | 12,906 (100.0%) |
Housing Occupancy in Pottawatomie County
Occupancy by Ownership in Pottawatomie County
Of the total 26,422 dwellings in Pottawatomie County, owner-occupied units account for 18,482 (70.0%), while renter-occupied units make up 7,940 (30.0%).
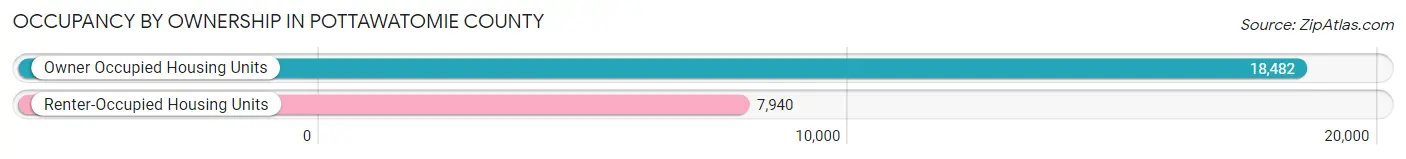
| Occupancy | # Housing Units | % Housing Units |
| Owner Occupied Housing Units | 18,482 | 70.0% |
| Renter-Occupied Housing Units | 7,940 | 30.0% |
| Total Occupied Housing Units | 26,422 | 100.0% |
Occupancy by Household Size in Pottawatomie County
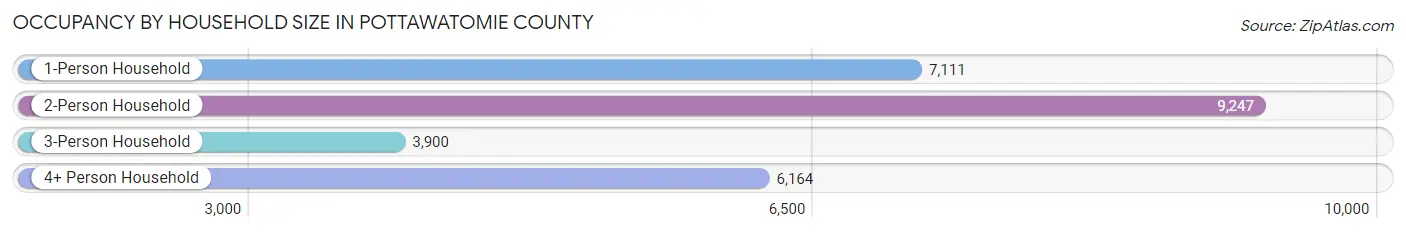
| Household Size | # Housing Units | % Housing Units |
| 1-Person Household | 7,111 | 26.9% |
| 2-Person Household | 9,247 | 35.0% |
| 3-Person Household | 3,900 | 14.8% |
| 4+ Person Household | 6,164 | 23.3% |
| Total Housing Units | 26,422 | 100.0% |
Occupancy by Ownership by Household Size in Pottawatomie County
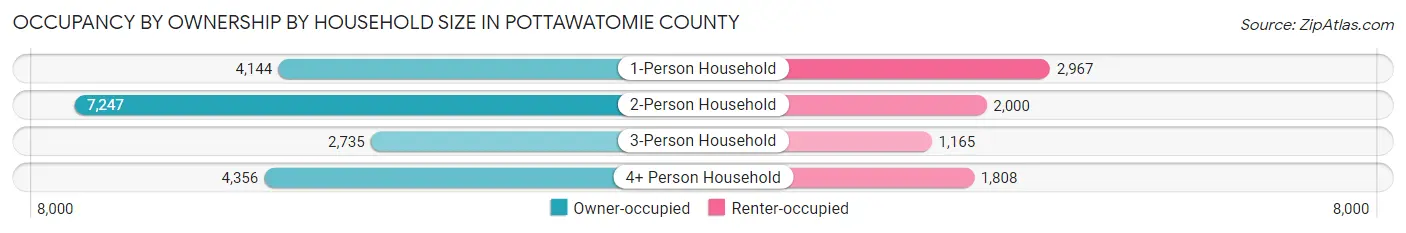
| Household Size | Owner-occupied | Renter-occupied |
| 1-Person Household | 4,144 (58.3%) | 2,967 (41.7%) |
| 2-Person Household | 7,247 (78.4%) | 2,000 (21.6%) |
| 3-Person Household | 2,735 (70.1%) | 1,165 (29.9%) |
| 4+ Person Household | 4,356 (70.7%) | 1,808 (29.3%) |
| Total Housing Units | 18,482 (70.0%) | 7,940 (30.0%) |
Occupancy by Educational Attainment in Pottawatomie County
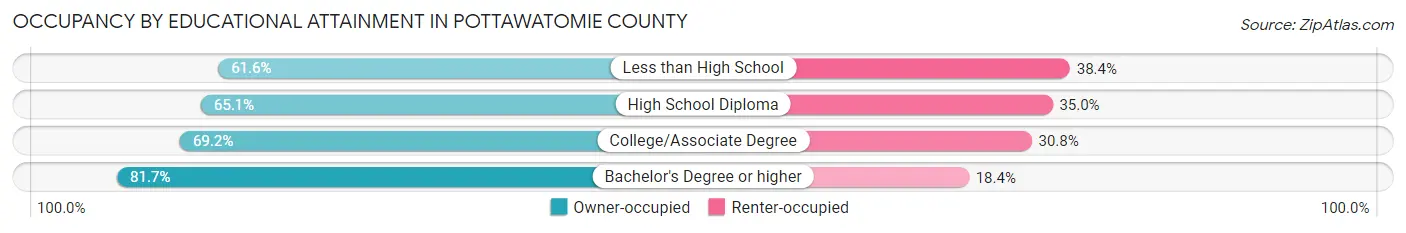
| Household Size | Owner-occupied | Renter-occupied |
| Less than High School | 1,653 (61.6%) | 1,030 (38.4%) |
| High School Diploma | 5,473 (65.0%) | 2,940 (34.9%) |
| College/Associate Degree | 6,426 (69.2%) | 2,862 (30.8%) |
| Bachelor's Degree or higher | 4,930 (81.7%) | 1,108 (18.3%) |
Occupancy by Age of Householder in Pottawatomie County
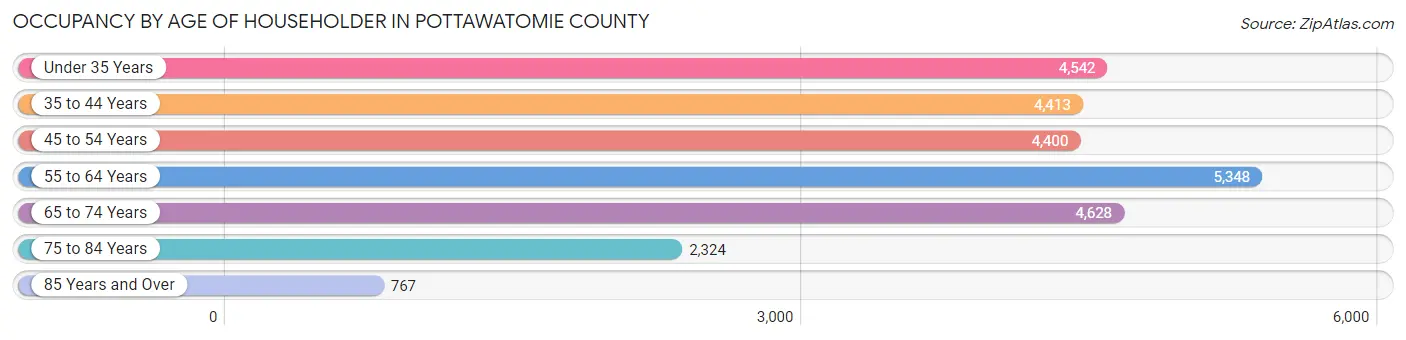
| Age Bracket | # Households | % Households |
| Under 35 Years | 4,542 | 17.2% |
| 35 to 44 Years | 4,413 | 16.7% |
| 45 to 54 Years | 4,400 | 16.7% |
| 55 to 64 Years | 5,348 | 20.2% |
| 65 to 74 Years | 4,628 | 17.5% |
| 75 to 84 Years | 2,324 | 8.8% |
| 85 Years and Over | 767 | 2.9% |
| Total | 26,422 | 100.0% |
Housing Finances in Pottawatomie County
Median Income by Occupancy in Pottawatomie County
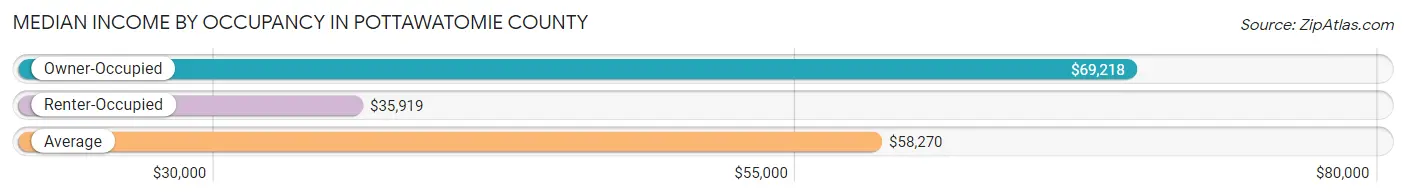
| Occupancy Type | # Households | Median Income |
| Owner-Occupied | 18,482 (70.0%) | $69,218 |
| Renter-Occupied | 7,940 (30.0%) | $35,919 |
| Average | 26,422 (100.0%) | $58,270 |
Occupancy by Householder Income Bracket in Pottawatomie County
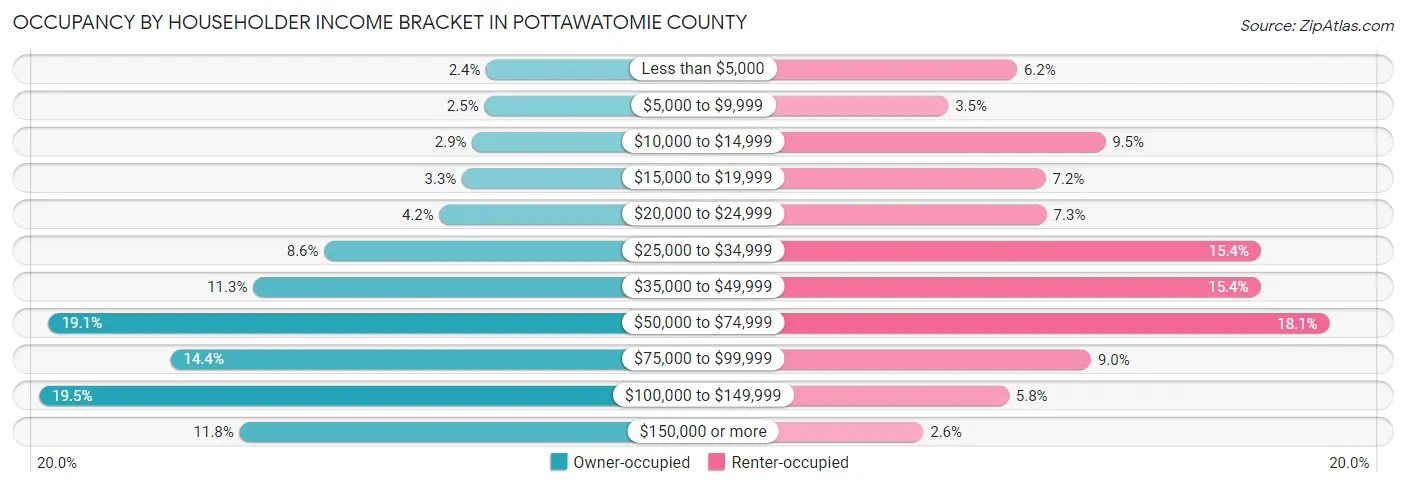
| Income Bracket | Owner-occupied | Renter-occupied |
| Less than $5,000 | 446 (2.4%) | 488 (6.1%) |
| $5,000 to $9,999 | 459 (2.5%) | 280 (3.5%) |
| $10,000 to $14,999 | 544 (2.9%) | 755 (9.5%) |
| $15,000 to $19,999 | 615 (3.3%) | 575 (7.2%) |
| $20,000 to $24,999 | 774 (4.2%) | 578 (7.3%) |
| $25,000 to $34,999 | 1,585 (8.6%) | 1,226 (15.4%) |
| $35,000 to $49,999 | 2,086 (11.3%) | 1,224 (15.4%) |
| $50,000 to $74,999 | 3,527 (19.1%) | 1,433 (18.0%) |
| $75,000 to $99,999 | 2,668 (14.4%) | 712 (9.0%) |
| $100,000 to $149,999 | 3,595 (19.5%) | 464 (5.8%) |
| $150,000 or more | 2,183 (11.8%) | 205 (2.6%) |
| Total | 18,482 (100.0%) | 7,940 (100.0%) |
Monthly Housing Cost Tiers in Pottawatomie County
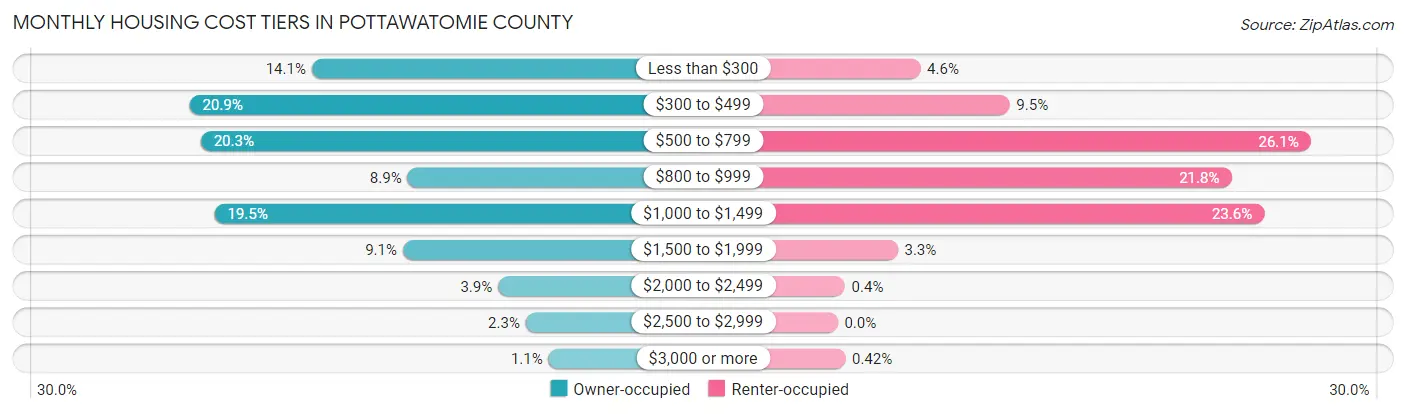
| Monthly Cost | Owner-occupied | Renter-occupied |
| Less than $300 | 2,614 (14.1%) | 363 (4.6%) |
| $300 to $499 | 3,860 (20.9%) | 754 (9.5%) |
| $500 to $799 | 3,747 (20.3%) | 2,075 (26.1%) |
| $800 to $999 | 1,635 (8.8%) | 1,727 (21.7%) |
| $1,000 to $1,499 | 3,606 (19.5%) | 1,871 (23.6%) |
| $1,500 to $1,999 | 1,684 (9.1%) | 264 (3.3%) |
| $2,000 to $2,499 | 711 (3.8%) | 32 (0.4%) |
| $2,500 to $2,999 | 429 (2.3%) | 0 (0.0%) |
| $3,000 or more | 196 (1.1%) | 33 (0.4%) |
| Total | 18,482 (100.0%) | 7,940 (100.0%) |
Physical Housing Characteristics in Pottawatomie County
Housing Structures in Pottawatomie County
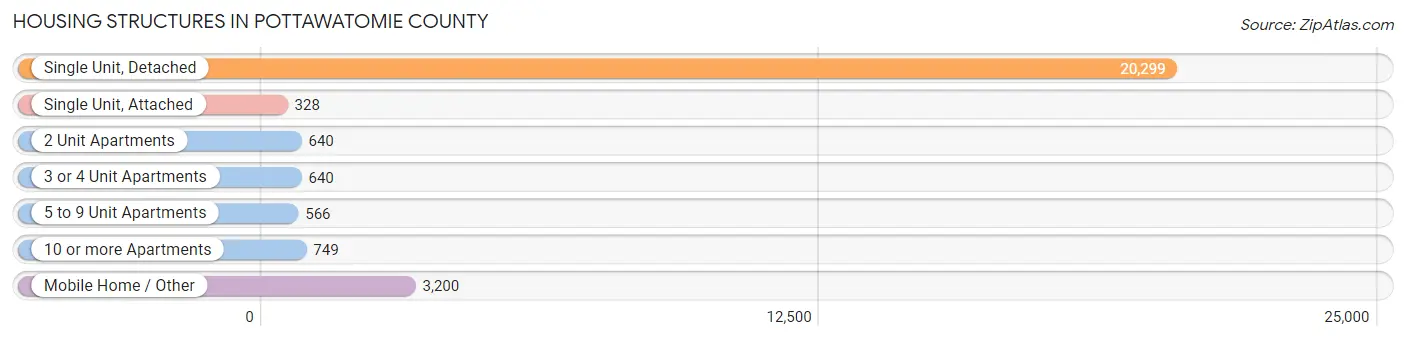
| Structure Type | # Housing Units | % Housing Units |
| Single Unit, Detached | 20,299 | 76.8% |
| Single Unit, Attached | 328 | 1.2% |
| 2 Unit Apartments | 640 | 2.4% |
| 3 or 4 Unit Apartments | 640 | 2.4% |
| 5 to 9 Unit Apartments | 566 | 2.1% |
| 10 or more Apartments | 749 | 2.8% |
| Mobile Home / Other | 3,200 | 12.1% |
| Total | 26,422 | 100.0% |
Housing Structures by Occupancy in Pottawatomie County
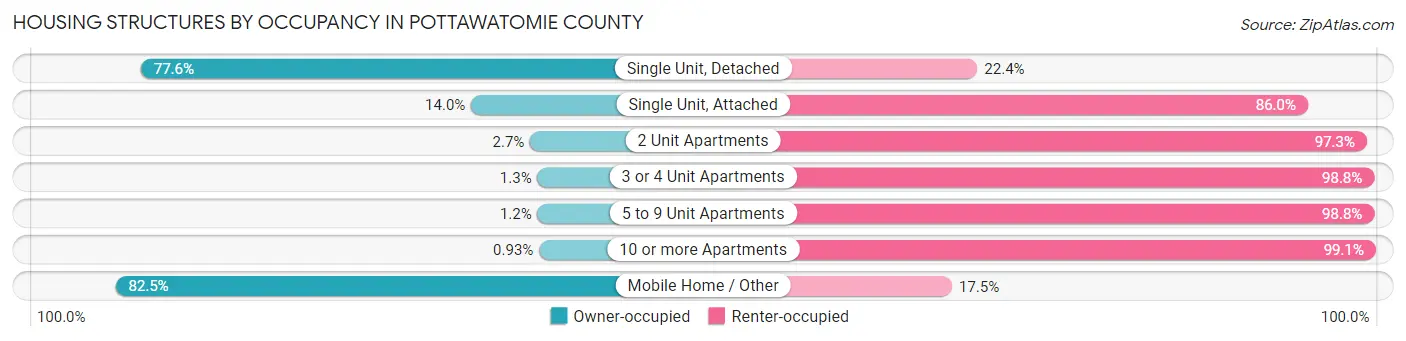
| Structure Type | Owner-occupied | Renter-occupied |
| Single Unit, Detached | 15,757 (77.6%) | 4,542 (22.4%) |
| Single Unit, Attached | 46 (14.0%) | 282 (86.0%) |
| 2 Unit Apartments | 17 (2.7%) | 623 (97.3%) |
| 3 or 4 Unit Apartments | 8 (1.3%) | 632 (98.8%) |
| 5 to 9 Unit Apartments | 7 (1.2%) | 559 (98.8%) |
| 10 or more Apartments | 7 (0.9%) | 742 (99.1%) |
| Mobile Home / Other | 2,640 (82.5%) | 560 (17.5%) |
| Total | 18,482 (70.0%) | 7,940 (30.0%) |
Housing Structures by Number of Rooms in Pottawatomie County
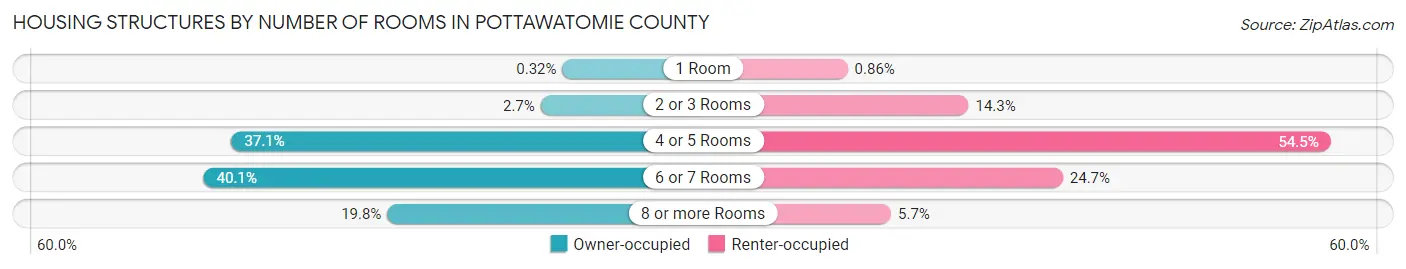
| Number of Rooms | Owner-occupied | Renter-occupied |
| 1 Room | 60 (0.3%) | 68 (0.9%) |
| 2 or 3 Rooms | 504 (2.7%) | 1,134 (14.3%) |
| 4 or 5 Rooms | 6,847 (37.0%) | 4,323 (54.4%) |
| 6 or 7 Rooms | 7,419 (40.1%) | 1,964 (24.7%) |
| 8 or more Rooms | 3,652 (19.8%) | 451 (5.7%) |
| Total | 18,482 (100.0%) | 7,940 (100.0%) |
Housing Structure by Heating Type in Pottawatomie County
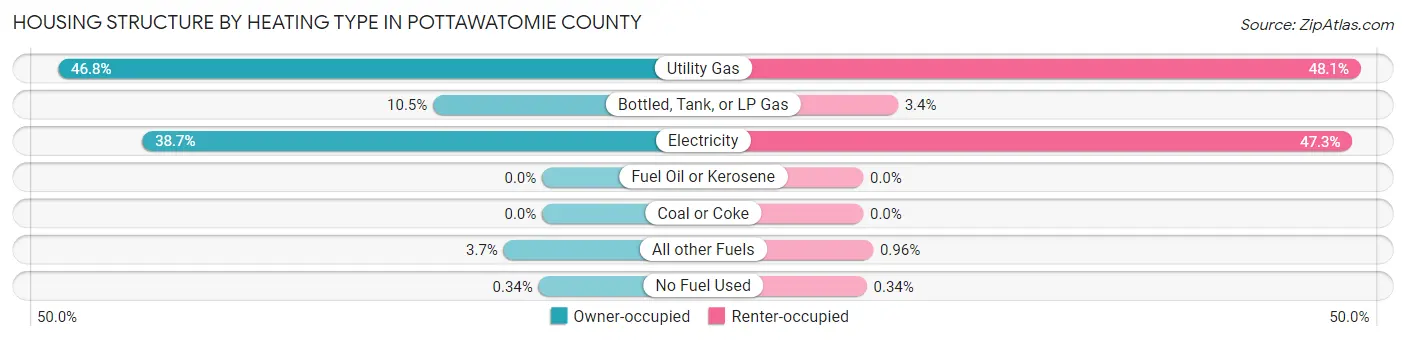
| Heating Type | Owner-occupied | Renter-occupied |
| Utility Gas | 8,643 (46.8%) | 3,818 (48.1%) |
| Bottled, Tank, or LP Gas | 1,947 (10.5%) | 266 (3.4%) |
| Electricity | 7,143 (38.7%) | 3,753 (47.3%) |
| Fuel Oil or Kerosene | 0 (0.0%) | 0 (0.0%) |
| Coal or Coke | 0 (0.0%) | 0 (0.0%) |
| All other Fuels | 686 (3.7%) | 76 (1.0%) |
| No Fuel Used | 63 (0.3%) | 27 (0.3%) |
| Total | 18,482 (100.0%) | 7,940 (100.0%) |
Household Vehicle Usage in Pottawatomie County
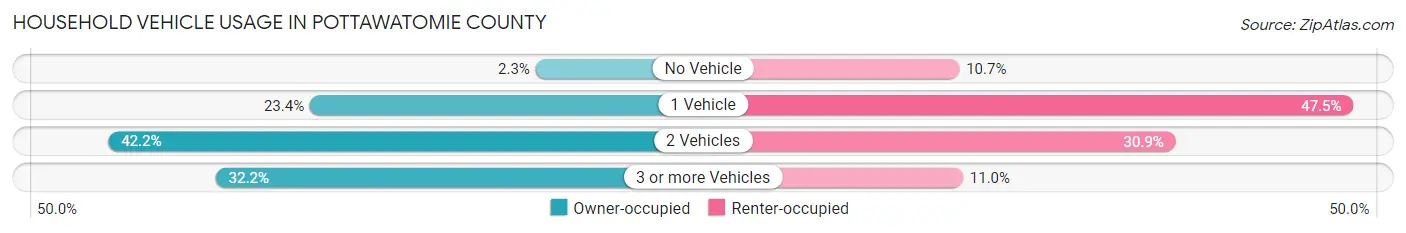
| Vehicles per Household | Owner-occupied | Renter-occupied |
| No Vehicle | 424 (2.3%) | 847 (10.7%) |
| 1 Vehicle | 4,317 (23.4%) | 3,768 (47.5%) |
| 2 Vehicles | 7,797 (42.2%) | 2,451 (30.9%) |
| 3 or more Vehicles | 5,944 (32.2%) | 874 (11.0%) |
| Total | 18,482 (100.0%) | 7,940 (100.0%) |
Real Estate & Mortgages in Pottawatomie County
Real Estate and Mortgage Overview in Pottawatomie County
| Characteristic | Without Mortgage | With Mortgage |
| Housing Units | 9,305 | 9,177 |
| Median Property Value | $123,600 | $167,500 |
| Median Household Income | $53,662 | $1,437 |
| Monthly Housing Costs | $396 | $196 |
| Real Estate Taxes | $726 | $555 |
Property Value by Mortgage Status in Pottawatomie County
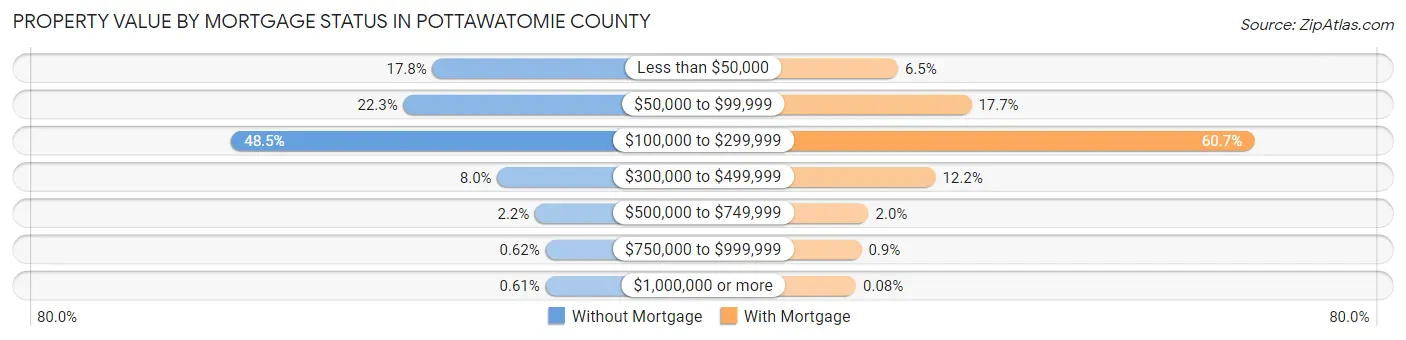
| Property Value | Without Mortgage | With Mortgage |
| Less than $50,000 | 1,660 (17.8%) | 593 (6.5%) |
| $50,000 to $99,999 | 2,071 (22.3%) | 1,621 (17.7%) |
| $100,000 to $299,999 | 4,513 (48.5%) | 5,572 (60.7%) |
| $300,000 to $499,999 | 740 (8.0%) | 1,118 (12.2%) |
| $500,000 to $749,999 | 206 (2.2%) | 183 (2.0%) |
| $750,000 to $999,999 | 58 (0.6%) | 83 (0.9%) |
| $1,000,000 or more | 57 (0.6%) | 7 (0.1%) |
| Total | 9,305 (100.0%) | 9,177 (100.0%) |
Household Income by Mortgage Status in Pottawatomie County
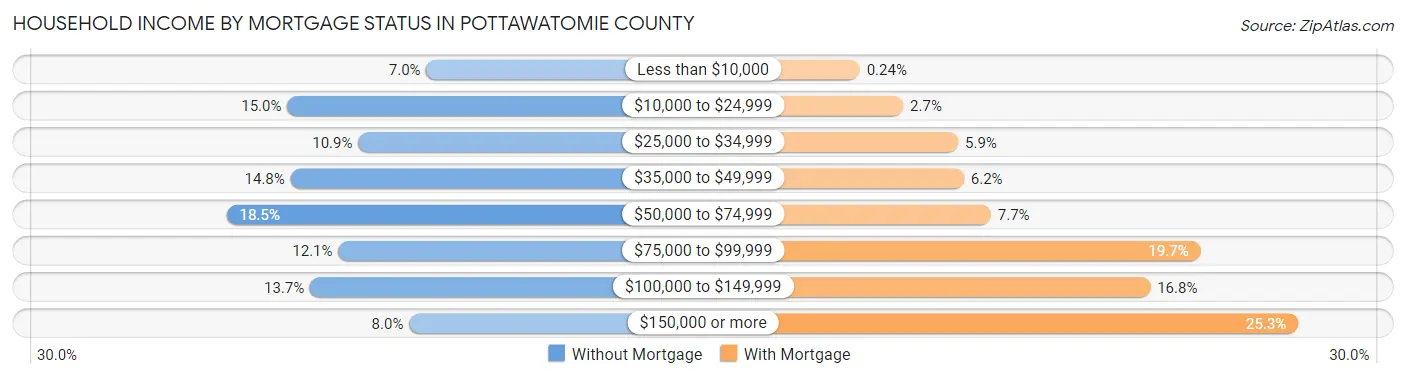
| Household Income | Without Mortgage | With Mortgage |
| Less than $10,000 | 655 (7.0%) | 22 (0.2%) |
| $10,000 to $24,999 | 1,395 (15.0%) | 250 (2.7%) |
| $25,000 to $34,999 | 1,017 (10.9%) | 538 (5.9%) |
| $35,000 to $49,999 | 1,377 (14.8%) | 568 (6.2%) |
| $50,000 to $74,999 | 1,718 (18.5%) | 709 (7.7%) |
| $75,000 to $99,999 | 1,123 (12.1%) | 1,809 (19.7%) |
| $100,000 to $149,999 | 1,274 (13.7%) | 1,545 (16.8%) |
| $150,000 or more | 746 (8.0%) | 2,321 (25.3%) |
| Total | 9,305 (100.0%) | 9,177 (100.0%) |
Property Value to Household Income Ratio in Pottawatomie County
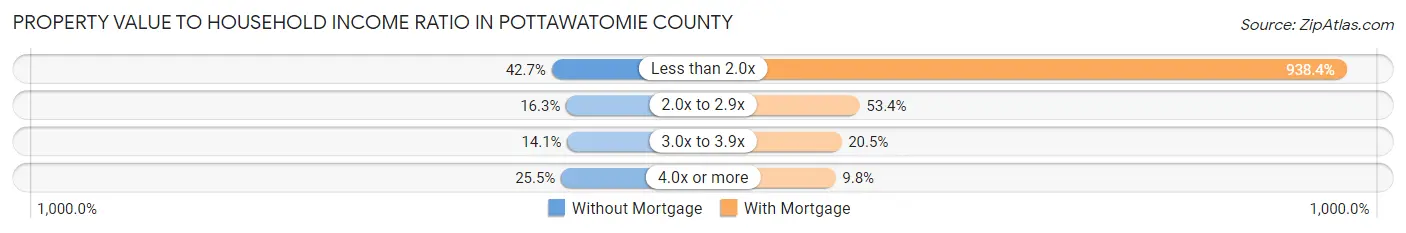
| Value-to-Income Ratio | Without Mortgage | With Mortgage |
| Less than 2.0x | 3,975 (42.7%) | 86,120 (938.4%) |
| 2.0x to 2.9x | 1,516 (16.3%) | 4,903 (53.4%) |
| 3.0x to 3.9x | 1,315 (14.1%) | 1,881 (20.5%) |
| 4.0x or more | 2,368 (25.5%) | 901 (9.8%) |
| Total | 9,305 (100.0%) | 9,177 (100.0%) |
Real Estate Taxes by Mortgage Status in Pottawatomie County
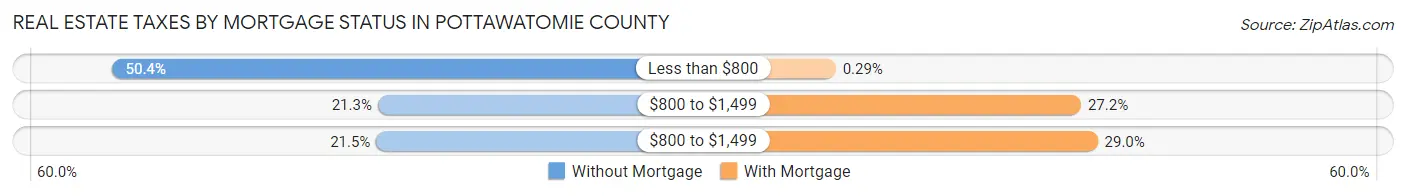
| Property Taxes | Without Mortgage | With Mortgage |
| Less than $800 | 4,685 (50.3%) | 27 (0.3%) |
| $800 to $1,499 | 1,982 (21.3%) | 2,493 (27.2%) |
| $800 to $1,499 | 1,998 (21.5%) | 2,660 (29.0%) |
| Total | 9,305 (100.0%) | 9,177 (100.0%) |
Health & Disability in Pottawatomie County
Health Insurance Coverage by Age in Pottawatomie County
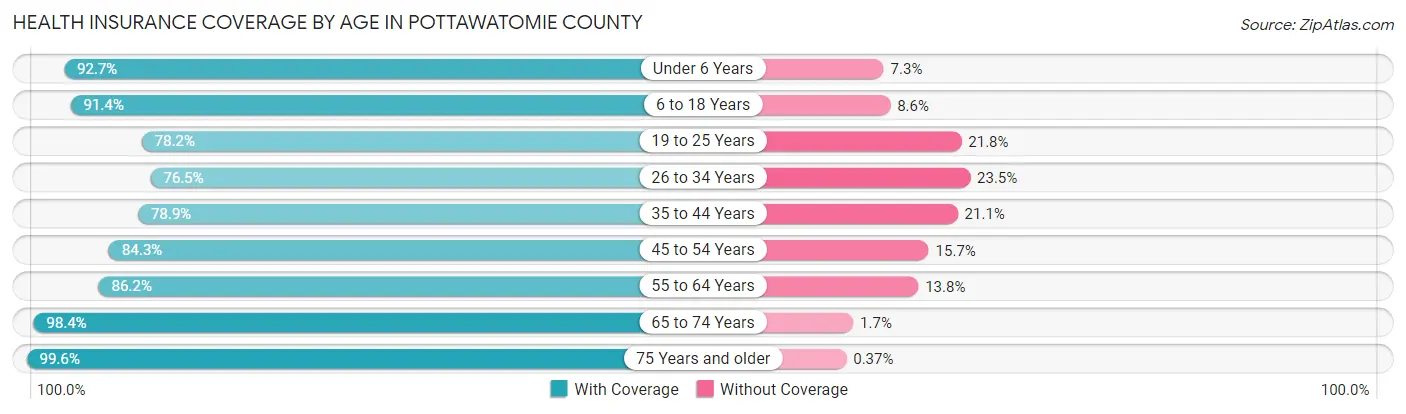
| Age Bracket | With Coverage | Without Coverage |
| Under 6 Years | 4,630 (92.7%) | 367 (7.3%) |
| 6 to 18 Years | 11,770 (91.4%) | 1,102 (8.6%) |
| 19 to 25 Years | 5,643 (78.2%) | 1,576 (21.8%) |
| 26 to 34 Years | 5,832 (76.5%) | 1,788 (23.5%) |
| 35 to 44 Years | 6,841 (78.9%) | 1,834 (21.1%) |
| 45 to 54 Years | 7,373 (84.3%) | 1,376 (15.7%) |
| 55 to 64 Years | 7,847 (86.2%) | 1,255 (13.8%) |
| 65 to 74 Years | 6,857 (98.4%) | 115 (1.7%) |
| 75 Years and older | 4,519 (99.6%) | 17 (0.4%) |
| Total | 61,312 (86.7%) | 9,430 (13.3%) |
Health Insurance Coverage by Citizenship Status in Pottawatomie County
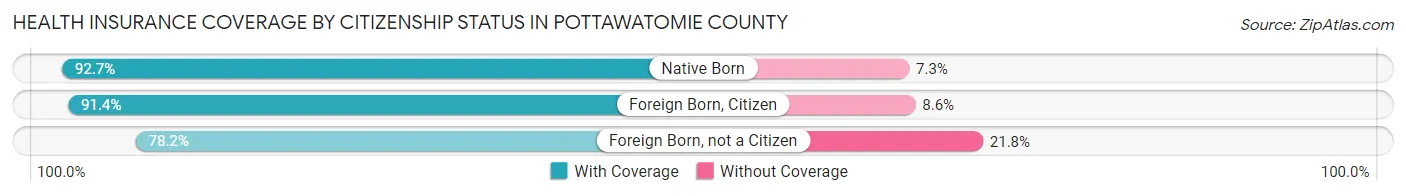
| Citizenship Status | With Coverage | Without Coverage |
| Native Born | 4,630 (92.7%) | 367 (7.3%) |
| Foreign Born, Citizen | 11,770 (91.4%) | 1,102 (8.6%) |
| Foreign Born, not a Citizen | 5,643 (78.2%) | 1,576 (21.8%) |
Health Insurance Coverage by Household Income in Pottawatomie County
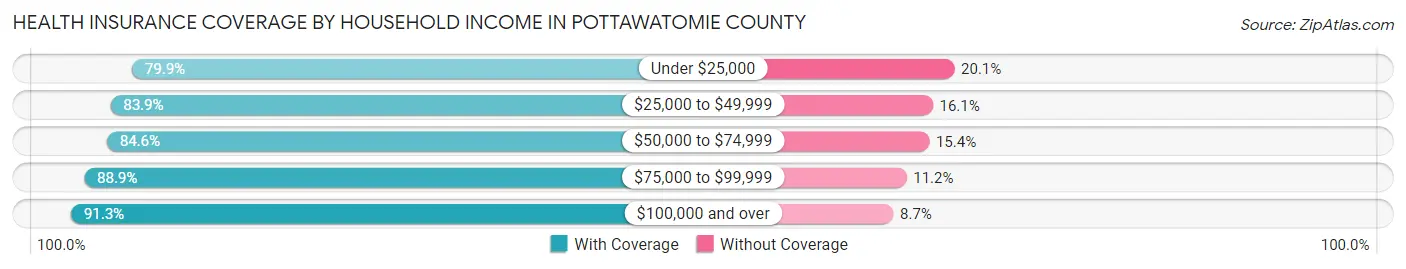
| Household Income | With Coverage | Without Coverage |
| Under $25,000 | 8,420 (79.9%) | 2,119 (20.1%) |
| $25,000 to $49,999 | 11,074 (83.9%) | 2,118 (16.1%) |
| $50,000 to $74,999 | 11,313 (84.6%) | 2,060 (15.4%) |
| $75,000 to $99,999 | 9,001 (88.8%) | 1,130 (11.2%) |
| $100,000 and over | 20,114 (91.3%) | 1,911 (8.7%) |
Public vs Private Health Insurance Coverage by Age in Pottawatomie County
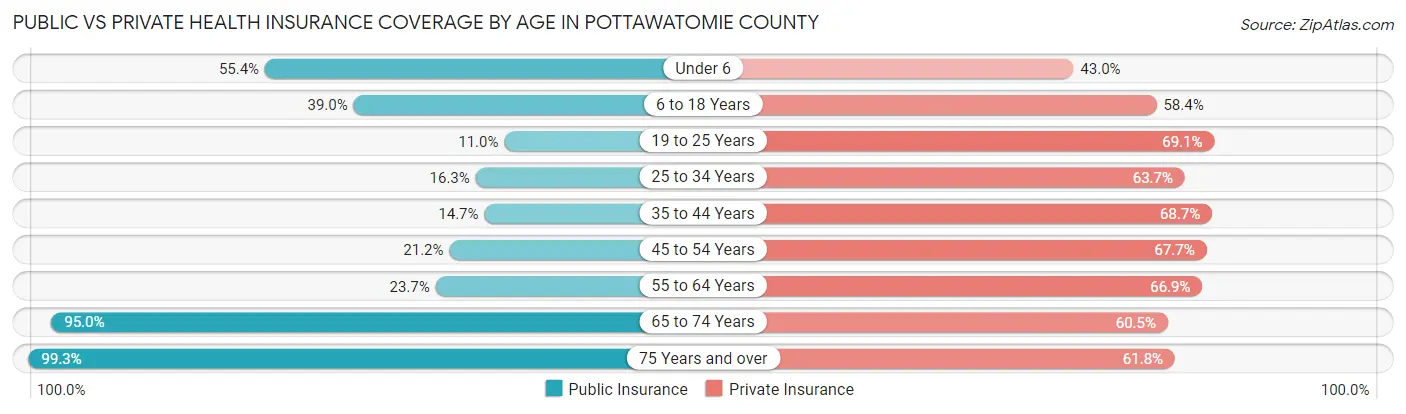
| Age Bracket | Public Insurance | Private Insurance |
| Under 6 | 2,768 (55.4%) | 2,148 (43.0%) |
| 6 to 18 Years | 5,014 (39.0%) | 7,518 (58.4%) |
| 19 to 25 Years | 791 (11.0%) | 4,991 (69.1%) |
| 25 to 34 Years | 1,241 (16.3%) | 4,851 (63.7%) |
| 35 to 44 Years | 1,272 (14.7%) | 5,963 (68.7%) |
| 45 to 54 Years | 1,851 (21.2%) | 5,923 (67.7%) |
| 55 to 64 Years | 2,159 (23.7%) | 6,091 (66.9%) |
| 65 to 74 Years | 6,626 (95.0%) | 4,218 (60.5%) |
| 75 Years and over | 4,504 (99.3%) | 2,804 (61.8%) |
| Total | 26,226 (37.1%) | 44,507 (62.9%) |
Disability Status by Sex by Age in Pottawatomie County
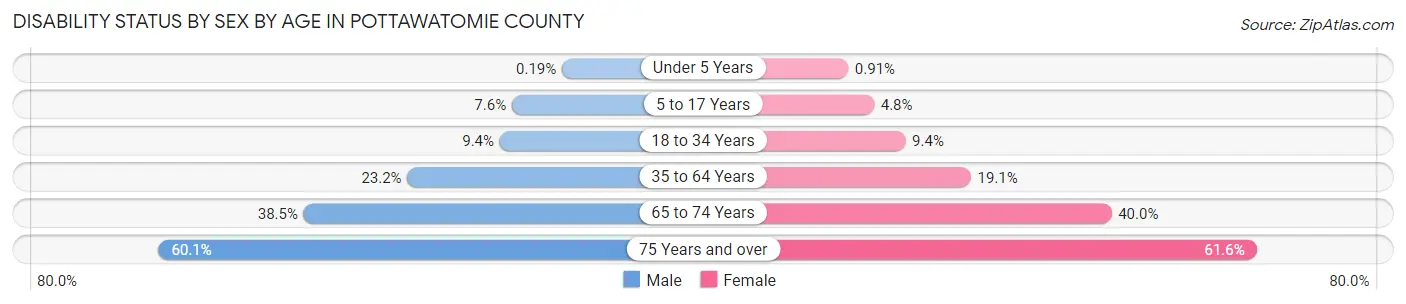
| Age Bracket | Male | Female |
| Under 5 Years | 4 (0.2%) | 19 (0.9%) |
| 5 to 17 Years | 487 (7.6%) | 295 (4.8%) |
| 18 to 34 Years | 745 (9.4%) | 751 (9.4%) |
| 35 to 64 Years | 2,995 (23.2%) | 2,598 (19.1%) |
| 65 to 74 Years | 1,273 (38.5%) | 1,468 (40.0%) |
| 75 Years and over | 1,123 (60.1%) | 1,643 (61.6%) |
Disability Class by Sex by Age in Pottawatomie County
Disability Class: Hearing Difficulty
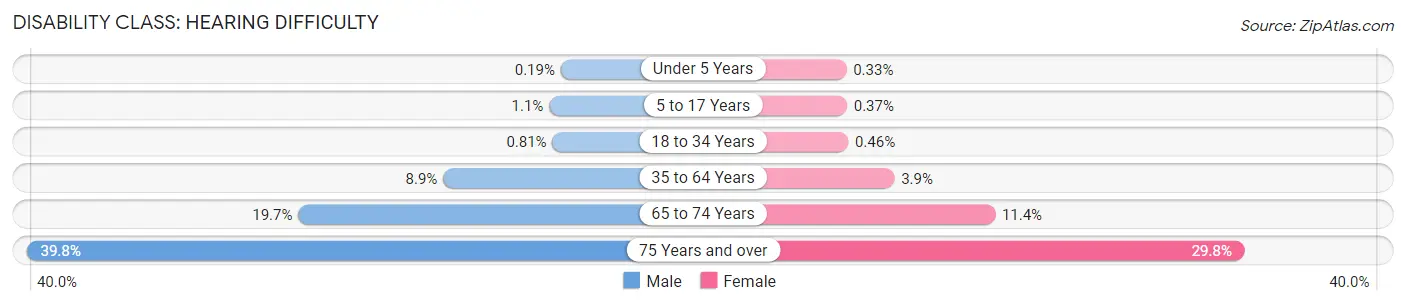
| Age Bracket | Male | Female |
| Under 5 Years | 4 (0.2%) | 7 (0.3%) |
| 5 to 17 Years | 67 (1.1%) | 23 (0.4%) |
| 18 to 34 Years | 64 (0.8%) | 37 (0.5%) |
| 35 to 64 Years | 1,154 (8.9%) | 528 (3.9%) |
| 65 to 74 Years | 650 (19.7%) | 417 (11.4%) |
| 75 Years and over | 743 (39.8%) | 796 (29.8%) |
Disability Class: Vision Difficulty
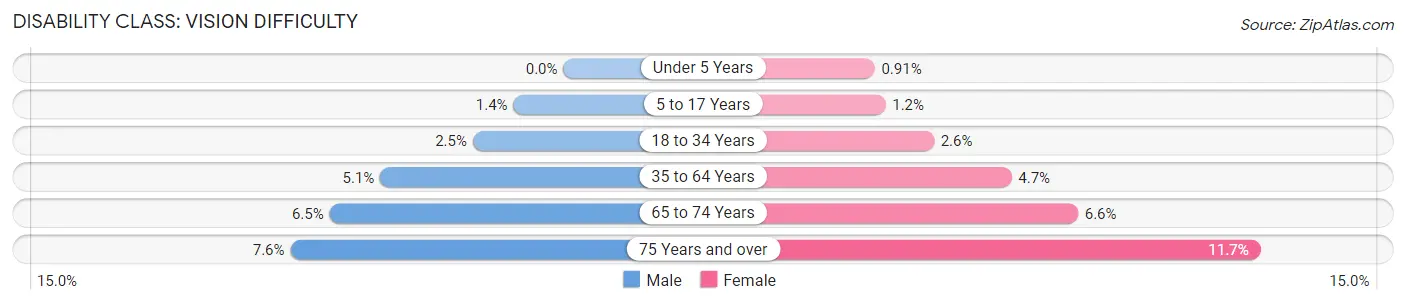
| Age Bracket | Male | Female |
| Under 5 Years | 0 (0.0%) | 19 (0.9%) |
| 5 to 17 Years | 89 (1.4%) | 75 (1.2%) |
| 18 to 34 Years | 199 (2.5%) | 204 (2.6%) |
| 35 to 64 Years | 660 (5.1%) | 642 (4.7%) |
| 65 to 74 Years | 215 (6.5%) | 241 (6.6%) |
| 75 Years and over | 142 (7.6%) | 311 (11.7%) |
Disability Class: Cognitive Difficulty
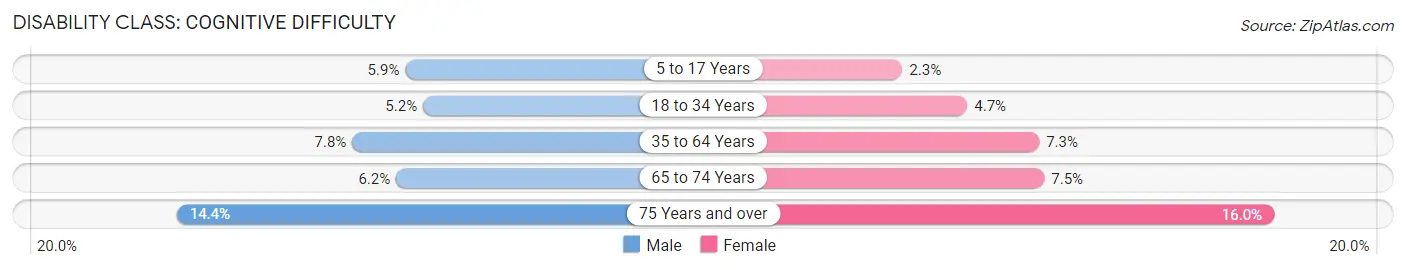
| Age Bracket | Male | Female |
| 5 to 17 Years | 375 (5.9%) | 140 (2.2%) |
| 18 to 34 Years | 412 (5.2%) | 372 (4.7%) |
| 35 to 64 Years | 1,014 (7.8%) | 996 (7.3%) |
| 65 to 74 Years | 205 (6.2%) | 276 (7.5%) |
| 75 Years and over | 268 (14.3%) | 428 (16.0%) |
Disability Class: Ambulatory Difficulty
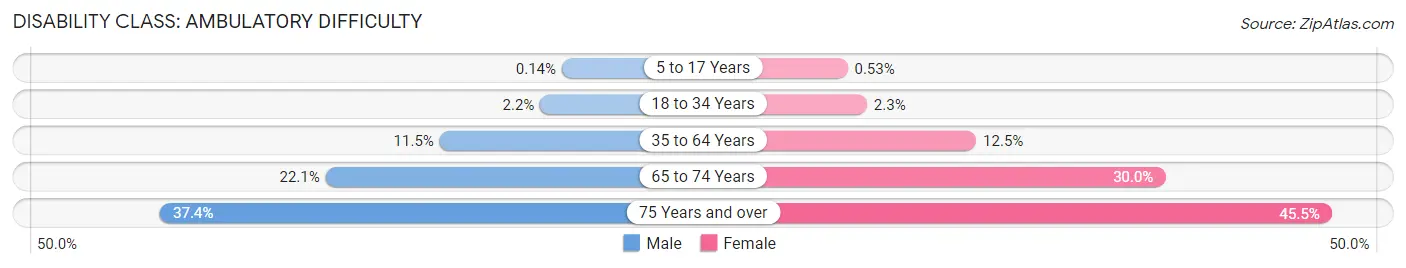
| Age Bracket | Male | Female |
| 5 to 17 Years | 9 (0.1%) | 33 (0.5%) |
| 18 to 34 Years | 170 (2.1%) | 186 (2.3%) |
| 35 to 64 Years | 1,485 (11.5%) | 1,695 (12.5%) |
| 65 to 74 Years | 729 (22.1%) | 1,101 (30.0%) |
| 75 Years and over | 699 (37.4%) | 1,213 (45.5%) |
Disability Class: Self-Care Difficulty
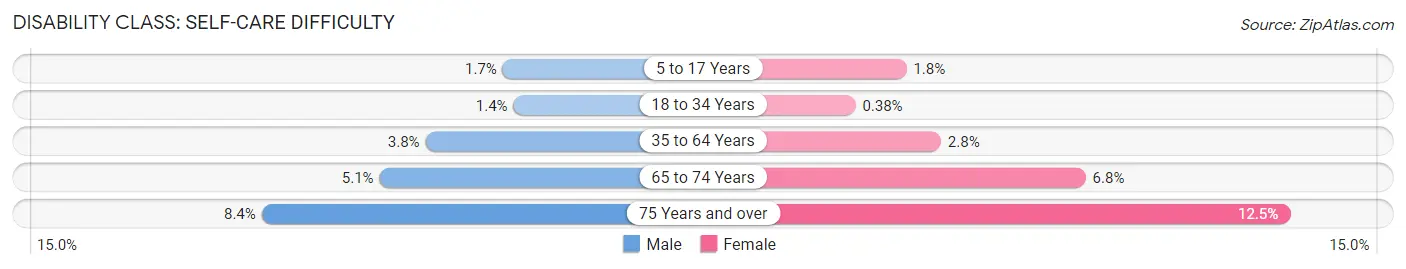
| Age Bracket | Male | Female |
| 5 to 17 Years | 108 (1.7%) | 112 (1.8%) |
| 18 to 34 Years | 110 (1.4%) | 30 (0.4%) |
| 35 to 64 Years | 497 (3.8%) | 375 (2.8%) |
| 65 to 74 Years | 169 (5.1%) | 249 (6.8%) |
| 75 Years and over | 157 (8.4%) | 333 (12.5%) |
Technology Access in Pottawatomie County
Computing Device Access in Pottawatomie County
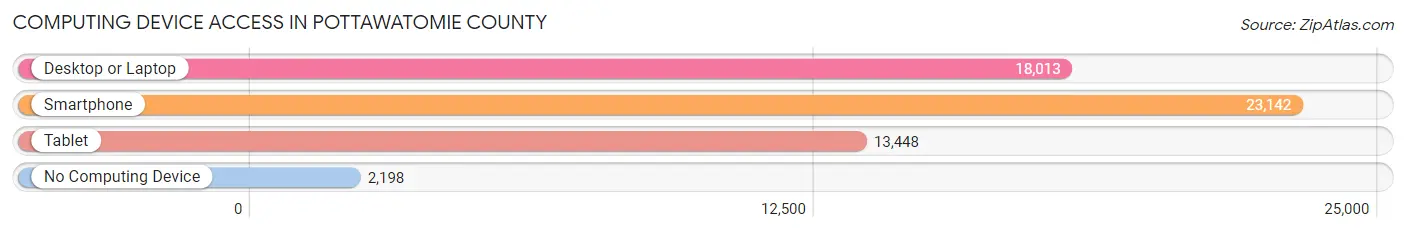
| Device Type | # Households | % Households |
| Desktop or Laptop | 18,013 | 68.2% |
| Smartphone | 23,142 | 87.6% |
| Tablet | 13,448 | 50.9% |
| No Computing Device | 2,198 | 8.3% |
| Total | 26,422 | 100.0% |
Internet Access in Pottawatomie County
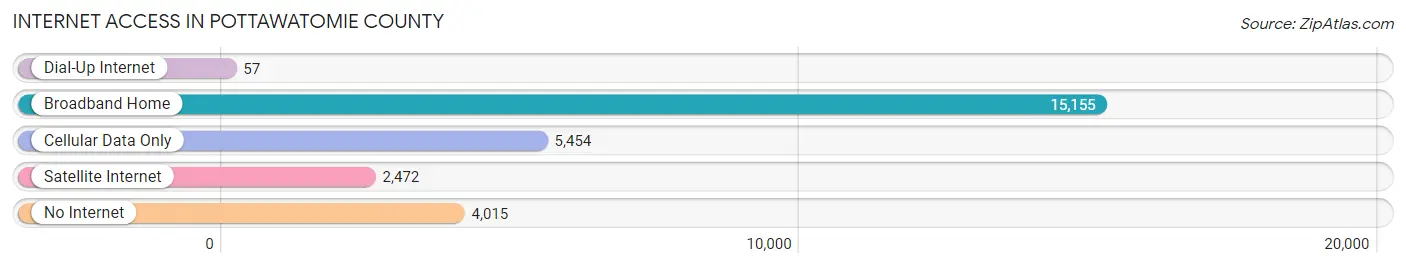
| Internet Type | # Households | % Households |
| Dial-Up Internet | 57 | 0.2% |
| Broadband Home | 15,155 | 57.4% |
| Cellular Data Only | 5,454 | 20.6% |
| Satellite Internet | 2,472 | 9.4% |
| No Internet | 4,015 | 15.2% |
| Total | 26,422 | 100.0% |
Pottawatomie County Summary
Pottawatomie County is located in the central part of Oklahoma, and is part of the Oklahoma City Metropolitan Statistical Area. The county is bordered by Lincoln, Seminole, Cleveland, and McClain counties. The county seat is located in Shawnee, and the county has a total area of 745 square miles. As of the 2010 census, the population was 69,442, making it the fourth most populous county in Oklahoma.
Geography
Pottawatomie County is located in the central part of Oklahoma, and is part of the Oklahoma City Metropolitan Statistical Area. The county is bordered by Lincoln, Seminole, Cleveland, and McClain counties. The county seat is located in Shawnee, and the county has a total area of 745 square miles. The county is mostly flat, with some rolling hills in the northern and western parts. The county is drained by the North Canadian River and its tributaries, including the Deep Fork, Little River, and the Canadian River. The county is home to several lakes, including Lake Thunderbird, Lake Stanley Draper, and Lake Carl Blackwell.
History
Pottawatomie County was established in 1891, and was named after the Pottawatomie Native American tribe. The county was originally part of the Unassigned Lands, which were opened to settlement in 1889. The county was initially populated by settlers from the eastern United States, as well as immigrants from Europe. The county was initially an agricultural area, with cotton, corn, and wheat being the main crops. The county was also home to several oil and gas fields, which were developed in the early 20th century.
Economy
Pottawatomie County has a diverse economy, with a mix of agriculture, manufacturing, and services. The county is home to several large employers, including Tinker Air Force Base, the University of Oklahoma, and the Shawnee Regional Airport. The county is also home to several manufacturing companies, including the Shawnee Milling Company, the Shawnee Manufacturing Company, and the Shawnee Steel Company. The county is also home to several oil and gas fields, which are a major source of employment and revenue.
Demographics
As of the 2010 census, the population of Pottawatomie County was 69,442, making it the fourth most populous county in Oklahoma. The population is spread out, with the largest cities being Shawnee (29,857), Tecumseh (4,051), and McLoud (3,233). The population is predominantly white (83.3%), with smaller percentages of African American (7.7%), Native American (3.2%), Asian (1.3%), and Hispanic or Latino (2.7%). The median household income is $45,845, and the median home value is $117,400. The county has a poverty rate of 13.3%, and a high school graduation rate of 87.3%.
Common Questions
What is the Total Population of Pottawatomie County?
Total Population of Pottawatomie County is 72,734.
What is the Total Male Population of Pottawatomie County?
Total Male Population of Pottawatomie County is 34,941.
What is the Total Female Population of Pottawatomie County?
Total Female Population of Pottawatomie County is 37,793.
What is the Ratio of Males per 100 Females in Pottawatomie County?
There are 92.45 Males per 100 Females in Pottawatomie County.
What is the Ratio of Females per 100 Males in Pottawatomie County?
There are 108.16 Females per 100 Males in Pottawatomie County.
What is the Median Population Age in Pottawatomie County?
Median Population Age in Pottawatomie County is 37.7 Years.
What is the Average Family Size in Pottawatomie County
Average Family Size in Pottawatomie County is 3.2 People.
What is the Average Household Size in Pottawatomie County
Average Household Size in Pottawatomie County is 2.6 People.
What is Per Capita Income in Pottawatomie County?
Per Capita income in Pottawatomie County is $28,106.
What is the Median Family Income in Pottawatomie County?
Median Family Income in Pottawatomie County is $72,149.
What is the Median Household income in Pottawatomie County?
Median Household Income in Pottawatomie County is $58,270.
What is Income or Wage Gap in Pottawatomie County?
Income or Wage Gap in Pottawatomie County is 35.1%.
Women in Pottawatomie County earn 64.9 cents for every dollar earned by a man.
What is Family Income Deficit in Pottawatomie County?
Family Income Deficit in Pottawatomie County is $11,467.
Families that are below poverty line in Pottawatomie County earn $11,467 less on average than the poverty threshold level.
What is Inequality or Gini Index in Pottawatomie County?
Inequality or Gini Index in Pottawatomie County is 0.45.
How Large is the Labor Force in Pottawatomie County?
There are 31,610 People in the Labor Forcein in Pottawatomie County.
What is the Percentage of People in the Labor Force in Pottawatomie County?
54.5% of People are in the Labor Force in Pottawatomie County.
What is the Unemployment Rate in Pottawatomie County?
Unemployment Rate in Pottawatomie County is 5.8%.