Pontotoc County, OK
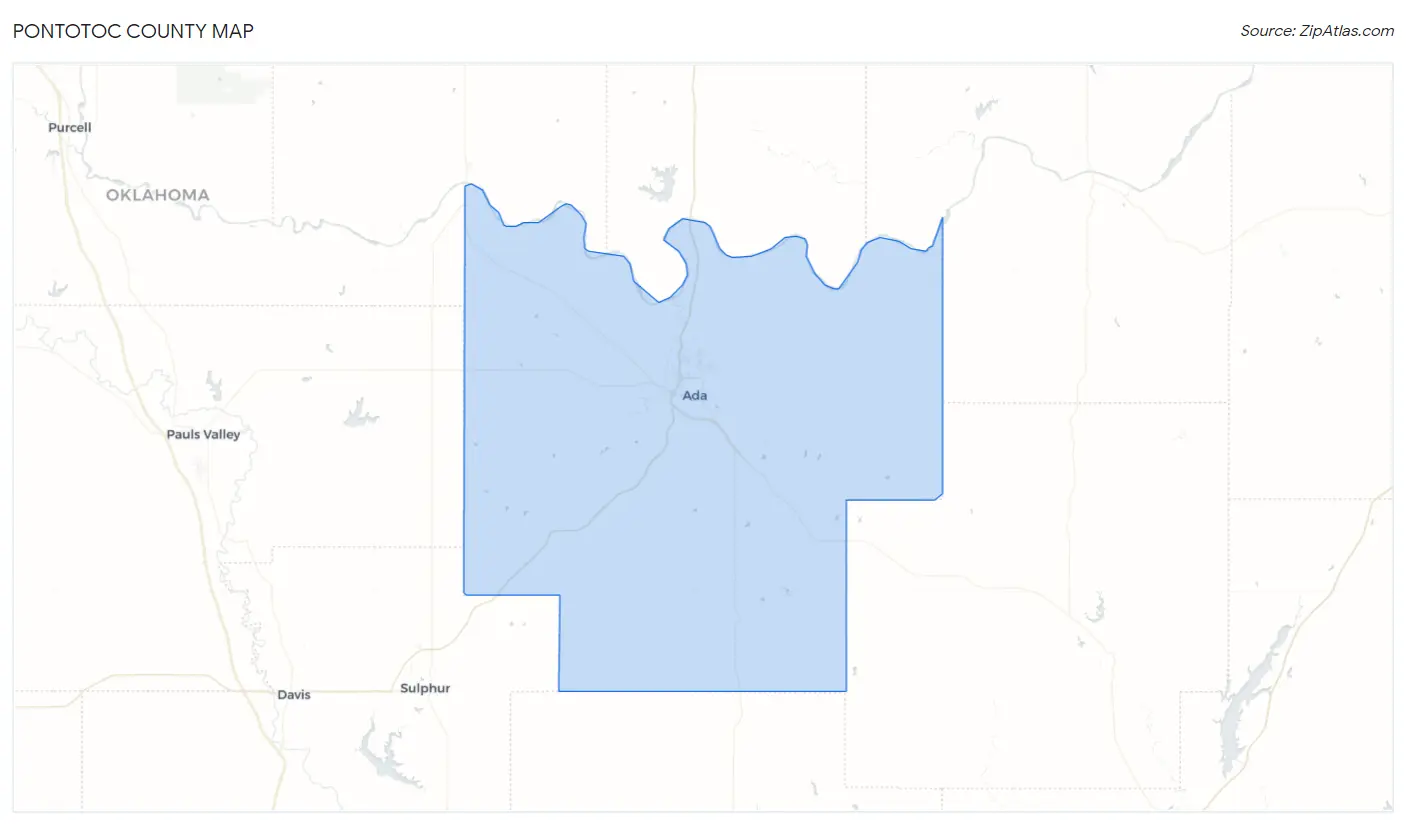
Pontotoc County Map
Pontotoc County Overview
38,116
TOTAL POPULATION
18,629
MALE POPULATION
19,487
FEMALE POPULATION
95.60
MALES / 100 FEMALES
104.61
FEMALES / 100 MALES
37.3
MEDIAN AGE
3.1
AVG FAMILY SIZE
2.5
AVG HOUSEHOLD SIZE
$30,774
PER CAPITA INCOME
$74,673
AVG FAMILY INCOME
$59,457
AVG HOUSEHOLD INCOME
22.2%
WAGE / INCOME GAP [ % ]
77.8¢/ $1
WAGE / INCOME GAP [ $ ]
$9,089
FAMILY INCOME DEFICIT
0.44
INEQUALITY / GINI INDEX
17,899
LABOR FORCE [ PEOPLE ]
60.0%
PERCENT IN LABOR FORCE
4.3%
UNEMPLOYMENT RATE
Pontotoc County Area Codes
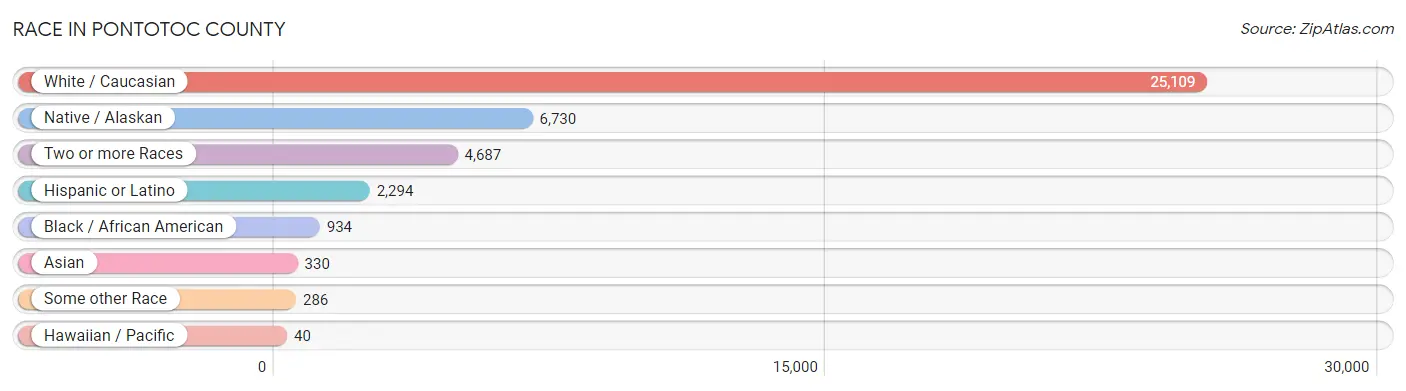
Race in Pontotoc County
The most populous races in Pontotoc County are White / Caucasian (25,109 | 65.9%), Native / Alaskan (6,730 | 17.7%), and Two or more Races (4,687 | 12.3%).
| Race | # Population | % Population |
| Asian | 330 | 0.9% |
| Black / African American | 934 | 2.5% |
| Hawaiian / Pacific | 40 | 0.1% |
| Hispanic or Latino | 2,294 | 6.0% |
| Native / Alaskan | 6,730 | 17.7% |
| White / Caucasian | 25,109 | 65.9% |
| Two or more Races | 4,687 | 12.3% |
| Some other Race | 286 | 0.7% |
| Total | 38,116 | 100.0% |
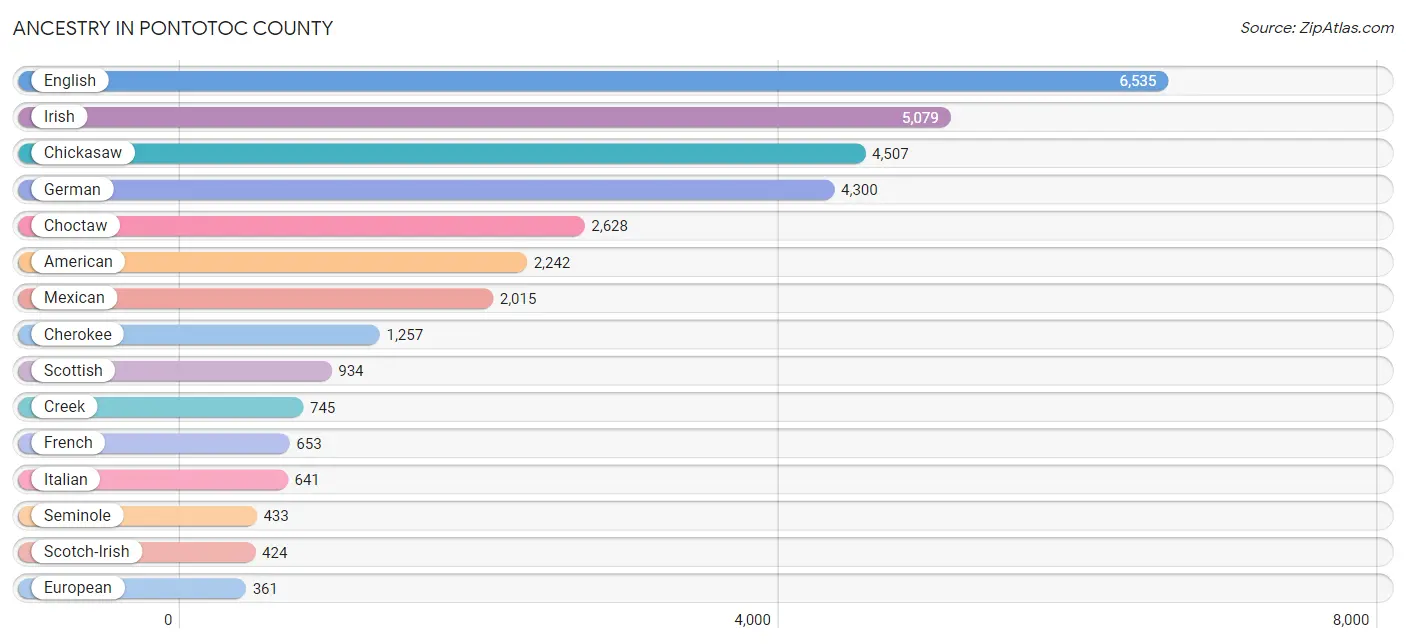
Ancestry in Pontotoc County
The most populous ancestries reported in Pontotoc County are English (6,535 | 17.2%), Irish (5,079 | 13.3%), Chickasaw (4,507 | 11.8%), German (4,300 | 11.3%), and Choctaw (2,628 | 6.9%), together accounting for 60.5% of all Pontotoc County residents.
| Ancestry | # Population | % Population |
| African | 139 | 0.4% |
| Alaska Native | 10 | 0.0% |
| American | 2,242 | 5.9% |
| Apache | 15 | 0.0% |
| Arab | 54 | 0.1% |
| Australian | 11 | 0.0% |
| Austrian | 124 | 0.3% |
| Basque | 14 | 0.0% |
| Blackfeet | 4 | 0.0% |
| British | 156 | 0.4% |
| British West Indian | 10 | 0.0% |
| Burmese | 22 | 0.1% |
| Canadian | 47 | 0.1% |
| Central American | 1 | 0.0% |
| Central American Indian | 17 | 0.0% |
| Cherokee | 1,257 | 3.3% |
| Cheyenne | 100 | 0.3% |
| Chickasaw | 4,507 | 11.8% |
| Chilean | 9 | 0.0% |
| Chippewa | 2 | 0.0% |
| Choctaw | 2,628 | 6.9% |
| Comanche | 27 | 0.1% |
| Costa Rican | 1 | 0.0% |
| Creek | 745 | 1.9% |
| Czech | 39 | 0.1% |
| Czechoslovakian | 21 | 0.1% |
| Danish | 73 | 0.2% |
| Delaware | 43 | 0.1% |
| Dutch | 298 | 0.8% |
| Dutch West Indian | 79 | 0.2% |
| Eastern European | 11 | 0.0% |
| Ecuadorian | 55 | 0.1% |
| Egyptian | 43 | 0.1% |
| English | 6,535 | 17.2% |
| European | 361 | 0.9% |
| Finnish | 4 | 0.0% |
| French | 653 | 1.7% |
| French Canadian | 24 | 0.1% |
| German | 4,300 | 11.3% |
| Greek | 34 | 0.1% |
| Hungarian | 10 | 0.0% |
| Indian (Asian) | 81 | 0.2% |
| Indonesian | 5 | 0.0% |
| Inupiat | 1 | 0.0% |
| Irish | 5,079 | 13.3% |
| Iroquois | 16 | 0.0% |
| Italian | 641 | 1.7% |
| Kenyan | 4 | 0.0% |
| Kiowa | 76 | 0.2% |
| Korean | 176 | 0.5% |
| Lebanese | 7 | 0.0% |
| Lithuanian | 34 | 0.1% |
| Malaysian | 44 | 0.1% |
| Mexican | 2,015 | 5.3% |
| Mexican American Indian | 19 | 0.1% |
| Native Hawaiian | 63 | 0.2% |
| Nigerian | 6 | 0.0% |
| Norwegian | 283 | 0.7% |
| Osage | 5 | 0.0% |
| Ottawa | 10 | 0.0% |
| Pakistani | 18 | 0.1% |
| Pennsylvania German | 8 | 0.0% |
| Polish | 110 | 0.3% |
| Portuguese | 64 | 0.2% |
| Potawatomi | 77 | 0.2% |
| Pueblo | 13 | 0.0% |
| Romanian | 15 | 0.0% |
| Russian | 16 | 0.0% |
| Scandinavian | 177 | 0.5% |
| Scotch-Irish | 424 | 1.1% |
| Scottish | 934 | 2.5% |
| Seminole | 433 | 1.1% |
| Shoshone | 34 | 0.1% |
| Sioux | 16 | 0.0% |
| Slavic | 9 | 0.0% |
| South American | 64 | 0.2% |
| Spaniard | 56 | 0.2% |
| Spanish | 45 | 0.1% |
| Sri Lankan | 76 | 0.2% |
| Subsaharan African | 143 | 0.4% |
| Swedish | 121 | 0.3% |
| Swiss | 61 | 0.2% |
| Thai | 31 | 0.1% |
| Turkish | 77 | 0.2% |
| Ukrainian | 4 | 0.0% |
| Welsh | 283 | 0.7% | View All 86 Rows |
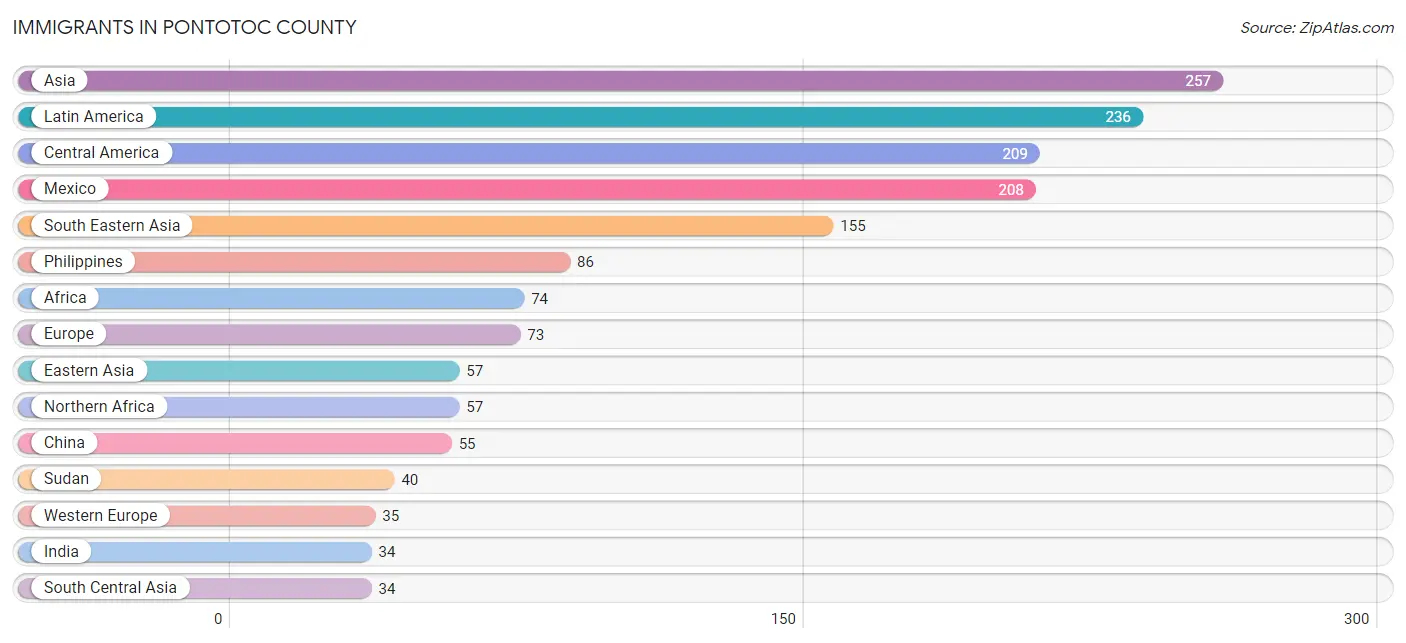
Immigrants in Pontotoc County
The most numerous immigrant groups reported in Pontotoc County came from Asia (257 | 0.7%), Latin America (236 | 0.6%), Central America (209 | 0.5%), Mexico (208 | 0.5%), and South Eastern Asia (155 | 0.4%), together accounting for 2.8% of all Pontotoc County residents.
| Immigration Origin | # Population | % Population |
| Africa | 74 | 0.2% |
| Asia | 257 | 0.7% |
| Australia | 15 | 0.0% |
| Austria | 4 | 0.0% |
| Belarus | 13 | 0.0% |
| Canada | 26 | 0.1% |
| Caribbean | 10 | 0.0% |
| Central America | 209 | 0.5% |
| Chile | 9 | 0.0% |
| China | 55 | 0.1% |
| Costa Rica | 1 | 0.0% |
| Eastern Africa | 17 | 0.0% |
| Eastern Asia | 57 | 0.2% |
| Eastern Europe | 23 | 0.1% |
| Ecuador | 8 | 0.0% |
| Egypt | 17 | 0.0% |
| Europe | 73 | 0.2% |
| Germany | 31 | 0.1% |
| India | 34 | 0.1% |
| Kenya | 17 | 0.0% |
| Korea | 2 | 0.0% |
| Laos | 29 | 0.1% |
| Latin America | 236 | 0.6% |
| Mexico | 208 | 0.5% |
| Northern Africa | 57 | 0.2% |
| Northern Europe | 15 | 0.0% |
| Norway | 6 | 0.0% |
| Oceania | 15 | 0.0% |
| Philippines | 86 | 0.2% |
| Poland | 10 | 0.0% |
| South America | 17 | 0.0% |
| South Central Asia | 34 | 0.1% |
| South Eastern Asia | 155 | 0.4% |
| Sudan | 40 | 0.1% |
| Thailand | 7 | 0.0% |
| Turkey | 11 | 0.0% |
| Vietnam | 30 | 0.1% |
| Western Asia | 11 | 0.0% |
| Western Europe | 35 | 0.1% | View All 39 Rows |
Sex and Age in Pontotoc County
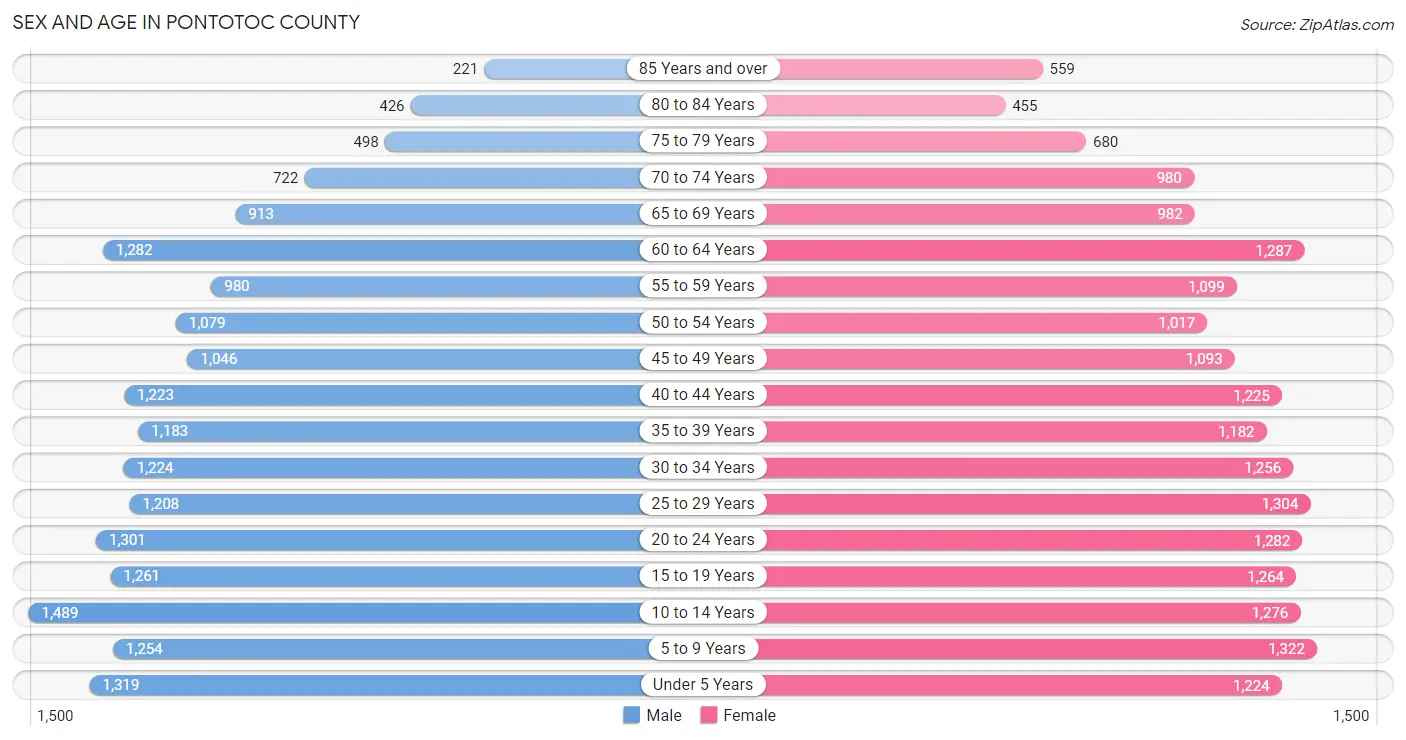
Sex and Age in Pontotoc County
The most populous age groups in Pontotoc County are 10 to 14 Years (1,489 | 8.0%) for men and 5 to 9 Years (1,322 | 6.8%) for women.
| Age Bracket | Male | Female |
| Under 5 Years | 1,319 (7.1%) | 1,224 (6.3%) |
| 5 to 9 Years | 1,254 (6.7%) | 1,322 (6.8%) |
| 10 to 14 Years | 1,489 (8.0%) | 1,276 (6.6%) |
| 15 to 19 Years | 1,261 (6.8%) | 1,264 (6.5%) |
| 20 to 24 Years | 1,301 (7.0%) | 1,282 (6.6%) |
| 25 to 29 Years | 1,208 (6.5%) | 1,304 (6.7%) |
| 30 to 34 Years | 1,224 (6.6%) | 1,256 (6.5%) |
| 35 to 39 Years | 1,183 (6.4%) | 1,182 (6.1%) |
| 40 to 44 Years | 1,223 (6.6%) | 1,225 (6.3%) |
| 45 to 49 Years | 1,046 (5.6%) | 1,093 (5.6%) |
| 50 to 54 Years | 1,079 (5.8%) | 1,017 (5.2%) |
| 55 to 59 Years | 980 (5.3%) | 1,099 (5.6%) |
| 60 to 64 Years | 1,282 (6.9%) | 1,287 (6.6%) |
| 65 to 69 Years | 913 (4.9%) | 982 (5.0%) |
| 70 to 74 Years | 722 (3.9%) | 980 (5.0%) |
| 75 to 79 Years | 498 (2.7%) | 680 (3.5%) |
| 80 to 84 Years | 426 (2.3%) | 455 (2.3%) |
| 85 Years and over | 221 (1.2%) | 559 (2.9%) |
| Total | 18,629 (100.0%) | 19,487 (100.0%) |
Families and Households in Pontotoc County
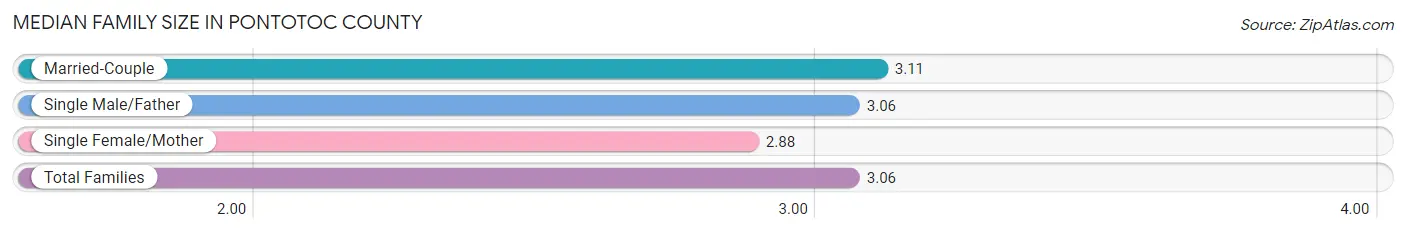
Median Family Size in Pontotoc County
The median family size in Pontotoc County is 3.06 persons per family, with married-couple families (6,975 | 71.1%) accounting for the largest median family size of 3.11 persons per family. On the other hand, single female/mother families (1,897 | 19.3%) represent the smallest median family size with 2.88 persons per family.
| Family Type | # Families | Family Size |
| Married-Couple | 6,975 (71.1%) | 3.11 |
| Single Male/Father | 939 (9.6%) | 3.06 |
| Single Female/Mother | 1,897 (19.3%) | 2.88 |
| Total Families | 9,811 (100.0%) | 3.06 |
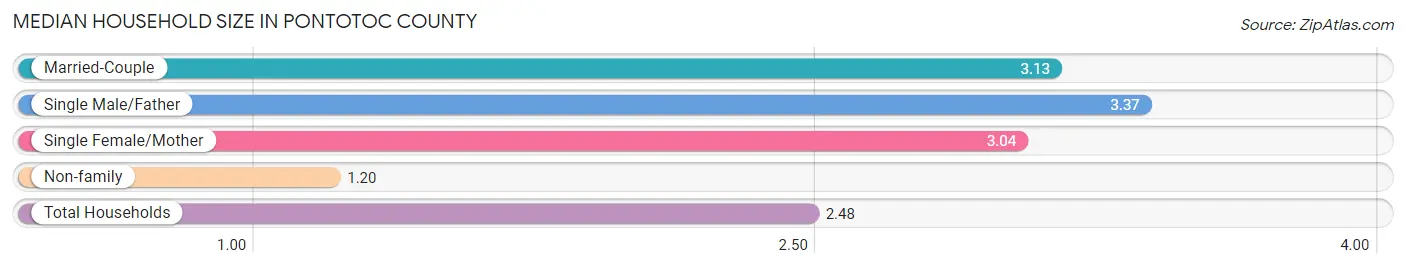
Median Household Size in Pontotoc County
The median household size in Pontotoc County is 2.48 persons per household, with single male/father households (939 | 6.3%) accounting for the largest median household size of 3.37 persons per household. non-family households (4,990 | 33.7%) represent the smallest median household size with 1.20 persons per household.
| Household Type | # Households | Household Size |
| Married-Couple | 6,975 (47.1%) | 3.13 |
| Single Male/Father | 939 (6.3%) | 3.37 |
| Single Female/Mother | 1,897 (12.8%) | 3.04 |
| Non-family | 4,990 (33.7%) | 1.20 |
| Total Households | 14,801 (100.0%) | 2.48 |
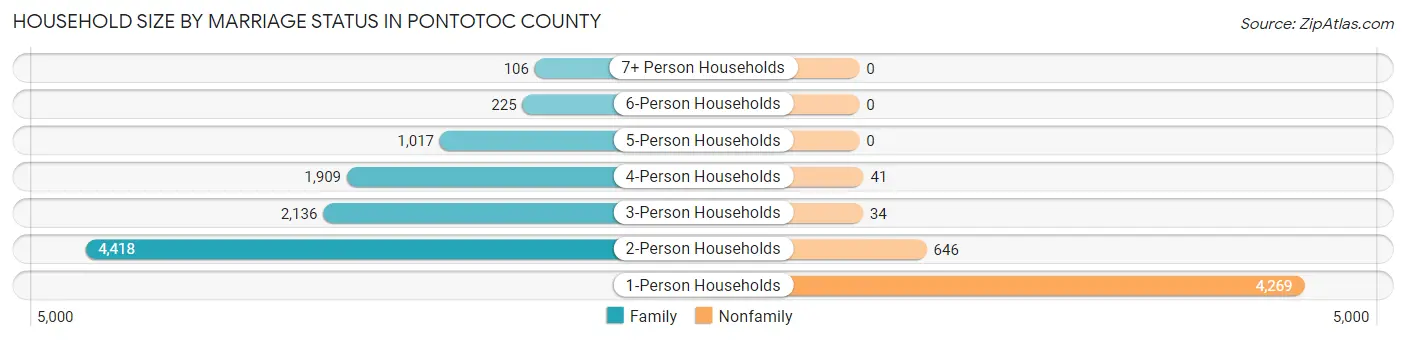
Household Size by Marriage Status in Pontotoc County
Out of a total of 14,801 households in Pontotoc County, 9,811 (66.3%) are family households, while 4,990 (33.7%) are nonfamily households. The most numerous type of family households are 2-person households, comprising 4,418, and the most common type of nonfamily households are 1-person households, comprising 4,269.
| Household Size | Family Households | Nonfamily Households |
| 1-Person Households | - | 4,269 (28.8%) |
| 2-Person Households | 4,418 (29.8%) | 646 (4.4%) |
| 3-Person Households | 2,136 (14.4%) | 34 (0.2%) |
| 4-Person Households | 1,909 (12.9%) | 41 (0.3%) |
| 5-Person Households | 1,017 (6.9%) | 0 (0.0%) |
| 6-Person Households | 225 (1.5%) | 0 (0.0%) |
| 7+ Person Households | 106 (0.7%) | 0 (0.0%) |
| Total | 9,811 (66.3%) | 4,990 (33.7%) |
Female Fertility in Pontotoc County
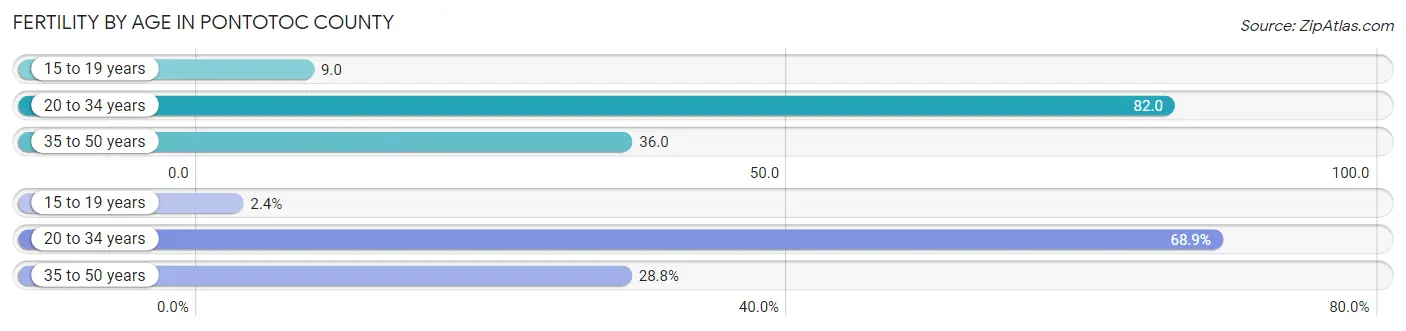
Fertility by Age in Pontotoc County
Average fertility rate in Pontotoc County is 52.0 births per 1,000 women. Women in the age bracket of 20 to 34 years have the highest fertility rate with 82.0 births per 1,000 women. Women in the age bracket of 20 to 34 years acount for 68.9% of all women with births.
| Age Bracket | Women with Births | Births / 1,000 Women |
| 15 to 19 years | 11 (2.4%) | 9.0 |
| 20 to 34 years | 316 (68.9%) | 82.0 |
| 35 to 50 years | 132 (28.8%) | 36.0 |
| Total | 459 (100.0%) | 52.0 |
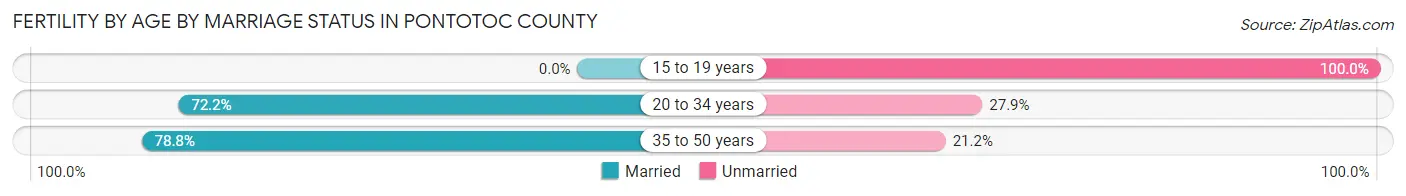
Fertility by Age by Marriage Status in Pontotoc County
72.3% of women with births (459) in Pontotoc County are married. The highest percentage of unmarried women with births falls into 15 to 19 years age bracket with 100.0% of them unmarried at the time of birth, while the lowest percentage of unmarried women with births belong to 35 to 50 years age bracket with 21.2% of them unmarried.
| Age Bracket | Married | Unmarried |
| 15 to 19 years | 0 (0.0%) | 11 (100.0%) |
| 20 to 34 years | 228 (72.2%) | 88 (27.9%) |
| 35 to 50 years | 104 (78.8%) | 28 (21.2%) |
| Total | 332 (72.3%) | 127 (27.7%) |
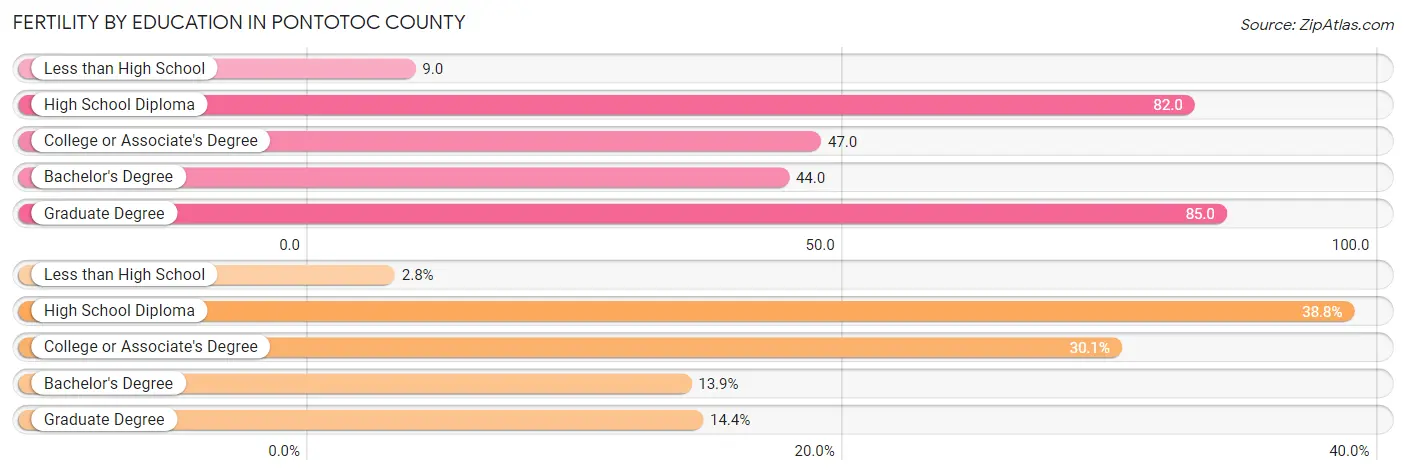
Fertility by Education in Pontotoc County
Average fertility rate in Pontotoc County is 52.0 births per 1,000 women. Women with the education attainment of graduate degree have the highest fertility rate of 85.0 births per 1,000 women, while women with the education attainment of less than high school have the lowest fertility at 9.0 births per 1,000 women. Women with the education attainment of high school diploma represent 38.8% of all women with births.
| Educational Attainment | Women with Births | Births / 1,000 Women |
| Less than High School | 13 (2.8%) | 9.0 |
| High School Diploma | 178 (38.8%) | 82.0 |
| College or Associate's Degree | 138 (30.1%) | 47.0 |
| Bachelor's Degree | 64 (13.9%) | 44.0 |
| Graduate Degree | 66 (14.4%) | 85.0 |
| Total | 459 (100.0%) | 52.0 |
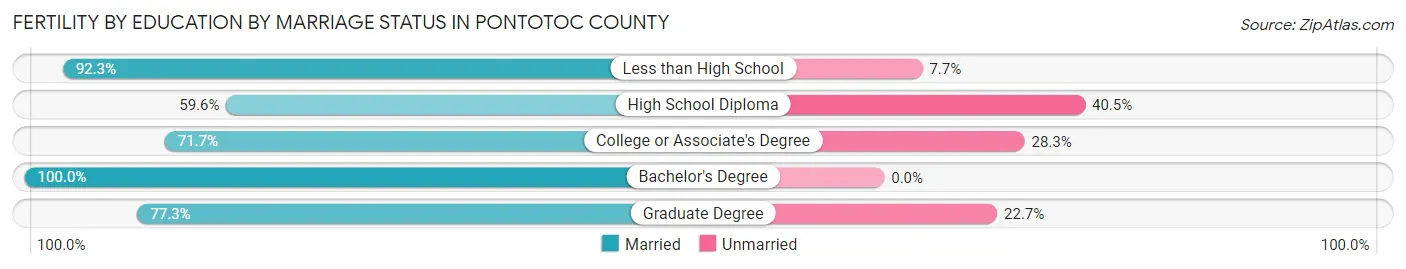
Fertility by Education by Marriage Status in Pontotoc County
27.7% of women with births in Pontotoc County are unmarried. Women with the educational attainment of bachelor's degree are most likely to be married with 100.0% of them married at childbirth, while women with the educational attainment of high school diploma are least likely to be married with 40.5% of them unmarried at childbirth.
| Educational Attainment | Married | Unmarried |
| Less than High School | 12 (92.3%) | 1 (7.7%) |
| High School Diploma | 106 (59.6%) | 72 (40.5%) |
| College or Associate's Degree | 99 (71.7%) | 39 (28.3%) |
| Bachelor's Degree | 64 (100.0%) | 0 (0.0%) |
| Graduate Degree | 51 (77.3%) | 15 (22.7%) |
| Total | 332 (72.3%) | 127 (27.7%) |
Income in Pontotoc County
Income Overview in Pontotoc County
Per Capita Income in Pontotoc County is $30,774, while median incomes of families and households are $74,673 and $59,457 respectively.
| Characteristic | Number | Measure |
| Per Capita Income | 38,116 | $30,774 |
| Median Family Income | 9,811 | $74,673 |
| Mean Family Income | 9,811 | $91,257 |
| Median Household Income | 14,801 | $59,457 |
| Mean Household Income | 14,801 | $76,961 |
| Income Deficit | 9,811 | $9,089 |
| Wage / Income Gap (%) | 38,116 | 22.22% |
| Wage / Income Gap ($) | 38,116 | 77.78¢ per $1 |
| Gini / Inequality Index | 38,116 | 0.44 |
Earnings by Sex in Pontotoc County
Average Earnings in Pontotoc County are $39,638, $44,347 for men and $34,495 for women, a difference of 22.2%.
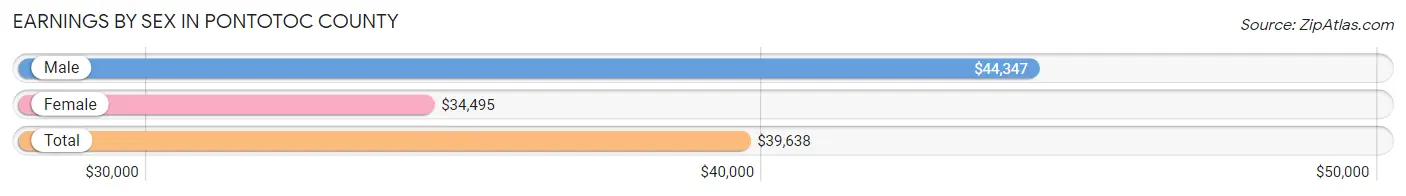
| Sex | Number | Average Earnings |
| Male | 9,812 (53.3%) | $44,347 |
| Female | 8,608 (46.7%) | $34,495 |
| Total | 18,420 (100.0%) | $39,638 |
Earnings by Sex by Income Bracket in Pontotoc County
The most common earnings brackets in Pontotoc County are $75,000 to $99,999 for men (1,452 | 14.8%) and $25,000 to $29,999 for women (884 | 10.3%).
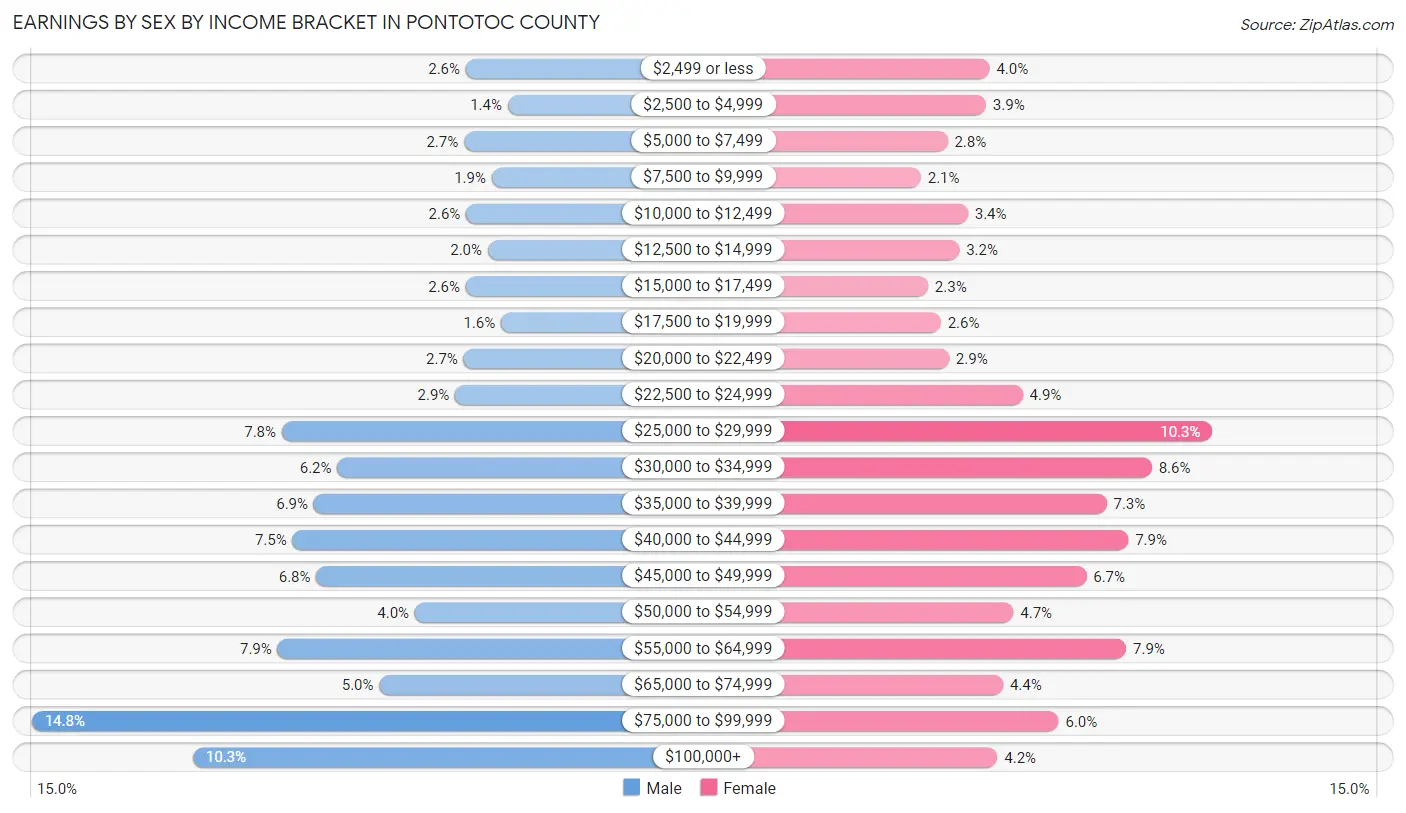
| Income | Male | Female |
| $2,499 or less | 255 (2.6%) | 345 (4.0%) |
| $2,500 to $4,999 | 139 (1.4%) | 337 (3.9%) |
| $5,000 to $7,499 | 260 (2.6%) | 244 (2.8%) |
| $7,500 to $9,999 | 183 (1.9%) | 179 (2.1%) |
| $10,000 to $12,499 | 254 (2.6%) | 293 (3.4%) |
| $12,500 to $14,999 | 194 (2.0%) | 272 (3.2%) |
| $15,000 to $17,499 | 255 (2.6%) | 196 (2.3%) |
| $17,500 to $19,999 | 158 (1.6%) | 227 (2.6%) |
| $20,000 to $22,499 | 261 (2.7%) | 247 (2.9%) |
| $22,500 to $24,999 | 285 (2.9%) | 425 (4.9%) |
| $25,000 to $29,999 | 762 (7.8%) | 884 (10.3%) |
| $30,000 to $34,999 | 609 (6.2%) | 738 (8.6%) |
| $35,000 to $39,999 | 674 (6.9%) | 628 (7.3%) |
| $40,000 to $44,999 | 733 (7.5%) | 681 (7.9%) |
| $45,000 to $49,999 | 667 (6.8%) | 579 (6.7%) |
| $50,000 to $54,999 | 395 (4.0%) | 403 (4.7%) |
| $55,000 to $64,999 | 774 (7.9%) | 676 (7.9%) |
| $65,000 to $74,999 | 494 (5.0%) | 378 (4.4%) |
| $75,000 to $99,999 | 1,452 (14.8%) | 512 (5.9%) |
| $100,000+ | 1,008 (10.3%) | 364 (4.2%) |
| Total | 9,812 (100.0%) | 8,608 (100.0%) |
Earnings by Sex by Educational Attainment in Pontotoc County
Average earnings in Pontotoc County are $47,806 for men and $37,876 for women, a difference of 20.8%. Men with an educational attainment of graduate degree enjoy the highest average annual earnings of $81,709, while those with high school diploma education earn the least with $38,807. Women with an educational attainment of graduate degree earn the most with the average annual earnings of $52,115, while those with less than high school education have the smallest earnings of $24,600.
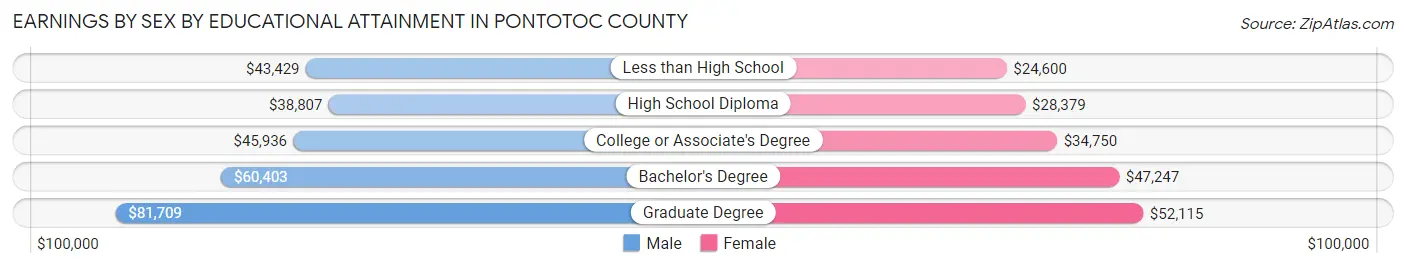
| Educational Attainment | Male Income | Female Income |
| Less than High School | $43,429 | $24,600 |
| High School Diploma | $38,807 | $28,379 |
| College or Associate's Degree | $45,936 | $34,750 |
| Bachelor's Degree | $60,403 | $47,247 |
| Graduate Degree | $81,709 | $52,115 |
| Total | $47,806 | $37,876 |
Family Income in Pontotoc County
Family Income Brackets in Pontotoc County
According to the Pontotoc County family income data, there are 1,962 families falling into the $100,000 to $149,999 income range, which is the most common income bracket and makes up 20.0% of all families. Conversely, the less than $10,000 income bracket is the least frequent group with only 265 families (2.7%) belonging to this category.
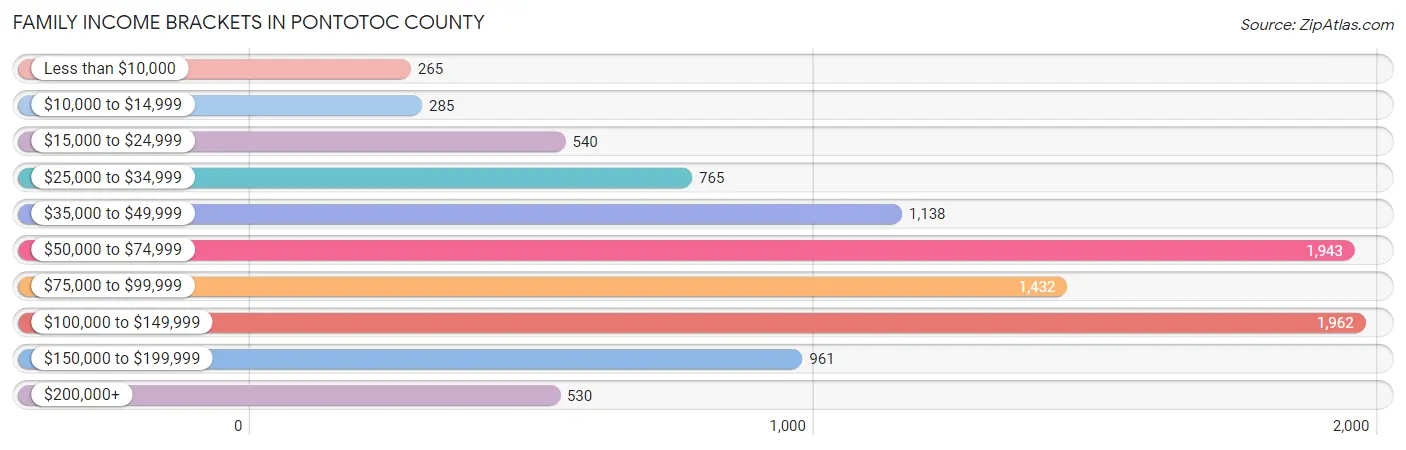
| Income Bracket | # Families | % Families |
| Less than $10,000 | 265 | 2.7% |
| $10,000 to $14,999 | 285 | 2.9% |
| $15,000 to $24,999 | 540 | 5.5% |
| $25,000 to $34,999 | 765 | 7.8% |
| $35,000 to $49,999 | 1,138 | 11.6% |
| $50,000 to $74,999 | 1,943 | 19.8% |
| $75,000 to $99,999 | 1,432 | 14.6% |
| $100,000 to $149,999 | 1,962 | 20.0% |
| $150,000 to $199,999 | 961 | 9.8% |
| $200,000+ | 530 | 5.4% |
Family Income by Famaliy Size in Pontotoc County
6-person families (207 | 2.1%) account for the highest median family income in Pontotoc County with $106,827 per family, while 2-person families (4,752 | 48.4%) have the highest median income of $32,442 per family member.
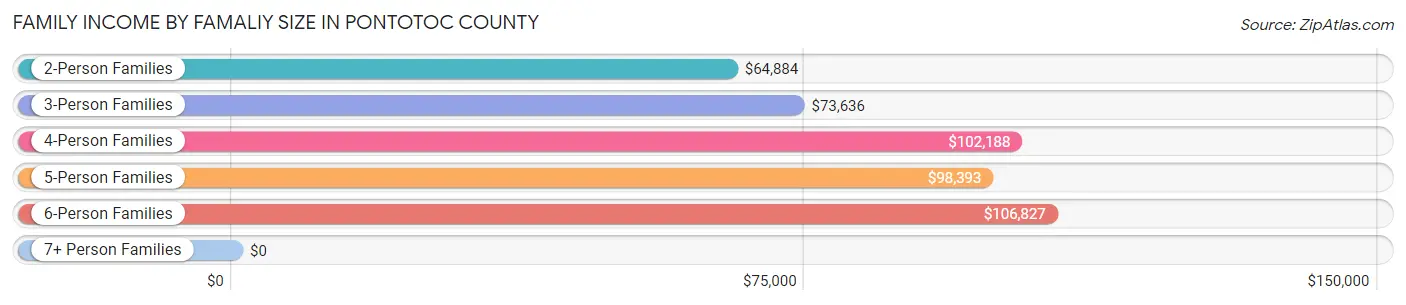
| Income Bracket | # Families | Median Income |
| 2-Person Families | 4,752 (48.4%) | $64,884 |
| 3-Person Families | 2,034 (20.7%) | $73,636 |
| 4-Person Families | 1,801 (18.4%) | $102,188 |
| 5-Person Families | 928 (9.5%) | $98,393 |
| 6-Person Families | 207 (2.1%) | $106,827 |
| 7+ Person Families | 89 (0.9%) | $0 |
| Total | 9,811 (100.0%) | $74,673 |
Family Income by Number of Earners in Pontotoc County
The median family income in Pontotoc County is $74,673, with families comprising 3+ earners (898) having the highest median family income of $136,875, while families with no earners (1,638) have the lowest median family income of $43,859, accounting for 9.1% and 16.7% of families, respectively.
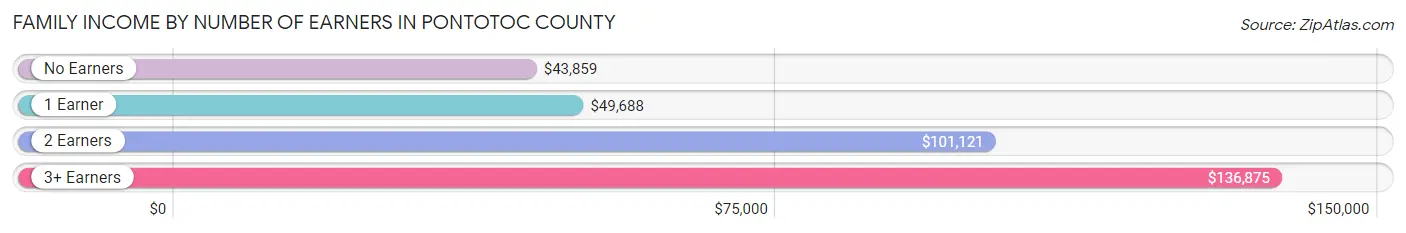
| Number of Earners | # Families | Median Income |
| No Earners | 1,638 (16.7%) | $43,859 |
| 1 Earner | 3,326 (33.9%) | $49,688 |
| 2 Earners | 3,949 (40.3%) | $101,121 |
| 3+ Earners | 898 (9.1%) | $136,875 |
| Total | 9,811 (100.0%) | $74,673 |
Household Income in Pontotoc County
Household Income Brackets in Pontotoc County
With 2,723 households falling in the category, the $50,000 to $74,999 income range is the most frequent in Pontotoc County, accounting for 18.4% of all households. In contrast, only 592 households (4.0%) fall into the $200,000+ income bracket, making it the least populous group.
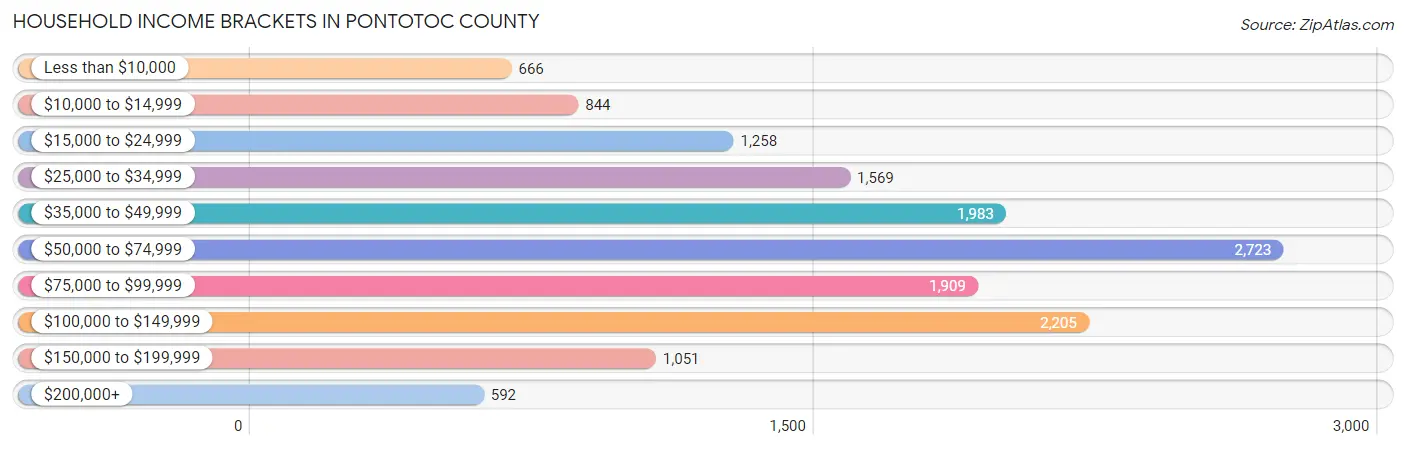
| Income Bracket | # Households | % Households |
| Less than $10,000 | 666 | 4.5% |
| $10,000 to $14,999 | 844 | 5.7% |
| $15,000 to $24,999 | 1,258 | 8.5% |
| $25,000 to $34,999 | 1,569 | 10.6% |
| $35,000 to $49,999 | 1,983 | 13.4% |
| $50,000 to $74,999 | 2,723 | 18.4% |
| $75,000 to $99,999 | 1,909 | 12.9% |
| $100,000 to $149,999 | 2,205 | 14.9% |
| $150,000 to $199,999 | 1,051 | 7.1% |
| $200,000+ | 592 | 4.0% |
Household Income by Householder Age in Pontotoc County
The median household income in Pontotoc County is $59,457, with the highest median household income of $73,218 found in the 45 to 64 years age bracket for the primary householder. A total of 5,017 households (33.9%) fall into this category. Meanwhile, the 15 to 24 years age bracket for the primary householder has the lowest median household income of $29,692, with 835 households (5.6%) in this group.
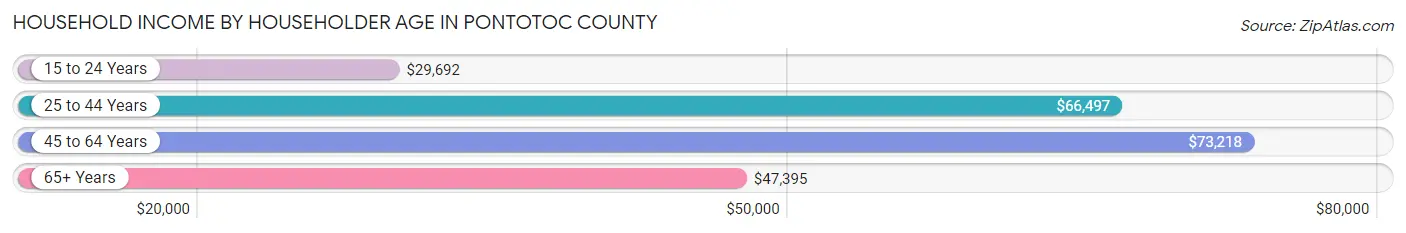
| Income Bracket | # Households | Median Income |
| 15 to 24 Years | 835 (5.6%) | $29,692 |
| 25 to 44 Years | 4,846 (32.7%) | $66,497 |
| 45 to 64 Years | 5,017 (33.9%) | $73,218 |
| 65+ Years | 4,103 (27.7%) | $47,395 |
| Total | 14,801 (100.0%) | $59,457 |
Poverty in Pontotoc County
Income Below Poverty by Sex and Age in Pontotoc County
With 12.7% poverty level for males and 13.9% for females among the residents of Pontotoc County, 5 year old males and 18 to 24 year old females are the most vulnerable to poverty, with 80 males (28.9%) and 403 females (29.0%) in their respective age groups living below the poverty level.
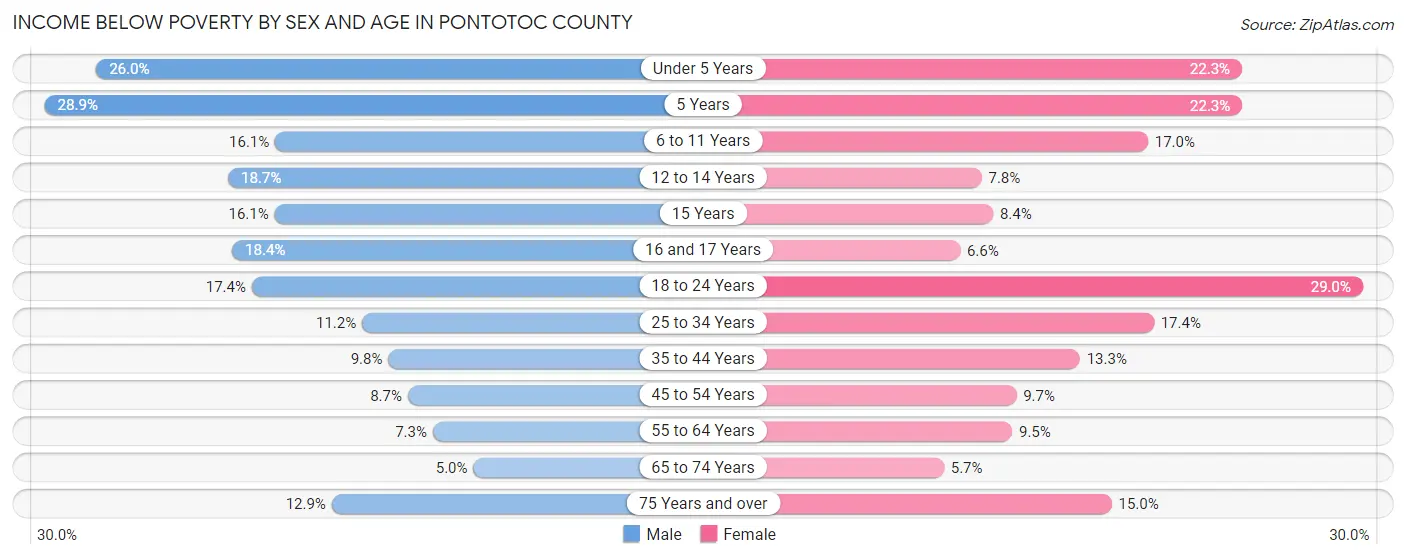
| Age Bracket | Male | Female |
| Under 5 Years | 328 (26.0%) | 270 (22.3%) |
| 5 Years | 80 (28.9%) | 35 (22.3%) |
| 6 to 11 Years | 241 (16.1%) | 264 (17.0%) |
| 12 to 14 Years | 171 (18.7%) | 68 (7.8%) |
| 15 Years | 32 (16.1%) | 17 (8.4%) |
| 16 and 17 Years | 97 (18.4%) | 37 (6.6%) |
| 18 to 24 Years | 268 (17.3%) | 403 (29.0%) |
| 25 to 34 Years | 266 (11.2%) | 439 (17.4%) |
| 35 to 44 Years | 231 (9.8%) | 311 (13.3%) |
| 45 to 54 Years | 181 (8.7%) | 203 (9.7%) |
| 55 to 64 Years | 162 (7.3%) | 224 (9.5%) |
| 65 to 74 Years | 81 (5.0%) | 109 (5.7%) |
| 75 Years and over | 144 (12.9%) | 235 (15.0%) |
| Total | 2,282 (12.7%) | 2,615 (13.9%) |
Income Above Poverty by Sex and Age in Pontotoc County
According to the poverty statistics in Pontotoc County, males aged 65 to 74 years and females aged 65 to 74 years are the age groups that are most secure financially, with 95.0% of males and 94.3% of females in these age groups living above the poverty line.
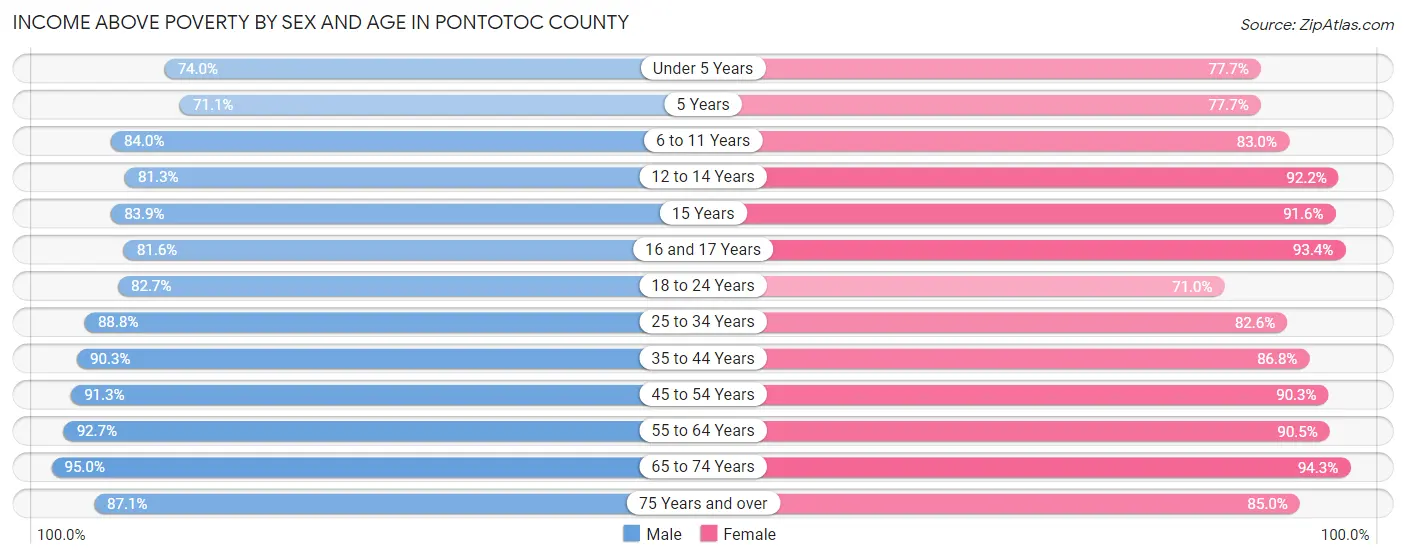
| Age Bracket | Male | Female |
| Under 5 Years | 933 (74.0%) | 942 (77.7%) |
| 5 Years | 197 (71.1%) | 122 (77.7%) |
| 6 to 11 Years | 1,261 (84.0%) | 1,285 (83.0%) |
| 12 to 14 Years | 745 (81.3%) | 806 (92.2%) |
| 15 Years | 167 (83.9%) | 185 (91.6%) |
| 16 and 17 Years | 429 (81.6%) | 525 (93.4%) |
| 18 to 24 Years | 1,277 (82.7%) | 986 (71.0%) |
| 25 to 34 Years | 2,106 (88.8%) | 2,088 (82.6%) |
| 35 to 44 Years | 2,139 (90.2%) | 2,037 (86.8%) |
| 45 to 54 Years | 1,910 (91.3%) | 1,888 (90.3%) |
| 55 to 64 Years | 2,066 (92.7%) | 2,139 (90.5%) |
| 65 to 74 Years | 1,537 (95.0%) | 1,809 (94.3%) |
| 75 Years and over | 972 (87.1%) | 1,330 (85.0%) |
| Total | 15,739 (87.3%) | 16,142 (86.1%) |
Income Below Poverty Among Married-Couple Families in Pontotoc County
The poverty statistics for married-couple families in Pontotoc County show that 4.4% or 307 of the total 6,975 families live below the poverty line. Families with 5 or more children have the highest poverty rate of 60.0%, comprising of 24 families. On the other hand, families with no children have the lowest poverty rate of 2.7%, which includes 112 families.
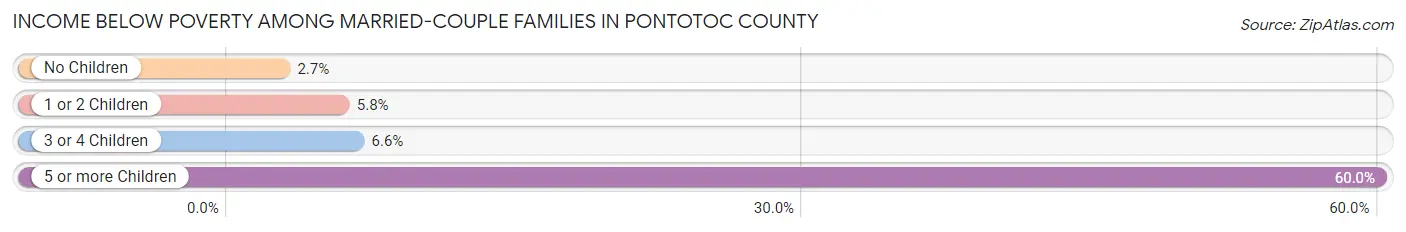
| Children | Above Poverty | Below Poverty |
| No Children | 3,974 (97.3%) | 112 (2.7%) |
| 1 or 2 Children | 2,113 (94.2%) | 131 (5.8%) |
| 3 or 4 Children | 565 (93.4%) | 40 (6.6%) |
| 5 or more Children | 16 (40.0%) | 24 (60.0%) |
| Total | 6,668 (95.6%) | 307 (4.4%) |
Income Below Poverty Among Single-Parent Households in Pontotoc County
According to the poverty data in Pontotoc County, 16.8% or 158 single-father households and 27.7% or 525 single-mother households are living below the poverty line. Among single-father households, those with 3 or 4 children have the highest poverty rate, with 35 households (33.7%) experiencing poverty. Likewise, among single-mother households, those with 3 or 4 children have the highest poverty rate, with 93 households (46.7%) falling below the poverty line.
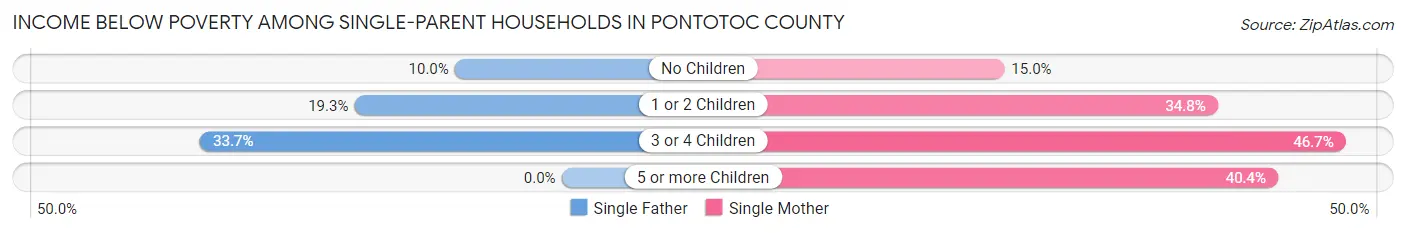
| Children | Single Father | Single Mother |
| No Children | 40 (10.0%) | 122 (15.0%) |
| 1 or 2 Children | 83 (19.3%) | 291 (34.8%) |
| 3 or 4 Children | 35 (33.7%) | 93 (46.7%) |
| 5 or more Children | 0 (0.0%) | 19 (40.4%) |
| Total | 158 (16.8%) | 525 (27.7%) |
Income Below Poverty Among Married-Couple vs Single-Parent Households in Pontotoc County
The poverty data for Pontotoc County shows that 307 of the married-couple family households (4.4%) and 683 of the single-parent households (24.1%) are living below the poverty level. Within the married-couple family households, those with 5 or more children have the highest poverty rate, with 24 households (60.0%) falling below the poverty line. Among the single-parent households, those with 3 or 4 children have the highest poverty rate, with 128 household (42.2%) living below poverty.
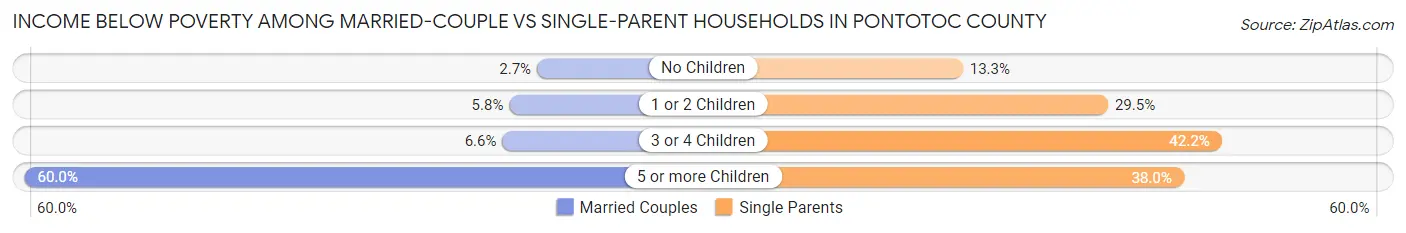
| Children | Married-Couple Families | Single-Parent Households |
| No Children | 112 (2.7%) | 162 (13.3%) |
| 1 or 2 Children | 131 (5.8%) | 374 (29.5%) |
| 3 or 4 Children | 40 (6.6%) | 128 (42.2%) |
| 5 or more Children | 24 (60.0%) | 19 (38.0%) |
| Total | 307 (4.4%) | 683 (24.1%) |
Employment Characteristics in Pontotoc County
Employment by Class of Employer in Pontotoc County
Among the 17,006 employed individuals in Pontotoc County, private company employees (9,595 | 56.4%), federal government employees (2,291 | 13.5%), and state government employees (1,396 | 8.2%) make up the most common classes of employment.
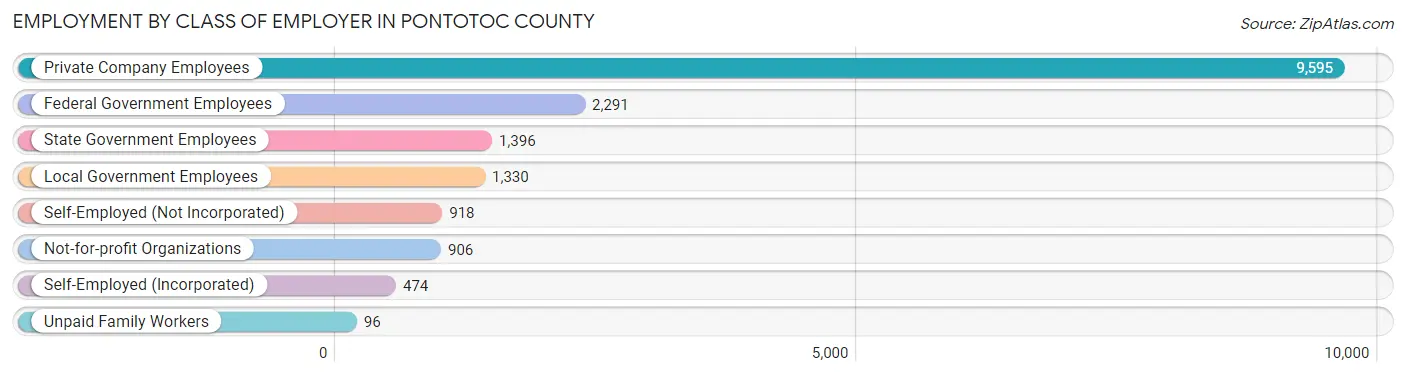
| Employer Class | # Employees | % Employees |
| Private Company Employees | 9,595 | 56.4% |
| Self-Employed (Incorporated) | 474 | 2.8% |
| Self-Employed (Not Incorporated) | 918 | 5.4% |
| Not-for-profit Organizations | 906 | 5.3% |
| Local Government Employees | 1,330 | 7.8% |
| State Government Employees | 1,396 | 8.2% |
| Federal Government Employees | 2,291 | 13.5% |
| Unpaid Family Workers | 96 | 0.6% |
| Total | 17,006 | 100.0% |
Employment Status by Age in Pontotoc County
According to the labor force statistics for Pontotoc County, out of the total population over 16 years of age (29,831), 60.0% or 17,899 individuals are in the labor force, with 4.3% or 770 of them unemployed. The age group with the highest labor force participation rate is 25 to 29 years, with 84.9% or 2,133 individuals in the labor force. Within the labor force, the 20 to 24 years age range has the highest percentage of unemployed individuals, with 8.8% or 149 of them being unemployed.
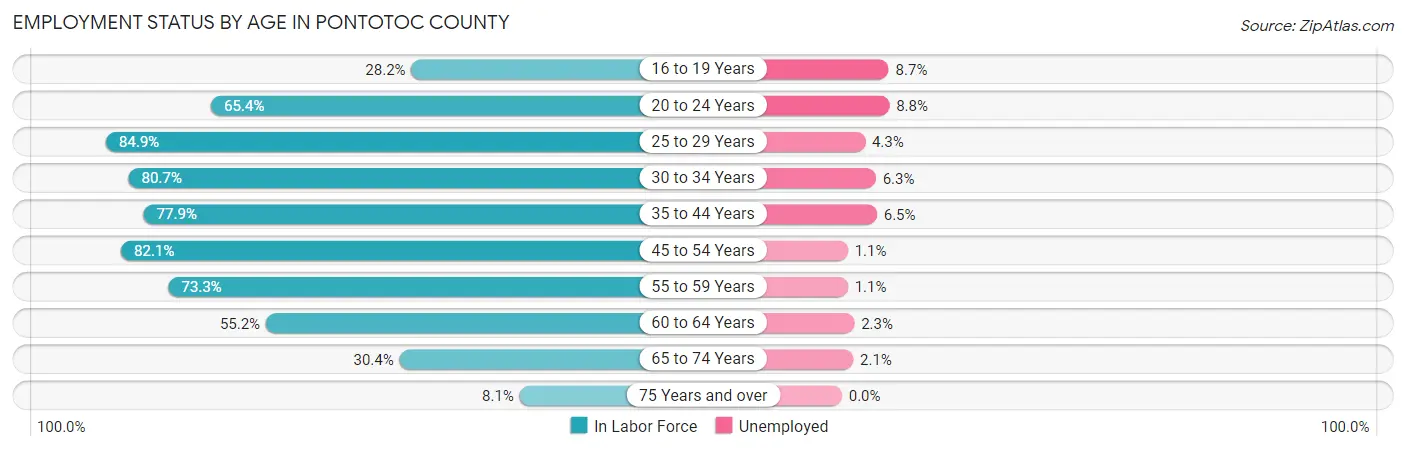
| Age Bracket | In Labor Force | Unemployed |
| 16 to 19 Years | 599 (28.2%) | 52 (8.7%) |
| 20 to 24 Years | 1,689 (65.4%) | 149 (8.8%) |
| 25 to 29 Years | 2,133 (84.9%) | 92 (4.3%) |
| 30 to 34 Years | 2,001 (80.7%) | 126 (6.3%) |
| 35 to 44 Years | 3,749 (77.9%) | 244 (6.5%) |
| 45 to 54 Years | 3,477 (82.1%) | 38 (1.1%) |
| 55 to 59 Years | 1,524 (73.3%) | 17 (1.1%) |
| 60 to 64 Years | 1,418 (55.2%) | 33 (2.3%) |
| 65 to 74 Years | 1,093 (30.4%) | 23 (2.1%) |
| 75 Years and over | 230 (8.1%) | 0 (0.0%) |
| Total | 17,899 (60.0%) | 770 (4.3%) |
Employment Status by Educational Attainment in Pontotoc County
According to labor force statistics for Pontotoc County, 76.5% of individuals (14,296) out of the total population between 25 and 64 years of age (18,688) are in the labor force, with 3.8% or 543 of them being unemployed. The group with the highest labor force participation rate are those with the educational attainment of bachelor's degree or higher, with 88.0% or 4,736 individuals in the labor force. Within the labor force, individuals with high school diploma education have the highest percentage of unemployment, with 5.1% or 230 of them being unemployed.
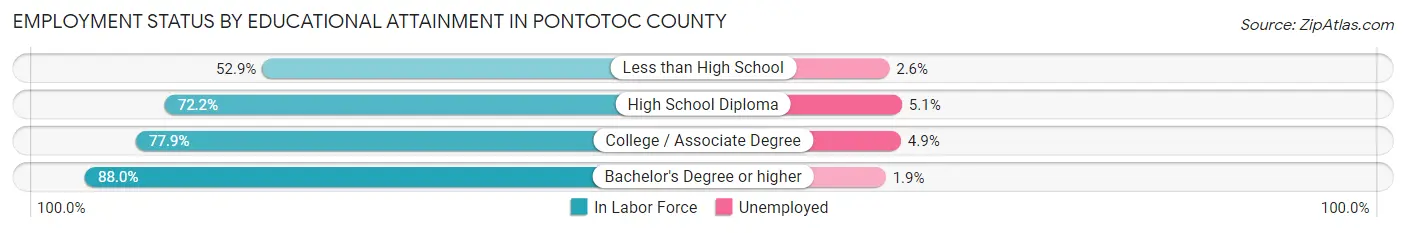
| Educational Attainment | In Labor Force | Unemployed |
| Less than High School | 950 (52.9%) | 47 (2.6%) |
| High School Diploma | 4,519 (72.2%) | 319 (5.1%) |
| College / Associate Degree | 4,091 (77.9%) | 257 (4.9%) |
| Bachelor's Degree or higher | 4,736 (88.0%) | 102 (1.9%) |
| Total | 14,296 (76.5%) | 710 (3.8%) |
Employment Occupations by Sex in Pontotoc County
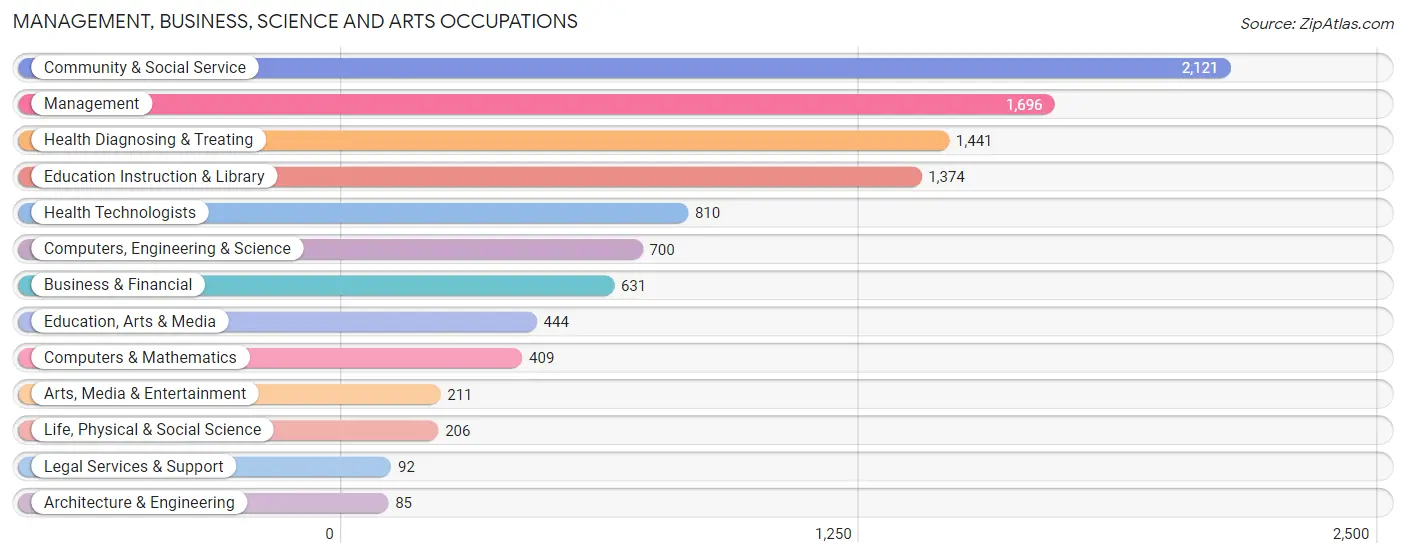
Management, Business, Science and Arts Occupations
The most common Management, Business, Science and Arts occupations in Pontotoc County are Community & Social Service (2,121 | 12.4%), Management (1,696 | 9.9%), Health Diagnosing & Treating (1,441 | 8.4%), Education Instruction & Library (1,374 | 8.0%), and Health Technologists (810 | 4.7%).
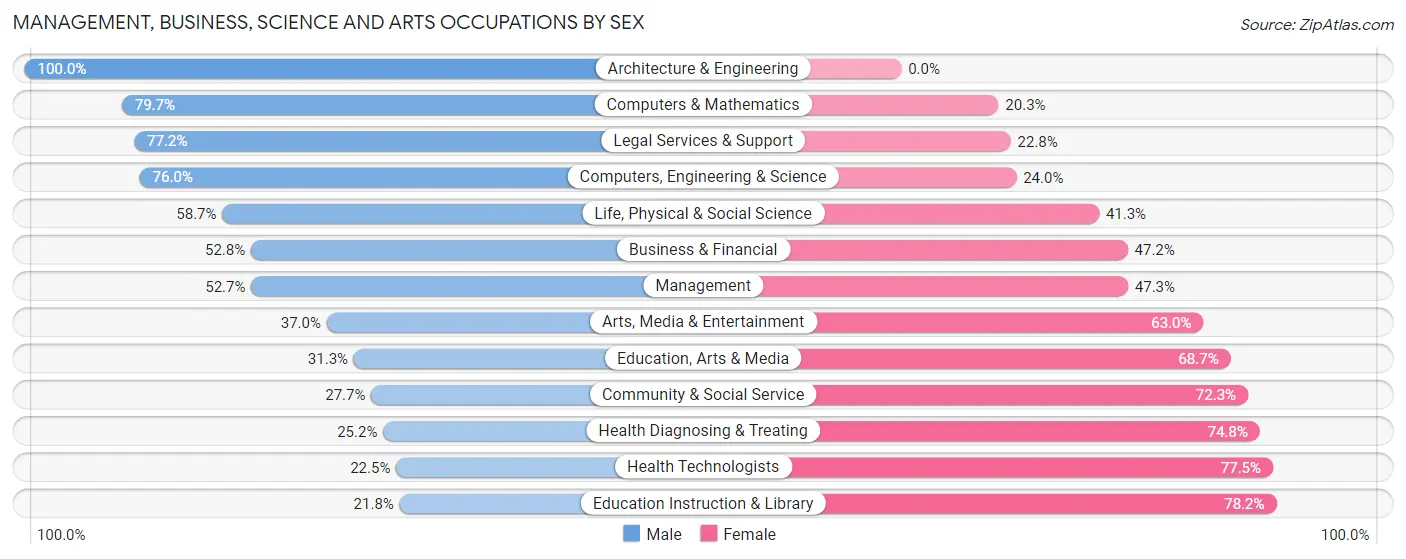
Management, Business, Science and Arts Occupations by Sex
Within the Management, Business, Science and Arts occupations in Pontotoc County, the most male-oriented occupations are Architecture & Engineering (100.0%), Computers & Mathematics (79.7%), and Legal Services & Support (77.2%), while the most female-oriented occupations are Education Instruction & Library (78.2%), Health Technologists (77.5%), and Health Diagnosing & Treating (74.8%).
| Occupation | Male | Female |
| Management | 894 (52.7%) | 802 (47.3%) |
| Business & Financial | 333 (52.8%) | 298 (47.2%) |
| Computers, Engineering & Science | 532 (76.0%) | 168 (24.0%) |
| Computers & Mathematics | 326 (79.7%) | 83 (20.3%) |
| Architecture & Engineering | 85 (100.0%) | 0 (0.0%) |
| Life, Physical & Social Science | 121 (58.7%) | 85 (41.3%) |
| Community & Social Service | 587 (27.7%) | 1,534 (72.3%) |
| Education, Arts & Media | 139 (31.3%) | 305 (68.7%) |
| Legal Services & Support | 71 (77.2%) | 21 (22.8%) |
| Education Instruction & Library | 299 (21.8%) | 1,075 (78.2%) |
| Arts, Media & Entertainment | 78 (37.0%) | 133 (63.0%) |
| Health Diagnosing & Treating | 363 (25.2%) | 1,078 (74.8%) |
| Health Technologists | 182 (22.5%) | 628 (77.5%) |
| Total (Category) | 2,709 (41.1%) | 3,880 (58.9%) |
| Total (Overall) | 9,095 (53.1%) | 8,026 (46.9%) |
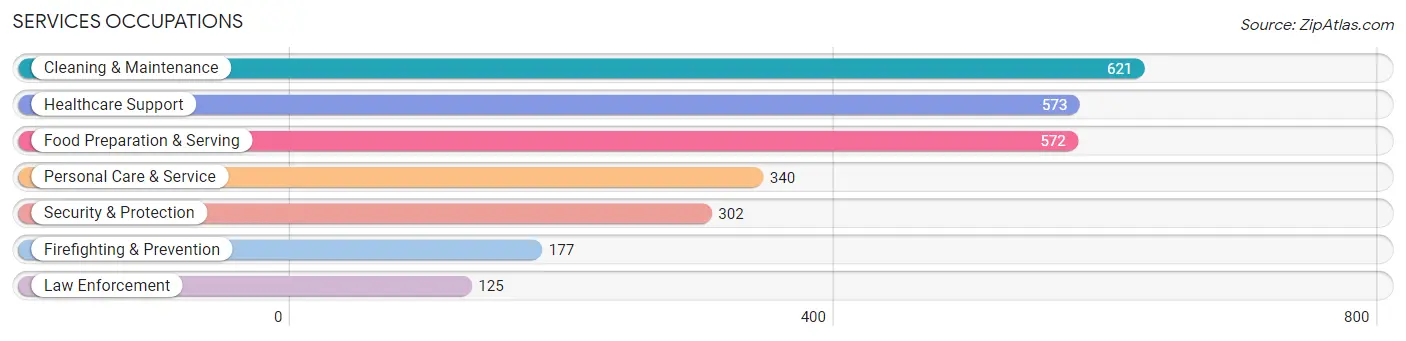
Services Occupations
The most common Services occupations in Pontotoc County are Cleaning & Maintenance (621 | 3.6%), Healthcare Support (573 | 3.4%), Food Preparation & Serving (572 | 3.3%), Personal Care & Service (340 | 2.0%), and Security & Protection (302 | 1.8%).
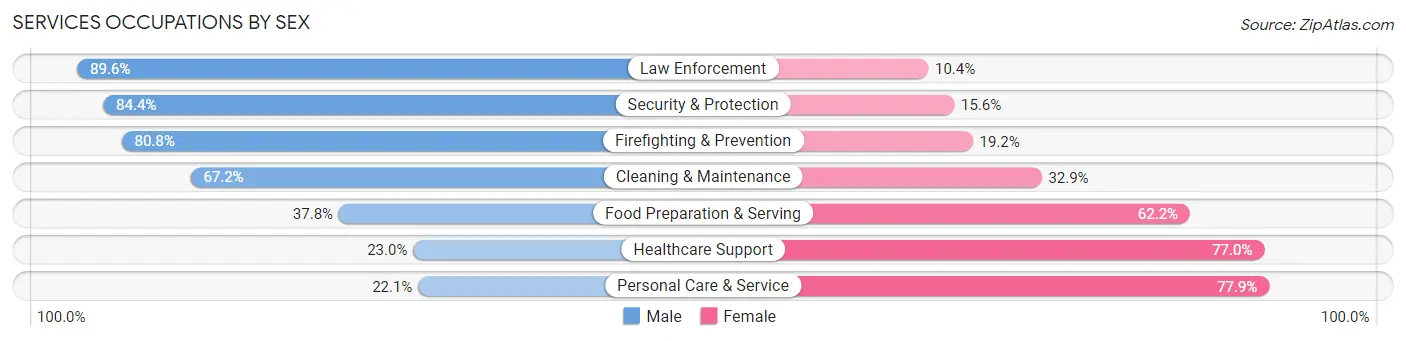
Services Occupations by Sex
Within the Services occupations in Pontotoc County, the most male-oriented occupations are Law Enforcement (89.6%), Security & Protection (84.4%), and Firefighting & Prevention (80.8%), while the most female-oriented occupations are Personal Care & Service (77.9%), Healthcare Support (77.0%), and Food Preparation & Serving (62.2%).
| Occupation | Male | Female |
| Healthcare Support | 132 (23.0%) | 441 (77.0%) |
| Security & Protection | 255 (84.4%) | 47 (15.6%) |
| Firefighting & Prevention | 143 (80.8%) | 34 (19.2%) |
| Law Enforcement | 112 (89.6%) | 13 (10.4%) |
| Food Preparation & Serving | 216 (37.8%) | 356 (62.2%) |
| Cleaning & Maintenance | 417 (67.1%) | 204 (32.9%) |
| Personal Care & Service | 75 (22.1%) | 265 (77.9%) |
| Total (Category) | 1,095 (45.5%) | 1,313 (54.5%) |
| Total (Overall) | 9,095 (53.1%) | 8,026 (46.9%) |
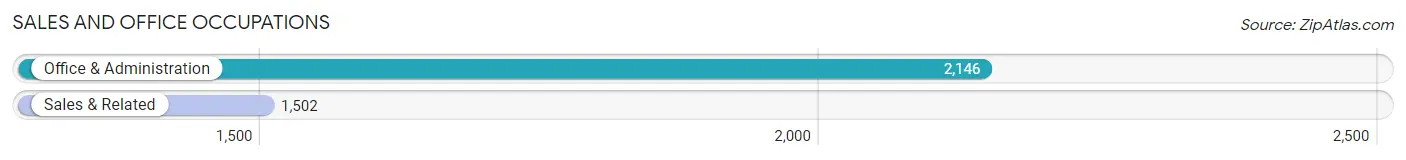
Sales and Office Occupations
The most common Sales and Office occupations in Pontotoc County are Office & Administration (2,146 | 12.5%), and Sales & Related (1,502 | 8.8%).
Sales and Office Occupations by Sex
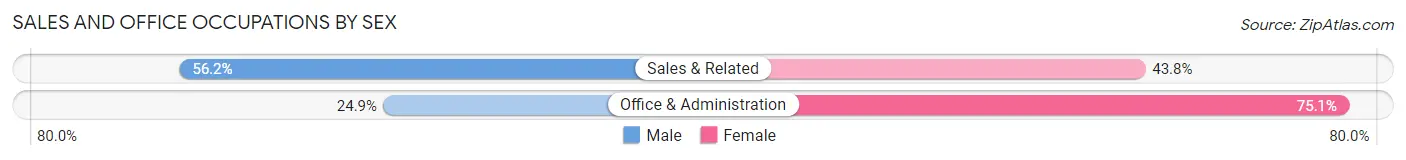
| Occupation | Male | Female |
| Sales & Related | 844 (56.2%) | 658 (43.8%) |
| Office & Administration | 534 (24.9%) | 1,612 (75.1%) |
| Total (Category) | 1,378 (37.8%) | 2,270 (62.2%) |
| Total (Overall) | 9,095 (53.1%) | 8,026 (46.9%) |
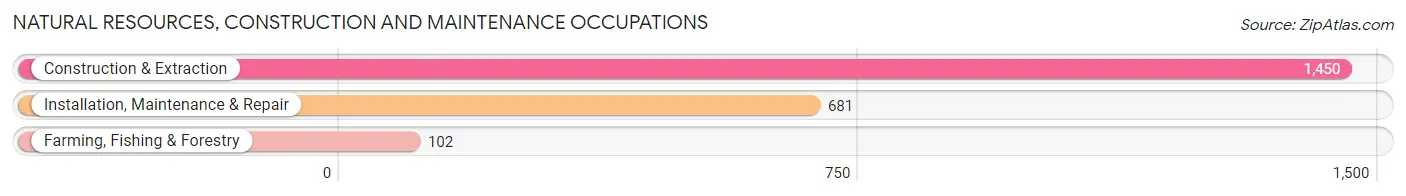
Natural Resources, Construction and Maintenance Occupations
The most common Natural Resources, Construction and Maintenance occupations in Pontotoc County are Construction & Extraction (1,450 | 8.5%), Installation, Maintenance & Repair (681 | 4.0%), and Farming, Fishing & Forestry (102 | 0.6%).
Natural Resources, Construction and Maintenance Occupations by Sex
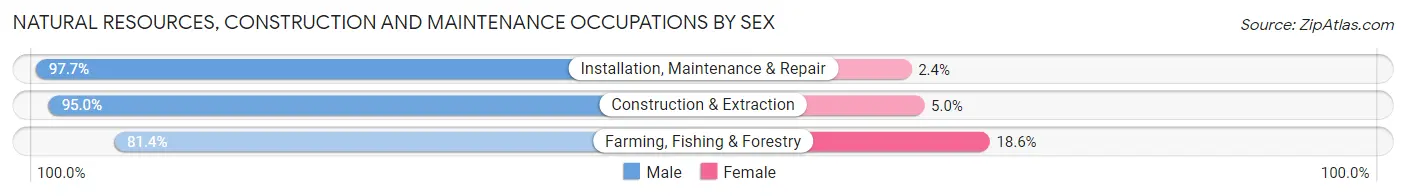
| Occupation | Male | Female |
| Farming, Fishing & Forestry | 83 (81.4%) | 19 (18.6%) |
| Construction & Extraction | 1,377 (95.0%) | 73 (5.0%) |
| Installation, Maintenance & Repair | 665 (97.7%) | 16 (2.4%) |
| Total (Category) | 2,125 (95.2%) | 108 (4.8%) |
| Total (Overall) | 9,095 (53.1%) | 8,026 (46.9%) |
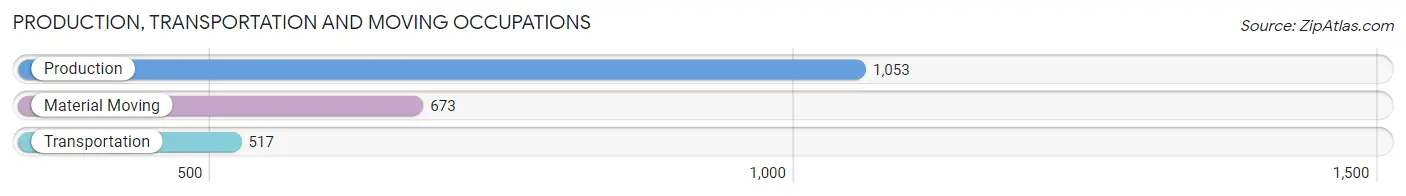
Production, Transportation and Moving Occupations
The most common Production, Transportation and Moving occupations in Pontotoc County are Production (1,053 | 6.1%), Material Moving (673 | 3.9%), and Transportation (517 | 3.0%).
Production, Transportation and Moving Occupations by Sex
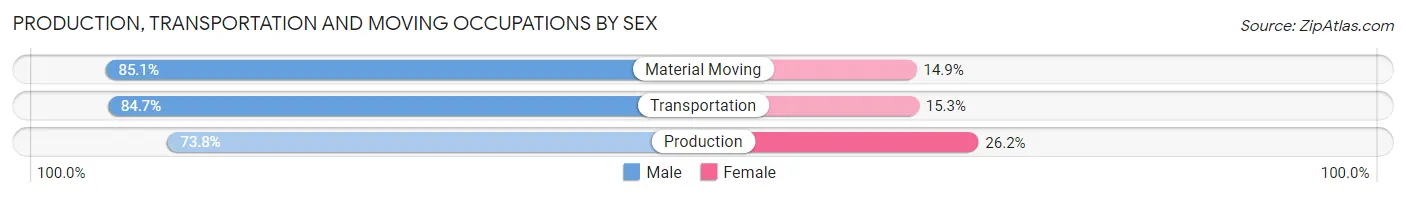
| Occupation | Male | Female |
| Production | 777 (73.8%) | 276 (26.2%) |
| Transportation | 438 (84.7%) | 79 (15.3%) |
| Material Moving | 573 (85.1%) | 100 (14.9%) |
| Total (Category) | 1,788 (79.7%) | 455 (20.3%) |
| Total (Overall) | 9,095 (53.1%) | 8,026 (46.9%) |
Employment Industries by Sex in Pontotoc County
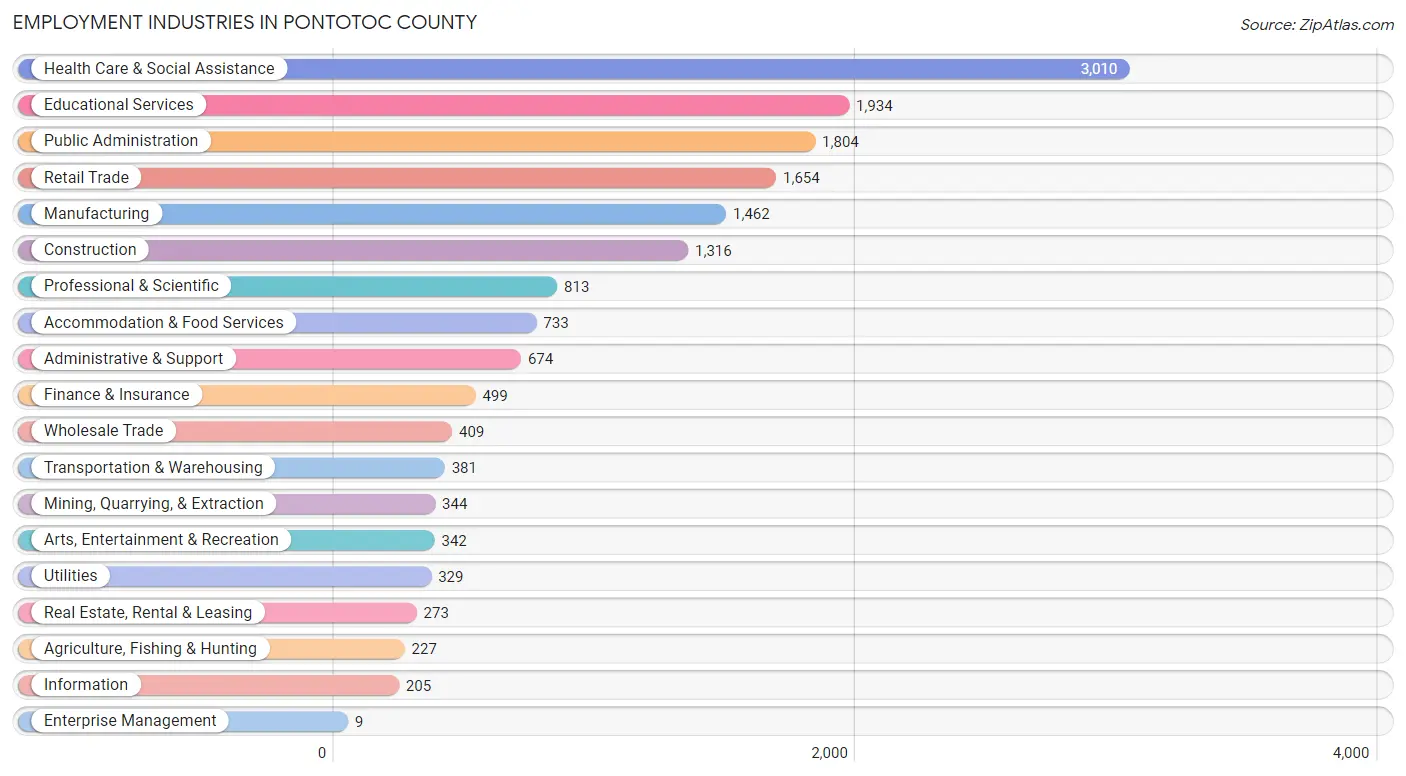
Employment Industries in Pontotoc County
The major employment industries in Pontotoc County include Health Care & Social Assistance (3,010 | 17.6%), Educational Services (1,934 | 11.3%), Public Administration (1,804 | 10.5%), Retail Trade (1,654 | 9.7%), and Manufacturing (1,462 | 8.5%).
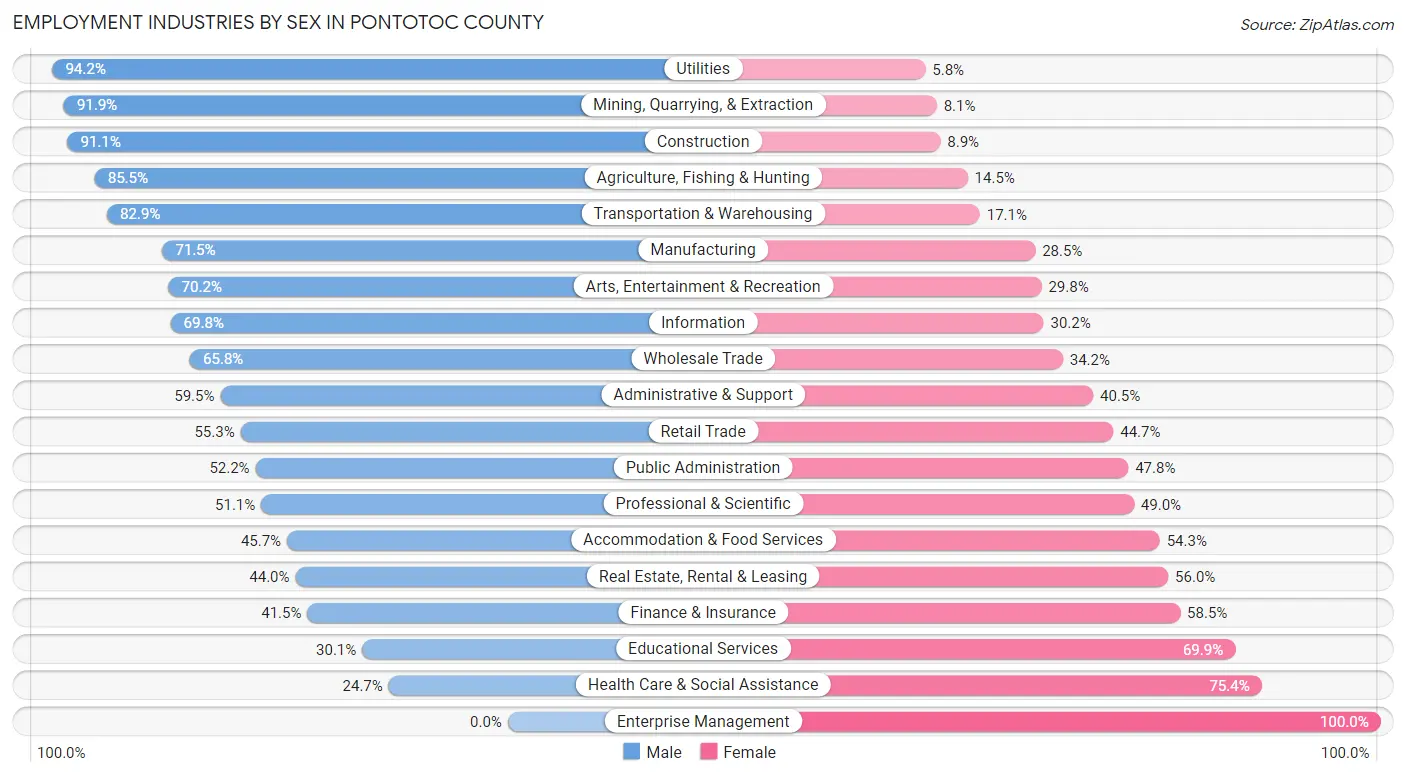
Employment Industries by Sex in Pontotoc County
The Pontotoc County industries that see more men than women are Utilities (94.2%), Mining, Quarrying, & Extraction (91.9%), and Construction (91.1%), whereas the industries that tend to have a higher number of women are Enterprise Management (100.0%), Health Care & Social Assistance (75.3%), and Educational Services (69.9%).
| Industry | Male | Female |
| Agriculture, Fishing & Hunting | 194 (85.5%) | 33 (14.5%) |
| Mining, Quarrying, & Extraction | 316 (91.9%) | 28 (8.1%) |
| Construction | 1,199 (91.1%) | 117 (8.9%) |
| Manufacturing | 1,045 (71.5%) | 417 (28.5%) |
| Wholesale Trade | 269 (65.8%) | 140 (34.2%) |
| Retail Trade | 915 (55.3%) | 739 (44.7%) |
| Transportation & Warehousing | 316 (82.9%) | 65 (17.1%) |
| Utilities | 310 (94.2%) | 19 (5.8%) |
| Information | 143 (69.8%) | 62 (30.2%) |
| Finance & Insurance | 207 (41.5%) | 292 (58.5%) |
| Real Estate, Rental & Leasing | 120 (44.0%) | 153 (56.0%) |
| Professional & Scientific | 415 (51.0%) | 398 (48.9%) |
| Enterprise Management | 0 (0.0%) | 9 (100.0%) |
| Administrative & Support | 401 (59.5%) | 273 (40.5%) |
| Educational Services | 583 (30.1%) | 1,351 (69.9%) |
| Health Care & Social Assistance | 742 (24.6%) | 2,268 (75.3%) |
| Arts, Entertainment & Recreation | 240 (70.2%) | 102 (29.8%) |
| Accommodation & Food Services | 335 (45.7%) | 398 (54.3%) |
| Public Administration | 942 (52.2%) | 862 (47.8%) |
| Total | 9,095 (53.1%) | 8,026 (46.9%) |
Education in Pontotoc County
School Enrollment in Pontotoc County
The most common levels of schooling among the 9,719 students in Pontotoc County are middle school (2,318 | 23.8%), college / undergraduate (1,991 | 20.5%), and high school (1,915 | 19.7%).
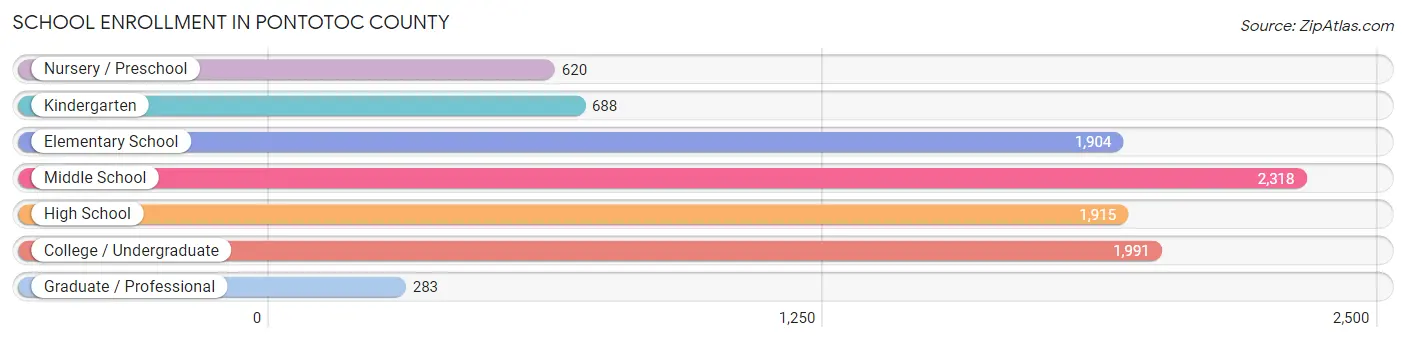
| School Level | # Students | % Students |
| Nursery / Preschool | 620 | 6.4% |
| Kindergarten | 688 | 7.1% |
| Elementary School | 1,904 | 19.6% |
| Middle School | 2,318 | 23.8% |
| High School | 1,915 | 19.7% |
| College / Undergraduate | 1,991 | 20.5% |
| Graduate / Professional | 283 | 2.9% |
| Total | 9,719 | 100.0% |
School Enrollment by Age by Funding Source in Pontotoc County
Out of a total of 9,719 students who are enrolled in schools in Pontotoc County, 836 (8.6%) attend a private institution, while the remaining 8,883 (91.4%) are enrolled in public schools. The age group of 18 to 19 year olds has the highest likelihood of being enrolled in private schools, with 121 (15.5% in the age bracket) enrolled. Conversely, the age group of 3 to 4 year olds has the lowest likelihood of being enrolled in a private school, with 522 (100.0% in the age bracket) attending a public institution.
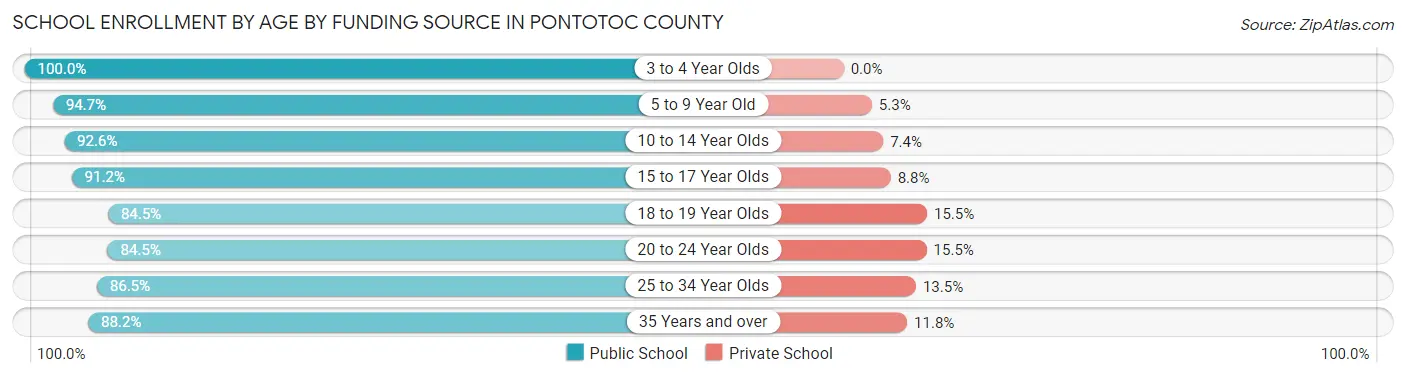
| Age Bracket | Public School | Private School |
| 3 to 4 Year Olds | 522 (100.0%) | 0 (0.0%) |
| 5 to 9 Year Old | 2,358 (94.7%) | 131 (5.3%) |
| 10 to 14 Year Olds | 2,530 (92.6%) | 201 (7.4%) |
| 15 to 17 Year Olds | 1,313 (91.2%) | 126 (8.8%) |
| 18 to 19 Year Olds | 658 (84.5%) | 121 (15.5%) |
| 20 to 24 Year Olds | 875 (84.5%) | 160 (15.5%) |
| 25 to 34 Year Olds | 334 (86.5%) | 52 (13.5%) |
| 35 Years and over | 298 (88.2%) | 40 (11.8%) |
| Total | 8,883 (91.4%) | 836 (8.6%) |
Educational Attainment by Field of Study in Pontotoc County
Education (1,774 | 22.9%), business (1,480 | 19.1%), science & technology (844 | 10.9%), arts & humanities (788 | 10.2%), and psychology (527 | 6.8%) are the most common fields of study among 7,738 individuals in Pontotoc County who have obtained a bachelor's degree or higher.
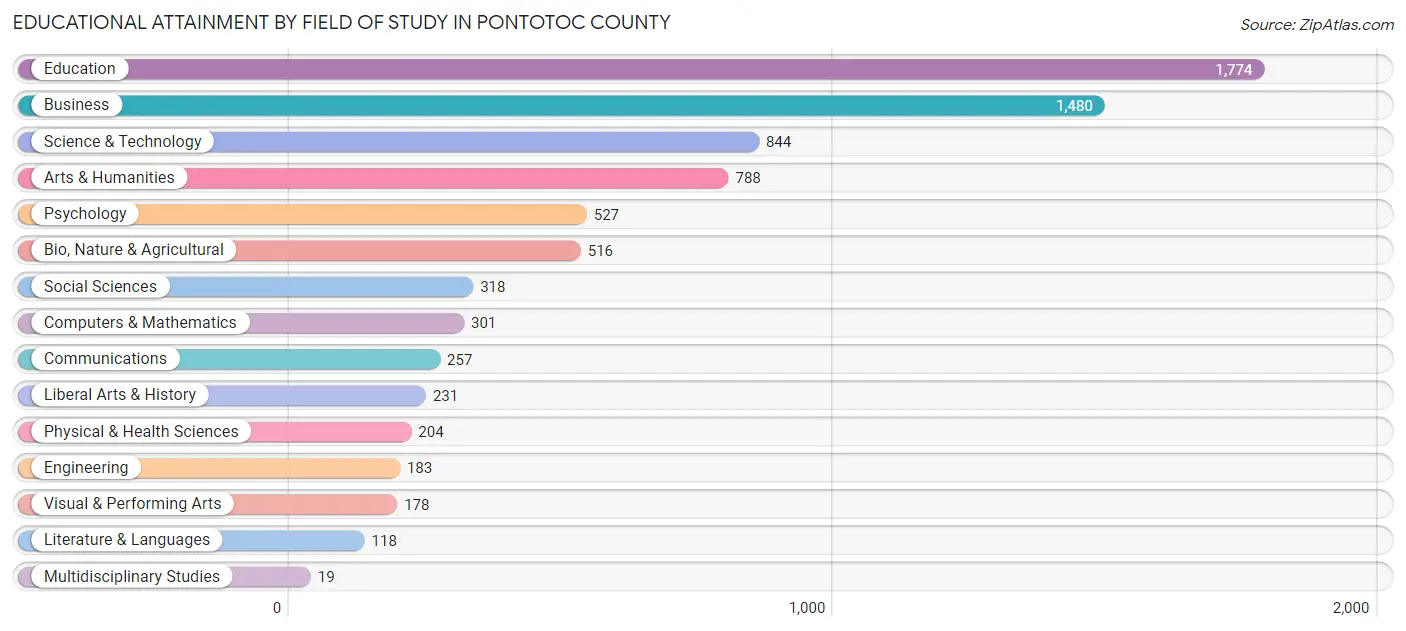
| Field of Study | # Graduates | % Graduates |
| Computers & Mathematics | 301 | 3.9% |
| Bio, Nature & Agricultural | 516 | 6.7% |
| Physical & Health Sciences | 204 | 2.6% |
| Psychology | 527 | 6.8% |
| Social Sciences | 318 | 4.1% |
| Engineering | 183 | 2.4% |
| Multidisciplinary Studies | 19 | 0.3% |
| Science & Technology | 844 | 10.9% |
| Business | 1,480 | 19.1% |
| Education | 1,774 | 22.9% |
| Literature & Languages | 118 | 1.5% |
| Liberal Arts & History | 231 | 3.0% |
| Visual & Performing Arts | 178 | 2.3% |
| Communications | 257 | 3.3% |
| Arts & Humanities | 788 | 10.2% |
| Total | 7,738 | 100.0% |
Transportation & Commute in Pontotoc County
Vehicle Availability by Sex in Pontotoc County
The most prevalent vehicle ownership categories in Pontotoc County are males with 2 vehicles (3,718, accounting for 41.1%) and females with 2 vehicles (2,951, making up 46.7%).
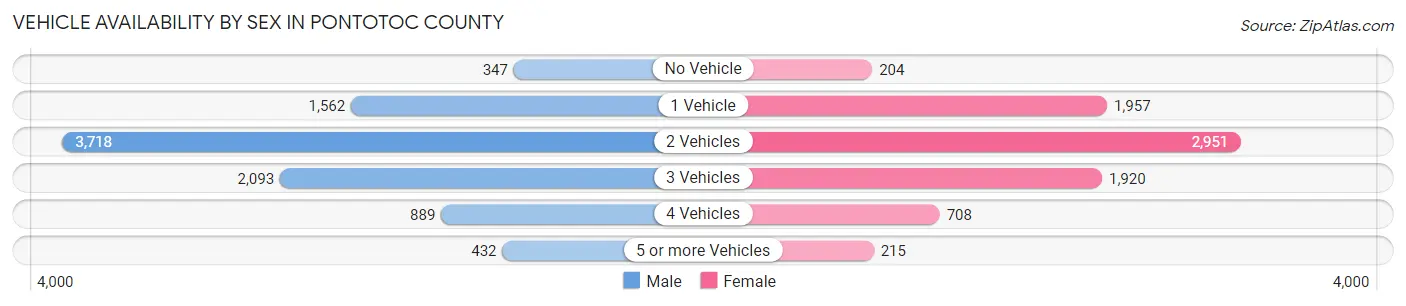
| Vehicles Available | Male | Female |
| No Vehicle | 347 (3.8%) | 204 (2.6%) |
| 1 Vehicle | 1,562 (17.3%) | 1,957 (24.6%) |
| 2 Vehicles | 3,718 (41.1%) | 2,951 (37.1%) |
| 3 Vehicles | 2,093 (23.2%) | 1,920 (24.1%) |
| 4 Vehicles | 889 (9.8%) | 708 (8.9%) |
| 5 or more Vehicles | 432 (4.8%) | 215 (2.7%) |
| Total | 9,041 (100.0%) | 7,955 (100.0%) |
Commute Time in Pontotoc County
The most frequently occuring commute durations in Pontotoc County are 10 to 14 minutes (3,539 commuters, 21.5%), 5 to 9 minutes (3,529 commuters, 21.4%), and 15 to 19 minutes (3,167 commuters, 19.2%).
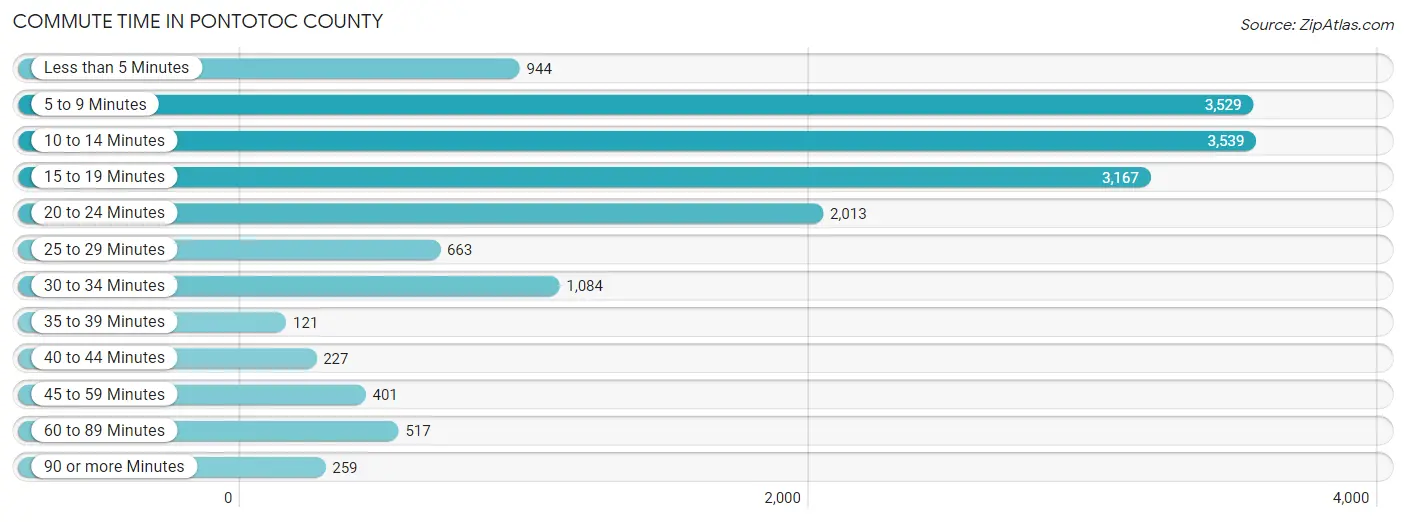
| Commute Time | # Commuters | % Commuters |
| Less than 5 Minutes | 944 | 5.7% |
| 5 to 9 Minutes | 3,529 | 21.4% |
| 10 to 14 Minutes | 3,539 | 21.5% |
| 15 to 19 Minutes | 3,167 | 19.2% |
| 20 to 24 Minutes | 2,013 | 12.2% |
| 25 to 29 Minutes | 663 | 4.0% |
| 30 to 34 Minutes | 1,084 | 6.6% |
| 35 to 39 Minutes | 121 | 0.7% |
| 40 to 44 Minutes | 227 | 1.4% |
| 45 to 59 Minutes | 401 | 2.4% |
| 60 to 89 Minutes | 517 | 3.1% |
| 90 or more Minutes | 259 | 1.6% |
Commute Time by Sex in Pontotoc County
The most common commute times in Pontotoc County are 5 to 9 minutes (1,755 commuters, 20.1%) for males and 10 to 14 minutes (1,857 commuters, 24.1%) for females.
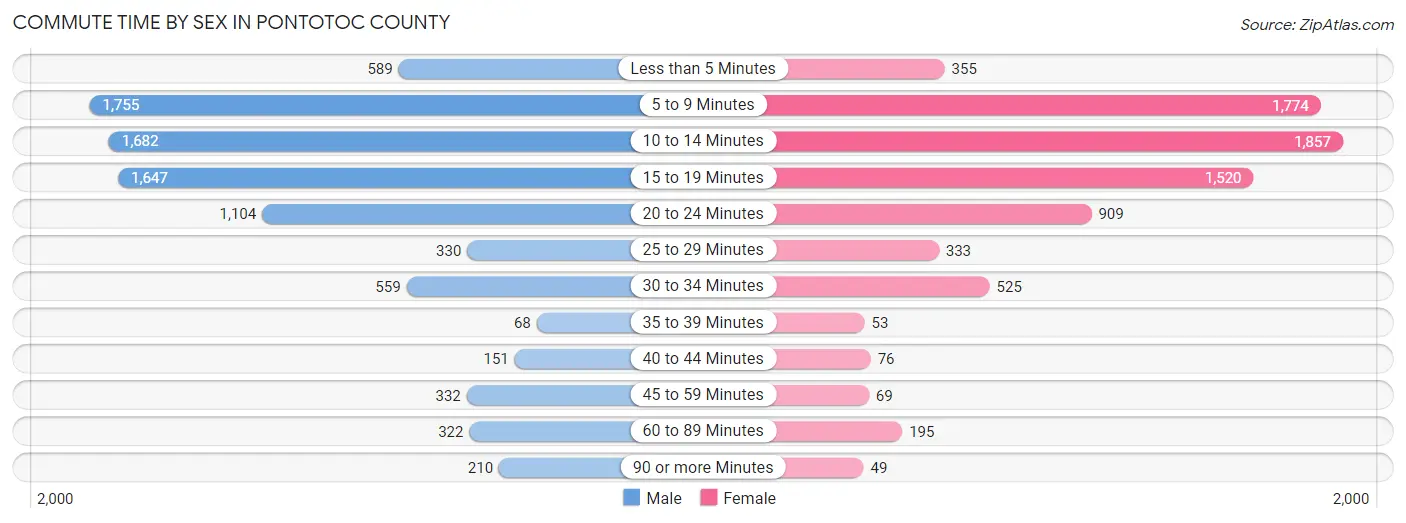
| Commute Time | Male | Female |
| Less than 5 Minutes | 589 (6.7%) | 355 (4.6%) |
| 5 to 9 Minutes | 1,755 (20.1%) | 1,774 (23.0%) |
| 10 to 14 Minutes | 1,682 (19.2%) | 1,857 (24.1%) |
| 15 to 19 Minutes | 1,647 (18.8%) | 1,520 (19.7%) |
| 20 to 24 Minutes | 1,104 (12.6%) | 909 (11.8%) |
| 25 to 29 Minutes | 330 (3.8%) | 333 (4.3%) |
| 30 to 34 Minutes | 559 (6.4%) | 525 (6.8%) |
| 35 to 39 Minutes | 68 (0.8%) | 53 (0.7%) |
| 40 to 44 Minutes | 151 (1.7%) | 76 (1.0%) |
| 45 to 59 Minutes | 332 (3.8%) | 69 (0.9%) |
| 60 to 89 Minutes | 322 (3.7%) | 195 (2.5%) |
| 90 or more Minutes | 210 (2.4%) | 49 (0.6%) |
Time of Departure to Work by Sex in Pontotoc County
The most frequent times of departure to work in Pontotoc County are 7:30 AM to 7:59 AM (1,351, 15.4%) for males and 7:30 AM to 7:59 AM (1,968, 25.5%) for females.
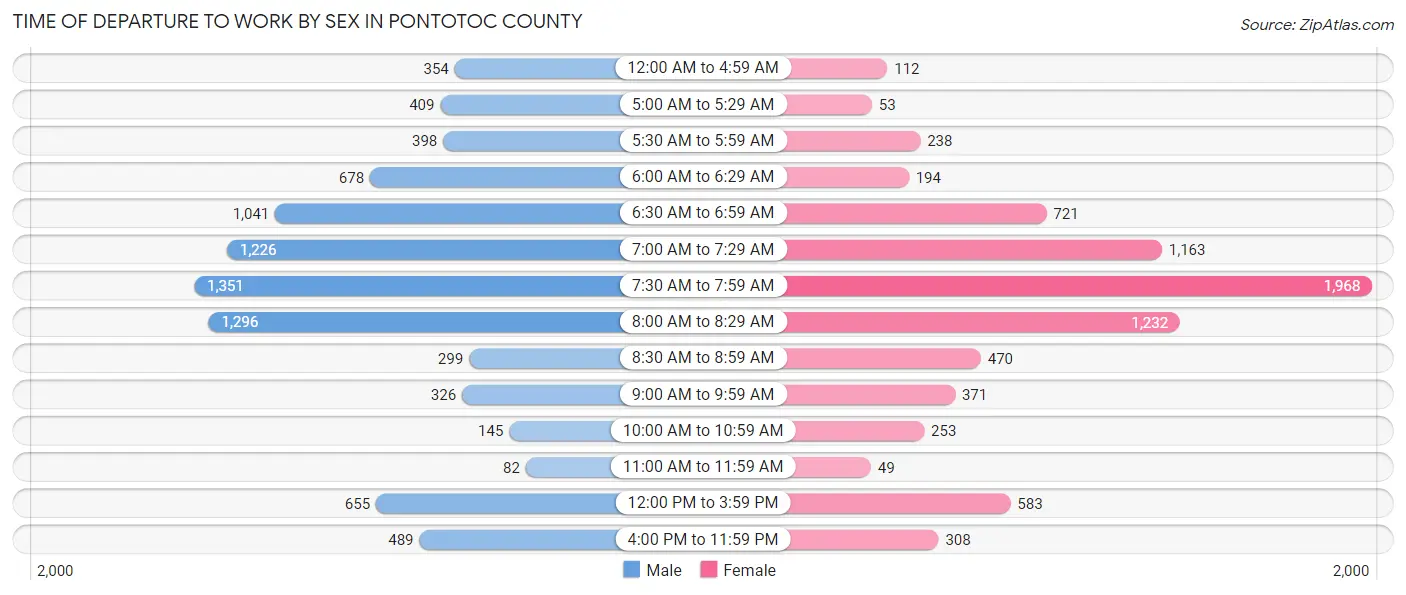
| Time of Departure | Male | Female |
| 12:00 AM to 4:59 AM | 354 (4.1%) | 112 (1.5%) |
| 5:00 AM to 5:29 AM | 409 (4.7%) | 53 (0.7%) |
| 5:30 AM to 5:59 AM | 398 (4.5%) | 238 (3.1%) |
| 6:00 AM to 6:29 AM | 678 (7.7%) | 194 (2.5%) |
| 6:30 AM to 6:59 AM | 1,041 (11.9%) | 721 (9.3%) |
| 7:00 AM to 7:29 AM | 1,226 (14.0%) | 1,163 (15.1%) |
| 7:30 AM to 7:59 AM | 1,351 (15.4%) | 1,968 (25.5%) |
| 8:00 AM to 8:29 AM | 1,296 (14.8%) | 1,232 (16.0%) |
| 8:30 AM to 8:59 AM | 299 (3.4%) | 470 (6.1%) |
| 9:00 AM to 9:59 AM | 326 (3.7%) | 371 (4.8%) |
| 10:00 AM to 10:59 AM | 145 (1.7%) | 253 (3.3%) |
| 11:00 AM to 11:59 AM | 82 (0.9%) | 49 (0.6%) |
| 12:00 PM to 3:59 PM | 655 (7.5%) | 583 (7.6%) |
| 4:00 PM to 11:59 PM | 489 (5.6%) | 308 (4.0%) |
| Total | 8,749 (100.0%) | 7,715 (100.0%) |
Housing Occupancy in Pontotoc County
Occupancy by Ownership in Pontotoc County
Of the total 14,801 dwellings in Pontotoc County, owner-occupied units account for 9,733 (65.8%), while renter-occupied units make up 5,068 (34.2%).
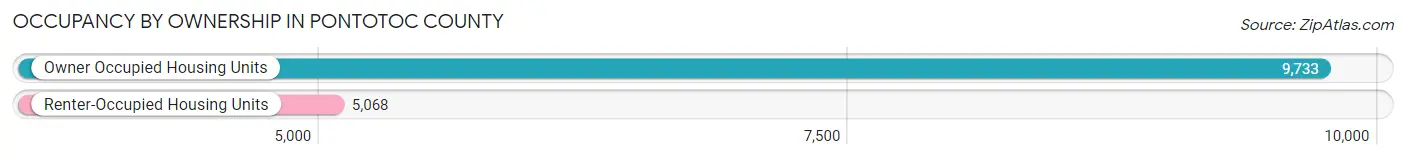
| Occupancy | # Housing Units | % Housing Units |
| Owner Occupied Housing Units | 9,733 | 65.8% |
| Renter-Occupied Housing Units | 5,068 | 34.2% |
| Total Occupied Housing Units | 14,801 | 100.0% |
Occupancy by Household Size in Pontotoc County
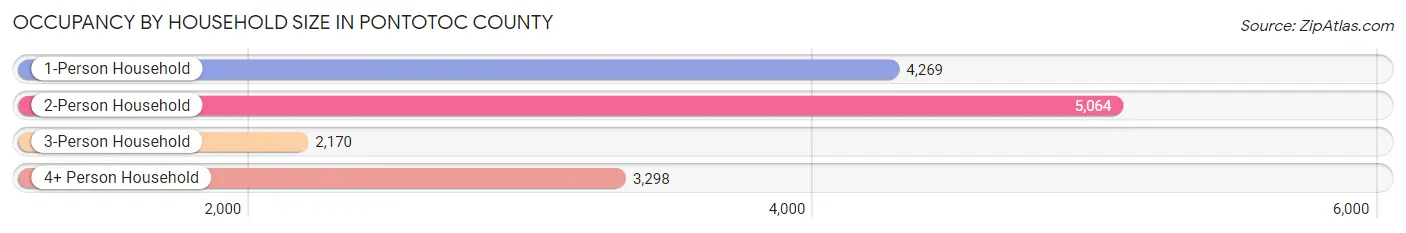
| Household Size | # Housing Units | % Housing Units |
| 1-Person Household | 4,269 | 28.8% |
| 2-Person Household | 5,064 | 34.2% |
| 3-Person Household | 2,170 | 14.7% |
| 4+ Person Household | 3,298 | 22.3% |
| Total Housing Units | 14,801 | 100.0% |
Occupancy by Ownership by Household Size in Pontotoc County
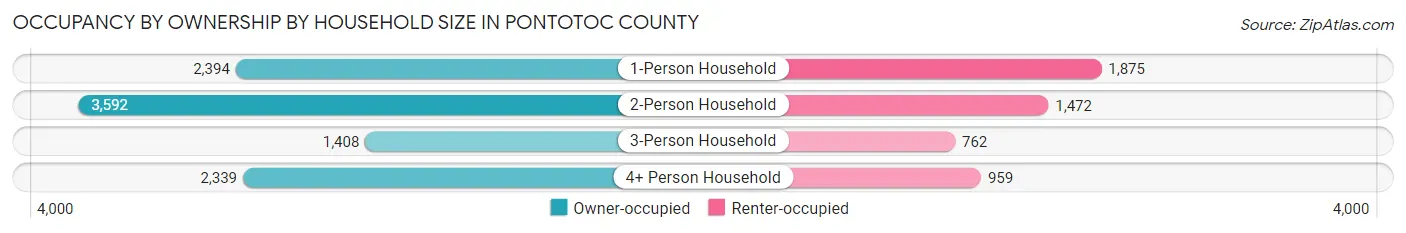
| Household Size | Owner-occupied | Renter-occupied |
| 1-Person Household | 2,394 (56.1%) | 1,875 (43.9%) |
| 2-Person Household | 3,592 (70.9%) | 1,472 (29.1%) |
| 3-Person Household | 1,408 (64.9%) | 762 (35.1%) |
| 4+ Person Household | 2,339 (70.9%) | 959 (29.1%) |
| Total Housing Units | 9,733 (65.8%) | 5,068 (34.2%) |
Occupancy by Educational Attainment in Pontotoc County
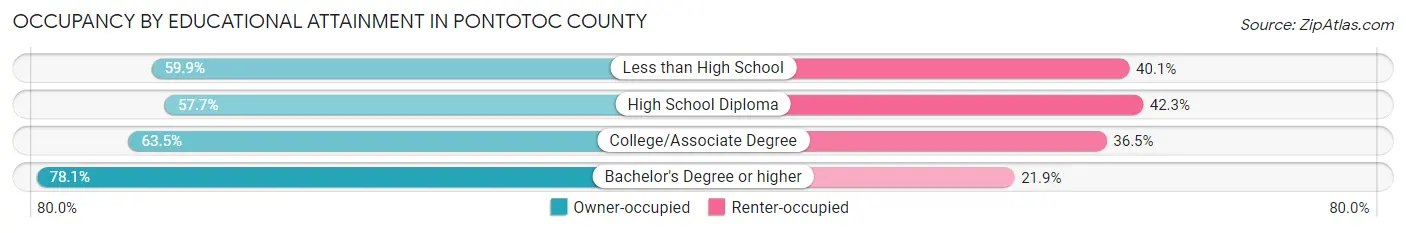
| Household Size | Owner-occupied | Renter-occupied |
| Less than High School | 849 (59.9%) | 569 (40.1%) |
| High School Diploma | 2,481 (57.7%) | 1,818 (42.3%) |
| College/Associate Degree | 3,005 (63.5%) | 1,728 (36.5%) |
| Bachelor's Degree or higher | 3,398 (78.1%) | 953 (21.9%) |
Occupancy by Age of Householder in Pontotoc County
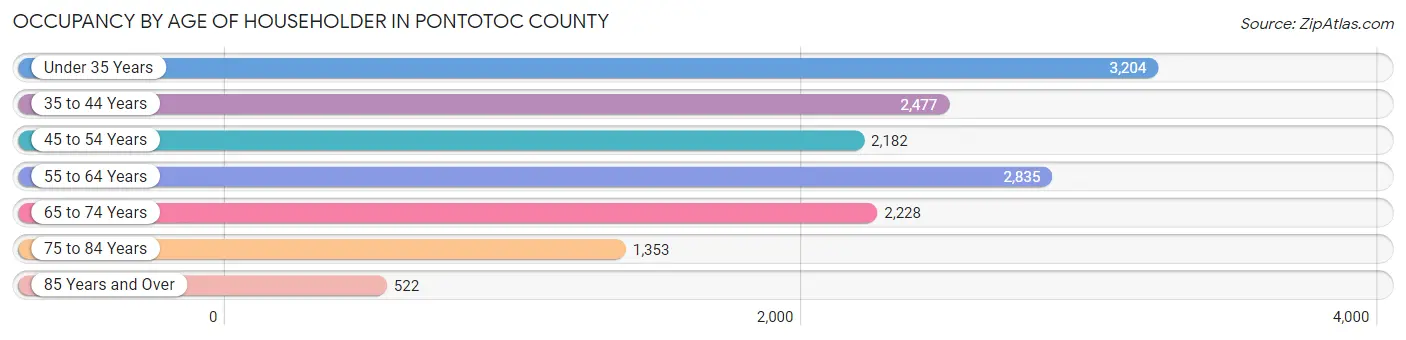
| Age Bracket | # Households | % Households |
| Under 35 Years | 3,204 | 21.6% |
| 35 to 44 Years | 2,477 | 16.7% |
| 45 to 54 Years | 2,182 | 14.7% |
| 55 to 64 Years | 2,835 | 19.2% |
| 65 to 74 Years | 2,228 | 15.0% |
| 75 to 84 Years | 1,353 | 9.1% |
| 85 Years and Over | 522 | 3.5% |
| Total | 14,801 | 100.0% |
Housing Finances in Pontotoc County
Median Income by Occupancy in Pontotoc County
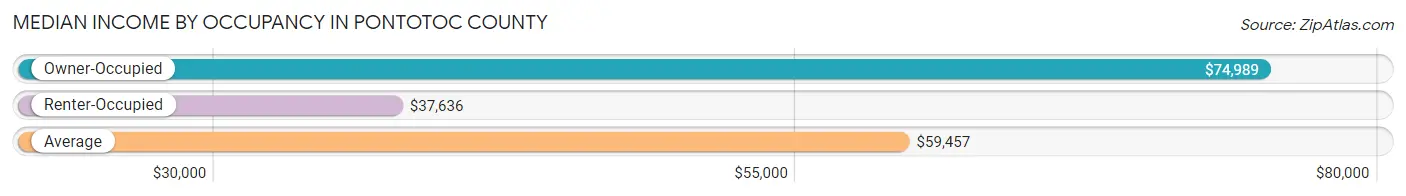
| Occupancy Type | # Households | Median Income |
| Owner-Occupied | 9,733 (65.8%) | $74,989 |
| Renter-Occupied | 5,068 (34.2%) | $37,636 |
| Average | 14,801 (100.0%) | $59,457 |
Occupancy by Householder Income Bracket in Pontotoc County
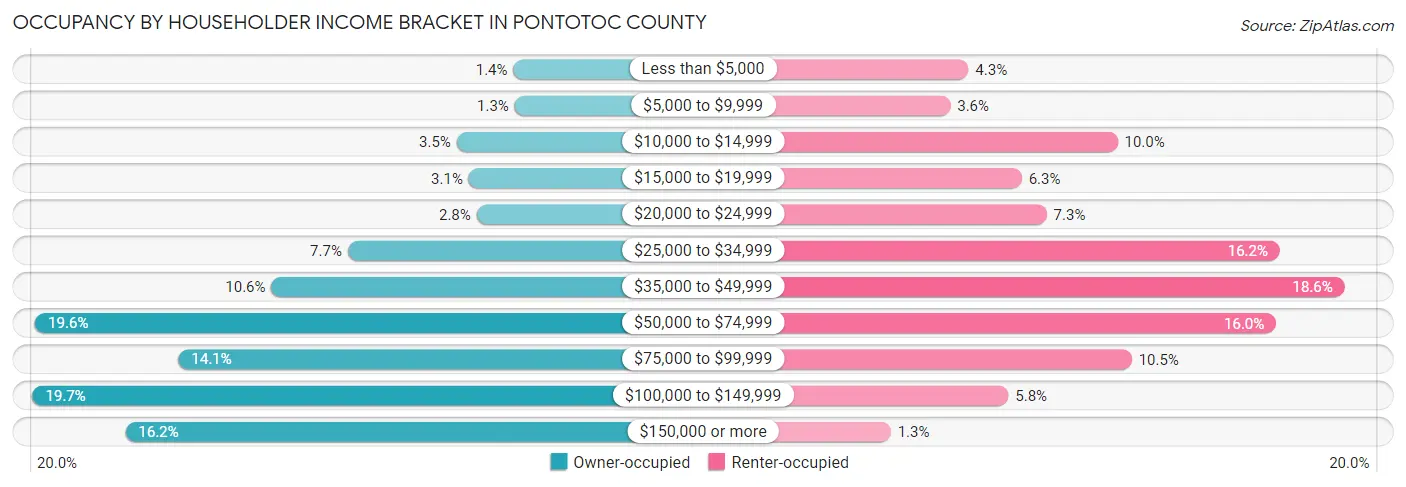
| Income Bracket | Owner-occupied | Renter-occupied |
| Less than $5,000 | 134 (1.4%) | 218 (4.3%) |
| $5,000 to $9,999 | 129 (1.3%) | 183 (3.6%) |
| $10,000 to $14,999 | 345 (3.5%) | 506 (10.0%) |
| $15,000 to $19,999 | 300 (3.1%) | 321 (6.3%) |
| $20,000 to $24,999 | 271 (2.8%) | 369 (7.3%) |
| $25,000 to $34,999 | 748 (7.7%) | 819 (16.2%) |
| $35,000 to $49,999 | 1,032 (10.6%) | 944 (18.6%) |
| $50,000 to $74,999 | 1,908 (19.6%) | 812 (16.0%) |
| $75,000 to $99,999 | 1,376 (14.1%) | 533 (10.5%) |
| $100,000 to $149,999 | 1,917 (19.7%) | 295 (5.8%) |
| $150,000 or more | 1,573 (16.2%) | 68 (1.3%) |
| Total | 9,733 (100.0%) | 5,068 (100.0%) |
Monthly Housing Cost Tiers in Pontotoc County
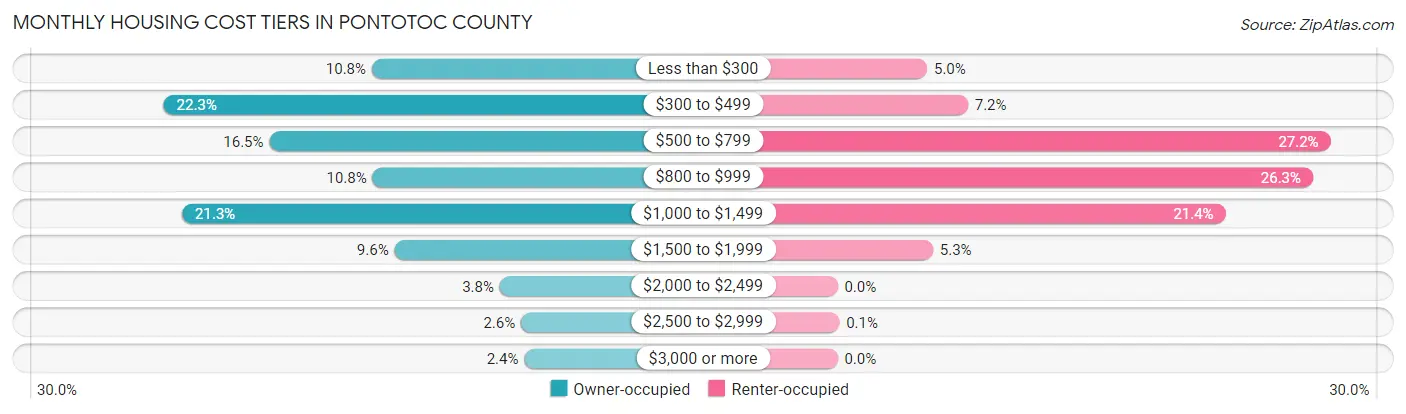
| Monthly Cost | Owner-occupied | Renter-occupied |
| Less than $300 | 1,053 (10.8%) | 251 (5.0%) |
| $300 to $499 | 2,172 (22.3%) | 365 (7.2%) |
| $500 to $799 | 1,604 (16.5%) | 1,380 (27.2%) |
| $800 to $999 | 1,049 (10.8%) | 1,331 (26.3%) |
| $1,000 to $1,499 | 2,074 (21.3%) | 1,086 (21.4%) |
| $1,500 to $1,999 | 931 (9.6%) | 267 (5.3%) |
| $2,000 to $2,499 | 365 (3.7%) | 0 (0.0%) |
| $2,500 to $2,999 | 251 (2.6%) | 5 (0.1%) |
| $3,000 or more | 234 (2.4%) | 0 (0.0%) |
| Total | 9,733 (100.0%) | 5,068 (100.0%) |
Physical Housing Characteristics in Pontotoc County
Housing Structures in Pontotoc County
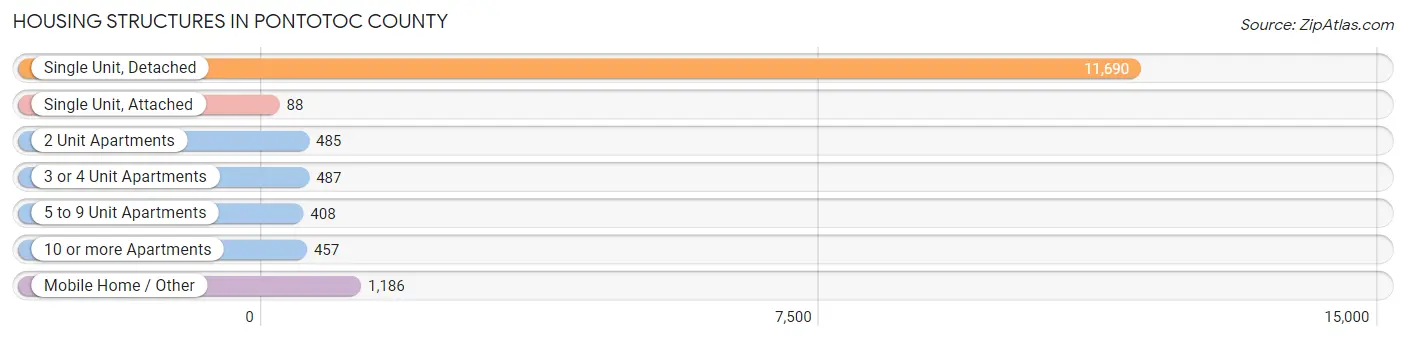
| Structure Type | # Housing Units | % Housing Units |
| Single Unit, Detached | 11,690 | 79.0% |
| Single Unit, Attached | 88 | 0.6% |
| 2 Unit Apartments | 485 | 3.3% |
| 3 or 4 Unit Apartments | 487 | 3.3% |
| 5 to 9 Unit Apartments | 408 | 2.8% |
| 10 or more Apartments | 457 | 3.1% |
| Mobile Home / Other | 1,186 | 8.0% |
| Total | 14,801 | 100.0% |
Housing Structures by Occupancy in Pontotoc County
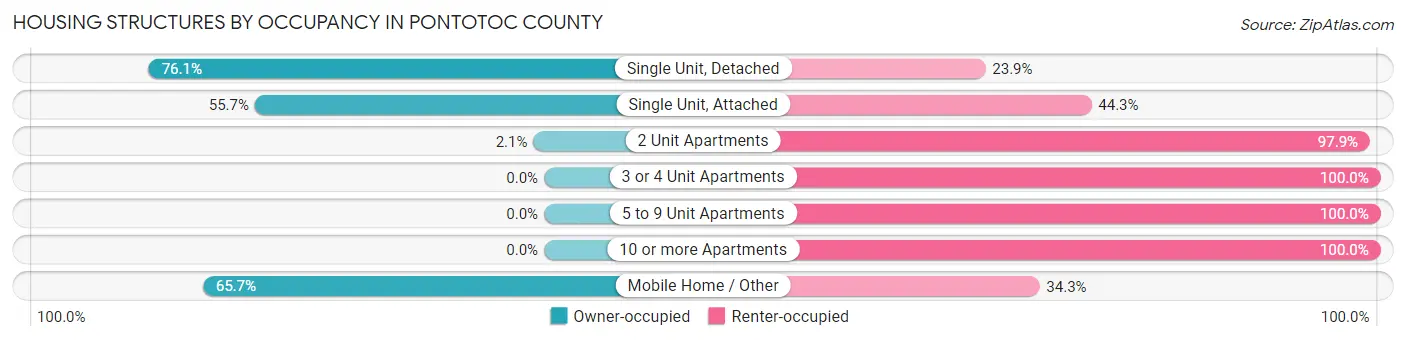
| Structure Type | Owner-occupied | Renter-occupied |
| Single Unit, Detached | 8,895 (76.1%) | 2,795 (23.9%) |
| Single Unit, Attached | 49 (55.7%) | 39 (44.3%) |
| 2 Unit Apartments | 10 (2.1%) | 475 (97.9%) |
| 3 or 4 Unit Apartments | 0 (0.0%) | 487 (100.0%) |
| 5 to 9 Unit Apartments | 0 (0.0%) | 408 (100.0%) |
| 10 or more Apartments | 0 (0.0%) | 457 (100.0%) |
| Mobile Home / Other | 779 (65.7%) | 407 (34.3%) |
| Total | 9,733 (65.8%) | 5,068 (34.2%) |
Housing Structures by Number of Rooms in Pontotoc County
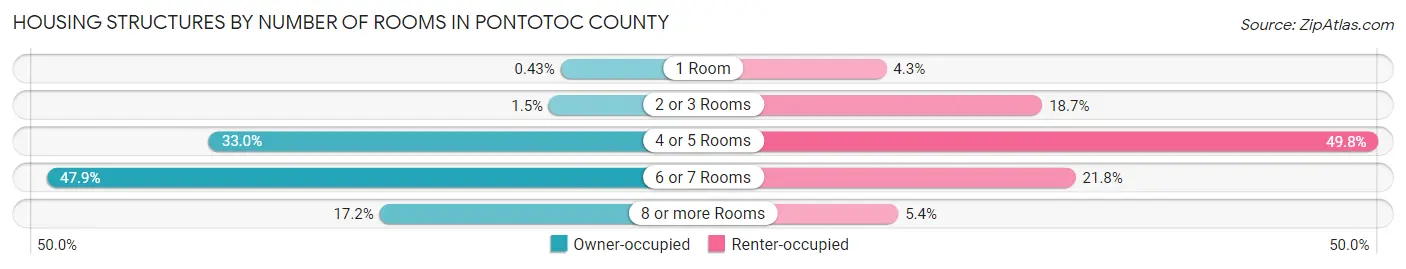
| Number of Rooms | Owner-occupied | Renter-occupied |
| 1 Room | 42 (0.4%) | 218 (4.3%) |
| 2 or 3 Rooms | 147 (1.5%) | 948 (18.7%) |
| 4 or 5 Rooms | 3,208 (33.0%) | 2,524 (49.8%) |
| 6 or 7 Rooms | 4,664 (47.9%) | 1,105 (21.8%) |
| 8 or more Rooms | 1,672 (17.2%) | 273 (5.4%) |
| Total | 9,733 (100.0%) | 5,068 (100.0%) |
Housing Structure by Heating Type in Pontotoc County
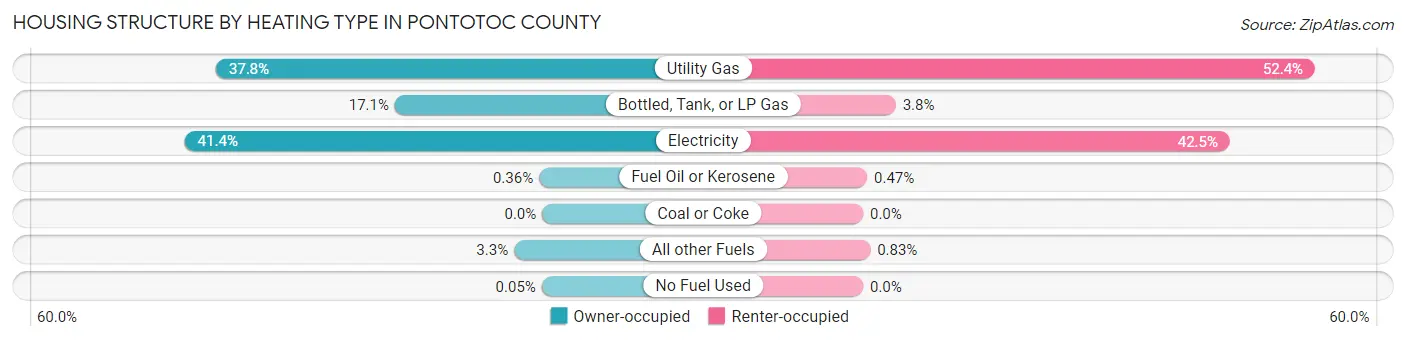
| Heating Type | Owner-occupied | Renter-occupied |
| Utility Gas | 3,681 (37.8%) | 2,655 (52.4%) |
| Bottled, Tank, or LP Gas | 1,662 (17.1%) | 192 (3.8%) |
| Electricity | 4,033 (41.4%) | 2,155 (42.5%) |
| Fuel Oil or Kerosene | 35 (0.4%) | 24 (0.5%) |
| Coal or Coke | 0 (0.0%) | 0 (0.0%) |
| All other Fuels | 317 (3.3%) | 42 (0.8%) |
| No Fuel Used | 5 (0.1%) | 0 (0.0%) |
| Total | 9,733 (100.0%) | 5,068 (100.0%) |
Household Vehicle Usage in Pontotoc County
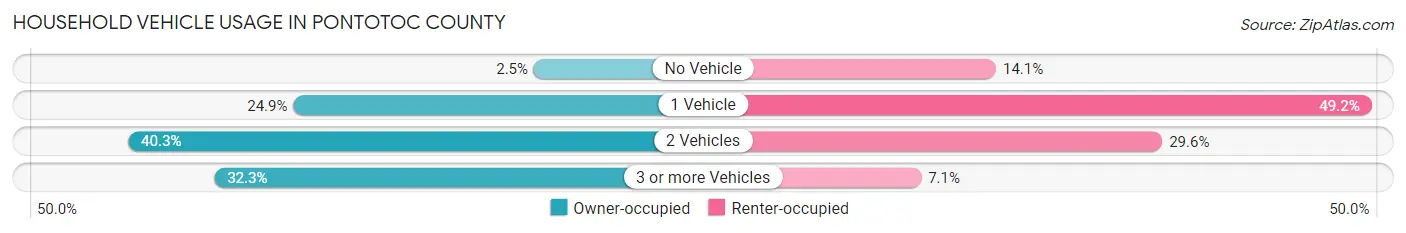
| Vehicles per Household | Owner-occupied | Renter-occupied |
| No Vehicle | 239 (2.5%) | 715 (14.1%) |
| 1 Vehicle | 2,425 (24.9%) | 2,491 (49.1%) |
| 2 Vehicles | 3,925 (40.3%) | 1,501 (29.6%) |
| 3 or more Vehicles | 3,144 (32.3%) | 361 (7.1%) |
| Total | 9,733 (100.0%) | 5,068 (100.0%) |
Real Estate & Mortgages in Pontotoc County
Real Estate and Mortgage Overview in Pontotoc County
| Characteristic | Without Mortgage | With Mortgage |
| Housing Units | 4,571 | 5,162 |
| Median Property Value | $125,800 | $166,000 |
| Median Household Income | $55,786 | $1,136 |
| Monthly Housing Costs | $415 | $224 |
| Real Estate Taxes | $677 | $231 |
Property Value by Mortgage Status in Pontotoc County
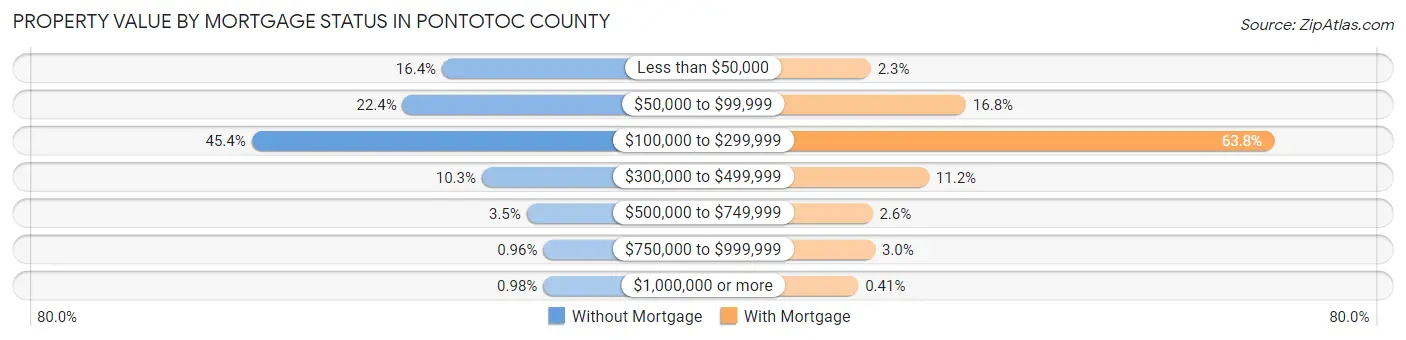
| Property Value | Without Mortgage | With Mortgage |
| Less than $50,000 | 750 (16.4%) | 119 (2.3%) |
| $50,000 to $99,999 | 1,024 (22.4%) | 868 (16.8%) |
| $100,000 to $299,999 | 2,076 (45.4%) | 3,291 (63.7%) |
| $300,000 to $499,999 | 472 (10.3%) | 577 (11.2%) |
| $500,000 to $749,999 | 160 (3.5%) | 133 (2.6%) |
| $750,000 to $999,999 | 44 (1.0%) | 153 (3.0%) |
| $1,000,000 or more | 45 (1.0%) | 21 (0.4%) |
| Total | 4,571 (100.0%) | 5,162 (100.0%) |
Household Income by Mortgage Status in Pontotoc County
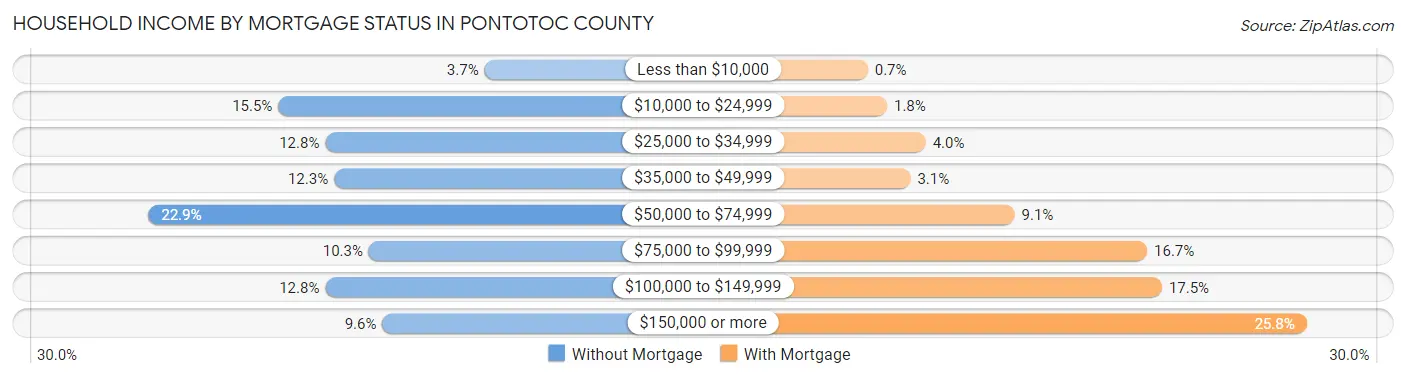
| Household Income | Without Mortgage | With Mortgage |
| Less than $10,000 | 170 (3.7%) | 36 (0.7%) |
| $10,000 to $24,999 | 709 (15.5%) | 93 (1.8%) |
| $25,000 to $34,999 | 586 (12.8%) | 207 (4.0%) |
| $35,000 to $49,999 | 563 (12.3%) | 162 (3.1%) |
| $50,000 to $74,999 | 1,048 (22.9%) | 469 (9.1%) |
| $75,000 to $99,999 | 472 (10.3%) | 860 (16.7%) |
| $100,000 to $149,999 | 586 (12.8%) | 904 (17.5%) |
| $150,000 or more | 437 (9.6%) | 1,331 (25.8%) |
| Total | 4,571 (100.0%) | 5,162 (100.0%) |
Property Value to Household Income Ratio in Pontotoc County
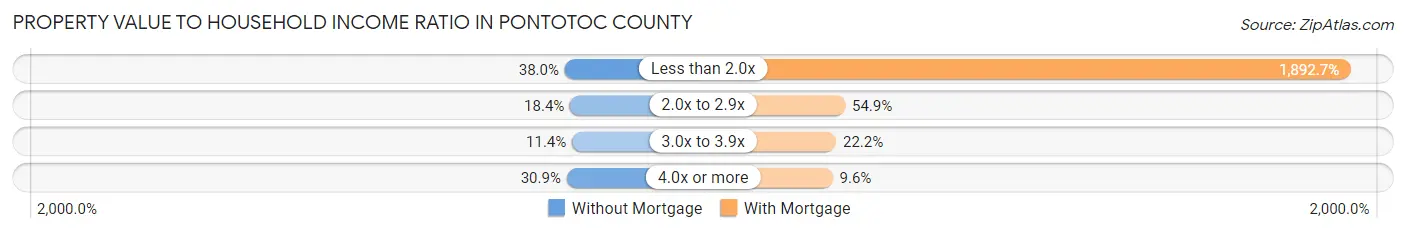
| Value-to-Income Ratio | Without Mortgage | With Mortgage |
| Less than 2.0x | 1,737 (38.0%) | 97,702 (1,892.7%) |
| 2.0x to 2.9x | 839 (18.3%) | 2,836 (54.9%) |
| 3.0x to 3.9x | 520 (11.4%) | 1,144 (22.2%) |
| 4.0x or more | 1,411 (30.9%) | 497 (9.6%) |
| Total | 4,571 (100.0%) | 5,162 (100.0%) |
Real Estate Taxes by Mortgage Status in Pontotoc County
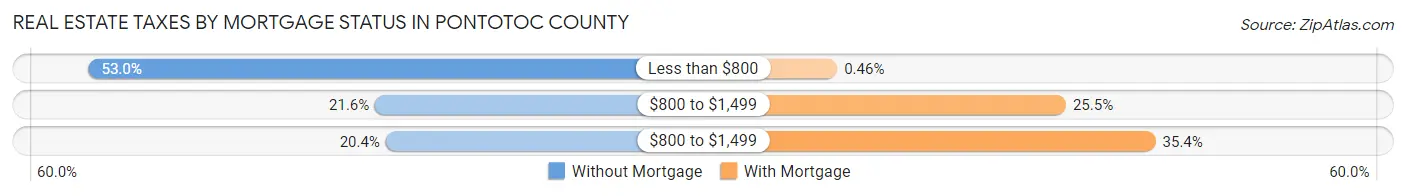
| Property Taxes | Without Mortgage | With Mortgage |
| Less than $800 | 2,422 (53.0%) | 24 (0.5%) |
| $800 to $1,499 | 987 (21.6%) | 1,318 (25.5%) |
| $800 to $1,499 | 934 (20.4%) | 1,825 (35.3%) |
| Total | 4,571 (100.0%) | 5,162 (100.0%) |
Health & Disability in Pontotoc County
Health Insurance Coverage by Age in Pontotoc County
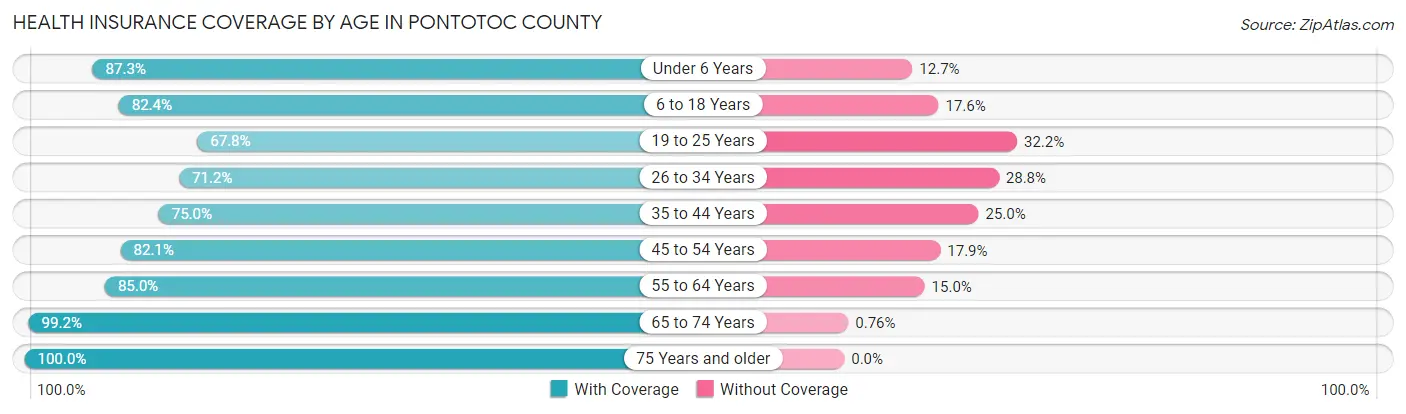
| Age Bracket | With Coverage | Without Coverage |
| Under 6 Years | 2,605 (87.3%) | 379 (12.7%) |
| 6 to 18 Years | 5,692 (82.4%) | 1,214 (17.6%) |
| 19 to 25 Years | 2,474 (67.8%) | 1,176 (32.2%) |
| 26 to 34 Years | 3,063 (71.2%) | 1,240 (28.8%) |
| 35 to 44 Years | 3,537 (75.0%) | 1,181 (25.0%) |
| 45 to 54 Years | 3,433 (82.1%) | 749 (17.9%) |
| 55 to 64 Years | 3,903 (85.0%) | 688 (15.0%) |
| 65 to 74 Years | 3,509 (99.2%) | 27 (0.8%) |
| 75 Years and older | 2,681 (100.0%) | 0 (0.0%) |
| Total | 30,897 (82.3%) | 6,654 (17.7%) |
Health Insurance Coverage by Citizenship Status in Pontotoc County
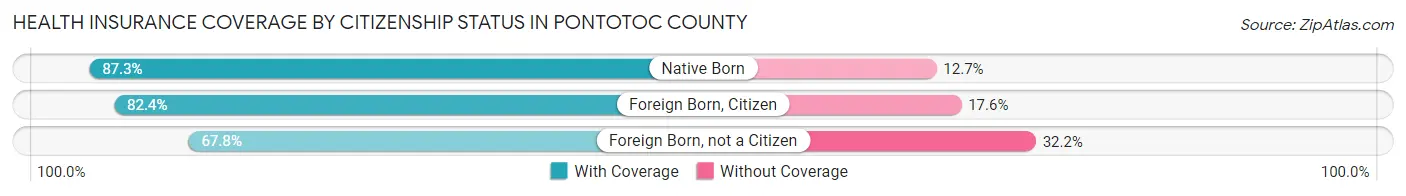
| Citizenship Status | With Coverage | Without Coverage |
| Native Born | 2,605 (87.3%) | 379 (12.7%) |
| Foreign Born, Citizen | 5,692 (82.4%) | 1,214 (17.6%) |
| Foreign Born, not a Citizen | 2,474 (67.8%) | 1,176 (32.2%) |
Health Insurance Coverage by Household Income in Pontotoc County
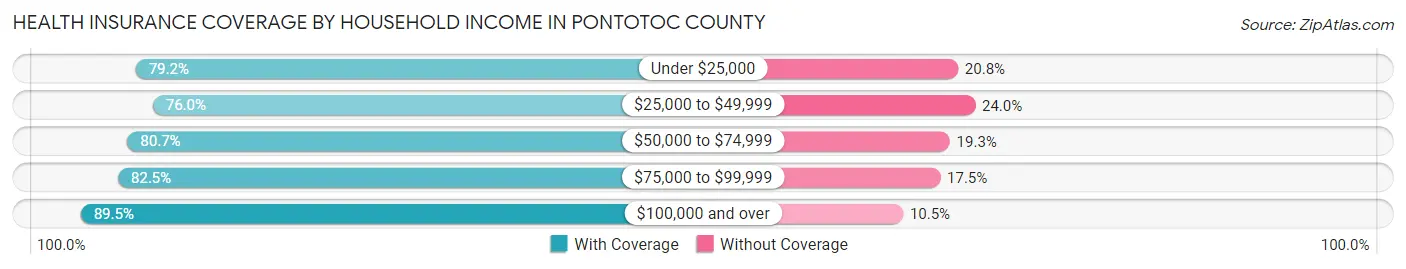
| Household Income | With Coverage | Without Coverage |
| Under $25,000 | 3,669 (79.2%) | 965 (20.8%) |
| $25,000 to $49,999 | 5,609 (76.0%) | 1,773 (24.0%) |
| $50,000 to $74,999 | 5,690 (80.7%) | 1,358 (19.3%) |
| $75,000 to $99,999 | 4,306 (82.5%) | 912 (17.5%) |
| $100,000 and over | 11,151 (89.5%) | 1,311 (10.5%) |
Public vs Private Health Insurance Coverage by Age in Pontotoc County
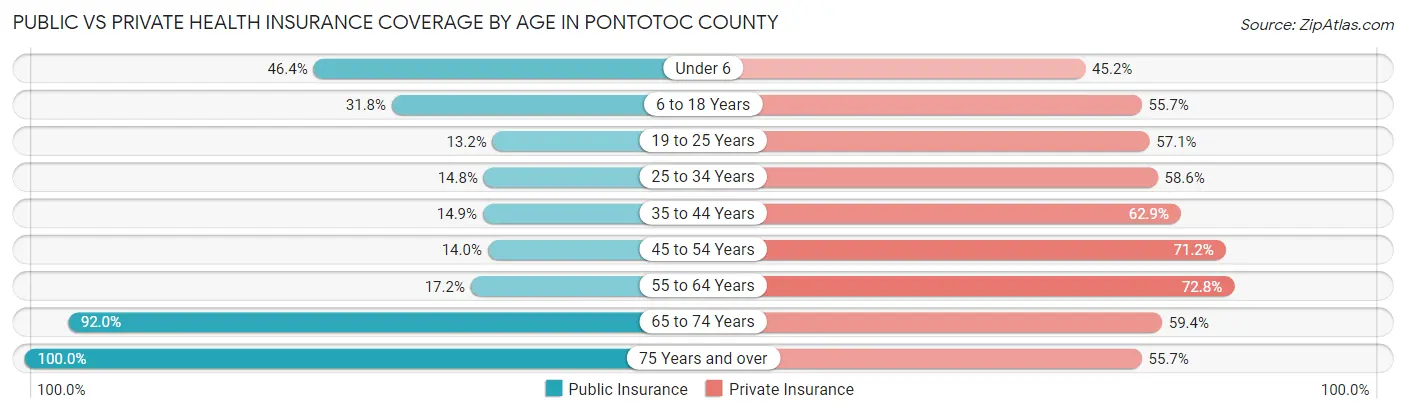
| Age Bracket | Public Insurance | Private Insurance |
| Under 6 | 1,384 (46.4%) | 1,348 (45.2%) |
| 6 to 18 Years | 2,198 (31.8%) | 3,843 (55.6%) |
| 19 to 25 Years | 480 (13.2%) | 2,084 (57.1%) |
| 25 to 34 Years | 636 (14.8%) | 2,522 (58.6%) |
| 35 to 44 Years | 705 (14.9%) | 2,968 (62.9%) |
| 45 to 54 Years | 587 (14.0%) | 2,979 (71.2%) |
| 55 to 64 Years | 789 (17.2%) | 3,342 (72.8%) |
| 65 to 74 Years | 3,252 (92.0%) | 2,100 (59.4%) |
| 75 Years and over | 2,681 (100.0%) | 1,492 (55.6%) |
| Total | 12,712 (33.9%) | 22,678 (60.4%) |
Disability Status by Sex by Age in Pontotoc County
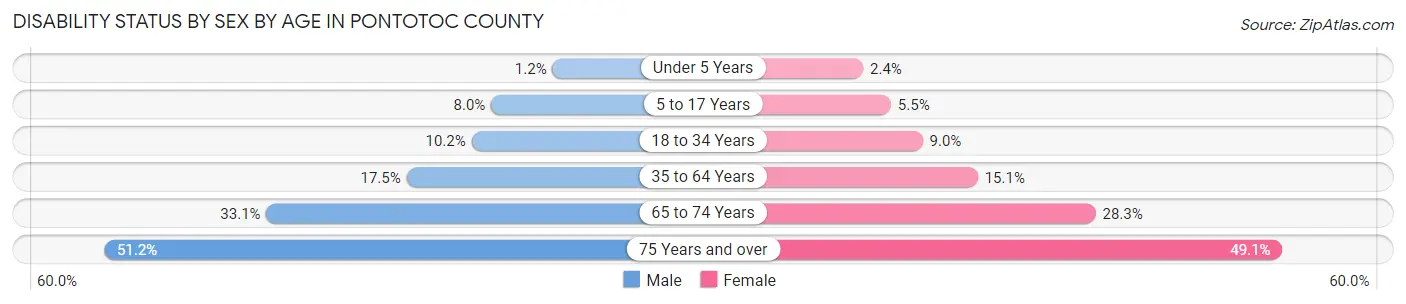
| Age Bracket | Male | Female |
| Under 5 Years | 16 (1.2%) | 29 (2.4%) |
| 5 to 17 Years | 279 (8.0%) | 184 (5.5%) |
| 18 to 34 Years | 426 (10.2%) | 387 (9.0%) |
| 35 to 64 Years | 1,168 (17.5%) | 1,030 (15.1%) |
| 65 to 74 Years | 535 (33.1%) | 542 (28.3%) |
| 75 Years and over | 571 (51.2%) | 768 (49.1%) |
Disability Class by Sex by Age in Pontotoc County
Disability Class: Hearing Difficulty
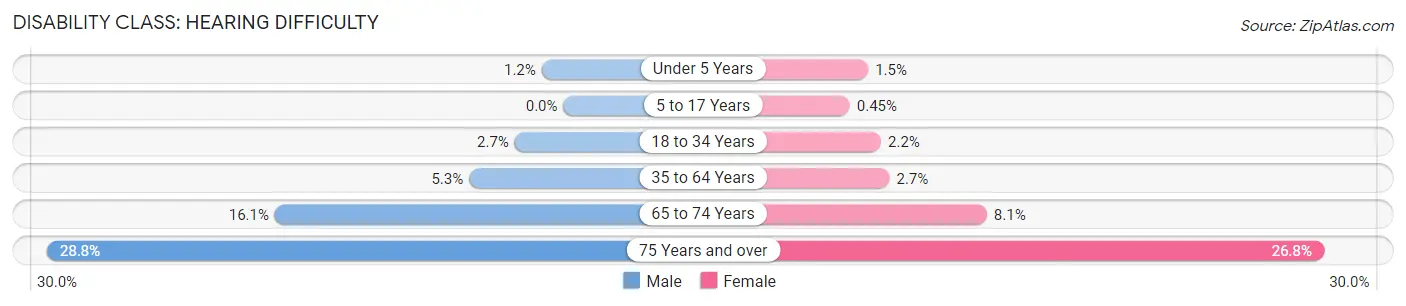
| Age Bracket | Male | Female |
| Under 5 Years | 16 (1.2%) | 18 (1.5%) |
| 5 to 17 Years | 0 (0.0%) | 15 (0.4%) |
| 18 to 34 Years | 113 (2.7%) | 94 (2.2%) |
| 35 to 64 Years | 351 (5.2%) | 181 (2.7%) |
| 65 to 74 Years | 260 (16.1%) | 155 (8.1%) |
| 75 Years and over | 321 (28.8%) | 420 (26.8%) |
Disability Class: Vision Difficulty
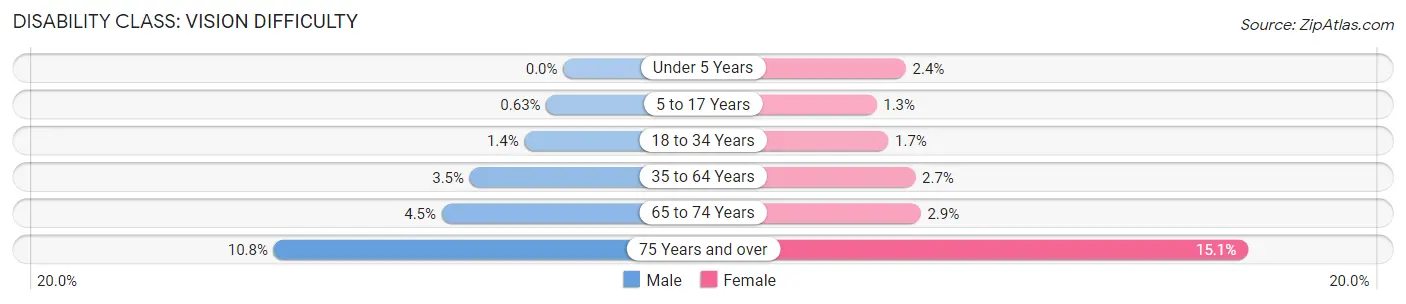
| Age Bracket | Male | Female |
| Under 5 Years | 0 (0.0%) | 29 (2.4%) |
| 5 to 17 Years | 22 (0.6%) | 43 (1.3%) |
| 18 to 34 Years | 60 (1.4%) | 74 (1.7%) |
| 35 to 64 Years | 232 (3.5%) | 185 (2.7%) |
| 65 to 74 Years | 73 (4.5%) | 56 (2.9%) |
| 75 Years and over | 120 (10.7%) | 236 (15.1%) |
Disability Class: Cognitive Difficulty
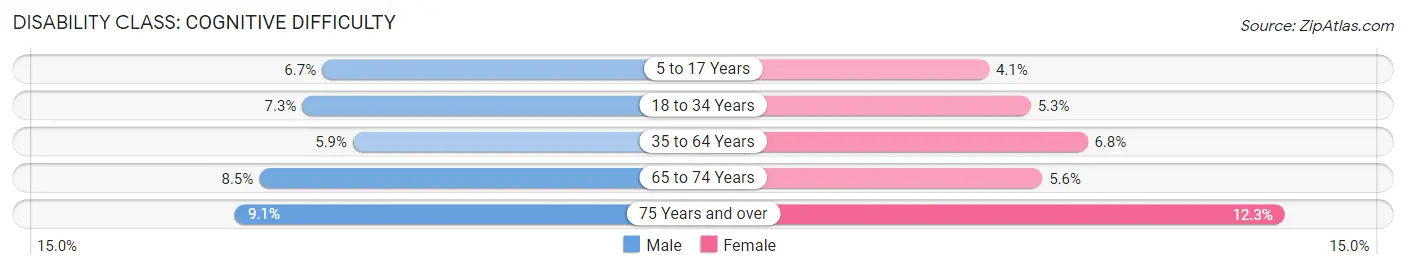
| Age Bracket | Male | Female |
| 5 to 17 Years | 233 (6.7%) | 138 (4.1%) |
| 18 to 34 Years | 303 (7.3%) | 226 (5.3%) |
| 35 to 64 Years | 392 (5.9%) | 465 (6.8%) |
| 65 to 74 Years | 137 (8.5%) | 107 (5.6%) |
| 75 Years and over | 102 (9.1%) | 193 (12.3%) |
Disability Class: Ambulatory Difficulty
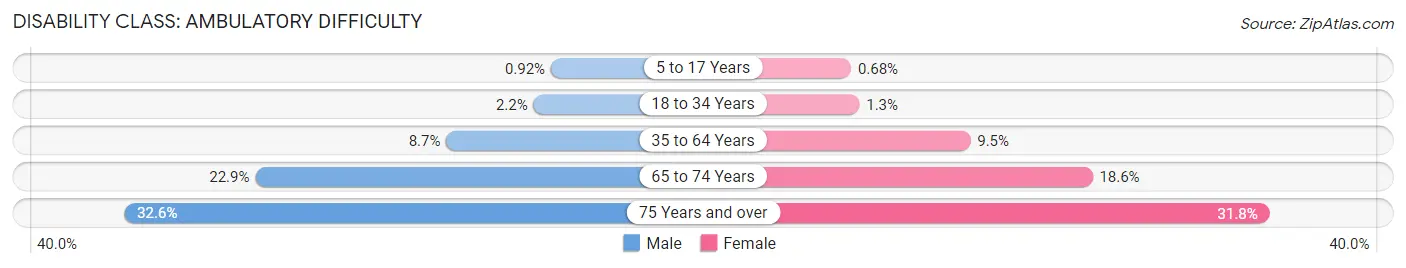
| Age Bracket | Male | Female |
| 5 to 17 Years | 32 (0.9%) | 23 (0.7%) |
| 18 to 34 Years | 92 (2.2%) | 56 (1.3%) |
| 35 to 64 Years | 581 (8.7%) | 649 (9.5%) |
| 65 to 74 Years | 370 (22.9%) | 357 (18.6%) |
| 75 Years and over | 364 (32.6%) | 497 (31.8%) |
Disability Class: Self-Care Difficulty
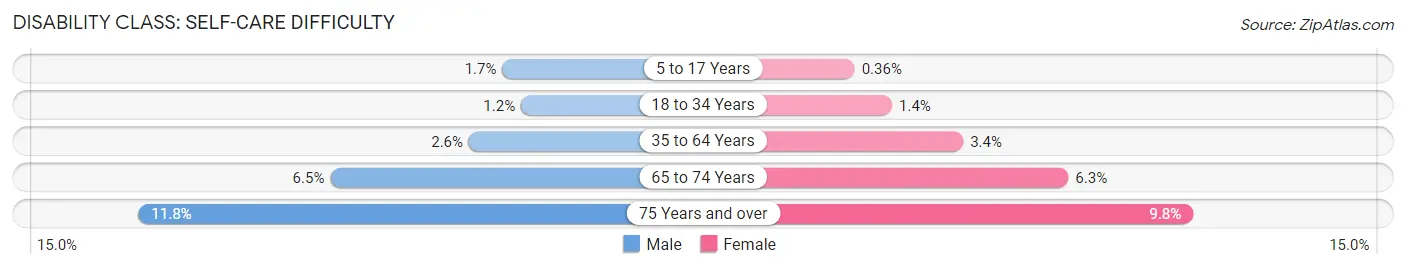
| Age Bracket | Male | Female |
| 5 to 17 Years | 59 (1.7%) | 12 (0.4%) |
| 18 to 34 Years | 49 (1.2%) | 60 (1.4%) |
| 35 to 64 Years | 176 (2.6%) | 230 (3.4%) |
| 65 to 74 Years | 105 (6.5%) | 121 (6.3%) |
| 75 Years and over | 132 (11.8%) | 153 (9.8%) |
Technology Access in Pontotoc County
Computing Device Access in Pontotoc County
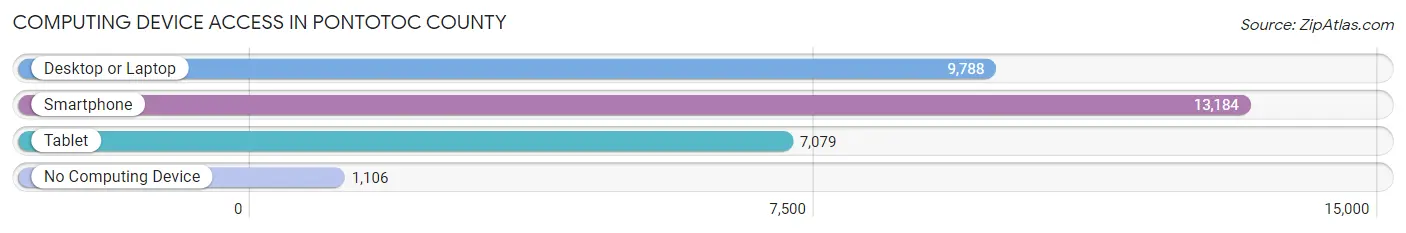
| Device Type | # Households | % Households |
| Desktop or Laptop | 9,788 | 66.1% |
| Smartphone | 13,184 | 89.1% |
| Tablet | 7,079 | 47.8% |
| No Computing Device | 1,106 | 7.5% |
| Total | 14,801 | 100.0% |
Internet Access in Pontotoc County
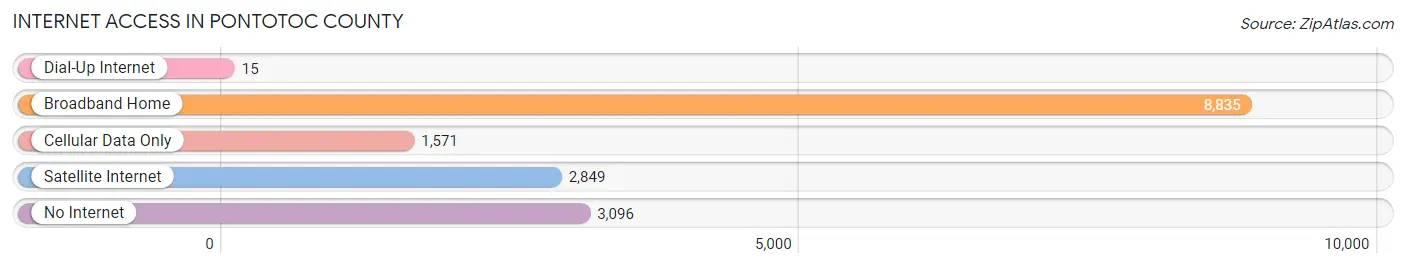
| Internet Type | # Households | % Households |
| Dial-Up Internet | 15 | 0.1% |
| Broadband Home | 8,835 | 59.7% |
| Cellular Data Only | 1,571 | 10.6% |
| Satellite Internet | 2,849 | 19.3% |
| No Internet | 3,096 | 20.9% |
| Total | 14,801 | 100.0% |
Pontotoc County Summary
Pontotoc County is located in the south-central region of Oklahoma, and is part of the Ardmore, Oklahoma Metropolitan Statistical Area. The county was created in 1907 from part of the Chickasaw Nation in Indian Territory. It is named for a Chickasaw leader, Chief Pontotoc, who lived in the area in the early 1800s. The county seat is Ada, which is also the largest city in the county.
Geography
Pontotoc County covers an area of 845 square miles, making it the 33rd largest county in Oklahoma. It is bordered by Coal, Johnston, and Atoka counties to the north, Murray and Garvin counties to the east, Carter and Love counties to the south, and Hughes and Seminole counties to the west. The county is mostly flat, with some rolling hills in the western part. The Washita River runs through the county, and there are several small lakes and ponds scattered throughout. The county is mostly rural, with the majority of the population living in the cities of Ada and Allen.
Demographics
As of the 2010 census, Pontotoc County had a population of 37,492. The racial makeup of the county was 79.2% White, 15.2% Native American, 1.2% Black or African American, 0.4% Asian, 0.1% Pacific Islander, 1.2% from other races, and 2.9% from two or more races. Hispanic or Latino of any race were 3.3% of the population.
The median income for a household in the county was $37,845, and the median income for a family was $45,945. The per capita income for the county was $19,845. About 13.2% of families and 16.7% of the population were below the poverty line, including 22.2% of those under age 18 and 11.2% of those age 65 or over.
Economy
Pontotoc County is largely agricultural, with the majority of the land used for farming and ranching. The county is home to several large farms, including the Ada Livestock Company, which is one of the largest cattle operations in the state. The county also has a large poultry industry, with several large poultry farms located in the area.
The county is also home to several manufacturing companies, including the Ada Glass Company, which produces glass products for the automotive industry. Other major employers in the county include the East Central University, the Ada Public Schools, and the Chickasaw Nation.
The county is served by the Ada Municipal Airport, which provides general aviation services. The county is also served by several major highways, including Interstate 35, US Highway 377, and US Highway 177.
Conclusion
Pontotoc County is a rural county located in south-central Oklahoma. It is home to a diverse population, with a strong agricultural and manufacturing base. The county is served by several major highways, and is home to the Ada Municipal Airport. The county is also home to several large farms and poultry operations, as well as East Central University and the Chickasaw Nation.
Common Questions
What is the Total Population of Pontotoc County?
Total Population of Pontotoc County is 38,116.
What is the Total Male Population of Pontotoc County?
Total Male Population of Pontotoc County is 18,629.
What is the Total Female Population of Pontotoc County?
Total Female Population of Pontotoc County is 19,487.
What is the Ratio of Males per 100 Females in Pontotoc County?
There are 95.60 Males per 100 Females in Pontotoc County.
What is the Ratio of Females per 100 Males in Pontotoc County?
There are 104.61 Females per 100 Males in Pontotoc County.
What is the Median Population Age in Pontotoc County?
Median Population Age in Pontotoc County is 37.3 Years.
What is the Average Family Size in Pontotoc County
Average Family Size in Pontotoc County is 3.1 People.
What is the Average Household Size in Pontotoc County
Average Household Size in Pontotoc County is 2.5 People.
What is Per Capita Income in Pontotoc County?
Per Capita income in Pontotoc County is $30,774.
What is the Median Family Income in Pontotoc County?
Median Family Income in Pontotoc County is $74,673.
What is the Median Household income in Pontotoc County?
Median Household Income in Pontotoc County is $59,457.
What is Income or Wage Gap in Pontotoc County?
Income or Wage Gap in Pontotoc County is 22.2%.
Women in Pontotoc County earn 77.8 cents for every dollar earned by a man.
What is Family Income Deficit in Pontotoc County?
Family Income Deficit in Pontotoc County is $9,089.
Families that are below poverty line in Pontotoc County earn $9,089 less on average than the poverty threshold level.
What is Inequality or Gini Index in Pontotoc County?
Inequality or Gini Index in Pontotoc County is 0.44.
How Large is the Labor Force in Pontotoc County?
There are 17,899 People in the Labor Forcein in Pontotoc County.
What is the Percentage of People in the Labor Force in Pontotoc County?
60.0% of People are in the Labor Force in Pontotoc County.
What is the Unemployment Rate in Pontotoc County?
Unemployment Rate in Pontotoc County is 4.3%.