Pittsburg County, OK
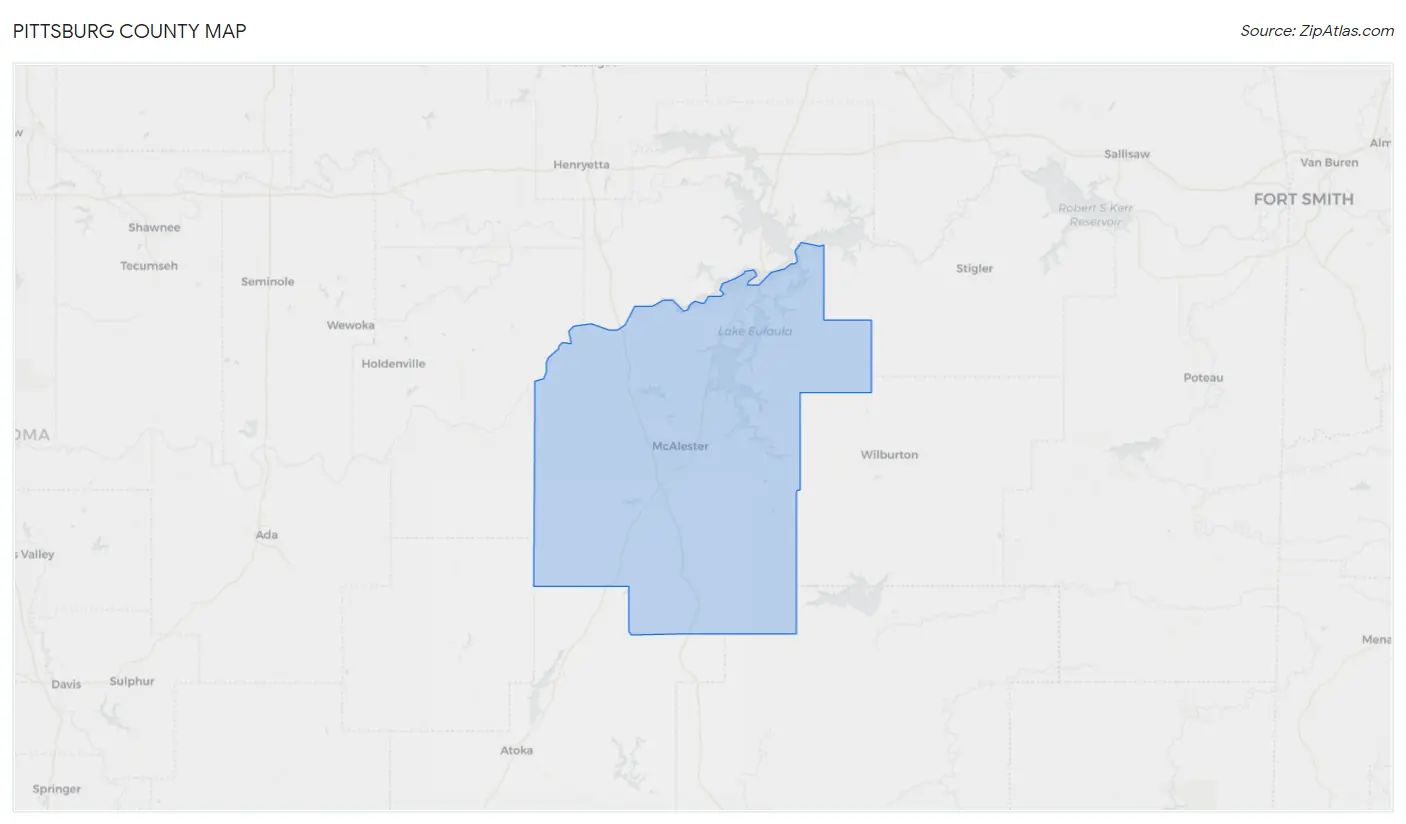
Pittsburg County Map
Pittsburg County Overview
43,758
TOTAL POPULATION
22,282
MALE POPULATION
21,476
FEMALE POPULATION
103.75
MALES / 100 FEMALES
96.38
FEMALES / 100 MALES
40.4
MEDIAN AGE
2.9
AVG FAMILY SIZE
2.4
AVG HOUSEHOLD SIZE
$28,257
PER CAPITA INCOME
$66,972
AVG FAMILY INCOME
$53,054
AVG HOUSEHOLD INCOME
35.7%
WAGE / INCOME GAP [ % ]
64.3¢/ $1
WAGE / INCOME GAP [ $ ]
$10,603
FAMILY INCOME DEFICIT
0.47
INEQUALITY / GINI INDEX
18,451
LABOR FORCE [ PEOPLE ]
52.8%
PERCENT IN LABOR FORCE
6.3%
UNEMPLOYMENT RATE
Pittsburg County Area Codes
Race in Pittsburg County
The most populous races in Pittsburg County are White / Caucasian (30,994 | 70.8%), Two or more Races (8,037 | 18.4%), and Native / Alaskan (3,002 | 6.9%).
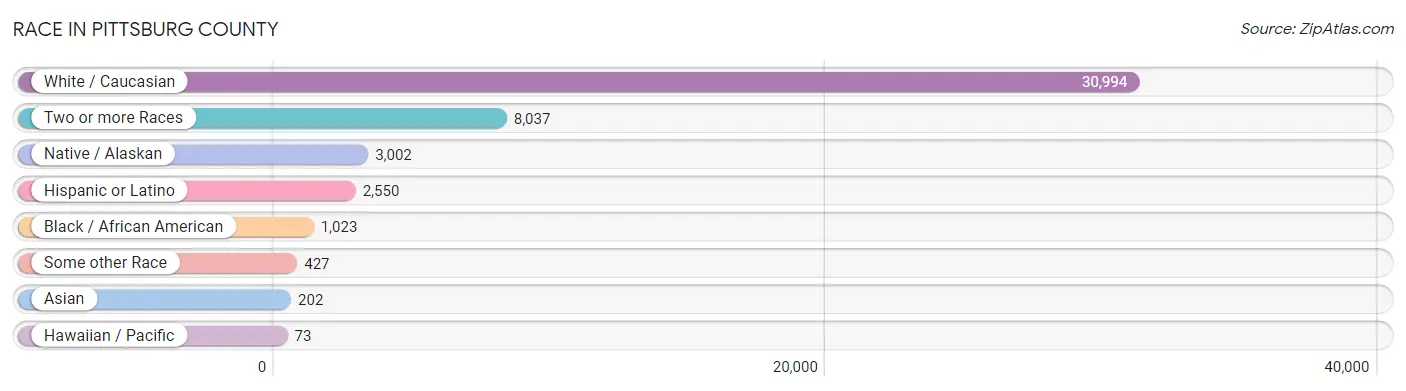
| Race | # Population | % Population |
| Asian | 202 | 0.5% |
| Black / African American | 1,023 | 2.3% |
| Hawaiian / Pacific | 73 | 0.2% |
| Hispanic or Latino | 2,550 | 5.8% |
| Native / Alaskan | 3,002 | 6.9% |
| White / Caucasian | 30,994 | 70.8% |
| Two or more Races | 8,037 | 18.4% |
| Some other Race | 427 | 1.0% |
| Total | 43,758 | 100.0% |
Ancestry in Pittsburg County
The most populous ancestries reported in Pittsburg County are Irish (6,424 | 14.7%), Choctaw (5,677 | 13.0%), German (5,246 | 12.0%), English (2,852 | 6.5%), and Cherokee (2,506 | 5.7%), together accounting for 51.9% of all Pittsburg County residents.

| Ancestry | # Population | % Population |
| African | 4 | 0.0% |
| Alaska Native | 7 | 0.0% |
| Alaskan Athabascan | 8 | 0.0% |
| American | 1,850 | 4.2% |
| Apache | 45 | 0.1% |
| Arab | 5 | 0.0% |
| Arapaho | 6 | 0.0% |
| Armenian | 3 | 0.0% |
| Australian | 34 | 0.1% |
| Austrian | 9 | 0.0% |
| Belgian | 22 | 0.1% |
| Bhutanese | 53 | 0.1% |
| Blackfeet | 41 | 0.1% |
| Brazilian | 17 | 0.0% |
| British | 920 | 2.1% |
| Burmese | 72 | 0.2% |
| Cajun | 12 | 0.0% |
| Canadian | 17 | 0.0% |
| Central American | 26 | 0.1% |
| Cherokee | 2,506 | 5.7% |
| Cheyenne | 41 | 0.1% |
| Chickasaw | 408 | 0.9% |
| Chippewa | 52 | 0.1% |
| Choctaw | 5,677 | 13.0% |
| Comanche | 106 | 0.2% |
| Creek | 411 | 0.9% |
| Croatian | 7 | 0.0% |
| Crow | 4 | 0.0% |
| Cuban | 4 | 0.0% |
| Czech | 43 | 0.1% |
| Czechoslovakian | 46 | 0.1% |
| Danish | 22 | 0.1% |
| Delaware | 1 | 0.0% |
| Dutch | 886 | 2.0% |
| Dutch West Indian | 133 | 0.3% |
| Eastern European | 24 | 0.1% |
| English | 2,852 | 6.5% |
| Ethiopian | 6 | 0.0% |
| European | 329 | 0.7% |
| Finnish | 43 | 0.1% |
| French | 527 | 1.2% |
| French Canadian | 96 | 0.2% |
| German | 5,246 | 12.0% |
| German Russian | 9 | 0.0% |
| Ghanaian | 2 | 0.0% |
| Greek | 14 | 0.0% |
| Guamanian / Chamorro | 35 | 0.1% |
| Guatemalan | 20 | 0.1% |
| Hungarian | 28 | 0.1% |
| Icelander | 7 | 0.0% |
| Indian (Asian) | 39 | 0.1% |
| Iranian | 2 | 0.0% |
| Irish | 6,424 | 14.7% |
| Iroquois | 27 | 0.1% |
| Italian | 1,825 | 4.2% |
| Jamaican | 5 | 0.0% |
| Kiowa | 69 | 0.2% |
| Korean | 92 | 0.2% |
| Liberian | 5 | 0.0% |
| Lithuanian | 84 | 0.2% |
| Malaysian | 5 | 0.0% |
| Mexican | 2,224 | 5.1% |
| Native Hawaiian | 12 | 0.0% |
| Navajo | 51 | 0.1% |
| Nicaraguan | 4 | 0.0% |
| Nigerian | 38 | 0.1% |
| Northern European | 34 | 0.1% |
| Norwegian | 158 | 0.4% |
| Osage | 59 | 0.1% |
| Pakistani | 25 | 0.1% |
| Polish | 397 | 0.9% |
| Portuguese | 182 | 0.4% |
| Potawatomi | 129 | 0.3% |
| Puerto Rican | 139 | 0.3% |
| Romanian | 5 | 0.0% |
| Russian | 90 | 0.2% |
| Salvadoran | 2 | 0.0% |
| Samoan | 41 | 0.1% |
| Scandinavian | 104 | 0.2% |
| Scotch-Irish | 368 | 0.8% |
| Scottish | 678 | 1.5% |
| Seminole | 73 | 0.2% |
| Shoshone | 31 | 0.1% |
| Sioux | 44 | 0.1% |
| Slavic | 7 | 0.0% |
| Slovak | 3 | 0.0% |
| Slovene | 6 | 0.0% |
| South African | 28 | 0.1% |
| South American | 3 | 0.0% |
| Spaniard | 81 | 0.2% |
| Spanish | 26 | 0.1% |
| Sri Lankan | 46 | 0.1% |
| Subsaharan African | 83 | 0.2% |
| Swedish | 160 | 0.4% |
| Swiss | 31 | 0.1% |
| Thai | 46 | 0.1% |
| Ukrainian | 34 | 0.1% |
| Venezuelan | 3 | 0.0% |
| Welsh | 376 | 0.9% |
| Yugoslavian | 2 | 0.0% |
| Yup'ik | 8 | 0.0% | View All 101 Rows |
Immigrants in Pittsburg County
The most numerous immigrant groups reported in Pittsburg County came from Latin America (463 | 1.1%), Central America (460 | 1.1%), Mexico (446 | 1.0%), Asia (96 | 0.2%), and Europe (95 | 0.2%), together accounting for 3.6% of all Pittsburg County residents.
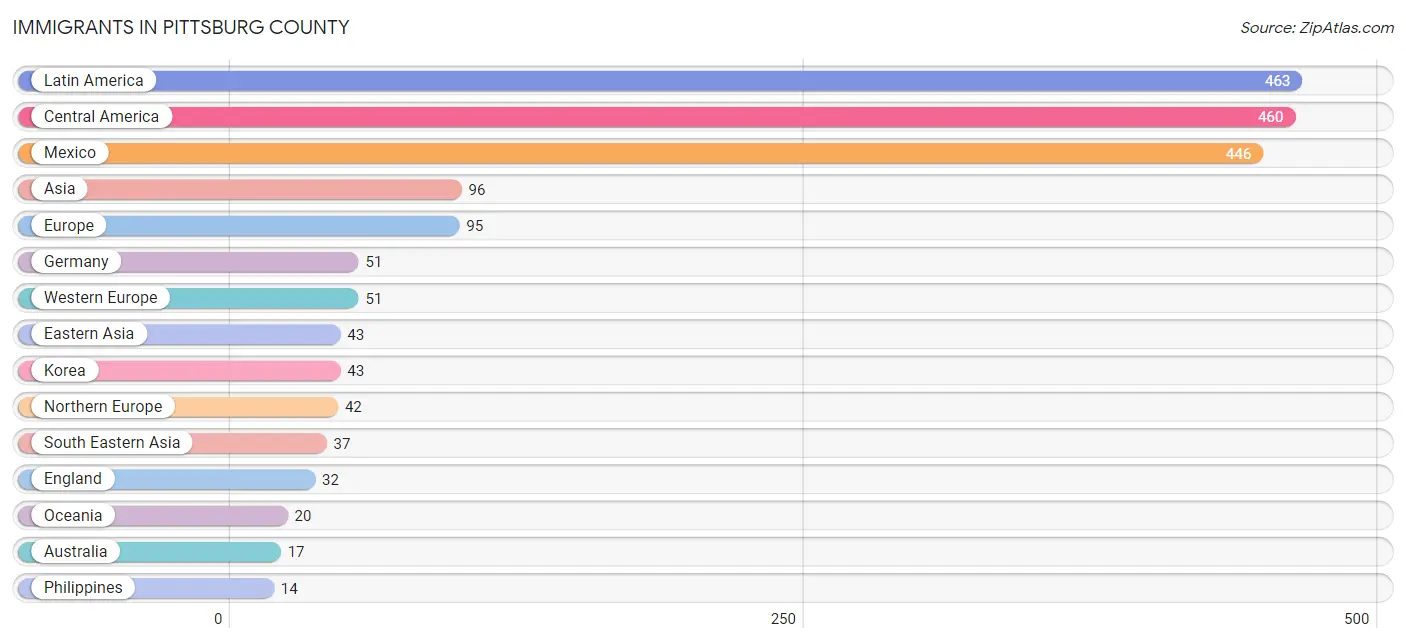
| Immigration Origin | # Population | % Population |
| Africa | 3 | 0.0% |
| Asia | 96 | 0.2% |
| Australia | 17 | 0.0% |
| Canada | 10 | 0.0% |
| Central America | 460 | 1.1% |
| Eastern Africa | 3 | 0.0% |
| Eastern Asia | 43 | 0.1% |
| Eastern Europe | 2 | 0.0% |
| England | 32 | 0.1% |
| Ethiopia | 3 | 0.0% |
| Europe | 95 | 0.2% |
| Germany | 51 | 0.1% |
| Honduras | 10 | 0.0% |
| India | 11 | 0.0% |
| Indonesia | 12 | 0.0% |
| Korea | 43 | 0.1% |
| Laos | 3 | 0.0% |
| Latin America | 463 | 1.1% |
| Lithuania | 2 | 0.0% |
| Mexico | 446 | 1.0% |
| Micronesia | 3 | 0.0% |
| Nicaragua | 4 | 0.0% |
| Northern Europe | 42 | 0.1% |
| Oceania | 20 | 0.1% |
| Philippines | 14 | 0.0% |
| Saudi Arabia | 5 | 0.0% |
| South America | 3 | 0.0% |
| South Central Asia | 11 | 0.0% |
| South Eastern Asia | 37 | 0.1% |
| Thailand | 2 | 0.0% |
| Venezuela | 3 | 0.0% |
| Vietnam | 6 | 0.0% |
| Western Asia | 5 | 0.0% |
| Western Europe | 51 | 0.1% | View All 34 Rows |
Sex and Age in Pittsburg County
Sex and Age in Pittsburg County
The most populous age groups in Pittsburg County are 30 to 34 Years (1,579 | 7.1%) for men and 55 to 59 Years (1,524 | 7.1%) for women.
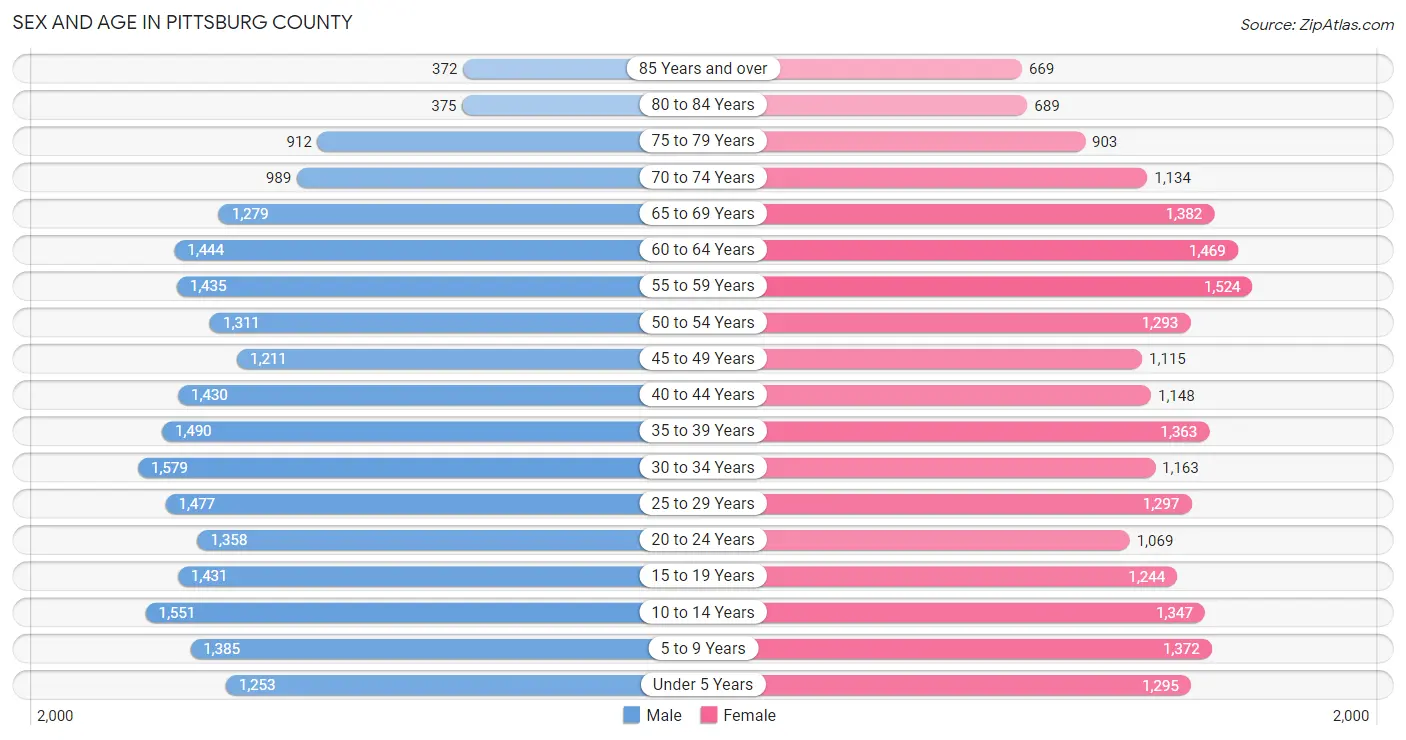
| Age Bracket | Male | Female |
| Under 5 Years | 1,253 (5.6%) | 1,295 (6.0%) |
| 5 to 9 Years | 1,385 (6.2%) | 1,372 (6.4%) |
| 10 to 14 Years | 1,551 (7.0%) | 1,347 (6.3%) |
| 15 to 19 Years | 1,431 (6.4%) | 1,244 (5.8%) |
| 20 to 24 Years | 1,358 (6.1%) | 1,069 (5.0%) |
| 25 to 29 Years | 1,477 (6.6%) | 1,297 (6.0%) |
| 30 to 34 Years | 1,579 (7.1%) | 1,163 (5.4%) |
| 35 to 39 Years | 1,490 (6.7%) | 1,363 (6.4%) |
| 40 to 44 Years | 1,430 (6.4%) | 1,148 (5.3%) |
| 45 to 49 Years | 1,211 (5.4%) | 1,115 (5.2%) |
| 50 to 54 Years | 1,311 (5.9%) | 1,293 (6.0%) |
| 55 to 59 Years | 1,435 (6.4%) | 1,524 (7.1%) |
| 60 to 64 Years | 1,444 (6.5%) | 1,469 (6.8%) |
| 65 to 69 Years | 1,279 (5.7%) | 1,382 (6.4%) |
| 70 to 74 Years | 989 (4.4%) | 1,134 (5.3%) |
| 75 to 79 Years | 912 (4.1%) | 903 (4.2%) |
| 80 to 84 Years | 375 (1.7%) | 689 (3.2%) |
| 85 Years and over | 372 (1.7%) | 669 (3.1%) |
| Total | 22,282 (100.0%) | 21,476 (100.0%) |
Families and Households in Pittsburg County
Median Family Size in Pittsburg County
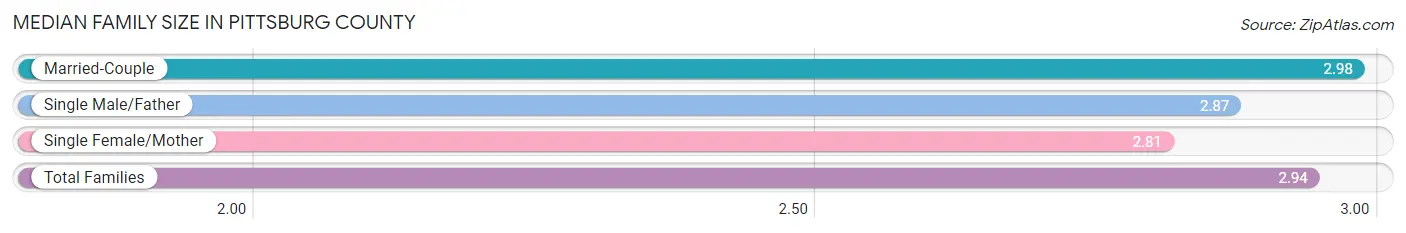
The median family size in Pittsburg County is 2.94 persons per family, with married-couple families (8,349 | 73.1%) accounting for the largest median family size of 2.98 persons per family. On the other hand, single female/mother families (2,246 | 19.7%) represent the smallest median family size with 2.81 persons per family.
| Family Type | # Families | Family Size |
| Married-Couple | 8,349 (73.1%) | 2.98 |
| Single Male/Father | 823 (7.2%) | 2.87 |
| Single Female/Mother | 2,246 (19.7%) | 2.81 |
| Total Families | 11,418 (100.0%) | 2.94 |
Median Household Size in Pittsburg County
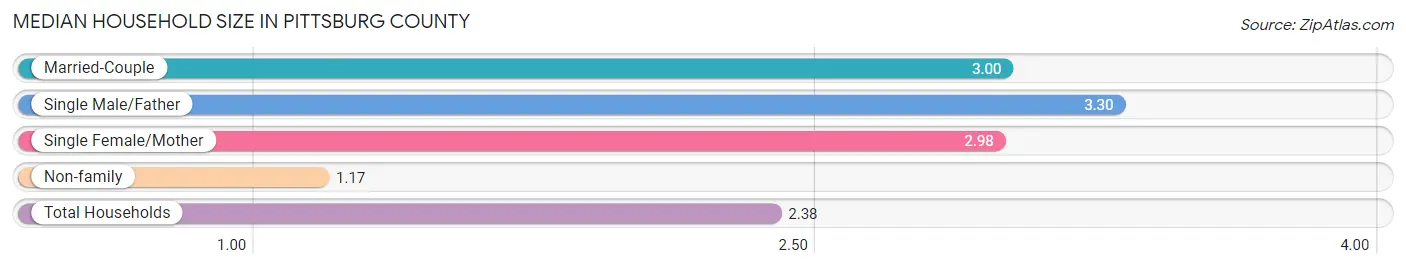
The median household size in Pittsburg County is 2.38 persons per household, with single male/father households (823 | 4.7%) accounting for the largest median household size of 3.3 persons per household. non-family households (5,986 | 34.4%) represent the smallest median household size with 1.17 persons per household.
| Household Type | # Households | Household Size |
| Married-Couple | 8,349 (48.0%) | 3.00 |
| Single Male/Father | 823 (4.7%) | 3.30 |
| Single Female/Mother | 2,246 (12.9%) | 2.98 |
| Non-family | 5,986 (34.4%) | 1.17 |
| Total Households | 17,404 (100.0%) | 2.38 |
Household Size by Marriage Status in Pittsburg County
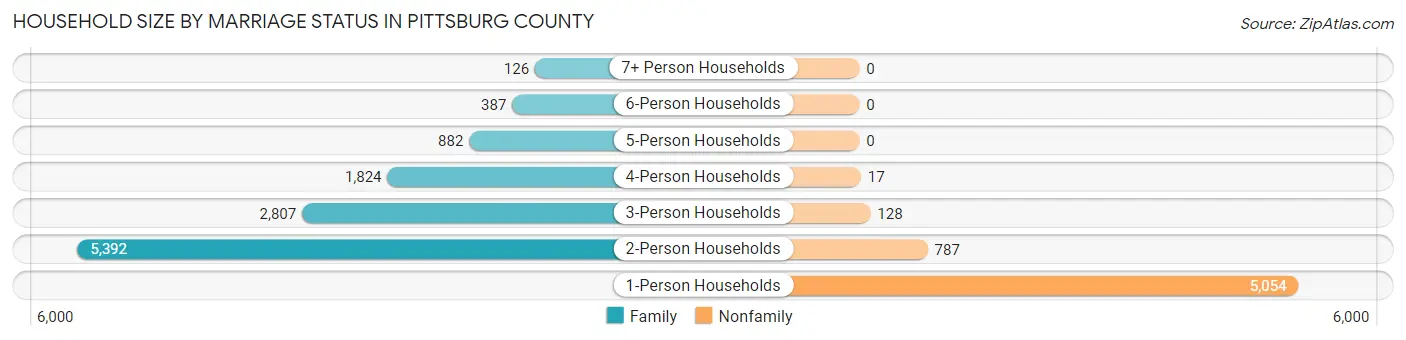
Out of a total of 17,404 households in Pittsburg County, 11,418 (65.6%) are family households, while 5,986 (34.4%) are nonfamily households. The most numerous type of family households are 2-person households, comprising 5,392, and the most common type of nonfamily households are 1-person households, comprising 5,054.
| Household Size | Family Households | Nonfamily Households |
| 1-Person Households | - | 5,054 (29.0%) |
| 2-Person Households | 5,392 (31.0%) | 787 (4.5%) |
| 3-Person Households | 2,807 (16.1%) | 128 (0.7%) |
| 4-Person Households | 1,824 (10.5%) | 17 (0.1%) |
| 5-Person Households | 882 (5.1%) | 0 (0.0%) |
| 6-Person Households | 387 (2.2%) | 0 (0.0%) |
| 7+ Person Households | 126 (0.7%) | 0 (0.0%) |
| Total | 11,418 (65.6%) | 5,986 (34.4%) |
Female Fertility in Pittsburg County
Fertility by Age in Pittsburg County
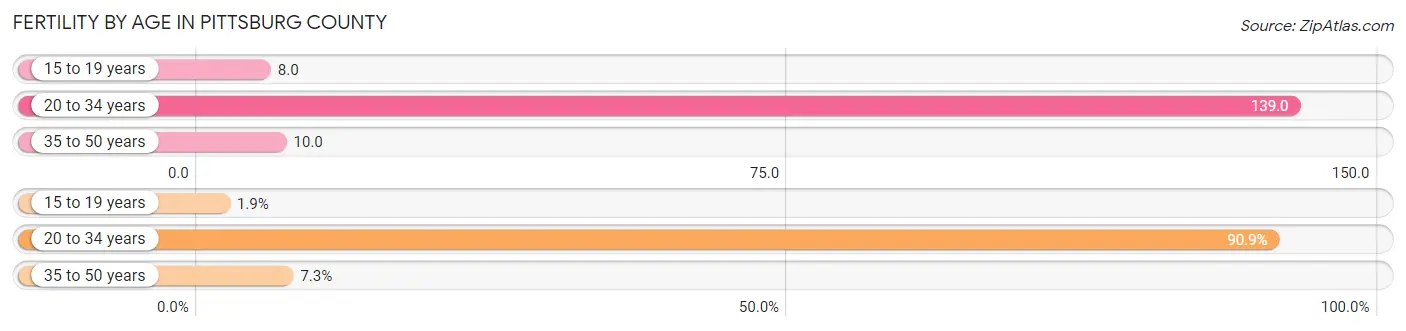
Average fertility rate in Pittsburg County is 62.0 births per 1,000 women. Women in the age bracket of 20 to 34 years have the highest fertility rate with 139.0 births per 1,000 women. Women in the age bracket of 20 to 34 years acount for 90.9% of all women with births.
| Age Bracket | Women with Births | Births / 1,000 Women |
| 15 to 19 years | 10 (1.9%) | 8.0 |
| 20 to 34 years | 489 (90.9%) | 139.0 |
| 35 to 50 years | 39 (7.2%) | 10.0 |
| Total | 538 (100.0%) | 62.0 |
Fertility by Age by Marriage Status in Pittsburg County
64.7% of women with births (538) in Pittsburg County are married. The highest percentage of unmarried women with births falls into 35 to 50 years age bracket with 38.5% of them unmarried at the time of birth, while the lowest percentage of unmarried women with births belong to 15 to 19 years age bracket with 0.0% of them unmarried.
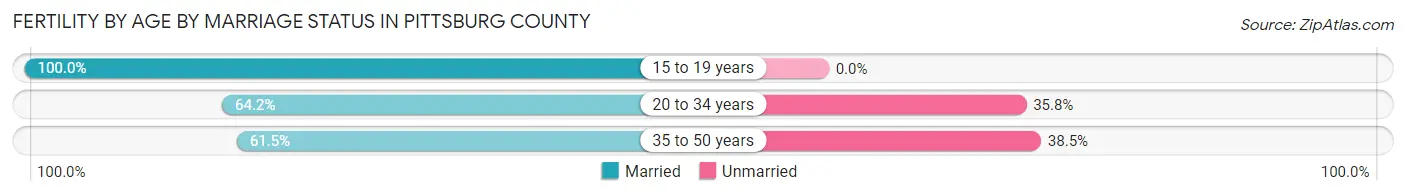
| Age Bracket | Married | Unmarried |
| 15 to 19 years | 10 (100.0%) | 0 (0.0%) |
| 20 to 34 years | 314 (64.2%) | 175 (35.8%) |
| 35 to 50 years | 24 (61.5%) | 15 (38.5%) |
| Total | 348 (64.7%) | 190 (35.3%) |
Fertility by Education in Pittsburg County
Average fertility rate in Pittsburg County is 62.0 births per 1,000 women. Women with the education attainment of graduate degree have the highest fertility rate of 94.0 births per 1,000 women, while women with the education attainment of high school diploma have the lowest fertility at 47.0 births per 1,000 women. Women with the education attainment of college or associate's degree represent 30.1% of all women with births.
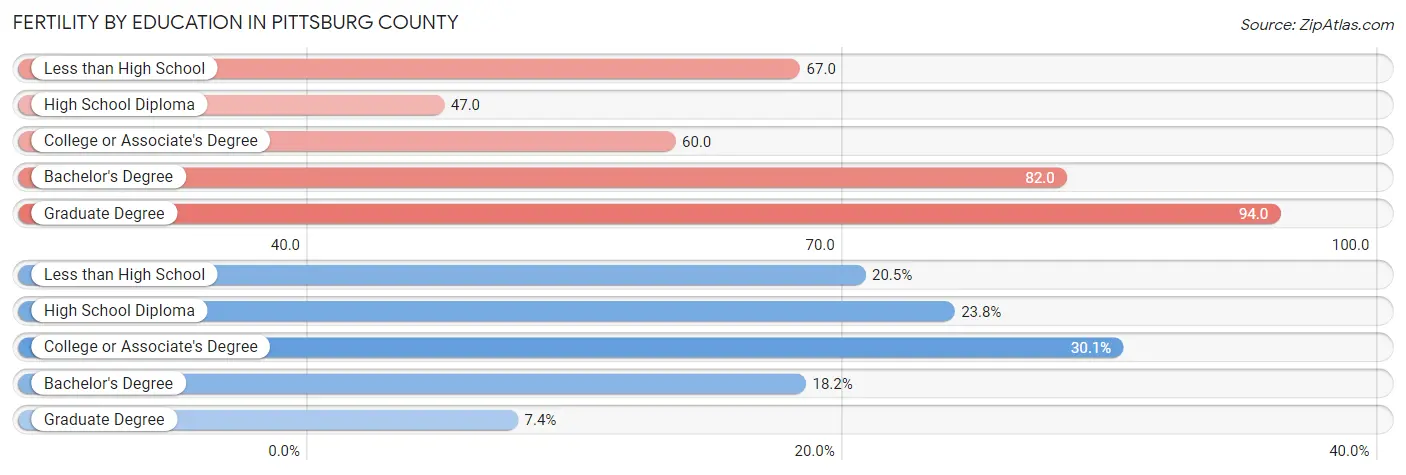
| Educational Attainment | Women with Births | Births / 1,000 Women |
| Less than High School | 110 (20.4%) | 67.0 |
| High School Diploma | 128 (23.8%) | 47.0 |
| College or Associate's Degree | 162 (30.1%) | 60.0 |
| Bachelor's Degree | 98 (18.2%) | 82.0 |
| Graduate Degree | 40 (7.4%) | 94.0 |
| Total | 538 (100.0%) | 62.0 |
Fertility by Education by Marriage Status in Pittsburg County
35.3% of women with births in Pittsburg County are unmarried. Women with the educational attainment of graduate degree are most likely to be married with 100.0% of them married at childbirth, while women with the educational attainment of less than high school are least likely to be married with 61.8% of them unmarried at childbirth.
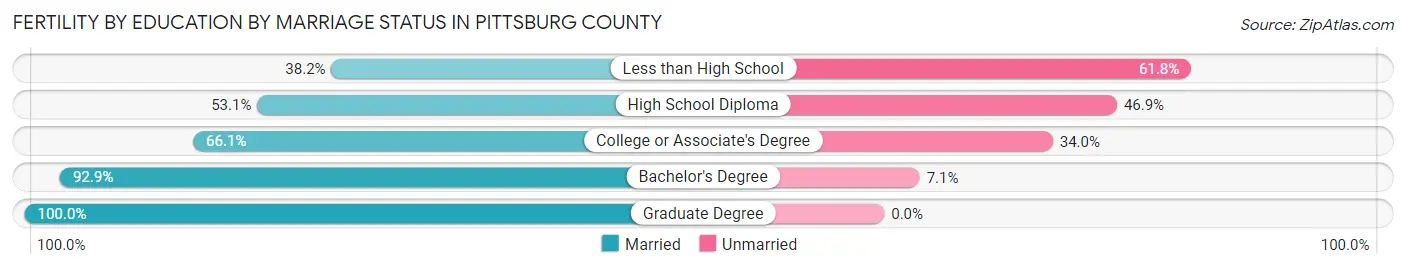
| Educational Attainment | Married | Unmarried |
| Less than High School | 42 (38.2%) | 68 (61.8%) |
| High School Diploma | 68 (53.1%) | 60 (46.9%) |
| College or Associate's Degree | 107 (66.0%) | 55 (34.0%) |
| Bachelor's Degree | 91 (92.9%) | 7 (7.1%) |
| Graduate Degree | 40 (100.0%) | 0 (0.0%) |
| Total | 348 (64.7%) | 190 (35.3%) |
Income in Pittsburg County
Income Overview in Pittsburg County
Per Capita Income in Pittsburg County is $28,257, while median incomes of families and households are $66,972 and $53,054 respectively.
| Characteristic | Number | Measure |
| Per Capita Income | 43,758 | $28,257 |
| Median Family Income | 11,418 | $66,972 |
| Mean Family Income | 11,418 | $84,271 |
| Median Household Income | 17,404 | $53,054 |
| Mean Household Income | 17,404 | $70,704 |
| Income Deficit | 11,418 | $10,603 |
| Wage / Income Gap (%) | 43,758 | 35.66% |
| Wage / Income Gap ($) | 43,758 | 64.34¢ per $1 |
| Gini / Inequality Index | 43,758 | 0.47 |
Earnings by Sex in Pittsburg County
Average Earnings in Pittsburg County are $34,048, $42,341 for men and $27,241 for women, a difference of 35.7%.
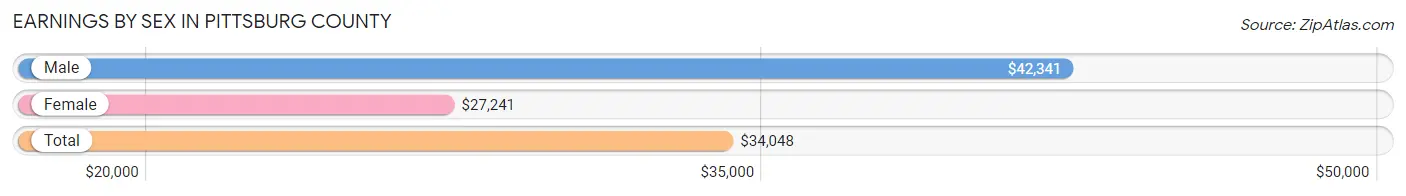
| Sex | Number | Average Earnings |
| Male | 10,116 (52.7%) | $42,341 |
| Female | 9,074 (47.3%) | $27,241 |
| Total | 19,190 (100.0%) | $34,048 |
Earnings by Sex by Income Bracket in Pittsburg County
The most common earnings brackets in Pittsburg County are $75,000 to $99,999 for men (1,103 | 10.9%) and $25,000 to $29,999 for women (831 | 9.2%).

| Income | Male | Female |
| $2,499 or less | 433 (4.3%) | 589 (6.5%) |
| $2,500 to $4,999 | 387 (3.8%) | 324 (3.6%) |
| $5,000 to $7,499 | 324 (3.2%) | 390 (4.3%) |
| $7,500 to $9,999 | 224 (2.2%) | 471 (5.2%) |
| $10,000 to $12,499 | 535 (5.3%) | 339 (3.7%) |
| $12,500 to $14,999 | 189 (1.9%) | 298 (3.3%) |
| $15,000 to $17,499 | 247 (2.4%) | 495 (5.5%) |
| $17,500 to $19,999 | 218 (2.2%) | 418 (4.6%) |
| $20,000 to $22,499 | 188 (1.9%) | 361 (4.0%) |
| $22,500 to $24,999 | 388 (3.8%) | 462 (5.1%) |
| $25,000 to $29,999 | 543 (5.4%) | 831 (9.2%) |
| $30,000 to $34,999 | 524 (5.2%) | 615 (6.8%) |
| $35,000 to $39,999 | 475 (4.7%) | 410 (4.5%) |
| $40,000 to $44,999 | 683 (6.8%) | 553 (6.1%) |
| $45,000 to $49,999 | 380 (3.8%) | 419 (4.6%) |
| $50,000 to $54,999 | 463 (4.6%) | 304 (3.4%) |
| $55,000 to $64,999 | 982 (9.7%) | 732 (8.1%) |
| $65,000 to $74,999 | 738 (7.3%) | 422 (4.6%) |
| $75,000 to $99,999 | 1,103 (10.9%) | 378 (4.2%) |
| $100,000+ | 1,092 (10.8%) | 263 (2.9%) |
| Total | 10,116 (100.0%) | 9,074 (100.0%) |
Earnings by Sex by Educational Attainment in Pittsburg County
Average earnings in Pittsburg County are $49,347 for men and $30,159 for women, a difference of 38.9%. Men with an educational attainment of graduate degree enjoy the highest average annual earnings of $71,010, while those with less than high school education earn the least with $35,169. Women with an educational attainment of graduate degree earn the most with the average annual earnings of $58,693, while those with less than high school education have the smallest earnings of $17,941.
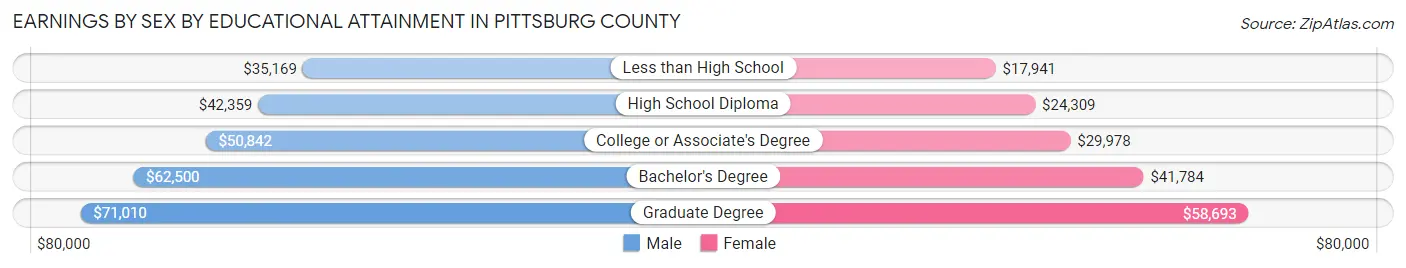
| Educational Attainment | Male Income | Female Income |
| Less than High School | $35,169 | $17,941 |
| High School Diploma | $42,359 | $24,309 |
| College or Associate's Degree | $50,842 | $29,978 |
| Bachelor's Degree | $62,500 | $41,784 |
| Graduate Degree | $71,010 | $58,693 |
| Total | $49,347 | $30,159 |
Family Income in Pittsburg County
Family Income Brackets in Pittsburg County
According to the Pittsburg County family income data, there are 2,101 families falling into the $50,000 to $74,999 income range, which is the most common income bracket and makes up 18.4% of all families. Conversely, the $10,000 to $14,999 income bracket is the least frequent group with only 400 families (3.5%) belonging to this category.
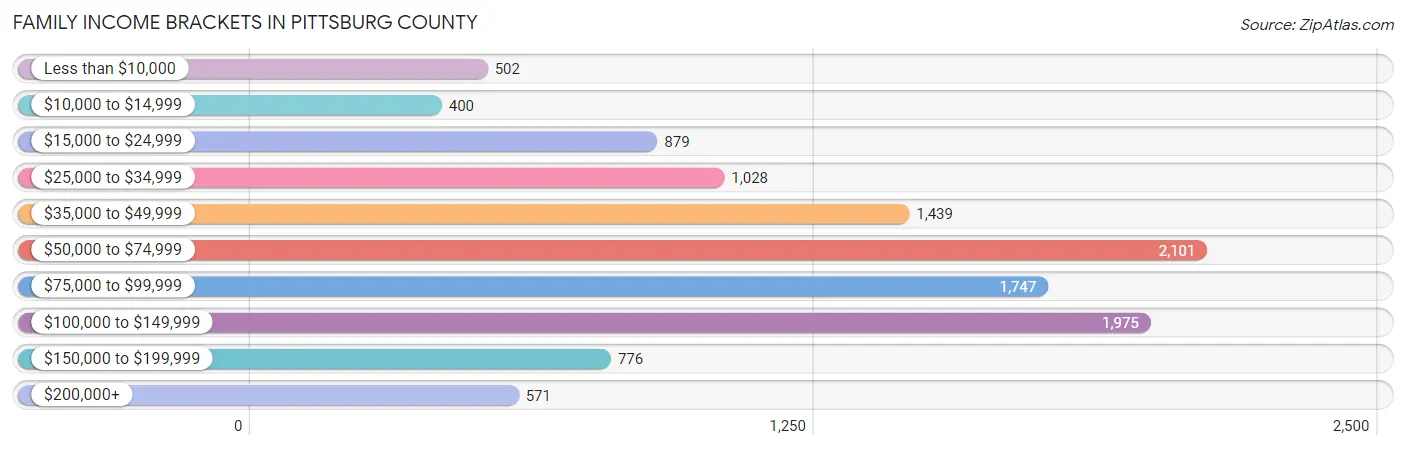
| Income Bracket | # Families | % Families |
| Less than $10,000 | 502 | 4.4% |
| $10,000 to $14,999 | 400 | 3.5% |
| $15,000 to $24,999 | 879 | 7.7% |
| $25,000 to $34,999 | 1,028 | 9.0% |
| $35,000 to $49,999 | 1,439 | 12.6% |
| $50,000 to $74,999 | 2,101 | 18.4% |
| $75,000 to $99,999 | 1,747 | 15.3% |
| $100,000 to $149,999 | 1,975 | 17.3% |
| $150,000 to $199,999 | 776 | 6.8% |
| $200,000+ | 571 | 5.0% |
Family Income by Famaliy Size in Pittsburg County
7+ person families (78 | 0.7%) account for the highest median family income in Pittsburg County with $104,286 per family, while 2-person families (5,781 | 50.6%) have the highest median income of $30,743 per family member.
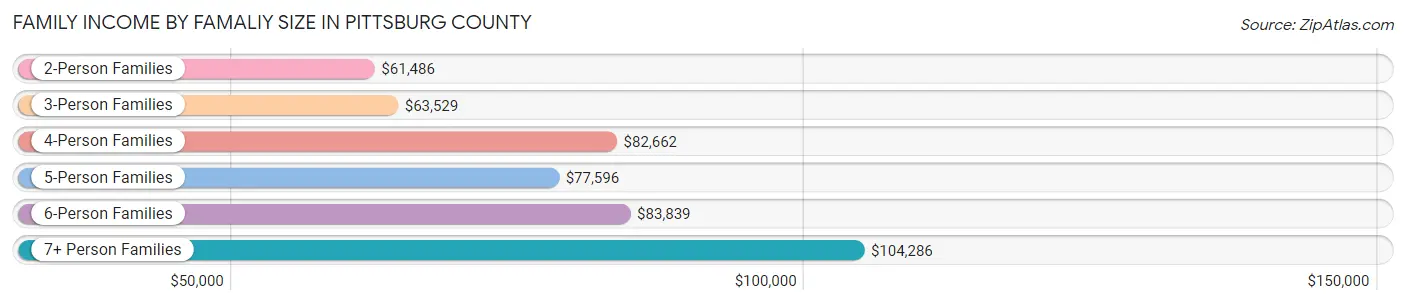
| Income Bracket | # Families | Median Income |
| 2-Person Families | 5,781 (50.6%) | $61,486 |
| 3-Person Families | 2,726 (23.9%) | $63,529 |
| 4-Person Families | 1,649 (14.4%) | $82,662 |
| 5-Person Families | 855 (7.5%) | $77,596 |
| 6-Person Families | 329 (2.9%) | $83,839 |
| 7+ Person Families | 78 (0.7%) | $104,286 |
| Total | 11,418 (100.0%) | $66,972 |
Family Income by Number of Earners in Pittsburg County
The median family income in Pittsburg County is $66,972, with families comprising 3+ earners (834) having the highest median family income of $151,105, while families with no earners (2,436) have the lowest median family income of $39,540, accounting for 7.3% and 21.3% of families, respectively.
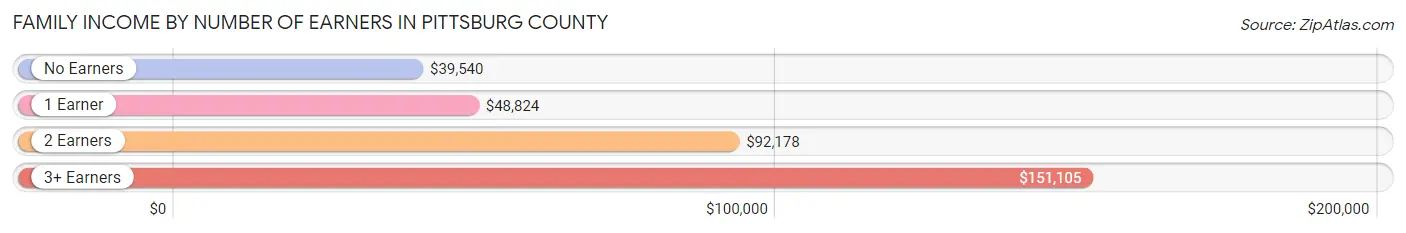
| Number of Earners | # Families | Median Income |
| No Earners | 2,436 (21.3%) | $39,540 |
| 1 Earner | 4,115 (36.0%) | $48,824 |
| 2 Earners | 4,033 (35.3%) | $92,178 |
| 3+ Earners | 834 (7.3%) | $151,105 |
| Total | 11,418 (100.0%) | $66,972 |
Household Income in Pittsburg County
Household Income Brackets in Pittsburg County
With 3,115 households falling in the category, the $50,000 to $74,999 income range is the most frequent in Pittsburg County, accounting for 17.9% of all households. In contrast, only 627 households (3.6%) fall into the $200,000+ income bracket, making it the least populous group.
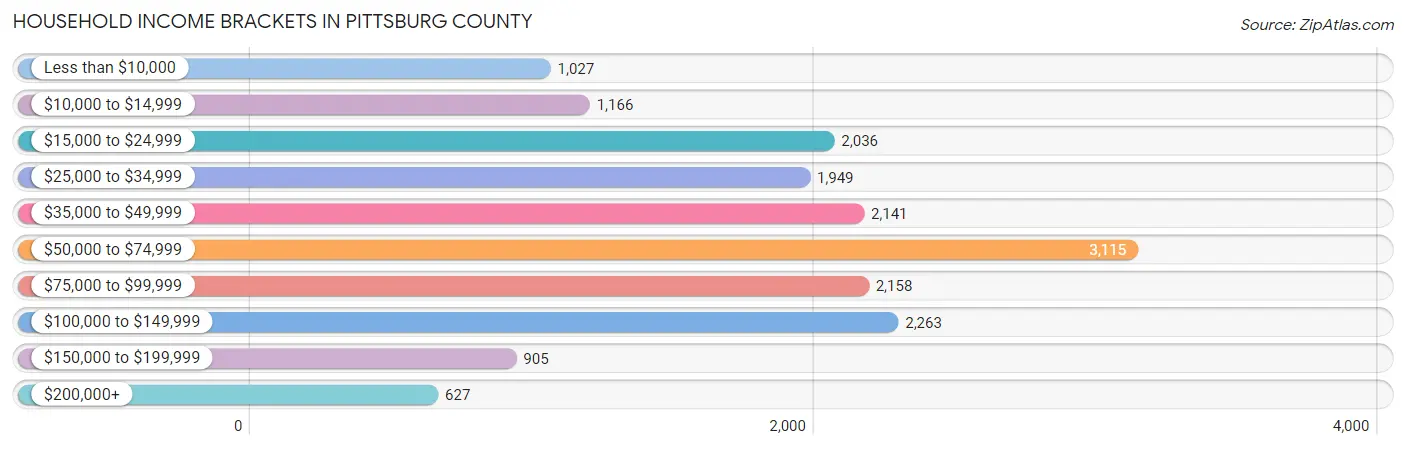
| Income Bracket | # Households | % Households |
| Less than $10,000 | 1,027 | 5.9% |
| $10,000 to $14,999 | 1,166 | 6.7% |
| $15,000 to $24,999 | 2,036 | 11.7% |
| $25,000 to $34,999 | 1,949 | 11.2% |
| $35,000 to $49,999 | 2,141 | 12.3% |
| $50,000 to $74,999 | 3,115 | 17.9% |
| $75,000 to $99,999 | 2,158 | 12.4% |
| $100,000 to $149,999 | 2,263 | 13.0% |
| $150,000 to $199,999 | 905 | 5.2% |
| $200,000+ | 627 | 3.6% |
Household Income by Householder Age in Pittsburg County
The median household income in Pittsburg County is $53,054, with the highest median household income of $63,030 found in the 25 to 44 years age bracket for the primary householder. A total of 4,939 households (28.4%) fall into this category. Meanwhile, the 15 to 24 years age bracket for the primary householder has the lowest median household income of $32,344, with 854 households (4.9%) in this group.
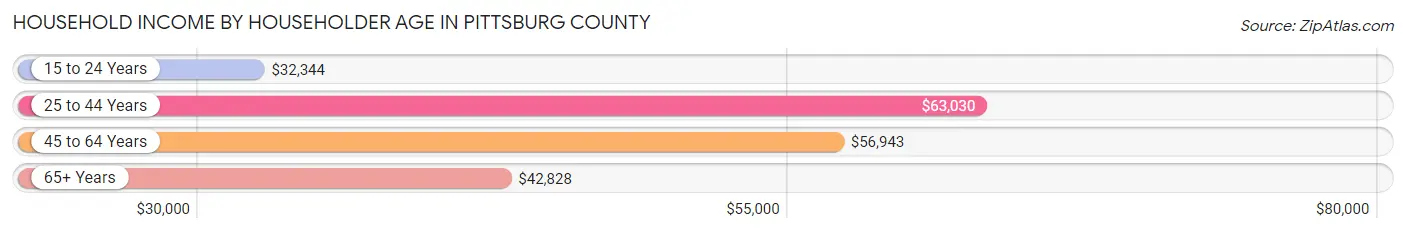
| Income Bracket | # Households | Median Income |
| 15 to 24 Years | 854 (4.9%) | $32,344 |
| 25 to 44 Years | 4,939 (28.4%) | $63,030 |
| 45 to 64 Years | 5,847 (33.6%) | $56,943 |
| 65+ Years | 5,764 (33.1%) | $42,828 |
| Total | 17,404 (100.0%) | $53,054 |
Poverty in Pittsburg County
Income Below Poverty by Sex and Age in Pittsburg County
With 17.9% poverty level for males and 20.0% for females among the residents of Pittsburg County, 15 year old males and under 5 year old females are the most vulnerable to poverty, with 97 males (30.2%) and 424 females (34.0%) in their respective age groups living below the poverty level.
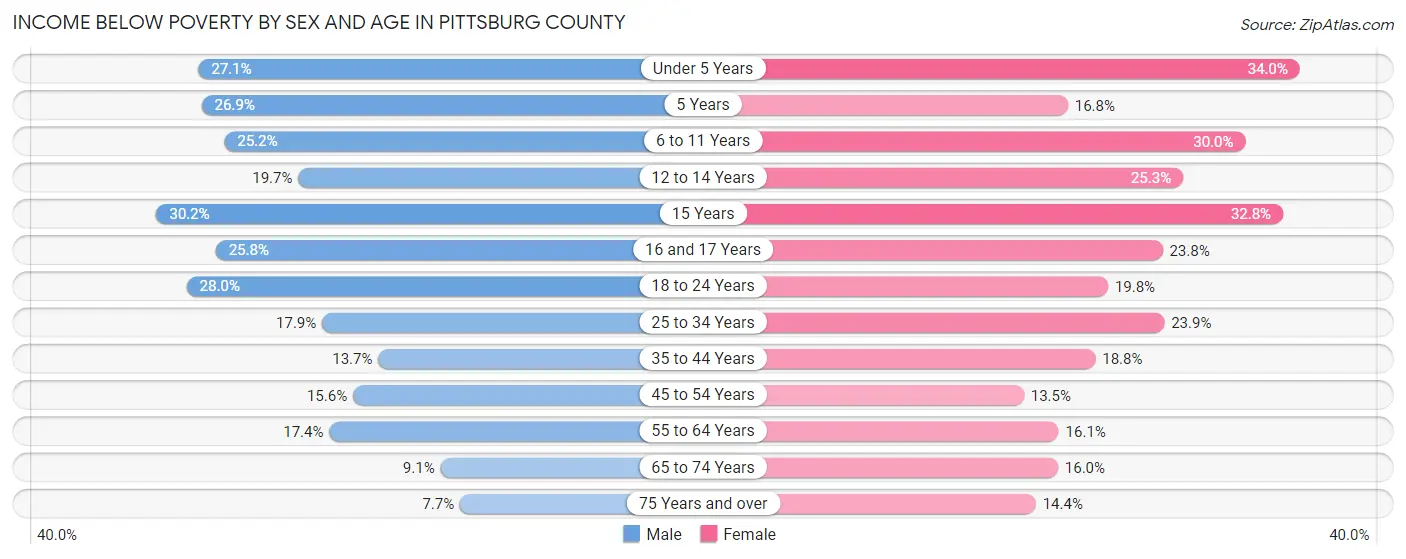
| Age Bracket | Male | Female |
| Under 5 Years | 326 (27.1%) | 424 (34.0%) |
| 5 Years | 47 (26.9%) | 49 (16.8%) |
| 6 to 11 Years | 454 (25.2%) | 467 (30.0%) |
| 12 to 14 Years | 174 (19.7%) | 211 (25.3%) |
| 15 Years | 97 (30.2%) | 94 (32.8%) |
| 16 and 17 Years | 152 (25.8%) | 130 (23.8%) |
| 18 to 24 Years | 471 (28.0%) | 281 (19.8%) |
| 25 to 34 Years | 414 (17.9%) | 587 (23.9%) |
| 35 to 44 Years | 354 (13.7%) | 471 (18.8%) |
| 45 to 54 Years | 360 (15.6%) | 322 (13.5%) |
| 55 to 64 Years | 478 (17.4%) | 478 (16.1%) |
| 65 to 74 Years | 200 (9.1%) | 396 (16.0%) |
| 75 Years and over | 124 (7.7%) | 308 (14.4%) |
| Total | 3,651 (17.9%) | 4,218 (20.0%) |
Income Above Poverty by Sex and Age in Pittsburg County
According to the poverty statistics in Pittsburg County, males aged 75 years and over and females aged 45 to 54 years are the age groups that are most secure financially, with 92.3% of males and 86.5% of females in these age groups living above the poverty line.
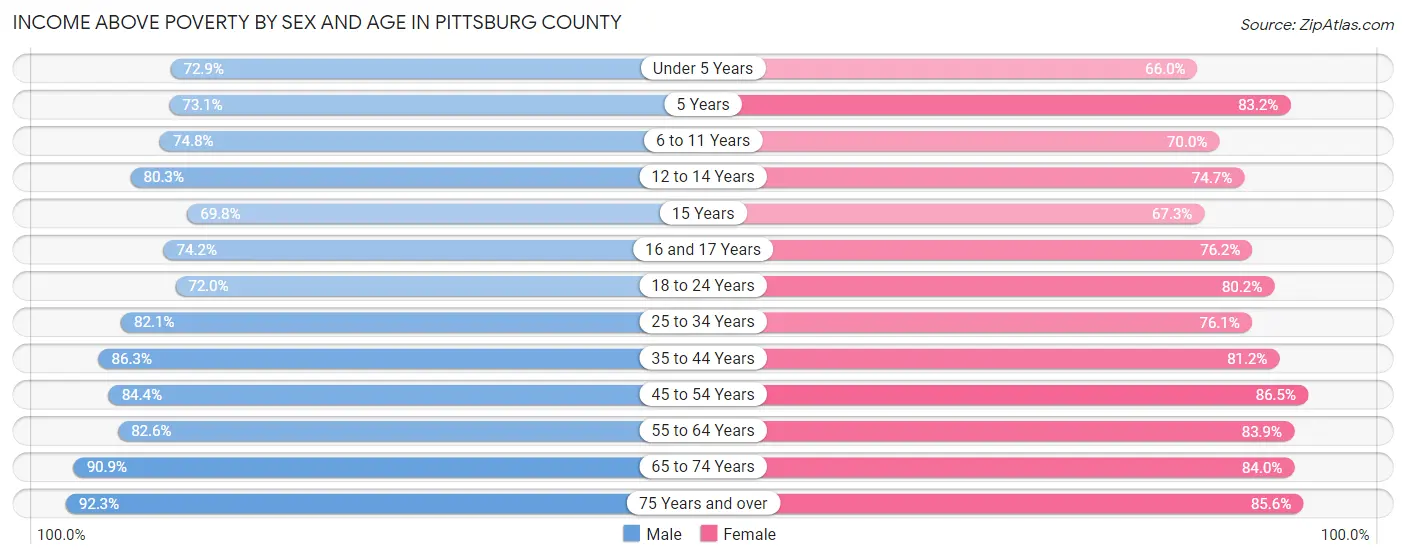
| Age Bracket | Male | Female |
| Under 5 Years | 877 (72.9%) | 823 (66.0%) |
| 5 Years | 128 (73.1%) | 243 (83.2%) |
| 6 to 11 Years | 1,350 (74.8%) | 1,092 (70.0%) |
| 12 to 14 Years | 710 (80.3%) | 622 (74.7%) |
| 15 Years | 224 (69.8%) | 193 (67.2%) |
| 16 and 17 Years | 437 (74.2%) | 416 (76.2%) |
| 18 to 24 Years | 1,213 (72.0%) | 1,141 (80.2%) |
| 25 to 34 Years | 1,897 (82.1%) | 1,865 (76.1%) |
| 35 to 44 Years | 2,223 (86.3%) | 2,031 (81.2%) |
| 45 to 54 Years | 1,945 (84.4%) | 2,062 (86.5%) |
| 55 to 64 Years | 2,272 (82.6%) | 2,491 (83.9%) |
| 65 to 74 Years | 1,994 (90.9%) | 2,073 (84.0%) |
| 75 Years and over | 1,493 (92.3%) | 1,831 (85.6%) |
| Total | 16,763 (82.1%) | 16,883 (80.0%) |
Income Below Poverty Among Married-Couple Families in Pittsburg County
The poverty statistics for married-couple families in Pittsburg County show that 7.1% or 592 of the total 8,349 families live below the poverty line. Families with 5 or more children have the highest poverty rate of 25.0%, comprising of 6 families. On the other hand, families with no children have the lowest poverty rate of 5.2%, which includes 270 families.
| Children | Above Poverty | Below Poverty |
| No Children | 4,915 (94.8%) | 270 (5.2%) |
| 1 or 2 Children | 2,259 (90.9%) | 225 (9.1%) |
| 3 or 4 Children | 565 (86.1%) | 91 (13.9%) |
| 5 or more Children | 18 (75.0%) | 6 (25.0%) |
| Total | 7,757 (92.9%) | 592 (7.1%) |
Income Below Poverty Among Single-Parent Households in Pittsburg County
According to the poverty data in Pittsburg County, 24.8% or 204 single-father households and 36.1% or 810 single-mother households are living below the poverty line. Among single-father households, those with 5 or more children have the highest poverty rate, with 26 households (100.0%) experiencing poverty. Likewise, among single-mother households, those with 5 or more children have the highest poverty rate, with 51 households (100.0%) falling below the poverty line.
| Children | Single Father | Single Mother |
| No Children | 70 (22.2%) | 128 (13.5%) |
| 1 or 2 Children | 101 (25.8%) | 450 (43.7%) |
| 3 or 4 Children | 7 (7.9%) | 181 (82.3%) |
| 5 or more Children | 26 (100.0%) | 51 (100.0%) |
| Total | 204 (24.8%) | 810 (36.1%) |
Income Below Poverty Among Married-Couple vs Single-Parent Households in Pittsburg County
The poverty data for Pittsburg County shows that 592 of the married-couple family households (7.1%) and 1,014 of the single-parent households (33.0%) are living below the poverty level. Within the married-couple family households, those with 5 or more children have the highest poverty rate, with 6 households (25.0%) falling below the poverty line. Among the single-parent households, those with 5 or more children have the highest poverty rate, with 77 household (100.0%) living below poverty.
| Children | Married-Couple Families | Single-Parent Households |
| No Children | 270 (5.2%) | 198 (15.7%) |
| 1 or 2 Children | 225 (9.1%) | 551 (38.8%) |
| 3 or 4 Children | 91 (13.9%) | 188 (60.8%) |
| 5 or more Children | 6 (25.0%) | 77 (100.0%) |
| Total | 592 (7.1%) | 1,014 (33.0%) |
Employment Characteristics in Pittsburg County
Employment by Class of Employer in Pittsburg County
Among the 16,848 employed individuals in Pittsburg County, private company employees (9,267 | 55.0%), federal government employees (1,771 | 10.5%), and local government employees (1,660 | 9.9%) make up the most common classes of employment.
| Employer Class | # Employees | % Employees |
| Private Company Employees | 9,267 | 55.0% |
| Self-Employed (Incorporated) | 421 | 2.5% |
| Self-Employed (Not Incorporated) | 1,133 | 6.7% |
| Not-for-profit Organizations | 1,225 | 7.3% |
| Local Government Employees | 1,660 | 9.9% |
| State Government Employees | 1,324 | 7.9% |
| Federal Government Employees | 1,771 | 10.5% |
| Unpaid Family Workers | 47 | 0.3% |
| Total | 16,848 | 100.0% |
Employment Status by Age in Pittsburg County
According to the labor force statistics for Pittsburg County, out of the total population over 16 years of age (34,945), 52.8% or 18,451 individuals are in the labor force, with 6.3% or 1,162 of them unemployed. The age group with the highest labor force participation rate is 35 to 44 years, with 75.8% or 4,117 individuals in the labor force. Within the labor force, the 16 to 19 years age range has the highest percentage of unemployed individuals, with 19.2% or 136 of them being unemployed.
| Age Bracket | In Labor Force | Unemployed |
| 16 to 19 Years | 708 (34.3%) | 136 (19.2%) |
| 20 to 24 Years | 1,740 (71.7%) | 223 (12.8%) |
| 25 to 29 Years | 1,842 (66.4%) | 111 (6.0%) |
| 30 to 34 Years | 1,925 (70.2%) | 133 (6.9%) |
| 35 to 44 Years | 4,117 (75.8%) | 226 (5.5%) |
| 45 to 54 Years | 3,505 (71.1%) | 179 (5.1%) |
| 55 to 59 Years | 1,787 (60.4%) | 129 (7.2%) |
| 60 to 64 Years | 1,456 (50.0%) | 0 (0.0%) |
| 65 to 74 Years | 1,139 (23.8%) | 23 (2.0%) |
| 75 Years and over | 231 (5.9%) | 9 (3.9%) |
| Total | 18,451 (52.8%) | 1,162 (6.3%) |
Employment Status by Educational Attainment in Pittsburg County
According to labor force statistics for Pittsburg County, 67.3% of individuals (14,637) out of the total population between 25 and 64 years of age (21,749) are in the labor force, with 5.3% or 776 of them being unemployed. The group with the highest labor force participation rate are those with the educational attainment of bachelor's degree or higher, with 83.0% or 3,219 individuals in the labor force. Within the labor force, individuals with less than high school education have the highest percentage of unemployment, with 17.0% or 181 of them being unemployed.
| Educational Attainment | In Labor Force | Unemployed |
| Less than High School | 1,067 (39.8%) | 456 (17.0%) |
| High School Diploma | 4,949 (61.4%) | 468 (5.8%) |
| College / Associate Degree | 5,396 (75.7%) | 349 (4.9%) |
| Bachelor's Degree or higher | 3,219 (83.0%) | 47 (1.2%) |
| Total | 14,637 (67.3%) | 1,153 (5.3%) |
Employment Occupations by Sex in Pittsburg County
Management, Business, Science and Arts Occupations
The most common Management, Business, Science and Arts occupations in Pittsburg County are Community & Social Service (2,062 | 12.0%), Management (1,768 | 10.2%), Education Instruction & Library (1,108 | 6.4%), Health Diagnosing & Treating (1,054 | 6.1%), and Business & Financial (711 | 4.1%).
Management, Business, Science and Arts Occupations by Sex
Within the Management, Business, Science and Arts occupations in Pittsburg County, the most male-oriented occupations are Architecture & Engineering (98.8%), Computers, Engineering & Science (80.5%), and Computers & Mathematics (75.0%), while the most female-oriented occupations are Health Technologists (80.3%), Health Diagnosing & Treating (78.4%), and Education Instruction & Library (77.3%).
| Occupation | Male | Female |
| Management | 1,006 (56.9%) | 762 (43.1%) |
| Business & Financial | 227 (31.9%) | 484 (68.1%) |
| Computers, Engineering & Science | 379 (80.5%) | 92 (19.5%) |
| Computers & Mathematics | 90 (75.0%) | 30 (25.0%) |
| Architecture & Engineering | 249 (98.8%) | 3 (1.2%) |
| Life, Physical & Social Science | 40 (40.4%) | 59 (59.6%) |
| Community & Social Service | 696 (33.8%) | 1,366 (66.2%) |
| Education, Arts & Media | 251 (40.8%) | 364 (59.2%) |
| Legal Services & Support | 88 (69.3%) | 39 (30.7%) |
| Education Instruction & Library | 252 (22.7%) | 856 (77.3%) |
| Arts, Media & Entertainment | 105 (49.5%) | 107 (50.5%) |
| Health Diagnosing & Treating | 228 (21.6%) | 826 (78.4%) |
| Health Technologists | 134 (19.7%) | 547 (80.3%) |
| Total (Category) | 2,536 (41.8%) | 3,530 (58.2%) |
| Total (Overall) | 9,169 (53.2%) | 8,079 (46.8%) |
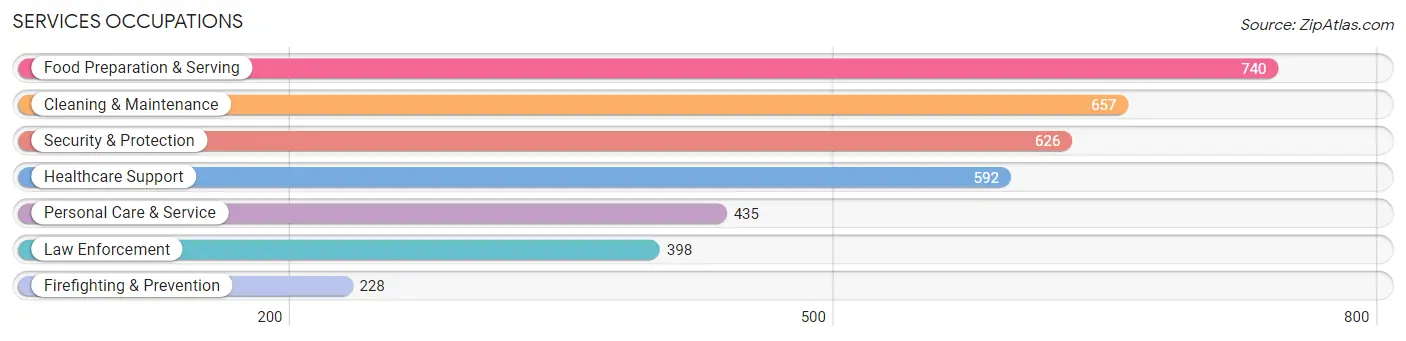
Services Occupations
The most common Services occupations in Pittsburg County are Food Preparation & Serving (740 | 4.3%), Cleaning & Maintenance (657 | 3.8%), Security & Protection (626 | 3.6%), Healthcare Support (592 | 3.4%), and Personal Care & Service (435 | 2.5%).
Services Occupations by Sex
Within the Services occupations in Pittsburg County, the most male-oriented occupations are Firefighting & Prevention (81.1%), Security & Protection (78.0%), and Law Enforcement (76.1%), while the most female-oriented occupations are Healthcare Support (90.0%), Personal Care & Service (80.9%), and Food Preparation & Serving (48.9%).
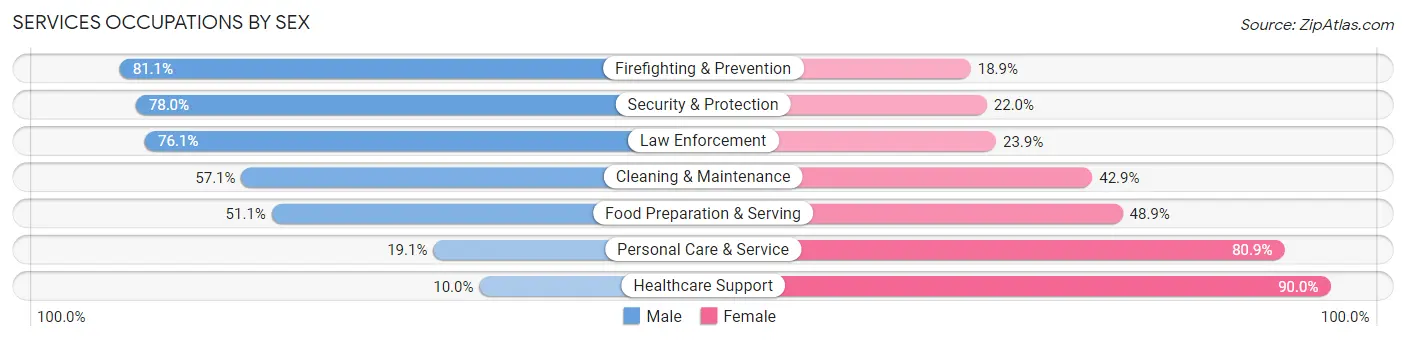
| Occupation | Male | Female |
| Healthcare Support | 59 (10.0%) | 533 (90.0%) |
| Security & Protection | 488 (78.0%) | 138 (22.0%) |
| Firefighting & Prevention | 185 (81.1%) | 43 (18.9%) |
| Law Enforcement | 303 (76.1%) | 95 (23.9%) |
| Food Preparation & Serving | 378 (51.1%) | 362 (48.9%) |
| Cleaning & Maintenance | 375 (57.1%) | 282 (42.9%) |
| Personal Care & Service | 83 (19.1%) | 352 (80.9%) |
| Total (Category) | 1,383 (45.3%) | 1,667 (54.7%) |
| Total (Overall) | 9,169 (53.2%) | 8,079 (46.8%) |
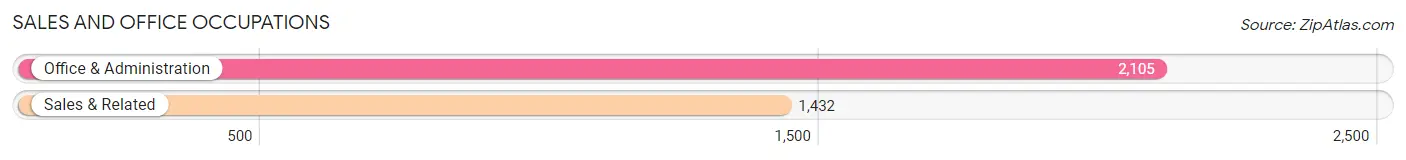
Sales and Office Occupations
The most common Sales and Office occupations in Pittsburg County are Office & Administration (2,105 | 12.2%), and Sales & Related (1,432 | 8.3%).
Sales and Office Occupations by Sex
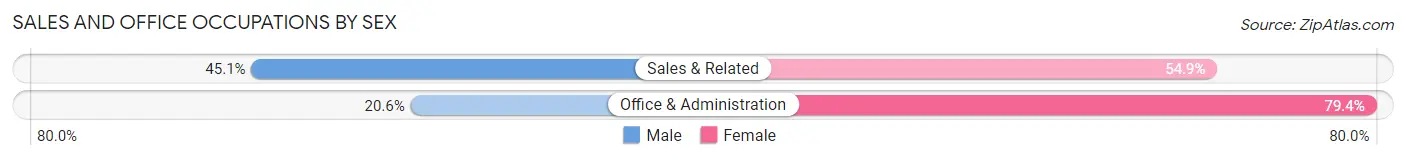
| Occupation | Male | Female |
| Sales & Related | 646 (45.1%) | 786 (54.9%) |
| Office & Administration | 434 (20.6%) | 1,671 (79.4%) |
| Total (Category) | 1,080 (30.5%) | 2,457 (69.5%) |
| Total (Overall) | 9,169 (53.2%) | 8,079 (46.8%) |
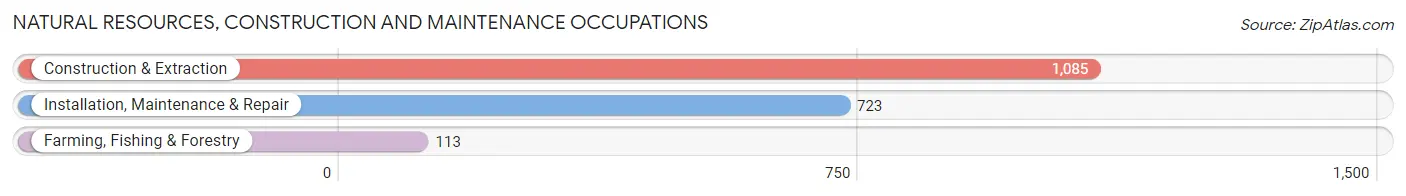
Natural Resources, Construction and Maintenance Occupations
The most common Natural Resources, Construction and Maintenance occupations in Pittsburg County are Construction & Extraction (1,085 | 6.3%), Installation, Maintenance & Repair (723 | 4.2%), and Farming, Fishing & Forestry (113 | 0.7%).
Natural Resources, Construction and Maintenance Occupations by Sex
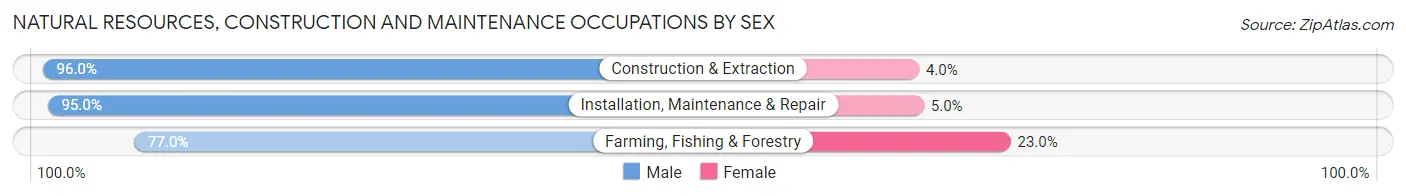
| Occupation | Male | Female |
| Farming, Fishing & Forestry | 87 (77.0%) | 26 (23.0%) |
| Construction & Extraction | 1,042 (96.0%) | 43 (4.0%) |
| Installation, Maintenance & Repair | 687 (95.0%) | 36 (5.0%) |
| Total (Category) | 1,816 (94.5%) | 105 (5.5%) |
| Total (Overall) | 9,169 (53.2%) | 8,079 (46.8%) |
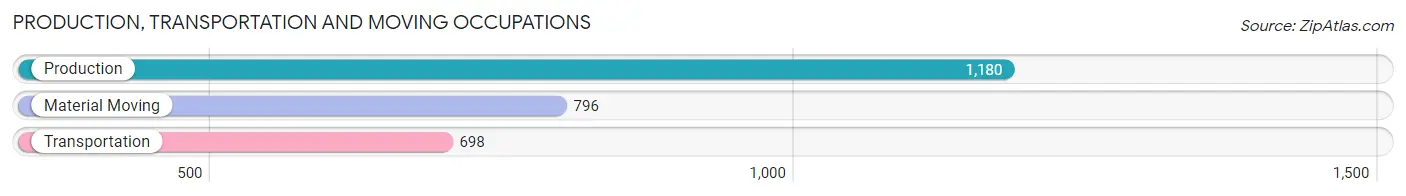
Production, Transportation and Moving Occupations
The most common Production, Transportation and Moving occupations in Pittsburg County are Production (1,180 | 6.8%), Material Moving (796 | 4.6%), and Transportation (698 | 4.1%).
Production, Transportation and Moving Occupations by Sex
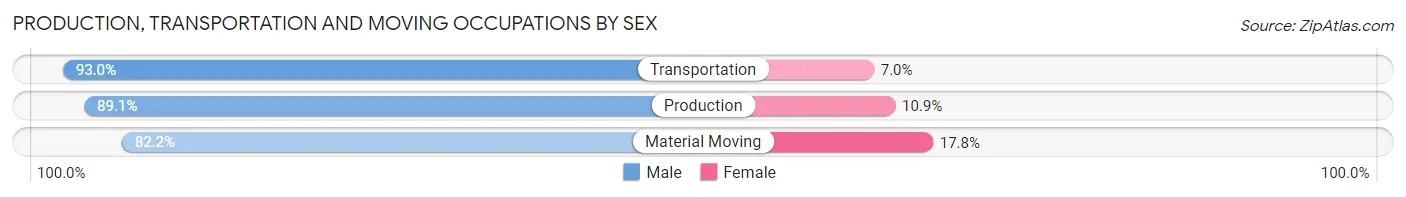
| Occupation | Male | Female |
| Production | 1,051 (89.1%) | 129 (10.9%) |
| Transportation | 649 (93.0%) | 49 (7.0%) |
| Material Moving | 654 (82.2%) | 142 (17.8%) |
| Total (Category) | 2,354 (88.0%) | 320 (12.0%) |
| Total (Overall) | 9,169 (53.2%) | 8,079 (46.8%) |
Employment Industries by Sex in Pittsburg County
Employment Industries in Pittsburg County
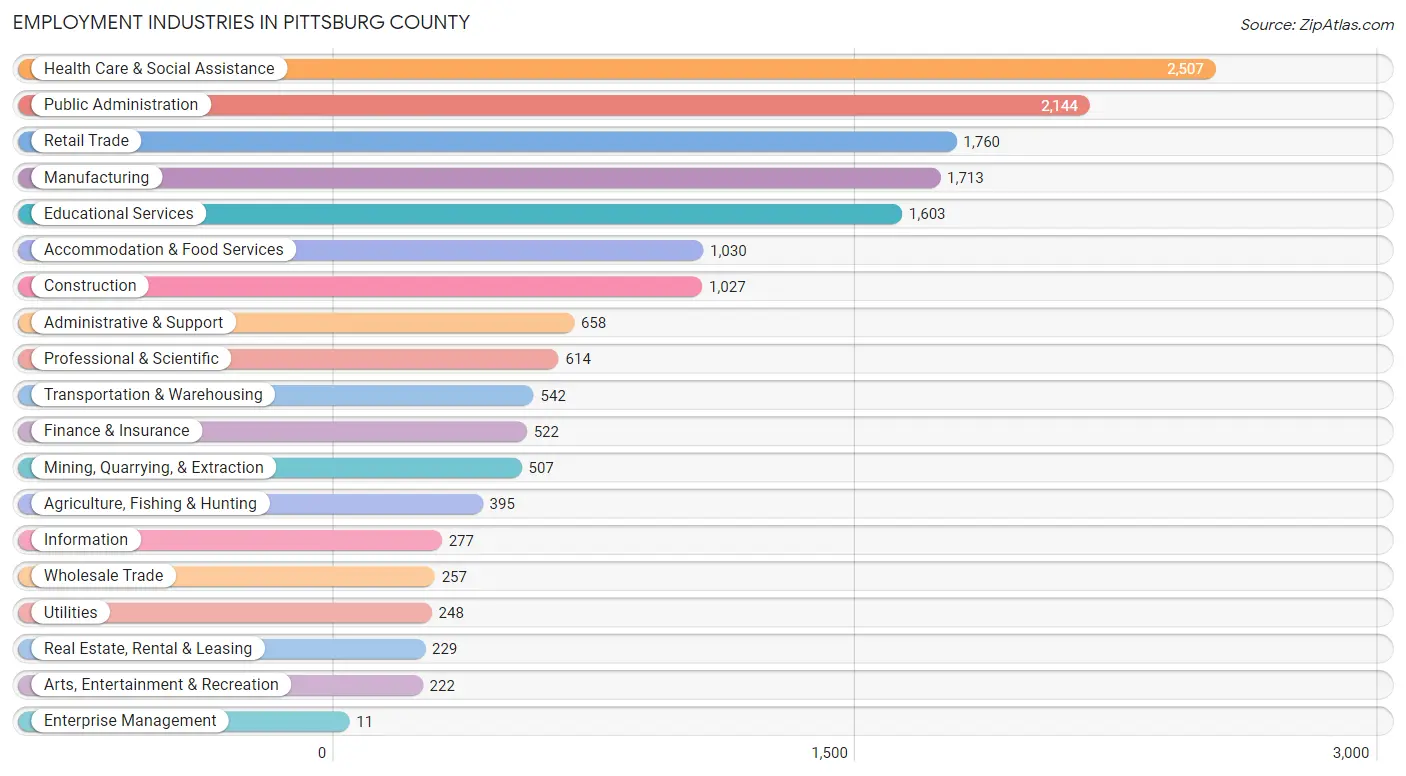
The major employment industries in Pittsburg County include Health Care & Social Assistance (2,507 | 14.5%), Public Administration (2,144 | 12.4%), Retail Trade (1,760 | 10.2%), Manufacturing (1,713 | 9.9%), and Educational Services (1,603 | 9.3%).
Employment Industries by Sex in Pittsburg County
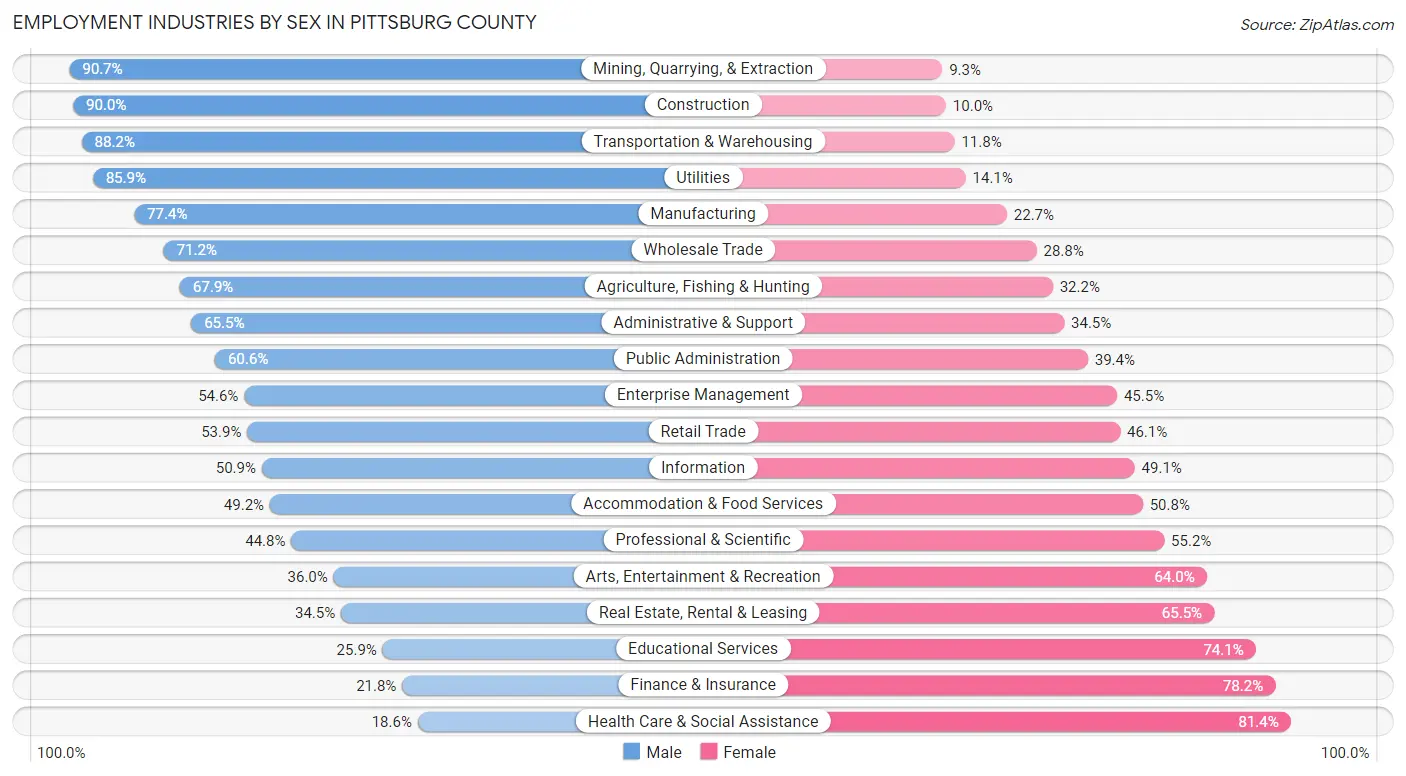
The Pittsburg County industries that see more men than women are Mining, Quarrying, & Extraction (90.7%), Construction (90.0%), and Transportation & Warehousing (88.2%), whereas the industries that tend to have a higher number of women are Health Care & Social Assistance (81.4%), Finance & Insurance (78.2%), and Educational Services (74.1%).
| Industry | Male | Female |
| Agriculture, Fishing & Hunting | 268 (67.8%) | 127 (32.2%) |
| Mining, Quarrying, & Extraction | 460 (90.7%) | 47 (9.3%) |
| Construction | 924 (90.0%) | 103 (10.0%) |
| Manufacturing | 1,325 (77.3%) | 388 (22.7%) |
| Wholesale Trade | 183 (71.2%) | 74 (28.8%) |
| Retail Trade | 949 (53.9%) | 811 (46.1%) |
| Transportation & Warehousing | 478 (88.2%) | 64 (11.8%) |
| Utilities | 213 (85.9%) | 35 (14.1%) |
| Information | 141 (50.9%) | 136 (49.1%) |
| Finance & Insurance | 114 (21.8%) | 408 (78.2%) |
| Real Estate, Rental & Leasing | 79 (34.5%) | 150 (65.5%) |
| Professional & Scientific | 275 (44.8%) | 339 (55.2%) |
| Enterprise Management | 6 (54.5%) | 5 (45.5%) |
| Administrative & Support | 431 (65.5%) | 227 (34.5%) |
| Educational Services | 415 (25.9%) | 1,188 (74.1%) |
| Health Care & Social Assistance | 467 (18.6%) | 2,040 (81.4%) |
| Arts, Entertainment & Recreation | 80 (36.0%) | 142 (64.0%) |
| Accommodation & Food Services | 507 (49.2%) | 523 (50.8%) |
| Public Administration | 1,299 (60.6%) | 845 (39.4%) |
| Total | 9,169 (53.2%) | 8,079 (46.8%) |
Education in Pittsburg County
School Enrollment in Pittsburg County
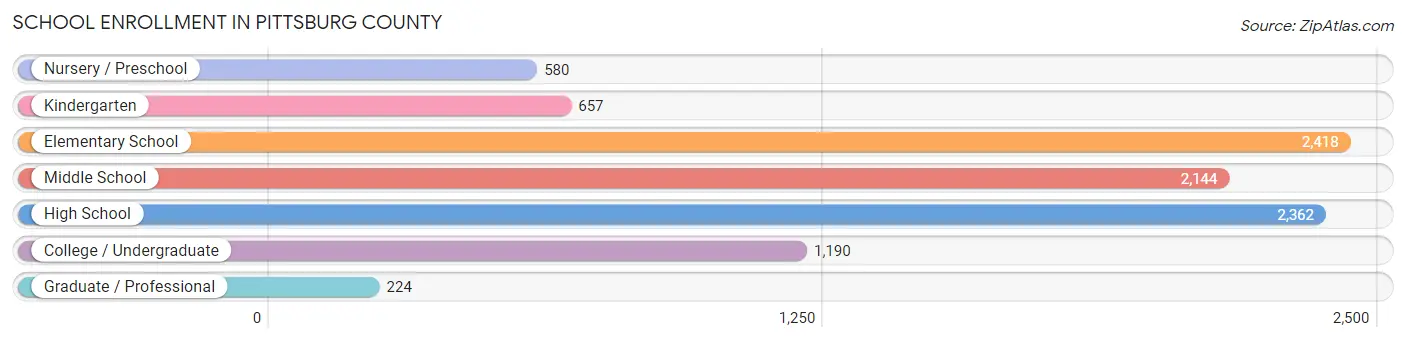
The most common levels of schooling among the 9,575 students in Pittsburg County are elementary school (2,418 | 25.3%), high school (2,362 | 24.7%), and middle school (2,144 | 22.4%).
| School Level | # Students | % Students |
| Nursery / Preschool | 580 | 6.1% |
| Kindergarten | 657 | 6.9% |
| Elementary School | 2,418 | 25.3% |
| Middle School | 2,144 | 22.4% |
| High School | 2,362 | 24.7% |
| College / Undergraduate | 1,190 | 12.4% |
| Graduate / Professional | 224 | 2.3% |
| Total | 9,575 | 100.0% |
School Enrollment by Age by Funding Source in Pittsburg County
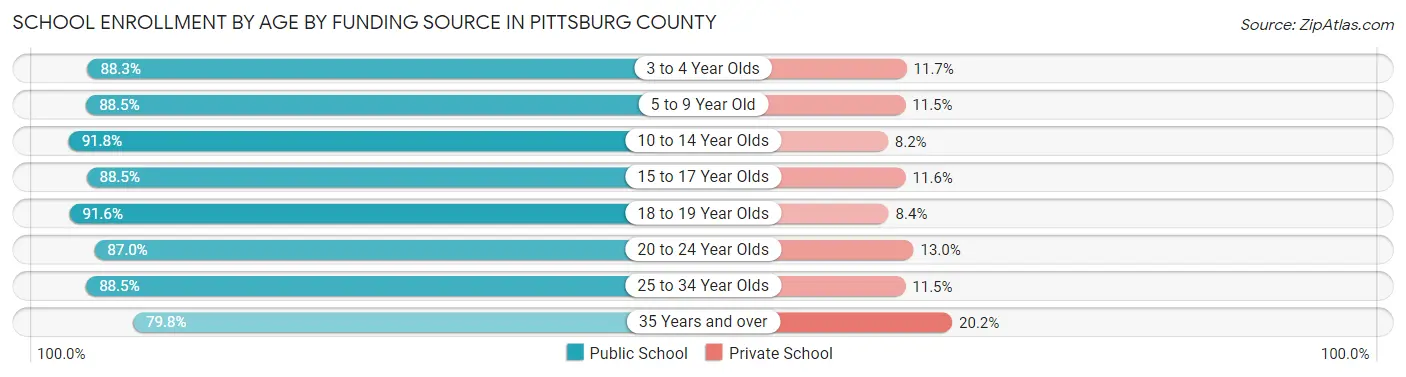
Out of a total of 9,575 students who are enrolled in schools in Pittsburg County, 1,034 (10.8%) attend a private institution, while the remaining 8,541 (89.2%) are enrolled in public schools. The age group of 35 years and over has the highest likelihood of being enrolled in private schools, with 79 (20.2% in the age bracket) enrolled. Conversely, the age group of 10 to 14 year olds has the lowest likelihood of being enrolled in a private school, with 2,631 (91.8% in the age bracket) attending a public institution.
| Age Bracket | Public School | Private School |
| 3 to 4 Year Olds | 354 (88.3%) | 47 (11.7%) |
| 5 to 9 Year Old | 2,395 (88.5%) | 311 (11.5%) |
| 10 to 14 Year Olds | 2,631 (91.8%) | 236 (8.2%) |
| 15 to 17 Year Olds | 1,501 (88.4%) | 196 (11.6%) |
| 18 to 19 Year Olds | 470 (91.6%) | 43 (8.4%) |
| 20 to 24 Year Olds | 408 (87.0%) | 61 (13.0%) |
| 25 to 34 Year Olds | 470 (88.5%) | 61 (11.5%) |
| 35 Years and over | 312 (79.8%) | 79 (20.2%) |
| Total | 8,541 (89.2%) | 1,034 (10.8%) |
Educational Attainment by Field of Study in Pittsburg County
Education (1,587 | 25.8%), business (1,165 | 19.0%), science & technology (605 | 9.8%), bio, nature & agricultural (439 | 7.1%), and arts & humanities (426 | 6.9%) are the most common fields of study among 6,146 individuals in Pittsburg County who have obtained a bachelor's degree or higher.
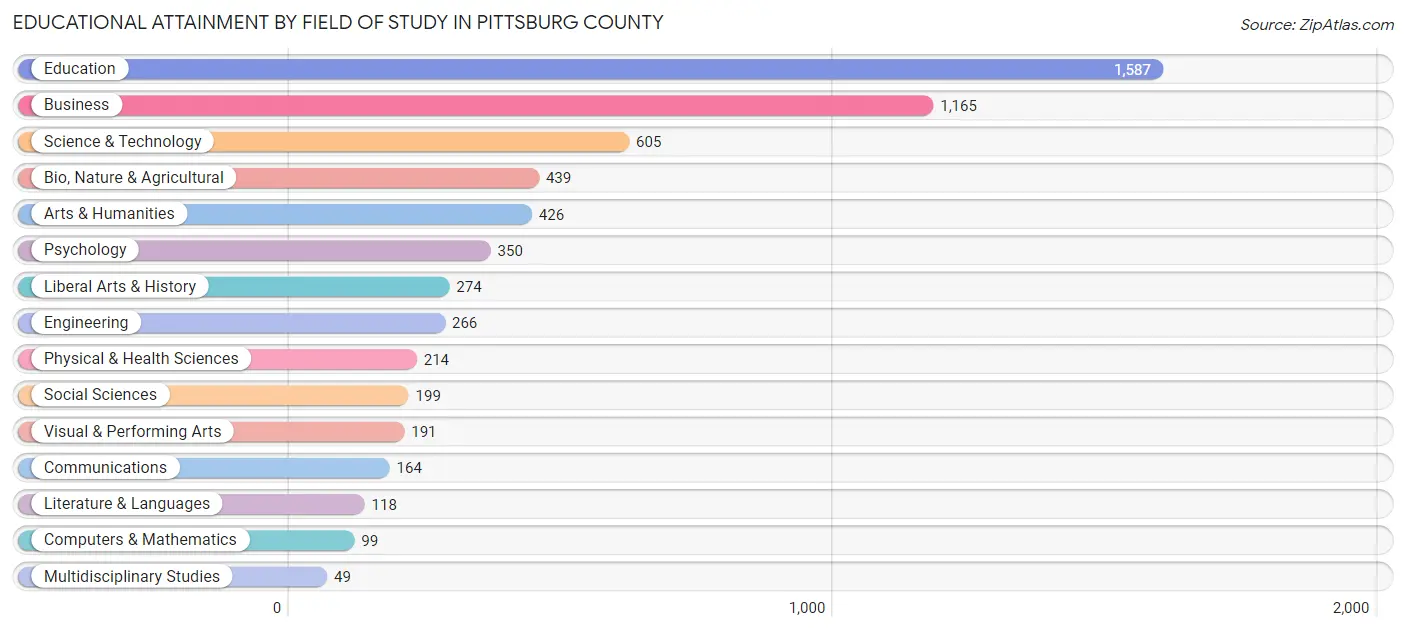
| Field of Study | # Graduates | % Graduates |
| Computers & Mathematics | 99 | 1.6% |
| Bio, Nature & Agricultural | 439 | 7.1% |
| Physical & Health Sciences | 214 | 3.5% |
| Psychology | 350 | 5.7% |
| Social Sciences | 199 | 3.2% |
| Engineering | 266 | 4.3% |
| Multidisciplinary Studies | 49 | 0.8% |
| Science & Technology | 605 | 9.8% |
| Business | 1,165 | 19.0% |
| Education | 1,587 | 25.8% |
| Literature & Languages | 118 | 1.9% |
| Liberal Arts & History | 274 | 4.5% |
| Visual & Performing Arts | 191 | 3.1% |
| Communications | 164 | 2.7% |
| Arts & Humanities | 426 | 6.9% |
| Total | 6,146 | 100.0% |
Transportation & Commute in Pittsburg County
Vehicle Availability by Sex in Pittsburg County
The most prevalent vehicle ownership categories in Pittsburg County are males with 2 vehicles (3,405, accounting for 38.1%) and females with 2 vehicles (2,925, making up 43.5%).
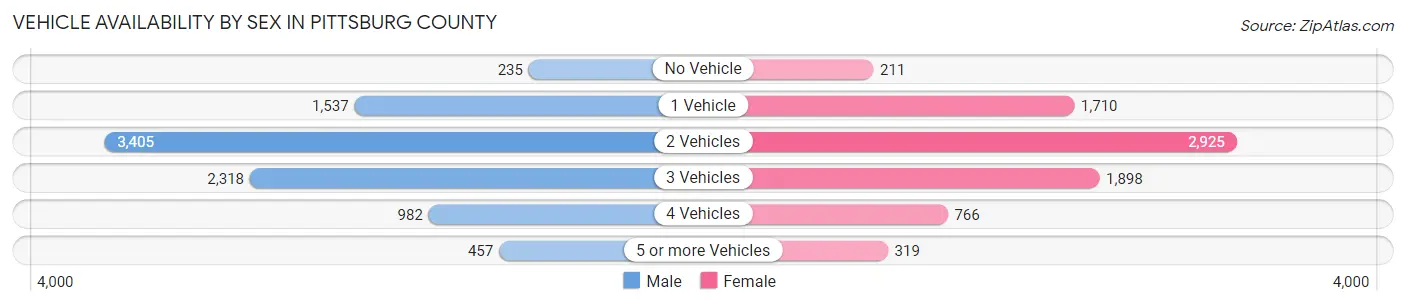
| Vehicles Available | Male | Female |
| No Vehicle | 235 (2.6%) | 211 (2.7%) |
| 1 Vehicle | 1,537 (17.2%) | 1,710 (21.8%) |
| 2 Vehicles | 3,405 (38.1%) | 2,925 (37.4%) |
| 3 Vehicles | 2,318 (26.0%) | 1,898 (24.2%) |
| 4 Vehicles | 982 (11.0%) | 766 (9.8%) |
| 5 or more Vehicles | 457 (5.1%) | 319 (4.1%) |
| Total | 8,934 (100.0%) | 7,829 (100.0%) |
Commute Time in Pittsburg County
The most frequently occuring commute durations in Pittsburg County are 10 to 14 minutes (3,087 commuters, 19.6%), 15 to 19 minutes (2,986 commuters, 18.9%), and 5 to 9 minutes (2,791 commuters, 17.7%).
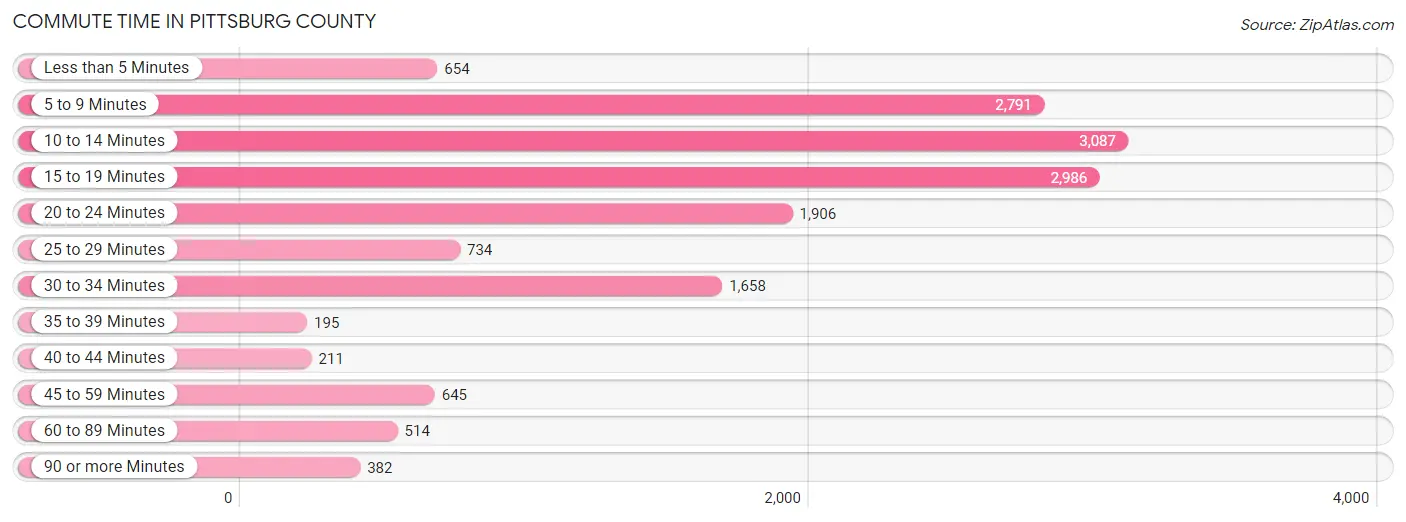
| Commute Time | # Commuters | % Commuters |
| Less than 5 Minutes | 654 | 4.2% |
| 5 to 9 Minutes | 2,791 | 17.7% |
| 10 to 14 Minutes | 3,087 | 19.6% |
| 15 to 19 Minutes | 2,986 | 18.9% |
| 20 to 24 Minutes | 1,906 | 12.1% |
| 25 to 29 Minutes | 734 | 4.7% |
| 30 to 34 Minutes | 1,658 | 10.5% |
| 35 to 39 Minutes | 195 | 1.2% |
| 40 to 44 Minutes | 211 | 1.3% |
| 45 to 59 Minutes | 645 | 4.1% |
| 60 to 89 Minutes | 514 | 3.3% |
| 90 or more Minutes | 382 | 2.4% |
Commute Time by Sex in Pittsburg County
The most common commute times in Pittsburg County are 15 to 19 minutes (1,670 commuters, 19.5%) for males and 10 to 14 minutes (1,708 commuters, 23.7%) for females.
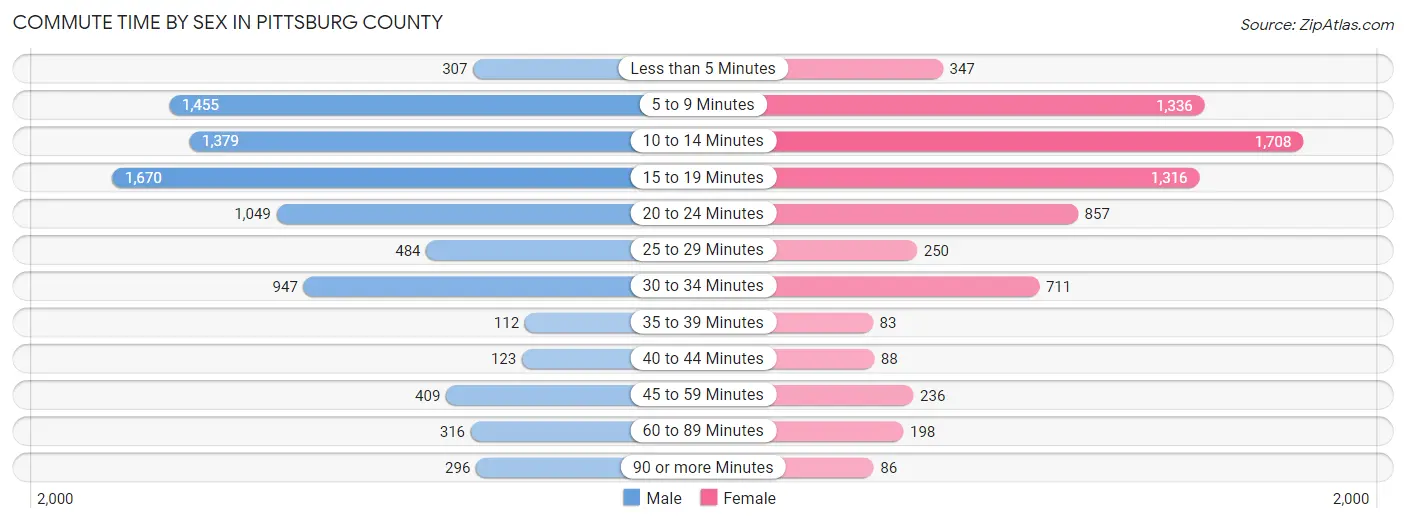
| Commute Time | Male | Female |
| Less than 5 Minutes | 307 (3.6%) | 347 (4.8%) |
| 5 to 9 Minutes | 1,455 (17.0%) | 1,336 (18.5%) |
| 10 to 14 Minutes | 1,379 (16.1%) | 1,708 (23.7%) |
| 15 to 19 Minutes | 1,670 (19.5%) | 1,316 (18.2%) |
| 20 to 24 Minutes | 1,049 (12.3%) | 857 (11.9%) |
| 25 to 29 Minutes | 484 (5.7%) | 250 (3.5%) |
| 30 to 34 Minutes | 947 (11.1%) | 711 (9.9%) |
| 35 to 39 Minutes | 112 (1.3%) | 83 (1.1%) |
| 40 to 44 Minutes | 123 (1.4%) | 88 (1.2%) |
| 45 to 59 Minutes | 409 (4.8%) | 236 (3.3%) |
| 60 to 89 Minutes | 316 (3.7%) | 198 (2.7%) |
| 90 or more Minutes | 296 (3.5%) | 86 (1.2%) |
Time of Departure to Work by Sex in Pittsburg County
The most frequent times of departure to work in Pittsburg County are 7:30 AM to 7:59 AM (1,293, 15.1%) for males and 7:30 AM to 7:59 AM (1,661, 23.0%) for females.
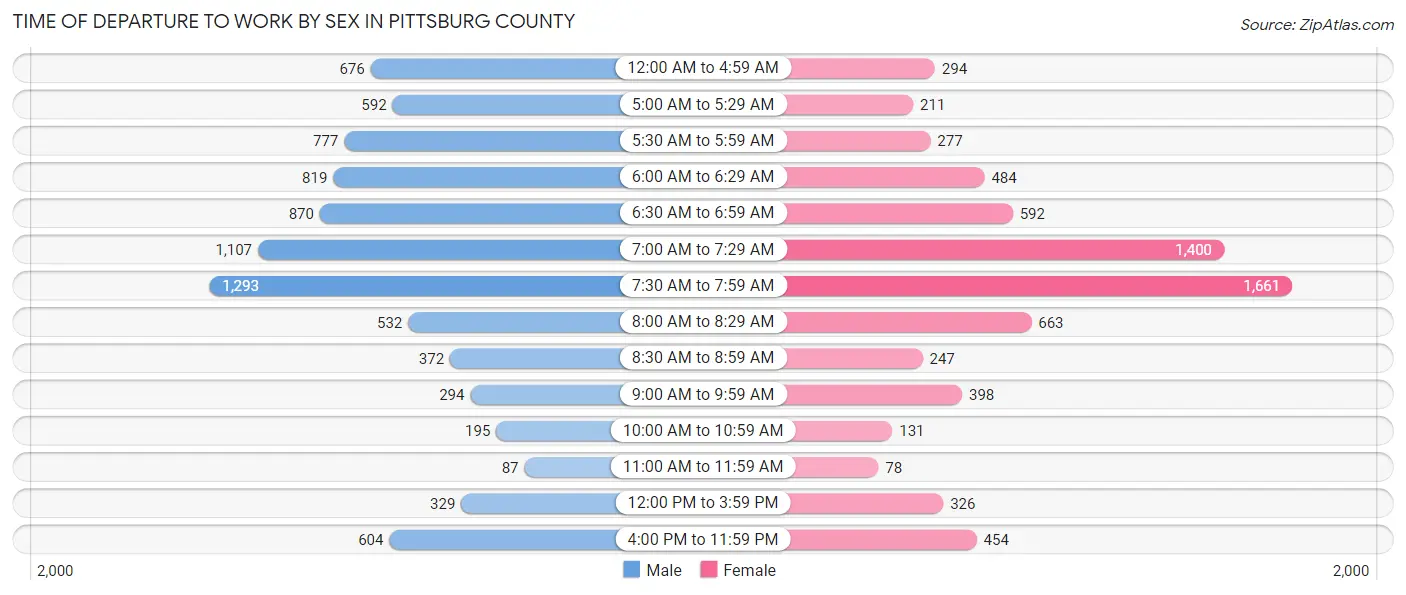
| Time of Departure | Male | Female |
| 12:00 AM to 4:59 AM | 676 (7.9%) | 294 (4.1%) |
| 5:00 AM to 5:29 AM | 592 (6.9%) | 211 (2.9%) |
| 5:30 AM to 5:59 AM | 777 (9.1%) | 277 (3.8%) |
| 6:00 AM to 6:29 AM | 819 (9.6%) | 484 (6.7%) |
| 6:30 AM to 6:59 AM | 870 (10.2%) | 592 (8.2%) |
| 7:00 AM to 7:29 AM | 1,107 (13.0%) | 1,400 (19.4%) |
| 7:30 AM to 7:59 AM | 1,293 (15.1%) | 1,661 (23.0%) |
| 8:00 AM to 8:29 AM | 532 (6.2%) | 663 (9.2%) |
| 8:30 AM to 8:59 AM | 372 (4.3%) | 247 (3.4%) |
| 9:00 AM to 9:59 AM | 294 (3.4%) | 398 (5.5%) |
| 10:00 AM to 10:59 AM | 195 (2.3%) | 131 (1.8%) |
| 11:00 AM to 11:59 AM | 87 (1.0%) | 78 (1.1%) |
| 12:00 PM to 3:59 PM | 329 (3.8%) | 326 (4.5%) |
| 4:00 PM to 11:59 PM | 604 (7.1%) | 454 (6.3%) |
| Total | 8,547 (100.0%) | 7,216 (100.0%) |
Housing Occupancy in Pittsburg County
Occupancy by Ownership in Pittsburg County
Of the total 17,404 dwellings in Pittsburg County, owner-occupied units account for 12,539 (72.1%), while renter-occupied units make up 4,865 (28.0%).
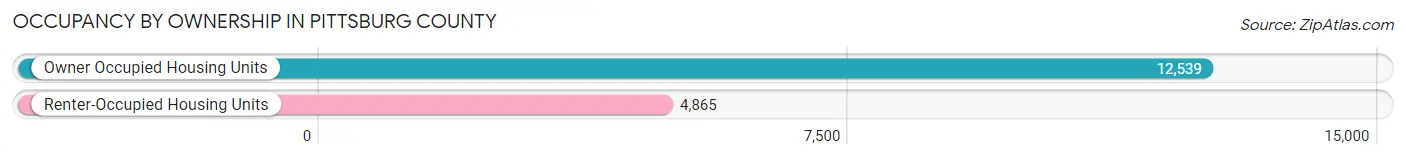
| Occupancy | # Housing Units | % Housing Units |
| Owner Occupied Housing Units | 12,539 | 72.1% |
| Renter-Occupied Housing Units | 4,865 | 28.0% |
| Total Occupied Housing Units | 17,404 | 100.0% |
Occupancy by Household Size in Pittsburg County
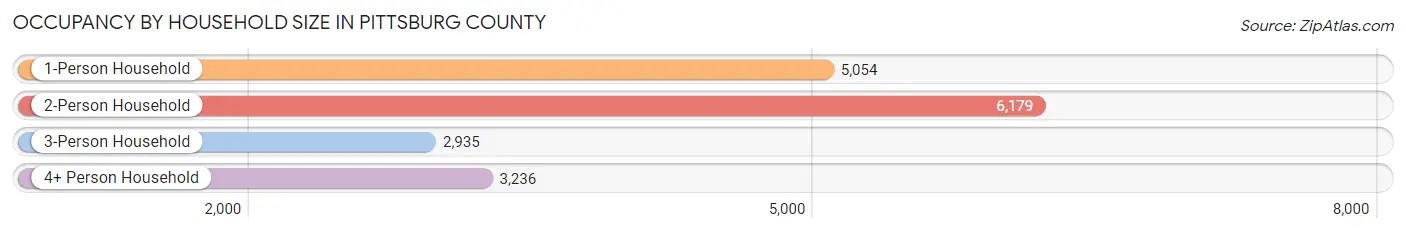
| Household Size | # Housing Units | % Housing Units |
| 1-Person Household | 5,054 | 29.0% |
| 2-Person Household | 6,179 | 35.5% |
| 3-Person Household | 2,935 | 16.9% |
| 4+ Person Household | 3,236 | 18.6% |
| Total Housing Units | 17,404 | 100.0% |
Occupancy by Ownership by Household Size in Pittsburg County
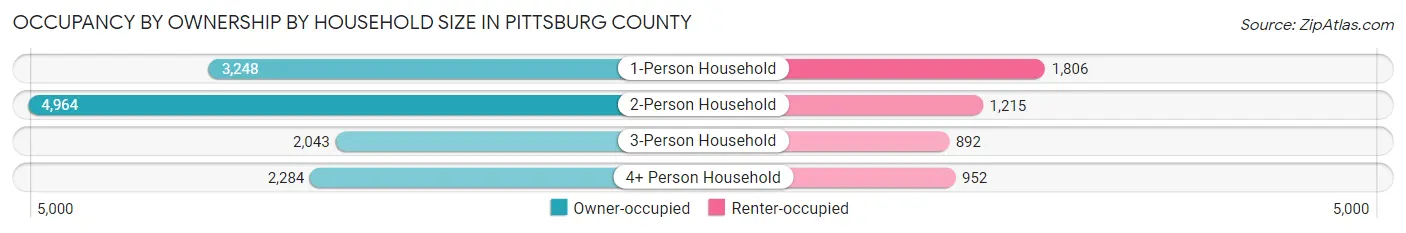
| Household Size | Owner-occupied | Renter-occupied |
| 1-Person Household | 3,248 (64.3%) | 1,806 (35.7%) |
| 2-Person Household | 4,964 (80.3%) | 1,215 (19.7%) |
| 3-Person Household | 2,043 (69.6%) | 892 (30.4%) |
| 4+ Person Household | 2,284 (70.6%) | 952 (29.4%) |
| Total Housing Units | 12,539 (72.1%) | 4,865 (28.0%) |
Occupancy by Educational Attainment in Pittsburg County
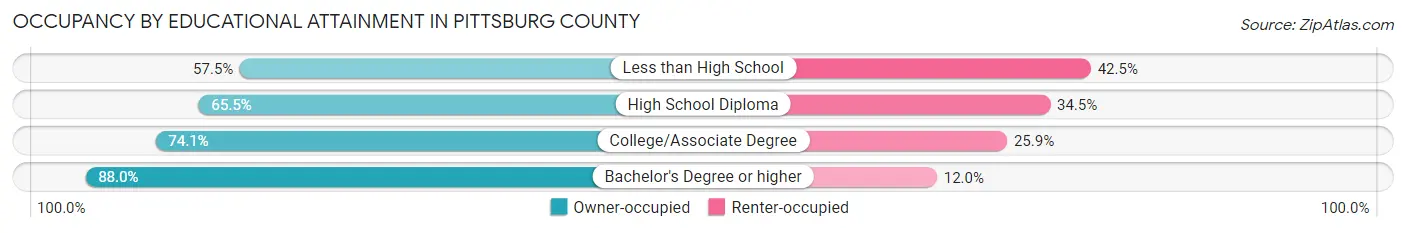
| Household Size | Owner-occupied | Renter-occupied |
| Less than High School | 1,186 (57.5%) | 878 (42.5%) |
| High School Diploma | 4,070 (65.5%) | 2,141 (34.5%) |
| College/Associate Degree | 3,982 (74.1%) | 1,395 (25.9%) |
| Bachelor's Degree or higher | 3,301 (88.0%) | 451 (12.0%) |
Occupancy by Age of Householder in Pittsburg County
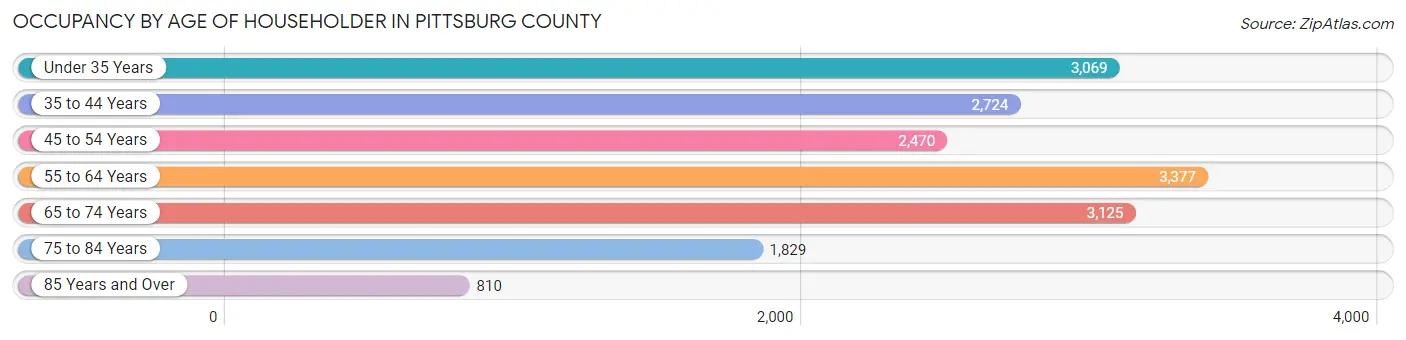
| Age Bracket | # Households | % Households |
| Under 35 Years | 3,069 | 17.6% |
| 35 to 44 Years | 2,724 | 15.7% |
| 45 to 54 Years | 2,470 | 14.2% |
| 55 to 64 Years | 3,377 | 19.4% |
| 65 to 74 Years | 3,125 | 18.0% |
| 75 to 84 Years | 1,829 | 10.5% |
| 85 Years and Over | 810 | 4.6% |
| Total | 17,404 | 100.0% |
Housing Finances in Pittsburg County
Median Income by Occupancy in Pittsburg County
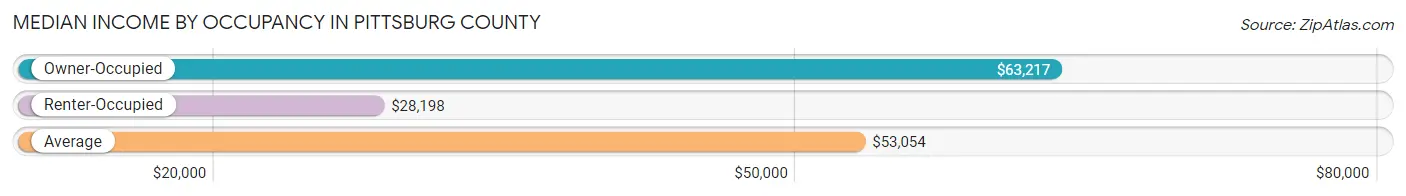
| Occupancy Type | # Households | Median Income |
| Owner-Occupied | 12,539 (72.1%) | $63,217 |
| Renter-Occupied | 4,865 (28.0%) | $28,198 |
| Average | 17,404 (100.0%) | $53,054 |
Occupancy by Householder Income Bracket in Pittsburg County
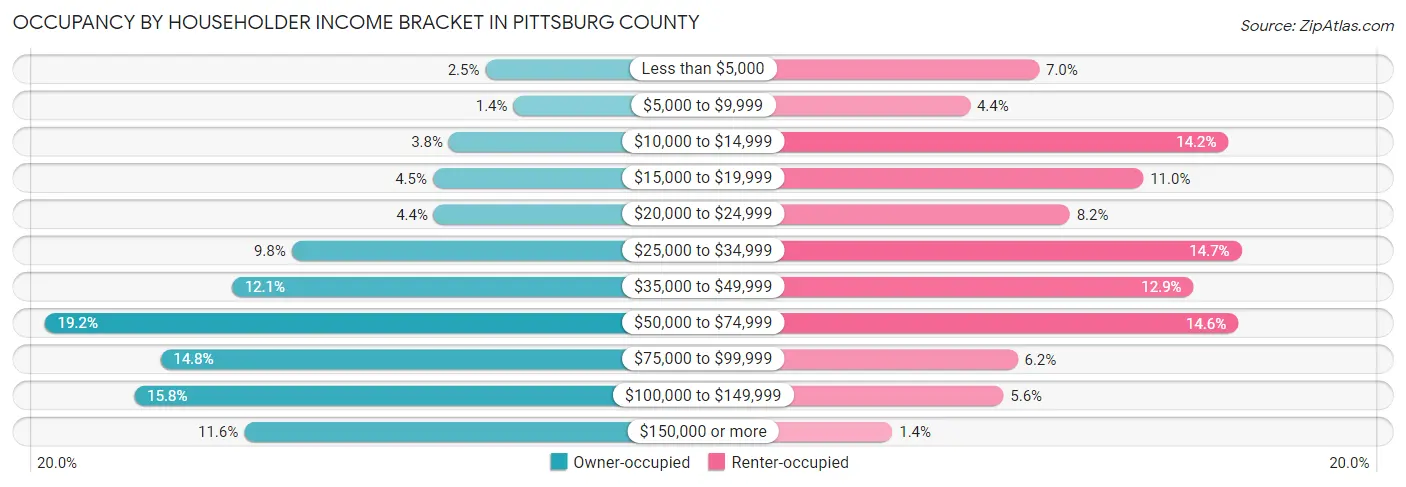
| Income Bracket | Owner-occupied | Renter-occupied |
| Less than $5,000 | 307 (2.5%) | 340 (7.0%) |
| $5,000 to $9,999 | 173 (1.4%) | 212 (4.4%) |
| $10,000 to $14,999 | 481 (3.8%) | 691 (14.2%) |
| $15,000 to $19,999 | 558 (4.4%) | 533 (11.0%) |
| $20,000 to $24,999 | 553 (4.4%) | 397 (8.2%) |
| $25,000 to $34,999 | 1,232 (9.8%) | 715 (14.7%) |
| $35,000 to $49,999 | 1,519 (12.1%) | 626 (12.9%) |
| $50,000 to $74,999 | 2,412 (19.2%) | 709 (14.6%) |
| $75,000 to $99,999 | 1,860 (14.8%) | 300 (6.2%) |
| $100,000 to $149,999 | 1,985 (15.8%) | 274 (5.6%) |
| $150,000 or more | 1,459 (11.6%) | 68 (1.4%) |
| Total | 12,539 (100.0%) | 4,865 (100.0%) |
Monthly Housing Cost Tiers in Pittsburg County
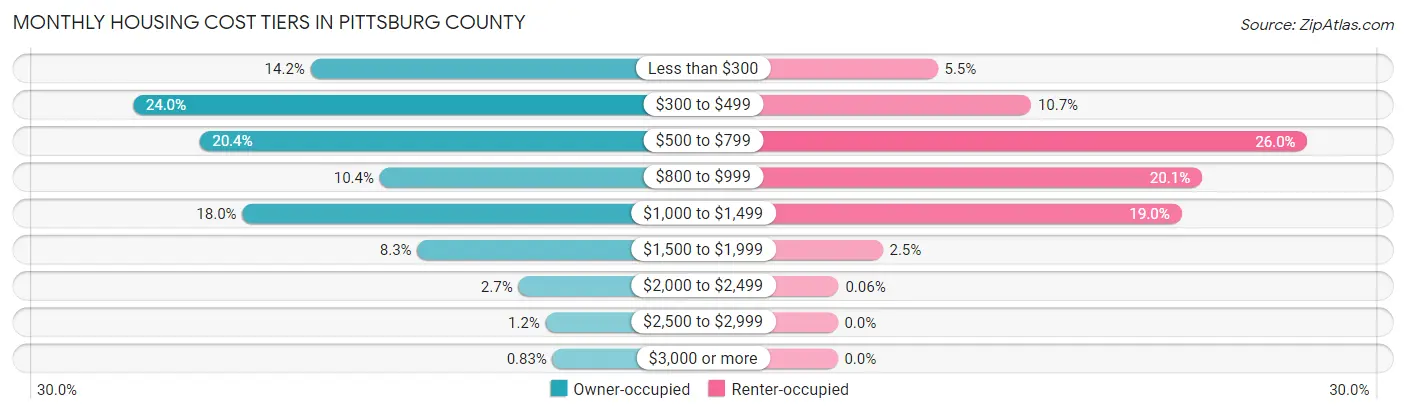
| Monthly Cost | Owner-occupied | Renter-occupied |
| Less than $300 | 1,781 (14.2%) | 269 (5.5%) |
| $300 to $499 | 3,012 (24.0%) | 520 (10.7%) |
| $500 to $799 | 2,552 (20.3%) | 1,263 (26.0%) |
| $800 to $999 | 1,302 (10.4%) | 980 (20.1%) |
| $1,000 to $1,499 | 2,253 (18.0%) | 925 (19.0%) |
| $1,500 to $1,999 | 1,041 (8.3%) | 121 (2.5%) |
| $2,000 to $2,499 | 341 (2.7%) | 3 (0.1%) |
| $2,500 to $2,999 | 153 (1.2%) | 0 (0.0%) |
| $3,000 or more | 104 (0.8%) | 0 (0.0%) |
| Total | 12,539 (100.0%) | 4,865 (100.0%) |
Physical Housing Characteristics in Pittsburg County
Housing Structures in Pittsburg County
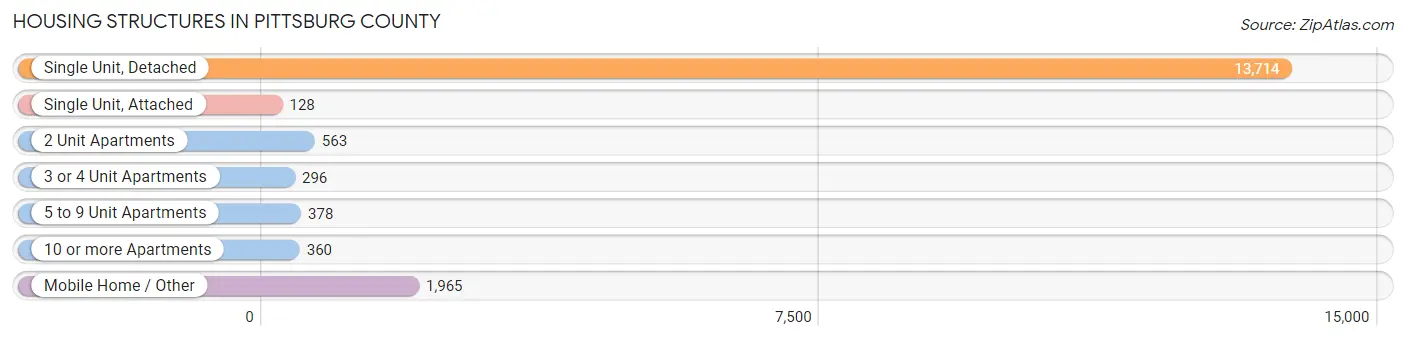
| Structure Type | # Housing Units | % Housing Units |
| Single Unit, Detached | 13,714 | 78.8% |
| Single Unit, Attached | 128 | 0.7% |
| 2 Unit Apartments | 563 | 3.2% |
| 3 or 4 Unit Apartments | 296 | 1.7% |
| 5 to 9 Unit Apartments | 378 | 2.2% |
| 10 or more Apartments | 360 | 2.1% |
| Mobile Home / Other | 1,965 | 11.3% |
| Total | 17,404 | 100.0% |
Housing Structures by Occupancy in Pittsburg County
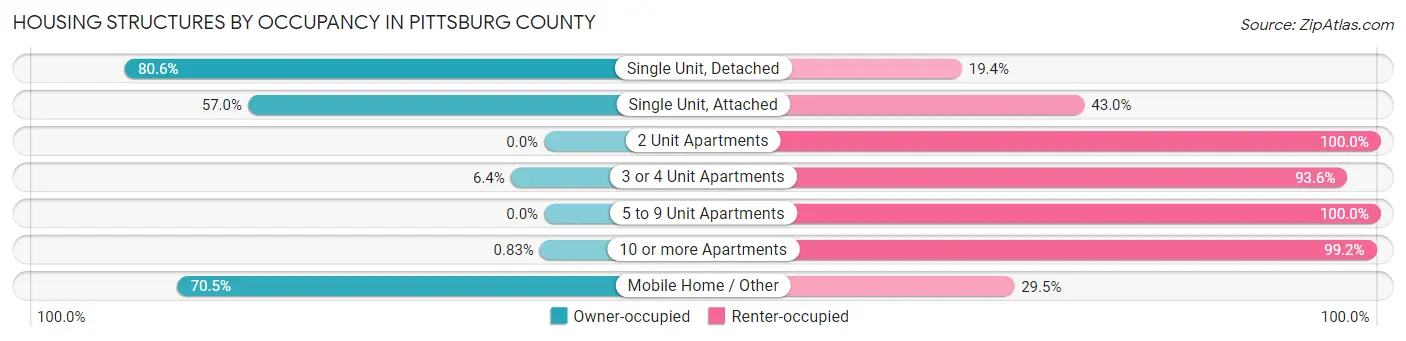
| Structure Type | Owner-occupied | Renter-occupied |
| Single Unit, Detached | 11,058 (80.6%) | 2,656 (19.4%) |
| Single Unit, Attached | 73 (57.0%) | 55 (43.0%) |
| 2 Unit Apartments | 0 (0.0%) | 563 (100.0%) |
| 3 or 4 Unit Apartments | 19 (6.4%) | 277 (93.6%) |
| 5 to 9 Unit Apartments | 0 (0.0%) | 378 (100.0%) |
| 10 or more Apartments | 3 (0.8%) | 357 (99.2%) |
| Mobile Home / Other | 1,386 (70.5%) | 579 (29.5%) |
| Total | 12,539 (72.1%) | 4,865 (28.0%) |
Housing Structures by Number of Rooms in Pittsburg County
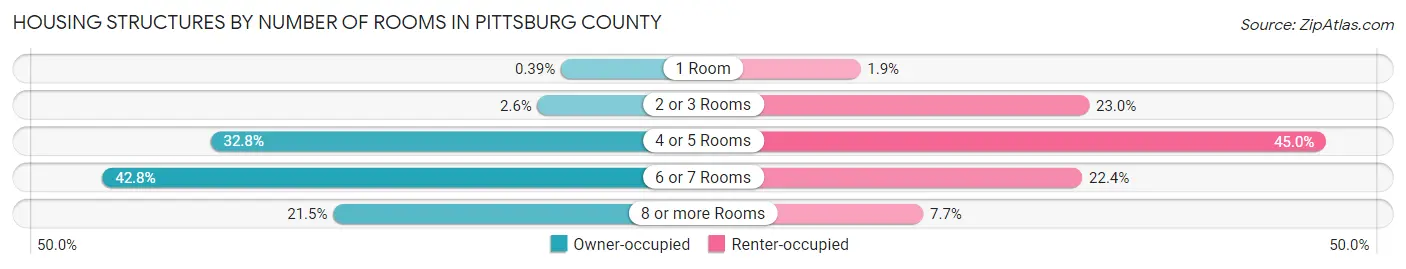
| Number of Rooms | Owner-occupied | Renter-occupied |
| 1 Room | 49 (0.4%) | 92 (1.9%) |
| 2 or 3 Rooms | 320 (2.5%) | 1,121 (23.0%) |
| 4 or 5 Rooms | 4,113 (32.8%) | 2,188 (45.0%) |
| 6 or 7 Rooms | 5,368 (42.8%) | 1,090 (22.4%) |
| 8 or more Rooms | 2,689 (21.4%) | 374 (7.7%) |
| Total | 12,539 (100.0%) | 4,865 (100.0%) |
Housing Structure by Heating Type in Pittsburg County
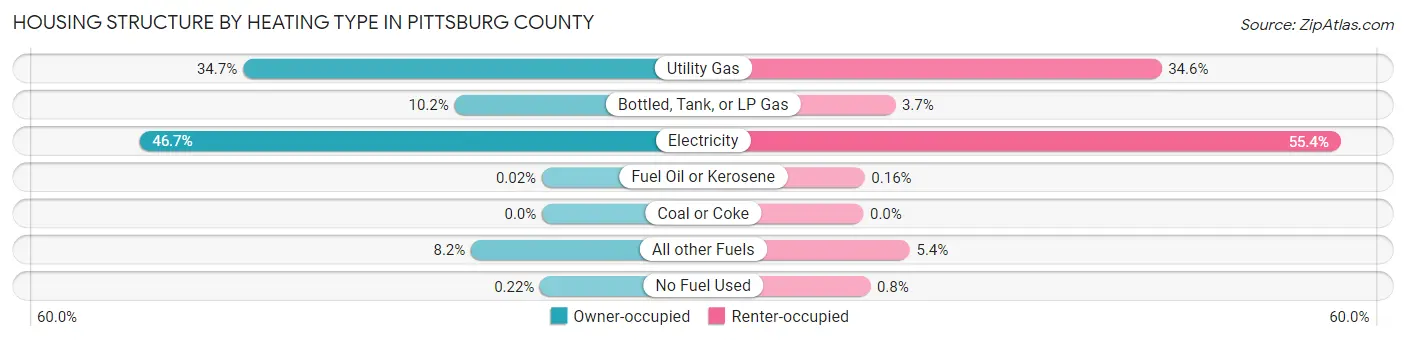
| Heating Type | Owner-occupied | Renter-occupied |
| Utility Gas | 4,348 (34.7%) | 1,682 (34.6%) |
| Bottled, Tank, or LP Gas | 1,273 (10.2%) | 180 (3.7%) |
| Electricity | 5,856 (46.7%) | 2,694 (55.4%) |
| Fuel Oil or Kerosene | 3 (0.0%) | 8 (0.2%) |
| Coal or Coke | 0 (0.0%) | 0 (0.0%) |
| All other Fuels | 1,032 (8.2%) | 262 (5.4%) |
| No Fuel Used | 27 (0.2%) | 39 (0.8%) |
| Total | 12,539 (100.0%) | 4,865 (100.0%) |
Household Vehicle Usage in Pittsburg County
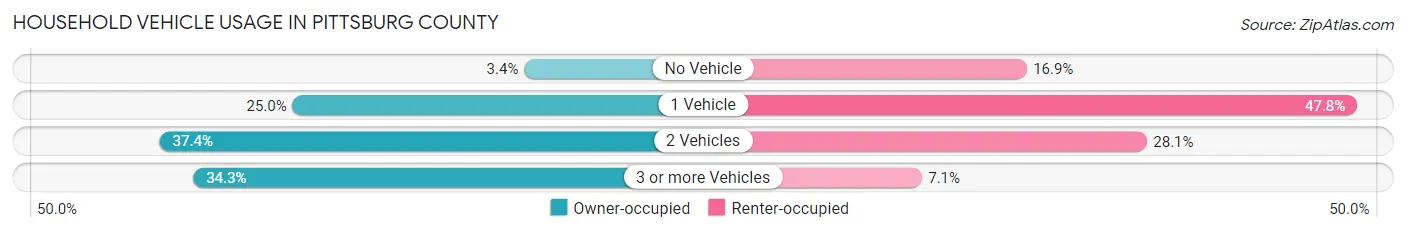
| Vehicles per Household | Owner-occupied | Renter-occupied |
| No Vehicle | 421 (3.4%) | 823 (16.9%) |
| 1 Vehicle | 3,134 (25.0%) | 2,326 (47.8%) |
| 2 Vehicles | 4,688 (37.4%) | 1,369 (28.1%) |
| 3 or more Vehicles | 4,296 (34.3%) | 347 (7.1%) |
| Total | 12,539 (100.0%) | 4,865 (100.0%) |
Real Estate & Mortgages in Pittsburg County
Real Estate and Mortgage Overview in Pittsburg County
| Characteristic | Without Mortgage | With Mortgage |
| Housing Units | 6,701 | 5,838 |
| Median Property Value | $117,400 | $151,000 |
| Median Household Income | $50,309 | $1,030 |
| Monthly Housing Costs | $410 | $104 |
| Real Estate Taxes | $552 | $281 |
Property Value by Mortgage Status in Pittsburg County
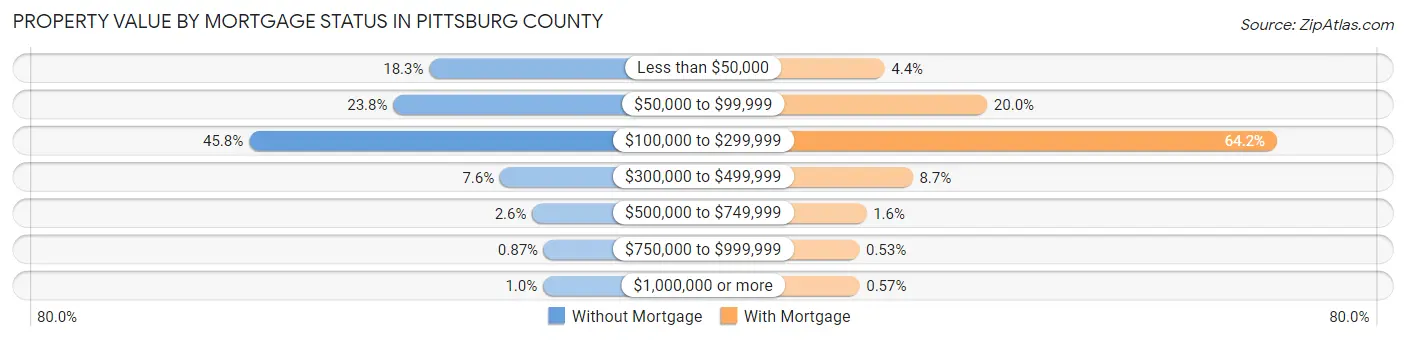
| Property Value | Without Mortgage | With Mortgage |
| Less than $50,000 | 1,228 (18.3%) | 256 (4.4%) |
| $50,000 to $99,999 | 1,596 (23.8%) | 1,169 (20.0%) |
| $100,000 to $299,999 | 3,069 (45.8%) | 3,748 (64.2%) |
| $300,000 to $499,999 | 506 (7.5%) | 506 (8.7%) |
| $500,000 to $749,999 | 177 (2.6%) | 95 (1.6%) |
| $750,000 to $999,999 | 58 (0.9%) | 31 (0.5%) |
| $1,000,000 or more | 67 (1.0%) | 33 (0.6%) |
| Total | 6,701 (100.0%) | 5,838 (100.0%) |
Household Income by Mortgage Status in Pittsburg County
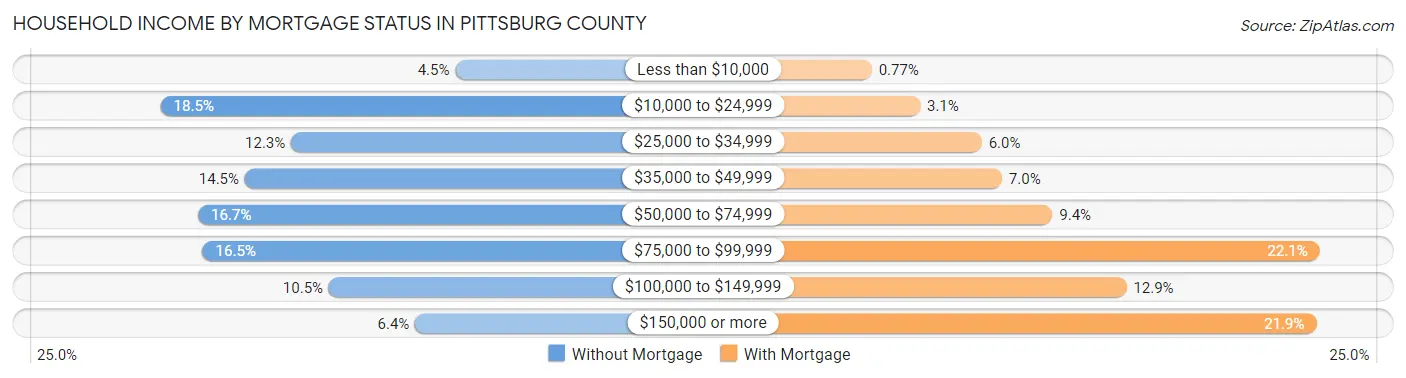
| Household Income | Without Mortgage | With Mortgage |
| Less than $10,000 | 301 (4.5%) | 45 (0.8%) |
| $10,000 to $24,999 | 1,241 (18.5%) | 179 (3.1%) |
| $25,000 to $34,999 | 825 (12.3%) | 351 (6.0%) |
| $35,000 to $49,999 | 972 (14.5%) | 407 (7.0%) |
| $50,000 to $74,999 | 1,122 (16.7%) | 547 (9.4%) |
| $75,000 to $99,999 | 1,107 (16.5%) | 1,290 (22.1%) |
| $100,000 to $149,999 | 704 (10.5%) | 753 (12.9%) |
| $150,000 or more | 429 (6.4%) | 1,281 (21.9%) |
| Total | 6,701 (100.0%) | 5,838 (100.0%) |
Property Value to Household Income Ratio in Pittsburg County
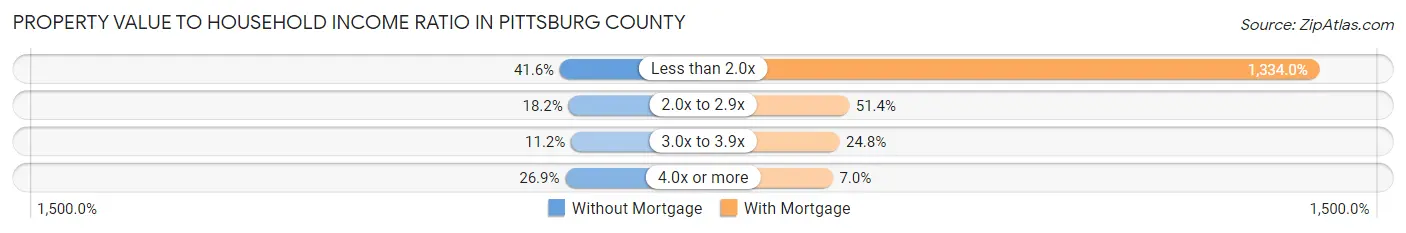
| Value-to-Income Ratio | Without Mortgage | With Mortgage |
| Less than 2.0x | 2,785 (41.6%) | 77,880 (1,334.0%) |
| 2.0x to 2.9x | 1,221 (18.2%) | 3,003 (51.4%) |
| 3.0x to 3.9x | 750 (11.2%) | 1,449 (24.8%) |
| 4.0x or more | 1,805 (26.9%) | 407 (7.0%) |
| Total | 6,701 (100.0%) | 5,838 (100.0%) |
Real Estate Taxes by Mortgage Status in Pittsburg County
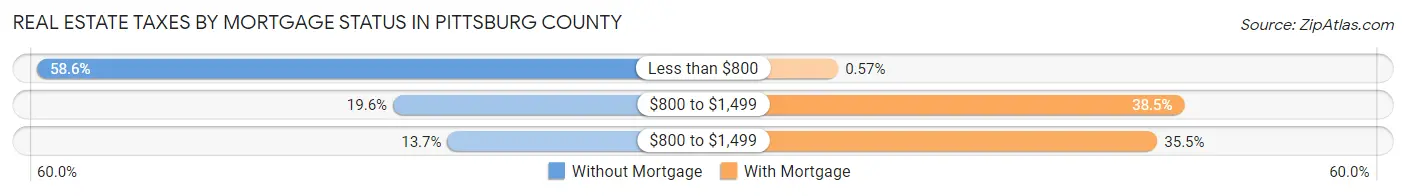
| Property Taxes | Without Mortgage | With Mortgage |
| Less than $800 | 3,928 (58.6%) | 33 (0.6%) |
| $800 to $1,499 | 1,316 (19.6%) | 2,247 (38.5%) |
| $800 to $1,499 | 917 (13.7%) | 2,075 (35.5%) |
| Total | 6,701 (100.0%) | 5,838 (100.0%) |
Health & Disability in Pittsburg County
Health Insurance Coverage by Age in Pittsburg County
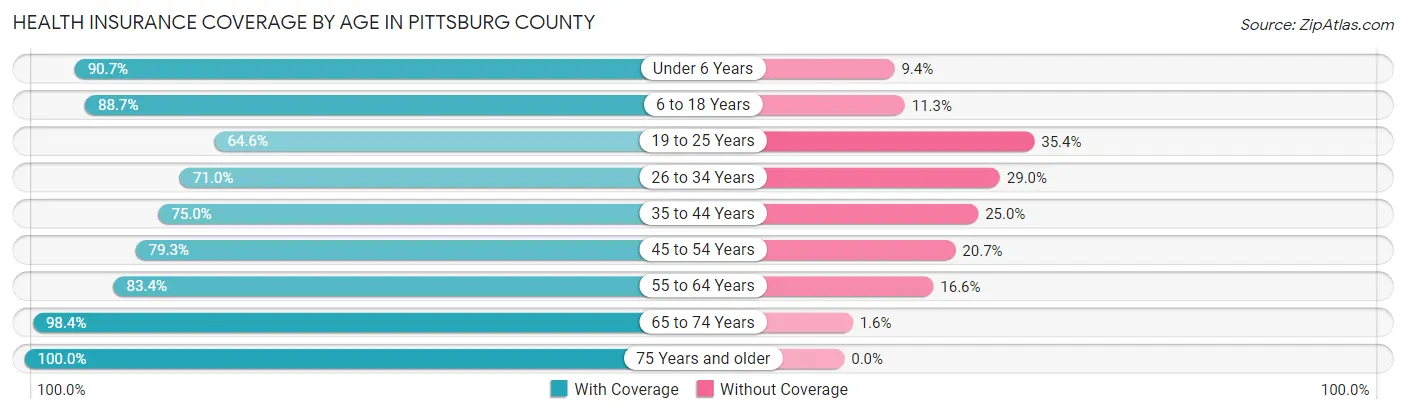
| Age Bracket | With Coverage | Without Coverage |
| Under 6 Years | 2,733 (90.6%) | 282 (9.3%) |
| 6 to 18 Years | 6,582 (88.7%) | 838 (11.3%) |
| 19 to 25 Years | 2,056 (64.6%) | 1,128 (35.4%) |
| 26 to 34 Years | 3,025 (71.0%) | 1,236 (29.0%) |
| 35 to 44 Years | 3,805 (75.0%) | 1,266 (25.0%) |
| 45 to 54 Years | 3,715 (79.3%) | 971 (20.7%) |
| 55 to 64 Years | 4,769 (83.4%) | 950 (16.6%) |
| 65 to 74 Years | 4,590 (98.4%) | 73 (1.6%) |
| 75 Years and older | 3,756 (100.0%) | 0 (0.0%) |
| Total | 35,031 (83.9%) | 6,744 (16.1%) |
Health Insurance Coverage by Citizenship Status in Pittsburg County
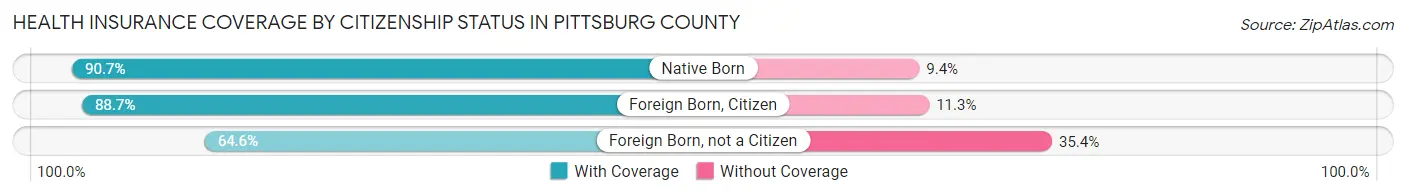
| Citizenship Status | With Coverage | Without Coverage |
| Native Born | 2,733 (90.6%) | 282 (9.3%) |
| Foreign Born, Citizen | 6,582 (88.7%) | 838 (11.3%) |
| Foreign Born, not a Citizen | 2,056 (64.6%) | 1,128 (35.4%) |
Health Insurance Coverage by Household Income in Pittsburg County
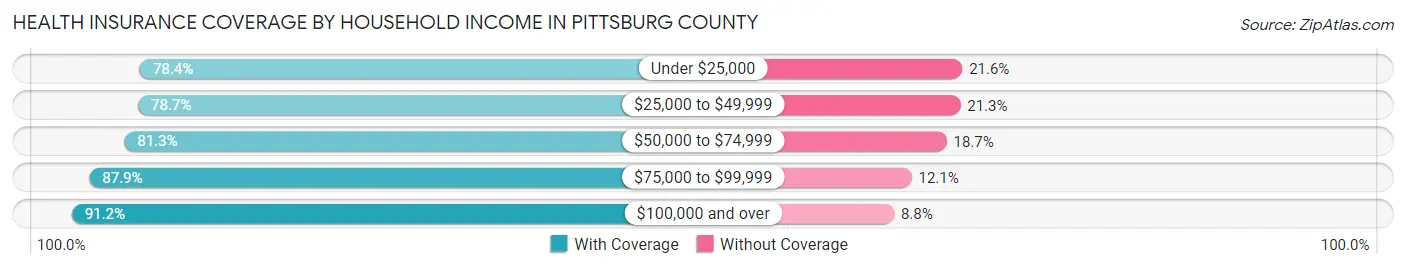
| Household Income | With Coverage | Without Coverage |
| Under $25,000 | 5,855 (78.4%) | 1,615 (21.6%) |
| $25,000 to $49,999 | 6,882 (78.7%) | 1,859 (21.3%) |
| $50,000 to $74,999 | 6,217 (81.3%) | 1,429 (18.7%) |
| $75,000 to $99,999 | 5,154 (87.9%) | 712 (12.1%) |
| $100,000 and over | 10,675 (91.2%) | 1,035 (8.8%) |
Public vs Private Health Insurance Coverage by Age in Pittsburg County
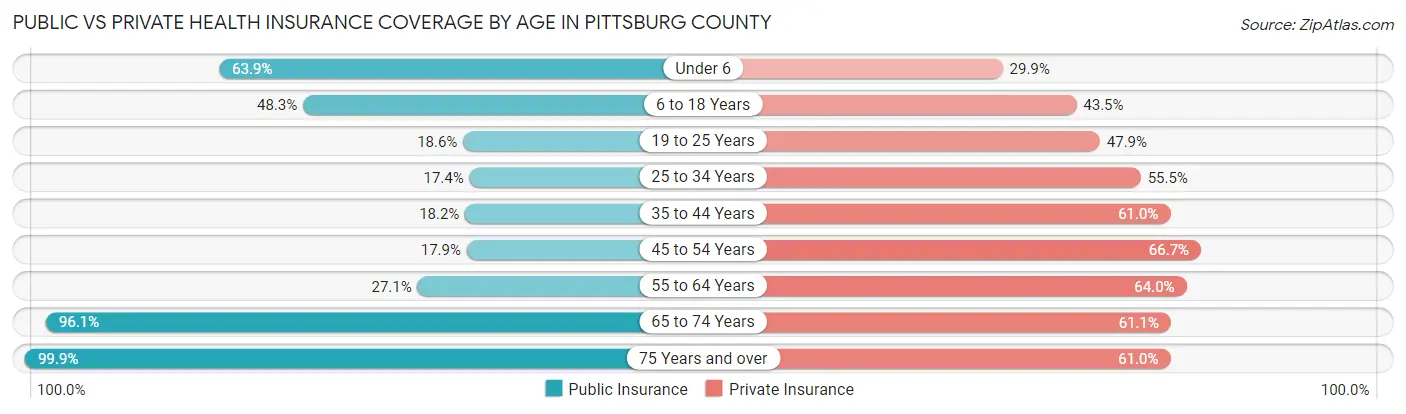
| Age Bracket | Public Insurance | Private Insurance |
| Under 6 | 1,927 (63.9%) | 900 (29.8%) |
| 6 to 18 Years | 3,585 (48.3%) | 3,231 (43.5%) |
| 19 to 25 Years | 592 (18.6%) | 1,525 (47.9%) |
| 25 to 34 Years | 742 (17.4%) | 2,364 (55.5%) |
| 35 to 44 Years | 924 (18.2%) | 3,091 (61.0%) |
| 45 to 54 Years | 840 (17.9%) | 3,123 (66.6%) |
| 55 to 64 Years | 1,548 (27.1%) | 3,658 (64.0%) |
| 65 to 74 Years | 4,479 (96.1%) | 2,847 (61.1%) |
| 75 Years and over | 3,753 (99.9%) | 2,290 (61.0%) |
| Total | 18,390 (44.0%) | 23,029 (55.1%) |
Disability Status by Sex by Age in Pittsburg County
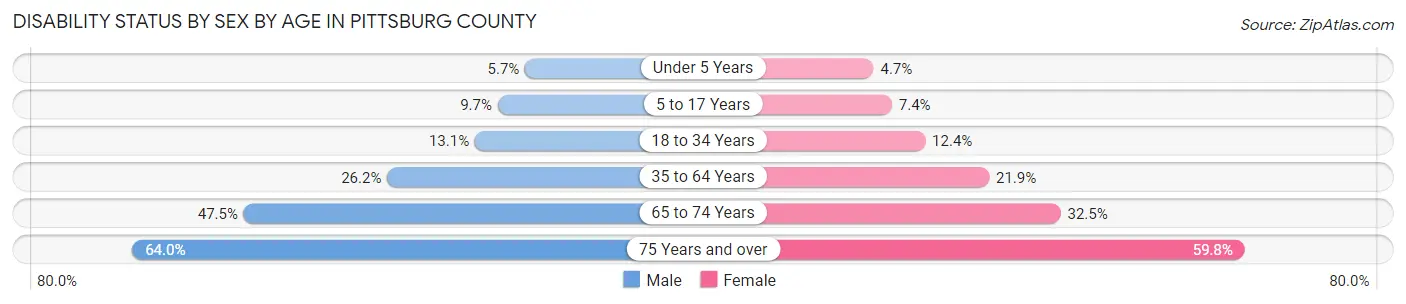
| Age Bracket | Male | Female |
| Under 5 Years | 71 (5.7%) | 61 (4.7%) |
| 5 to 17 Years | 374 (9.7%) | 264 (7.4%) |
| 18 to 34 Years | 526 (13.1%) | 486 (12.4%) |
| 35 to 64 Years | 1,994 (26.2%) | 1,716 (21.9%) |
| 65 to 74 Years | 1,041 (47.4%) | 802 (32.5%) |
| 75 Years and over | 1,035 (64.0%) | 1,280 (59.8%) |
Disability Class by Sex by Age in Pittsburg County
Disability Class: Hearing Difficulty
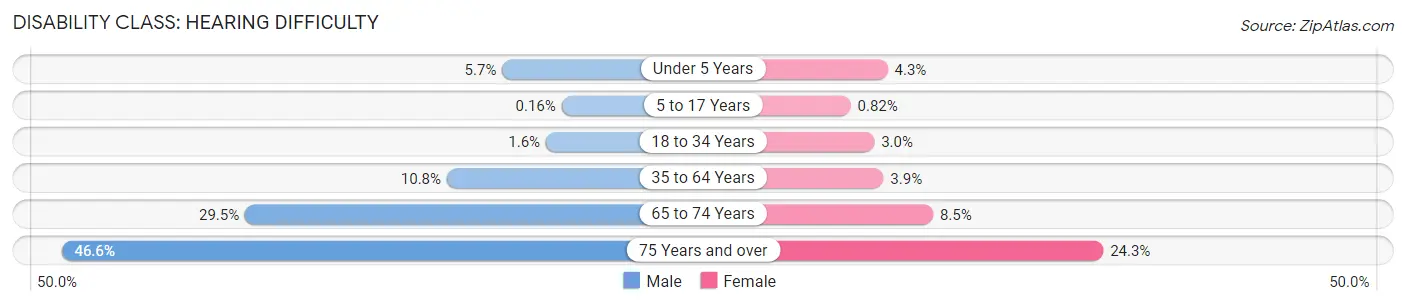
| Age Bracket | Male | Female |
| Under 5 Years | 71 (5.7%) | 55 (4.3%) |
| 5 to 17 Years | 6 (0.2%) | 29 (0.8%) |
| 18 to 34 Years | 65 (1.6%) | 118 (3.0%) |
| 35 to 64 Years | 824 (10.8%) | 303 (3.9%) |
| 65 to 74 Years | 648 (29.5%) | 209 (8.5%) |
| 75 Years and over | 753 (46.6%) | 519 (24.3%) |
Disability Class: Vision Difficulty
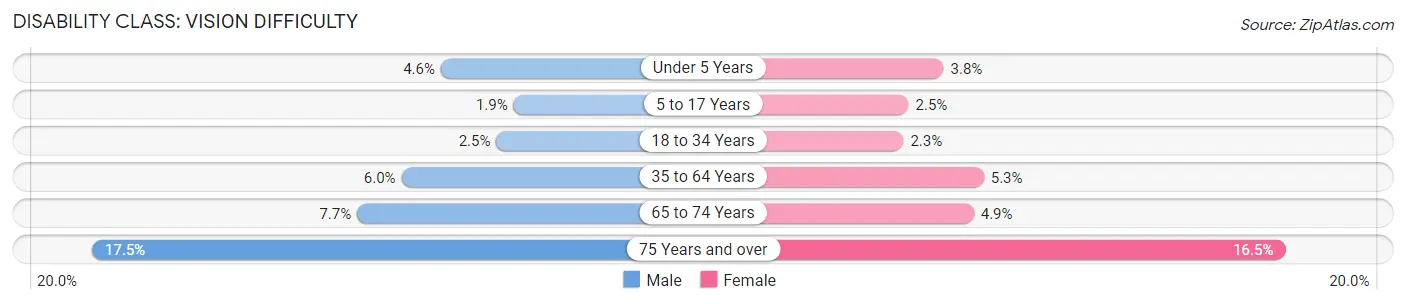
| Age Bracket | Male | Female |
| Under 5 Years | 57 (4.5%) | 49 (3.8%) |
| 5 to 17 Years | 71 (1.8%) | 88 (2.5%) |
| 18 to 34 Years | 100 (2.5%) | 90 (2.3%) |
| 35 to 64 Years | 458 (6.0%) | 414 (5.3%) |
| 65 to 74 Years | 168 (7.7%) | 121 (4.9%) |
| 75 Years and over | 283 (17.5%) | 352 (16.5%) |
Disability Class: Cognitive Difficulty
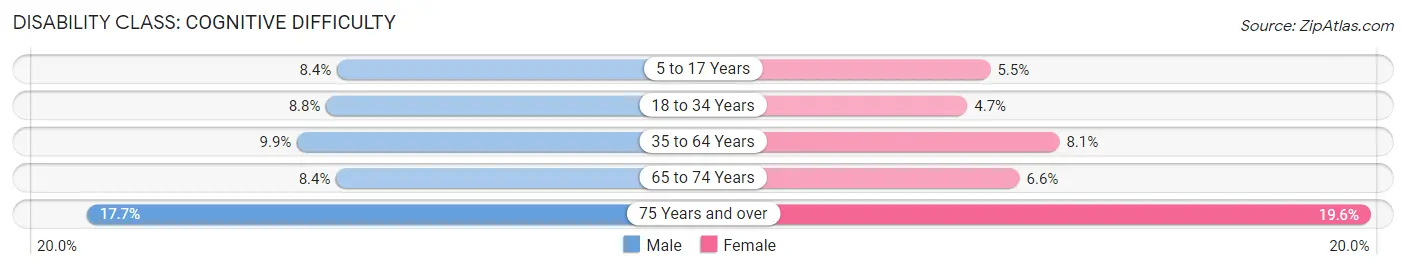
| Age Bracket | Male | Female |
| 5 to 17 Years | 323 (8.4%) | 196 (5.5%) |
| 18 to 34 Years | 353 (8.8%) | 183 (4.7%) |
| 35 to 64 Years | 753 (9.9%) | 634 (8.1%) |
| 65 to 74 Years | 185 (8.4%) | 163 (6.6%) |
| 75 Years and over | 286 (17.7%) | 420 (19.6%) |
Disability Class: Ambulatory Difficulty
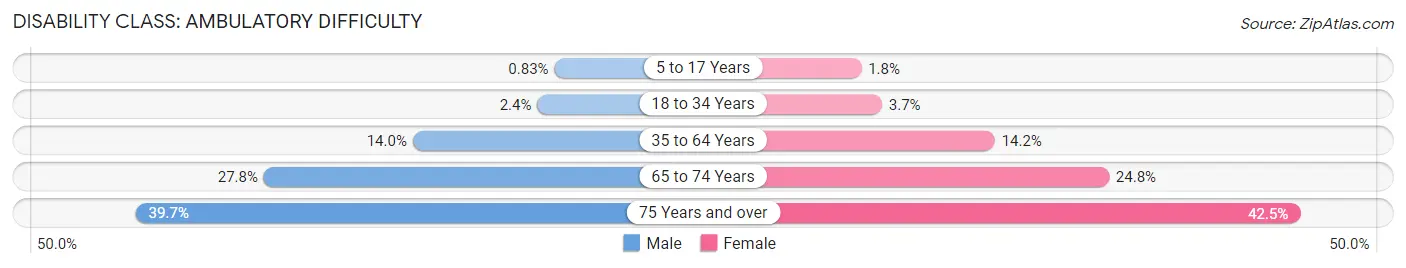
| Age Bracket | Male | Female |
| 5 to 17 Years | 32 (0.8%) | 64 (1.8%) |
| 18 to 34 Years | 97 (2.4%) | 146 (3.7%) |
| 35 to 64 Years | 1,066 (14.0%) | 1,114 (14.2%) |
| 65 to 74 Years | 610 (27.8%) | 612 (24.8%) |
| 75 Years and over | 642 (39.7%) | 910 (42.5%) |
Disability Class: Self-Care Difficulty
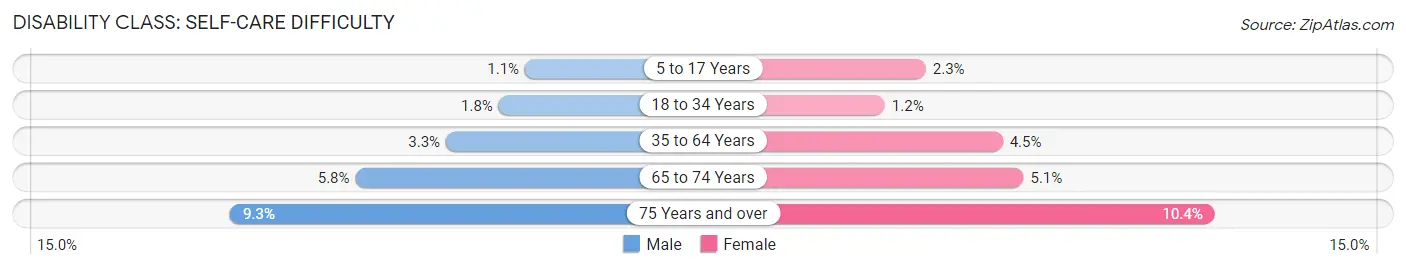
| Age Bracket | Male | Female |
| 5 to 17 Years | 41 (1.1%) | 83 (2.3%) |
| 18 to 34 Years | 72 (1.8%) | 47 (1.2%) |
| 35 to 64 Years | 249 (3.3%) | 352 (4.5%) |
| 65 to 74 Years | 127 (5.8%) | 125 (5.1%) |
| 75 Years and over | 150 (9.3%) | 222 (10.4%) |
Technology Access in Pittsburg County
Computing Device Access in Pittsburg County
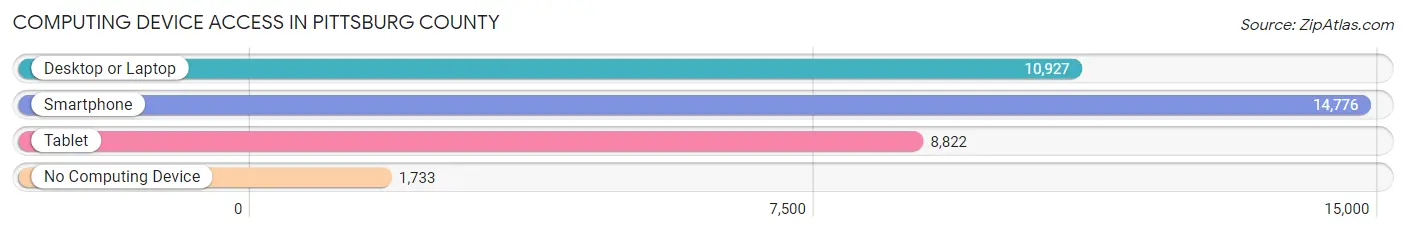
| Device Type | # Households | % Households |
| Desktop or Laptop | 10,927 | 62.8% |
| Smartphone | 14,776 | 84.9% |
| Tablet | 8,822 | 50.7% |
| No Computing Device | 1,733 | 10.0% |
| Total | 17,404 | 100.0% |
Internet Access in Pittsburg County
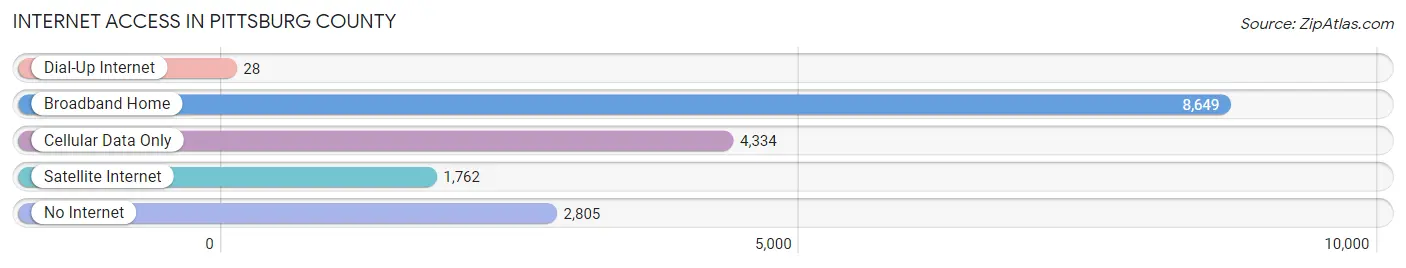
| Internet Type | # Households | % Households |
| Dial-Up Internet | 28 | 0.2% |
| Broadband Home | 8,649 | 49.7% |
| Cellular Data Only | 4,334 | 24.9% |
| Satellite Internet | 1,762 | 10.1% |
| No Internet | 2,805 | 16.1% |
| Total | 17,404 | 100.0% |
Pittsburg County Summary
Pittsburg County is located in the southeastern corner of Oklahoma, and is bordered by the states of Arkansas and Texas. It is part of the McAlester-Pittsburg County Metropolitan Statistical Area, and is the second largest county in the state. The county seat is McAlester, and the county was named after Fort Pittsburg, which was established in 1817.
Geography
Pittsburg County covers an area of 1,717 square miles, and is located in the Ouachita Mountains region of Oklahoma. The county is mostly rural, with the majority of the population living in the county seat of McAlester. The terrain is mostly hilly, with some flat areas in the south and east. The highest point in the county is located in the Ouachita Mountains, at an elevation of 1,890 feet. The county is drained by the Kiamichi River, which flows through the county from north to south.
Climate
Pittsburg County has a humid subtropical climate, with hot summers and mild winters. The average annual temperature is around 64°F, and the average annual precipitation is around 44 inches.
Demographics
As of the 2010 census, Pittsburg County had a population of 45,837. The racial makeup of the county was 79.2% White, 15.2% African American, 0.7% Native American, 0.5% Asian, 0.1% Pacific Islander, and 3.3% from two or more races. Hispanic or Latino of any race were 3.3% of the population.
Economy
Pittsburg County is home to a variety of industries, including manufacturing, agriculture, and energy production. The county is home to several large employers, including the McAlester Army Ammunition Plant, which is the largest employer in the county. Other major employers include the Pittsburg County Regional Medical Center, the Pittsburg County Courthouse, and the Pittsburg County Sheriff's Office.
Agriculture is an important part of the county's economy, with the main crops being cotton, soybeans, and wheat. The county is also home to several energy production facilities, including coal mines, natural gas wells, and wind farms.
History
Pittsburg County was created in 1907 from part of the Choctaw Nation. The county was named after Fort Pittsburg, which was established in 1817. The county seat was originally located in Kiowa, but was moved to McAlester in 1909.
The county has a long history of coal mining, and the first coal mine in the county was opened in 1872. The coal industry was an important part of the county's economy for many years, and the county was home to several large coal mines.
The county was also home to several Native American tribes, including the Choctaw, Chickasaw, and Cherokee. The county was also home to several military installations, including Fort Towson, which was established in 1824.
Pittsburg County has a long history of oil and gas production, and the first oil well in the county was drilled in 1914. The county is still home to several oil and gas production facilities, and is also home to several wind farms.
Pittsburg County is also home to several historical sites, including the Fort Towson Historic Site, the McAlester Army Ammunition Plant, and the Pittsburg County Courthouse. The county is also home to several museums, including the Pittsburg County Historical Museum and the Pittsburg County Coal Mining Museum.
Common Questions
What is the Total Population of Pittsburg County?
Total Population of Pittsburg County is 43,758.
What is the Total Male Population of Pittsburg County?
Total Male Population of Pittsburg County is 22,282.
What is the Total Female Population of Pittsburg County?
Total Female Population of Pittsburg County is 21,476.
What is the Ratio of Males per 100 Females in Pittsburg County?
There are 103.75 Males per 100 Females in Pittsburg County.
What is the Ratio of Females per 100 Males in Pittsburg County?
There are 96.38 Females per 100 Males in Pittsburg County.
What is the Median Population Age in Pittsburg County?
Median Population Age in Pittsburg County is 40.4 Years.
What is the Average Family Size in Pittsburg County
Average Family Size in Pittsburg County is 2.9 People.
What is the Average Household Size in Pittsburg County
Average Household Size in Pittsburg County is 2.4 People.
What is Per Capita Income in Pittsburg County?
Per Capita income in Pittsburg County is $28,257.
What is the Median Family Income in Pittsburg County?
Median Family Income in Pittsburg County is $66,972.
What is the Median Household income in Pittsburg County?
Median Household Income in Pittsburg County is $53,054.
What is Income or Wage Gap in Pittsburg County?
Income or Wage Gap in Pittsburg County is 35.7%.
Women in Pittsburg County earn 64.3 cents for every dollar earned by a man.
What is Family Income Deficit in Pittsburg County?
Family Income Deficit in Pittsburg County is $10,603.
Families that are below poverty line in Pittsburg County earn $10,603 less on average than the poverty threshold level.
What is Inequality or Gini Index in Pittsburg County?
Inequality or Gini Index in Pittsburg County is 0.47.
How Large is the Labor Force in Pittsburg County?
There are 18,451 People in the Labor Forcein in Pittsburg County.
What is the Percentage of People in the Labor Force in Pittsburg County?
52.8% of People are in the Labor Force in Pittsburg County.
What is the Unemployment Rate in Pittsburg County?
Unemployment Rate in Pittsburg County is 6.3%.