Payne County, OK
Payne County Overview
82,058
TOTAL POPULATION
42,359
MALE POPULATION
39,699
FEMALE POPULATION
106.70
MALES / 100 FEMALES
93.72
FEMALES / 100 MALES
27.2
MEDIAN AGE
2.9
AVG FAMILY SIZE
2.3
AVG HOUSEHOLD SIZE
$26,916
PER CAPITA INCOME
$71,757
AVG FAMILY INCOME
$46,658
AVG HOUSEHOLD INCOME
34.4%
WAGE / INCOME GAP [ % ]
65.6¢/ $1
WAGE / INCOME GAP [ $ ]
$10,748
FAMILY INCOME DEFICIT
0.49
INEQUALITY / GINI INDEX
39,092
LABOR FORCE [ PEOPLE ]
57.1%
PERCENT IN LABOR FORCE
4.8%
UNEMPLOYMENT RATE
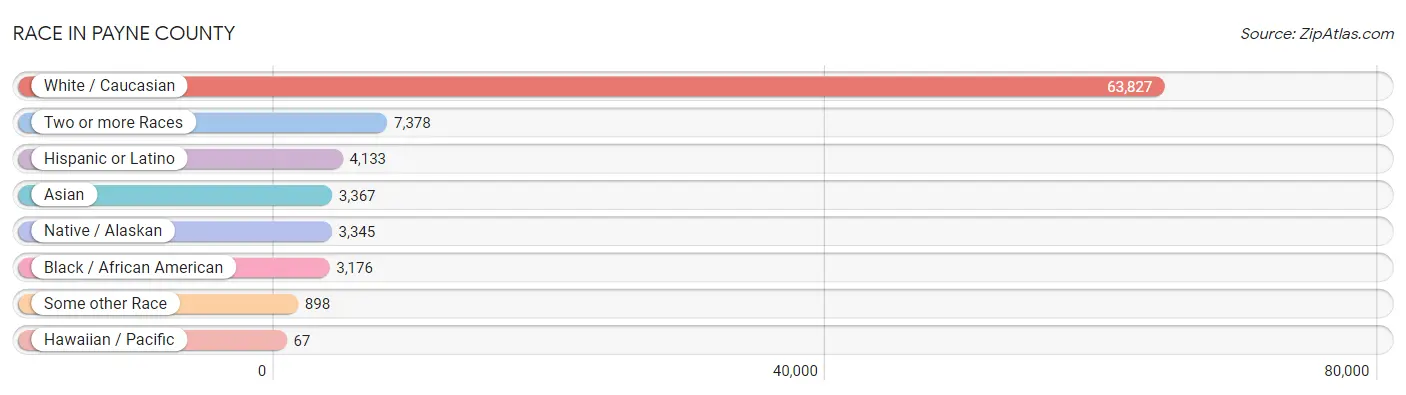
Race in Payne County
The most populous races in Payne County are White / Caucasian (63,827 | 77.8%), Two or more Races (7,378 | 9.0%), and Hispanic or Latino (4,133 | 5.0%).
| Race | # Population | % Population |
| Asian | 3,367 | 4.1% |
| Black / African American | 3,176 | 3.9% |
| Hawaiian / Pacific | 67 | 0.1% |
| Hispanic or Latino | 4,133 | 5.0% |
| Native / Alaskan | 3,345 | 4.1% |
| White / Caucasian | 63,827 | 77.8% |
| Two or more Races | 7,378 | 9.0% |
| Some other Race | 898 | 1.1% |
| Total | 82,058 | 100.0% |
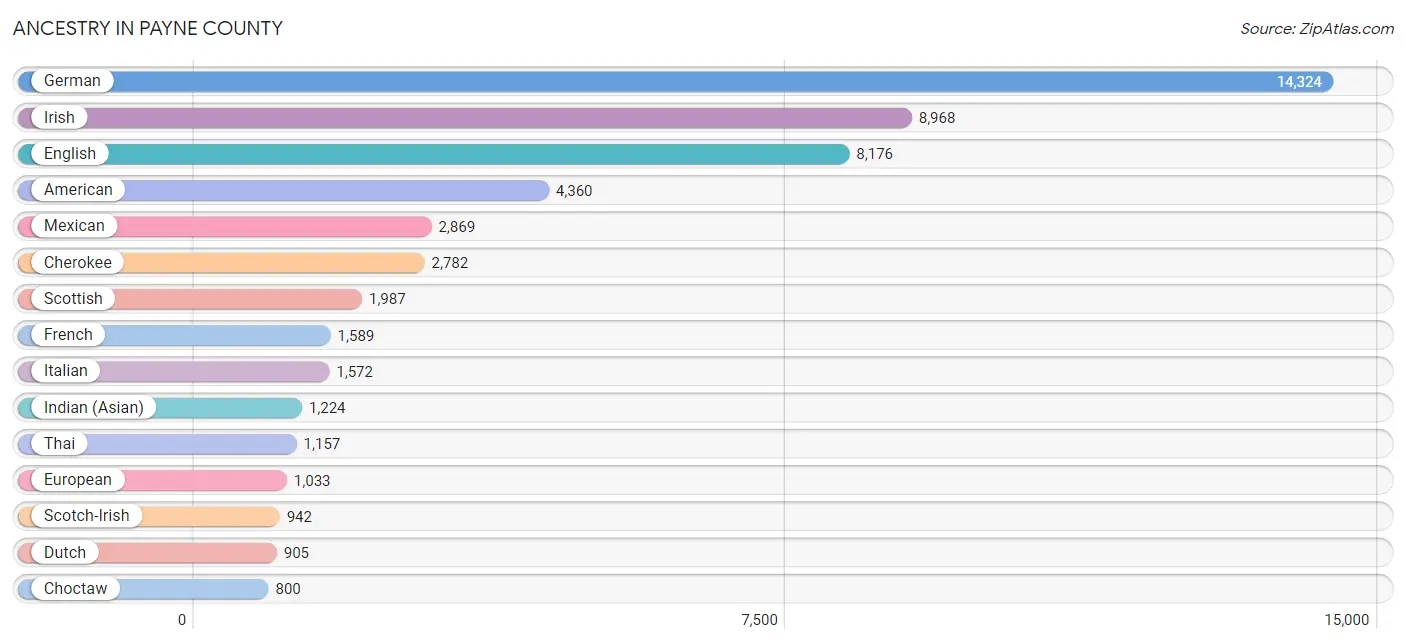
Ancestry in Payne County
The most populous ancestries reported in Payne County are German (14,324 | 17.5%), Irish (8,968 | 10.9%), English (8,176 | 10.0%), American (4,360 | 5.3%), and Mexican (2,869 | 3.5%), together accounting for 47.2% of all Payne County residents.
| Ancestry | # Population | % Population |
| Afghan | 27 | 0.0% |
| African | 238 | 0.3% |
| Albanian | 67 | 0.1% |
| American | 4,360 | 5.3% |
| Apache | 39 | 0.1% |
| Arab | 502 | 0.6% |
| Argentinean | 8 | 0.0% |
| Australian | 1 | 0.0% |
| Austrian | 47 | 0.1% |
| Bangladeshi | 22 | 0.0% |
| Basque | 16 | 0.0% |
| Belgian | 31 | 0.0% |
| Belizean | 3 | 0.0% |
| Bhutanese | 125 | 0.2% |
| Blackfeet | 52 | 0.1% |
| Bolivian | 21 | 0.0% |
| Brazilian | 6 | 0.0% |
| British | 676 | 0.8% |
| Burmese | 352 | 0.4% |
| Cajun | 90 | 0.1% |
| Cambodian | 53 | 0.1% |
| Canadian | 148 | 0.2% |
| Central American | 112 | 0.1% |
| Central American Indian | 76 | 0.1% |
| Cherokee | 2,782 | 3.4% |
| Chickasaw | 226 | 0.3% |
| Chippewa | 8 | 0.0% |
| Choctaw | 800 | 1.0% |
| Colombian | 163 | 0.2% |
| Comanche | 83 | 0.1% |
| Costa Rican | 8 | 0.0% |
| Creek | 628 | 0.8% |
| Croatian | 16 | 0.0% |
| Cuban | 45 | 0.1% |
| Czech | 420 | 0.5% |
| Czechoslovakian | 49 | 0.1% |
| Danish | 237 | 0.3% |
| Delaware | 14 | 0.0% |
| Dutch | 905 | 1.1% |
| Dutch West Indian | 123 | 0.2% |
| Eastern European | 124 | 0.2% |
| Ecuadorian | 13 | 0.0% |
| Egyptian | 36 | 0.0% |
| English | 8,176 | 10.0% |
| Estonian | 12 | 0.0% |
| European | 1,033 | 1.3% |
| Filipino | 147 | 0.2% |
| Finnish | 59 | 0.1% |
| French | 1,589 | 1.9% |
| French American Indian | 19 | 0.0% |
| French Canadian | 125 | 0.2% |
| German | 14,324 | 17.5% |
| Ghanaian | 52 | 0.1% |
| Greek | 85 | 0.1% |
| Guatemalan | 53 | 0.1% |
| Honduran | 40 | 0.1% |
| Indian (Asian) | 1,224 | 1.5% |
| Iranian | 275 | 0.3% |
| Iraqi | 37 | 0.1% |
| Irish | 8,968 | 10.9% |
| Iroquois | 12 | 0.0% |
| Italian | 1,572 | 1.9% |
| Japanese | 177 | 0.2% |
| Kiowa | 22 | 0.0% |
| Korean | 240 | 0.3% |
| Laotian | 55 | 0.1% |
| Lebanese | 55 | 0.1% |
| Lithuanian | 43 | 0.1% |
| Menominee | 8 | 0.0% |
| Mexican | 2,869 | 3.5% |
| Mexican American Indian | 9 | 0.0% |
| Mongolian | 102 | 0.1% |
| Moroccan | 4 | 0.0% |
| Native Hawaiian | 104 | 0.1% |
| Navajo | 12 | 0.0% |
| Nigerian | 237 | 0.3% |
| Northern European | 123 | 0.2% |
| Norwegian | 429 | 0.5% |
| Osage | 103 | 0.1% |
| Ottawa | 20 | 0.0% |
| Pakistani | 139 | 0.2% |
| Palestinian | 6 | 0.0% |
| Panamanian | 11 | 0.0% |
| Pennsylvania German | 16 | 0.0% |
| Peruvian | 9 | 0.0% |
| Polish | 726 | 0.9% |
| Portuguese | 168 | 0.2% |
| Potawatomi | 157 | 0.2% |
| Puerto Rican | 154 | 0.2% |
| Romanian | 11 | 0.0% |
| Russian | 129 | 0.2% |
| Samoan | 4 | 0.0% |
| Scandinavian | 120 | 0.2% |
| Scotch-Irish | 942 | 1.1% |
| Scottish | 1,987 | 2.4% |
| Seminole | 57 | 0.1% |
| Sioux | 13 | 0.0% |
| Slovak | 27 | 0.0% |
| South American | 218 | 0.3% |
| Spaniard | 130 | 0.2% |
| Spanish | 152 | 0.2% |
| Spanish American | 27 | 0.0% |
| Sri Lankan | 153 | 0.2% |
| Subsaharan African | 542 | 0.7% |
| Swedish | 680 | 0.8% |
| Swiss | 382 | 0.5% |
| Thai | 1,157 | 1.4% |
| Tohono O'Odham | 8 | 0.0% |
| Turkish | 102 | 0.1% |
| Ugandan | 24 | 0.0% |
| Ukrainian | 24 | 0.0% |
| Venezuelan | 4 | 0.0% |
| Vietnamese | 56 | 0.1% |
| Welsh | 332 | 0.4% | View All 114 Rows |
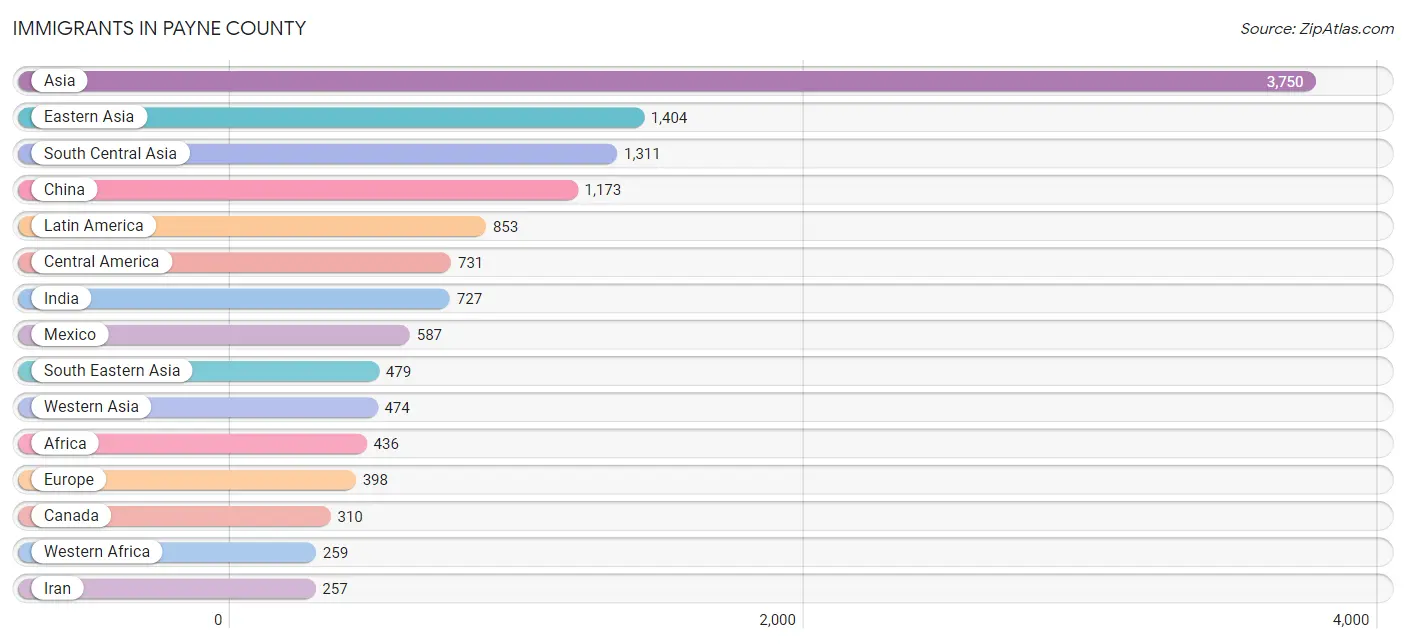
Immigrants in Payne County
The most numerous immigrant groups reported in Payne County came from Asia (3,750 | 4.6%), Eastern Asia (1,404 | 1.7%), South Central Asia (1,311 | 1.6%), China (1,173 | 1.4%), and Latin America (853 | 1.0%), together accounting for 10.3% of all Payne County residents.
| Immigration Origin | # Population | % Population |
| Afghanistan | 42 | 0.1% |
| Africa | 436 | 0.5% |
| Asia | 3,750 | 4.6% |
| Bangladesh | 56 | 0.1% |
| Bolivia | 21 | 0.0% |
| Brazil | 20 | 0.0% |
| Cambodia | 177 | 0.2% |
| Canada | 310 | 0.4% |
| Caribbean | 18 | 0.0% |
| Central America | 731 | 0.9% |
| China | 1,173 | 1.4% |
| Colombia | 63 | 0.1% |
| Congo | 23 | 0.0% |
| Costa Rica | 8 | 0.0% |
| Croatia | 7 | 0.0% |
| Cuba | 18 | 0.0% |
| Eastern Africa | 70 | 0.1% |
| Eastern Asia | 1,404 | 1.7% |
| Eastern Europe | 18 | 0.0% |
| Egypt | 18 | 0.0% |
| England | 42 | 0.1% |
| Europe | 398 | 0.5% |
| Fiji | 5 | 0.0% |
| France | 69 | 0.1% |
| Germany | 97 | 0.1% |
| Ghana | 38 | 0.1% |
| Greece | 37 | 0.1% |
| Guatemala | 96 | 0.1% |
| Honduras | 40 | 0.1% |
| Hong Kong | 142 | 0.2% |
| India | 727 | 0.9% |
| Indonesia | 55 | 0.1% |
| Iran | 257 | 0.3% |
| Iraq | 90 | 0.1% |
| Italy | 12 | 0.0% |
| Japan | 91 | 0.1% |
| Kenya | 6 | 0.0% |
| Korea | 140 | 0.2% |
| Kuwait | 135 | 0.2% |
| Latin America | 853 | 1.0% |
| Malaysia | 92 | 0.1% |
| Mexico | 587 | 0.7% |
| Middle Africa | 44 | 0.1% |
| Nepal | 168 | 0.2% |
| Nigeria | 203 | 0.3% |
| Northern Africa | 51 | 0.1% |
| Northern Europe | 128 | 0.2% |
| Oceania | 5 | 0.0% |
| Pakistan | 21 | 0.0% |
| Philippines | 50 | 0.1% |
| Russia | 11 | 0.0% |
| Saudi Arabia | 215 | 0.3% |
| South America | 104 | 0.1% |
| South Central Asia | 1,311 | 1.6% |
| South Eastern Asia | 479 | 0.6% |
| Southern Europe | 86 | 0.1% |
| Spain | 37 | 0.1% |
| Sri Lanka | 40 | 0.1% |
| Sweden | 16 | 0.0% |
| Taiwan | 34 | 0.0% |
| Thailand | 22 | 0.0% |
| Turkey | 34 | 0.0% |
| Uganda | 64 | 0.1% |
| Vietnam | 83 | 0.1% |
| Western Africa | 259 | 0.3% |
| Western Asia | 474 | 0.6% |
| Western Europe | 166 | 0.2% |
| Zaire | 21 | 0.0% | View All 68 Rows |
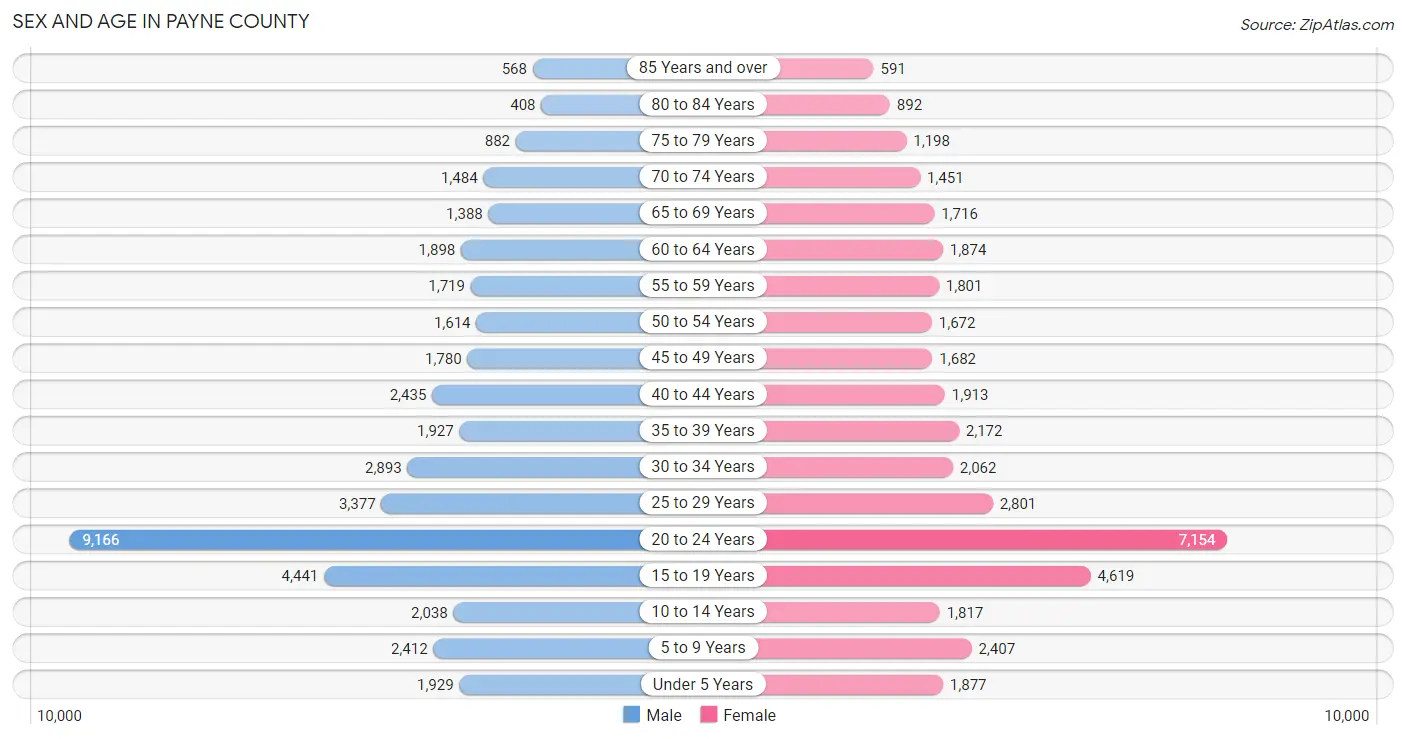
Sex and Age in Payne County
Sex and Age in Payne County
The most populous age groups in Payne County are 20 to 24 Years (9,166 | 21.6%) for men and 20 to 24 Years (7,154 | 18.0%) for women.
| Age Bracket | Male | Female |
| Under 5 Years | 1,929 (4.5%) | 1,877 (4.7%) |
| 5 to 9 Years | 2,412 (5.7%) | 2,407 (6.1%) |
| 10 to 14 Years | 2,038 (4.8%) | 1,817 (4.6%) |
| 15 to 19 Years | 4,441 (10.5%) | 4,619 (11.6%) |
| 20 to 24 Years | 9,166 (21.6%) | 7,154 (18.0%) |
| 25 to 29 Years | 3,377 (8.0%) | 2,801 (7.1%) |
| 30 to 34 Years | 2,893 (6.8%) | 2,062 (5.2%) |
| 35 to 39 Years | 1,927 (4.5%) | 2,172 (5.5%) |
| 40 to 44 Years | 2,435 (5.8%) | 1,913 (4.8%) |
| 45 to 49 Years | 1,780 (4.2%) | 1,682 (4.2%) |
| 50 to 54 Years | 1,614 (3.8%) | 1,672 (4.2%) |
| 55 to 59 Years | 1,719 (4.1%) | 1,801 (4.5%) |
| 60 to 64 Years | 1,898 (4.5%) | 1,874 (4.7%) |
| 65 to 69 Years | 1,388 (3.3%) | 1,716 (4.3%) |
| 70 to 74 Years | 1,484 (3.5%) | 1,451 (3.7%) |
| 75 to 79 Years | 882 (2.1%) | 1,198 (3.0%) |
| 80 to 84 Years | 408 (1.0%) | 892 (2.2%) |
| 85 Years and over | 568 (1.3%) | 591 (1.5%) |
| Total | 42,359 (100.0%) | 39,699 (100.0%) |
Families and Households in Payne County
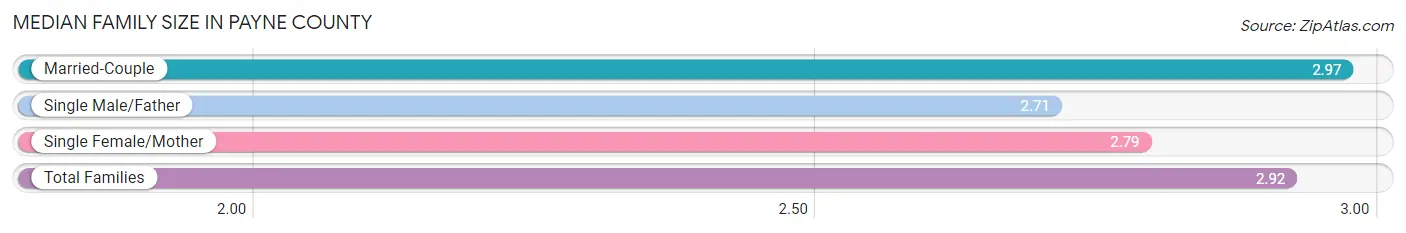
Median Family Size in Payne County
The median family size in Payne County is 2.92 persons per family, with married-couple families (12,780 | 75.1%) accounting for the largest median family size of 2.97 persons per family. On the other hand, single male/father families (1,571 | 9.2%) represent the smallest median family size with 2.71 persons per family.
| Family Type | # Families | Family Size |
| Married-Couple | 12,780 (75.1%) | 2.97 |
| Single Male/Father | 1,571 (9.2%) | 2.71 |
| Single Female/Mother | 2,658 (15.6%) | 2.79 |
| Total Families | 17,009 (100.0%) | 2.92 |
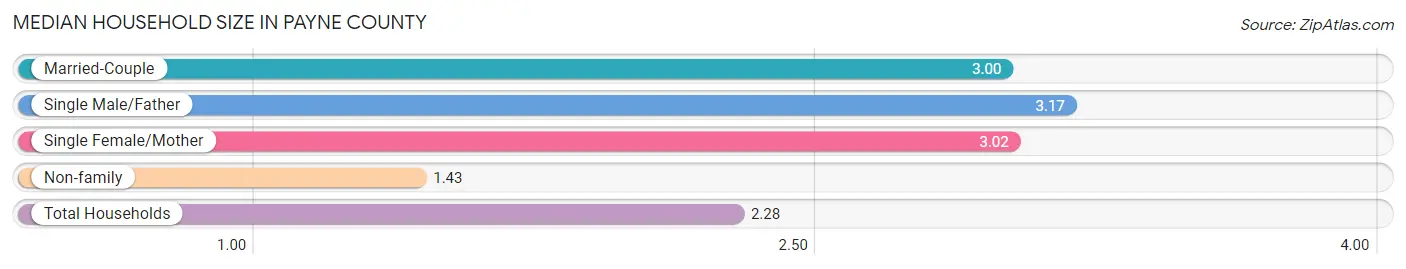
Median Household Size in Payne County
The median household size in Payne County is 2.28 persons per household, with single male/father households (1,571 | 4.9%) accounting for the largest median household size of 3.17 persons per household. non-family households (14,834 | 46.6%) represent the smallest median household size with 1.43 persons per household.
| Household Type | # Households | Household Size |
| Married-Couple | 12,780 (40.1%) | 3.00 |
| Single Male/Father | 1,571 (4.9%) | 3.17 |
| Single Female/Mother | 2,658 (8.4%) | 3.02 |
| Non-family | 14,834 (46.6%) | 1.43 |
| Total Households | 31,843 (100.0%) | 2.28 |
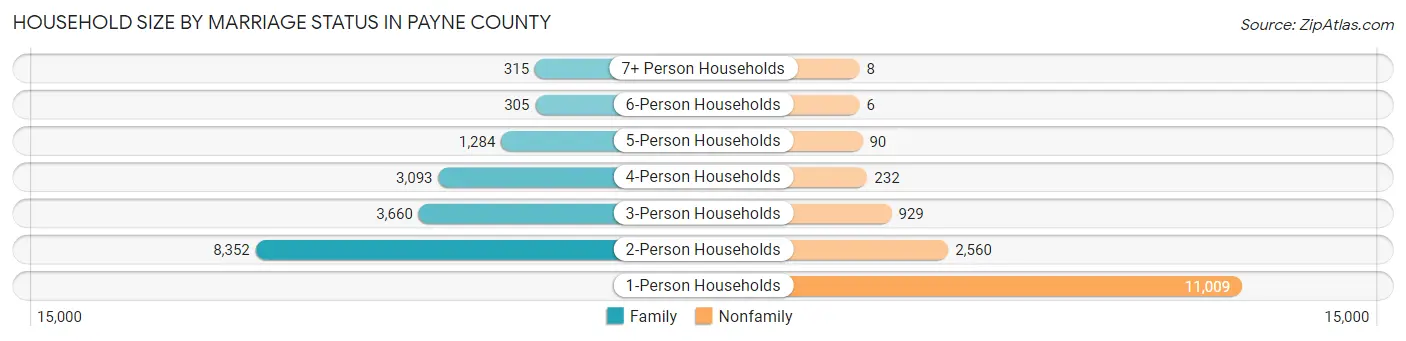
Household Size by Marriage Status in Payne County
Out of a total of 31,843 households in Payne County, 17,009 (53.4%) are family households, while 14,834 (46.6%) are nonfamily households. The most numerous type of family households are 2-person households, comprising 8,352, and the most common type of nonfamily households are 1-person households, comprising 11,009.
| Household Size | Family Households | Nonfamily Households |
| 1-Person Households | - | 11,009 (34.6%) |
| 2-Person Households | 8,352 (26.2%) | 2,560 (8.0%) |
| 3-Person Households | 3,660 (11.5%) | 929 (2.9%) |
| 4-Person Households | 3,093 (9.7%) | 232 (0.7%) |
| 5-Person Households | 1,284 (4.0%) | 90 (0.3%) |
| 6-Person Households | 305 (1.0%) | 6 (0.0%) |
| 7+ Person Households | 315 (1.0%) | 8 (0.0%) |
| Total | 17,009 (53.4%) | 14,834 (46.6%) |
Female Fertility in Payne County
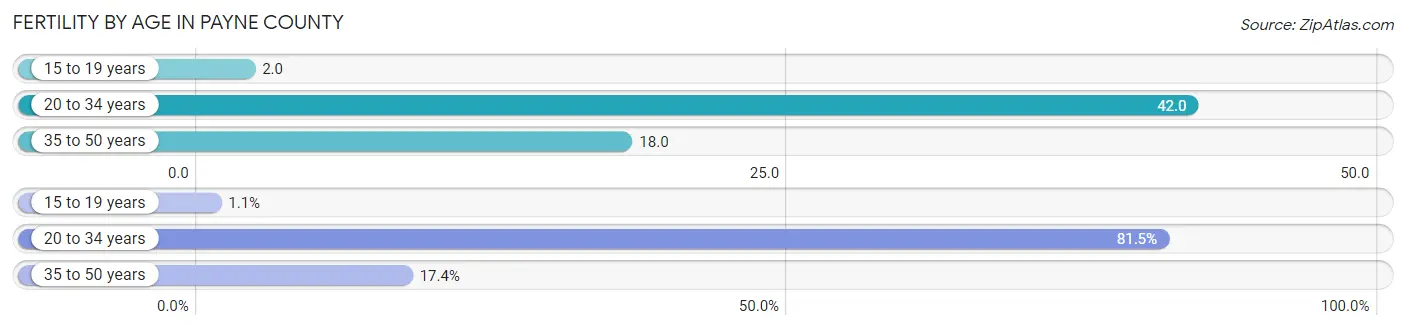
Fertility by Age in Payne County
Average fertility rate in Payne County is 27.0 births per 1,000 women. Women in the age bracket of 20 to 34 years have the highest fertility rate with 42.0 births per 1,000 women. Women in the age bracket of 20 to 34 years acount for 81.5% of all women with births.
| Age Bracket | Women with Births | Births / 1,000 Women |
| 15 to 19 years | 7 (1.1%) | 2.0 |
| 20 to 34 years | 507 (81.5%) | 42.0 |
| 35 to 50 years | 108 (17.4%) | 18.0 |
| Total | 622 (100.0%) | 27.0 |
Fertility by Age by Marriage Status in Payne County
75.4% of women with births (622) in Payne County are married. The highest percentage of unmarried women with births falls into 15 to 19 years age bracket with 85.7% of them unmarried at the time of birth, while the lowest percentage of unmarried women with births belong to 35 to 50 years age bracket with 11.1% of them unmarried.
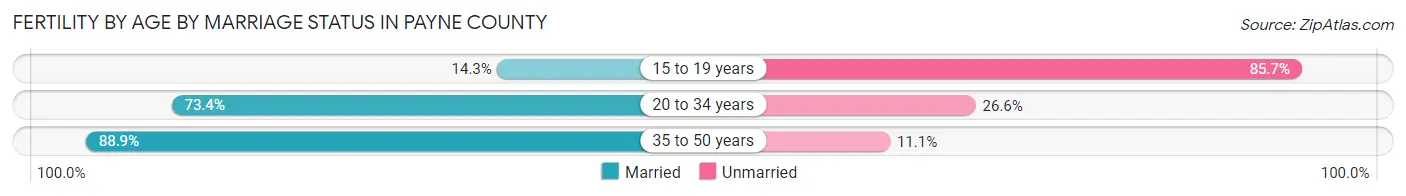
| Age Bracket | Married | Unmarried |
| 15 to 19 years | 1 (14.3%) | 6 (85.7%) |
| 20 to 34 years | 372 (73.4%) | 135 (26.6%) |
| 35 to 50 years | 96 (88.9%) | 12 (11.1%) |
| Total | 469 (75.4%) | 153 (24.6%) |
Fertility by Education in Payne County
Average fertility rate in Payne County is 27.0 births per 1,000 women. Women with the education attainment of graduate degree have the highest fertility rate of 92.0 births per 1,000 women, while women with the education attainment of less than high school have the lowest fertility at 9.0 births per 1,000 women. Women with the education attainment of high school diploma represent 33.6% of all women with births.
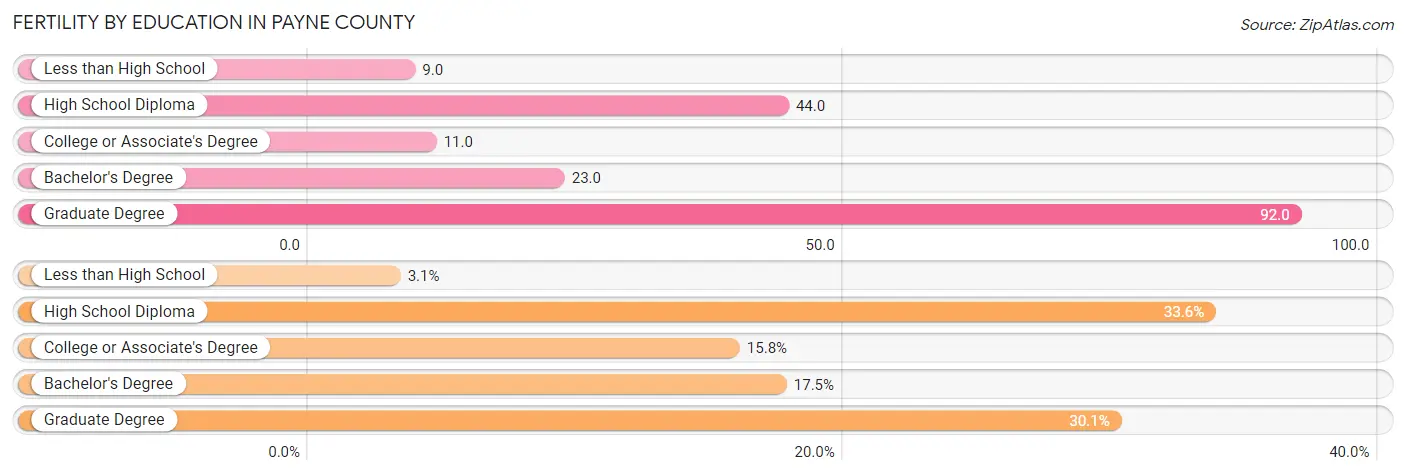
| Educational Attainment | Women with Births | Births / 1,000 Women |
| Less than High School | 19 (3.0%) | 9.0 |
| High School Diploma | 209 (33.6%) | 44.0 |
| College or Associate's Degree | 98 (15.8%) | 11.0 |
| Bachelor's Degree | 109 (17.5%) | 23.0 |
| Graduate Degree | 187 (30.1%) | 92.0 |
| Total | 622 (100.0%) | 27.0 |
Fertility by Education by Marriage Status in Payne County
24.6% of women with births in Payne County are unmarried. Women with the educational attainment of bachelor's degree are most likely to be married with 100.0% of them married at childbirth, while women with the educational attainment of high school diploma are least likely to be married with 60.8% of them unmarried at childbirth.
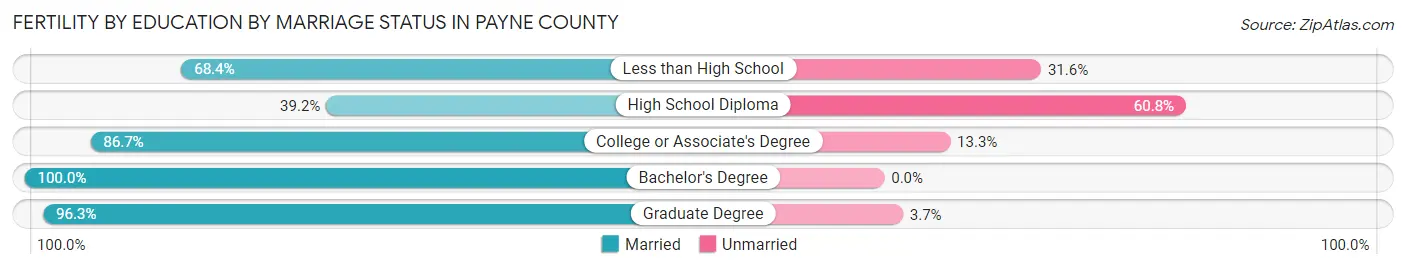
| Educational Attainment | Married | Unmarried |
| Less than High School | 13 (68.4%) | 6 (31.6%) |
| High School Diploma | 82 (39.2%) | 127 (60.8%) |
| College or Associate's Degree | 85 (86.7%) | 13 (13.3%) |
| Bachelor's Degree | 109 (100.0%) | 0 (0.0%) |
| Graduate Degree | 180 (96.3%) | 7 (3.7%) |
| Total | 469 (75.4%) | 153 (24.6%) |
Income in Payne County
Income Overview in Payne County
Per Capita Income in Payne County is $26,916, while median incomes of families and households are $71,757 and $46,658 respectively.
| Characteristic | Number | Measure |
| Per Capita Income | 82,058 | $26,916 |
| Median Family Income | 17,009 | $71,757 |
| Mean Family Income | 17,009 | $91,213 |
| Median Household Income | 31,843 | $46,658 |
| Mean Household Income | 31,843 | $66,604 |
| Income Deficit | 17,009 | $10,748 |
| Wage / Income Gap (%) | 82,058 | 34.36% |
| Wage / Income Gap ($) | 82,058 | 65.64¢ per $1 |
| Gini / Inequality Index | 82,058 | 0.49 |
Earnings by Sex in Payne County
Average Earnings in Payne County are $25,107, $30,310 for men and $19,896 for women, a difference of 34.4%.
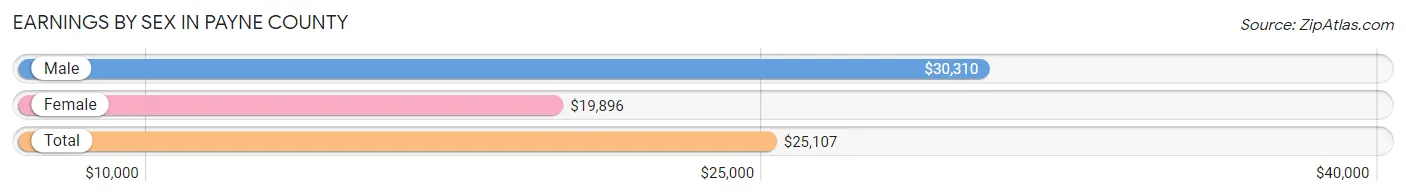
| Sex | Number | Average Earnings |
| Male | 24,279 (54.3%) | $30,310 |
| Female | 20,447 (45.7%) | $19,896 |
| Total | 44,726 (100.0%) | $25,107 |
Earnings by Sex by Income Bracket in Payne County
The most common earnings brackets in Payne County are $100,000+ for men (2,393 | 9.9%) and $2,499 or less for women (2,457 | 12.0%).
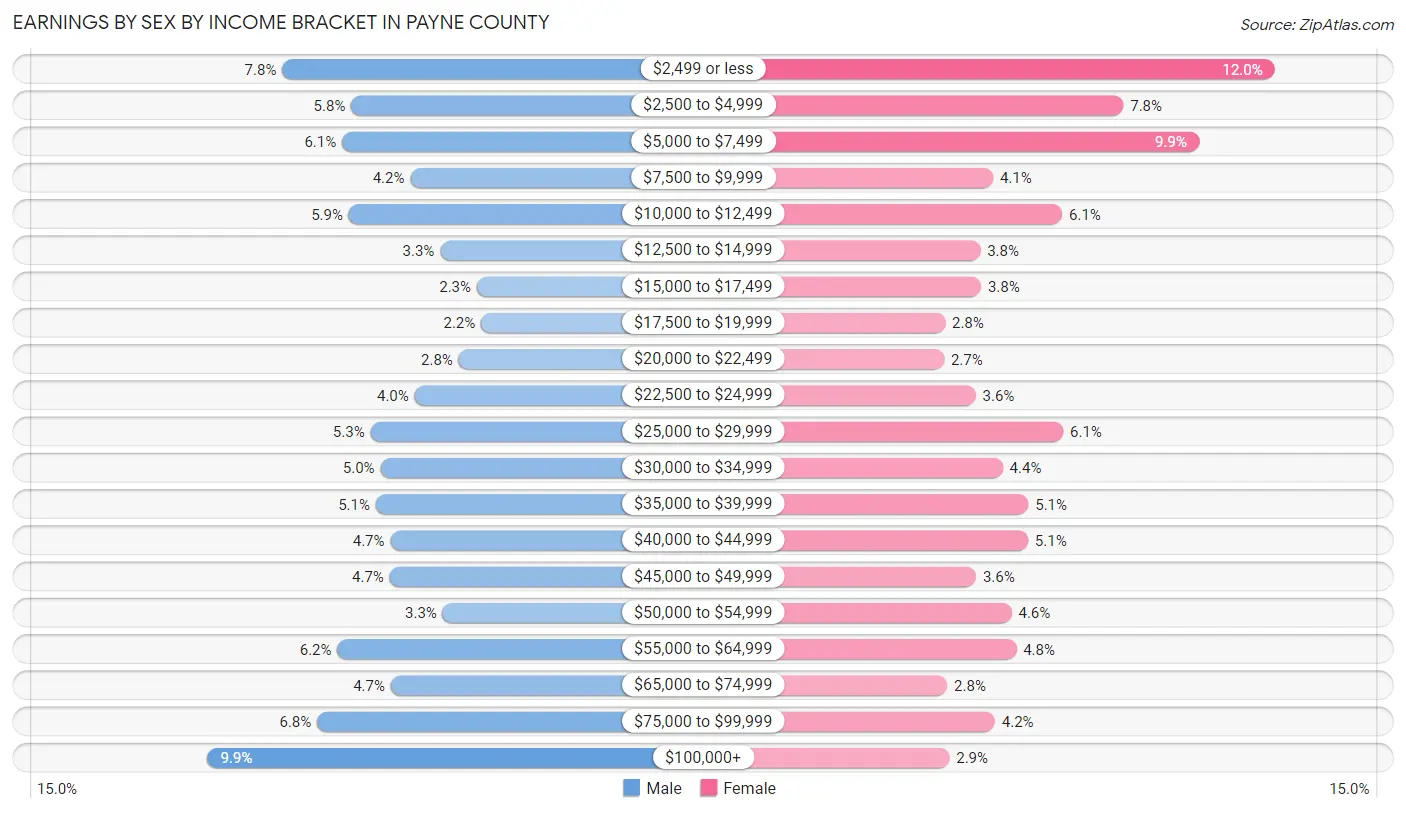
| Income | Male | Female |
| $2,499 or less | 1,884 (7.8%) | 2,457 (12.0%) |
| $2,500 to $4,999 | 1,412 (5.8%) | 1,588 (7.8%) |
| $5,000 to $7,499 | 1,476 (6.1%) | 2,022 (9.9%) |
| $7,500 to $9,999 | 1,011 (4.2%) | 841 (4.1%) |
| $10,000 to $12,499 | 1,429 (5.9%) | 1,237 (6.0%) |
| $12,500 to $14,999 | 806 (3.3%) | 767 (3.7%) |
| $15,000 to $17,499 | 555 (2.3%) | 770 (3.8%) |
| $17,500 to $19,999 | 527 (2.2%) | 565 (2.8%) |
| $20,000 to $22,499 | 681 (2.8%) | 559 (2.7%) |
| $22,500 to $24,999 | 982 (4.0%) | 740 (3.6%) |
| $25,000 to $29,999 | 1,282 (5.3%) | 1,244 (6.1%) |
| $30,000 to $34,999 | 1,214 (5.0%) | 896 (4.4%) |
| $35,000 to $39,999 | 1,246 (5.1%) | 1,042 (5.1%) |
| $40,000 to $44,999 | 1,145 (4.7%) | 1,041 (5.1%) |
| $45,000 to $49,999 | 1,150 (4.7%) | 743 (3.6%) |
| $50,000 to $54,999 | 790 (3.3%) | 947 (4.6%) |
| $55,000 to $64,999 | 1,507 (6.2%) | 973 (4.8%) |
| $65,000 to $74,999 | 1,143 (4.7%) | 577 (2.8%) |
| $75,000 to $99,999 | 1,646 (6.8%) | 850 (4.2%) |
| $100,000+ | 2,393 (9.9%) | 588 (2.9%) |
| Total | 24,279 (100.0%) | 20,447 (100.0%) |
Earnings by Sex by Educational Attainment in Payne County
Average earnings in Payne County are $46,186 for men and $35,161 for women, a difference of 23.9%. Men with an educational attainment of bachelor's degree enjoy the highest average annual earnings of $58,924, while those with less than high school education earn the least with $34,490. Women with an educational attainment of graduate degree earn the most with the average annual earnings of $58,661, while those with less than high school education have the smallest earnings of $9,407.
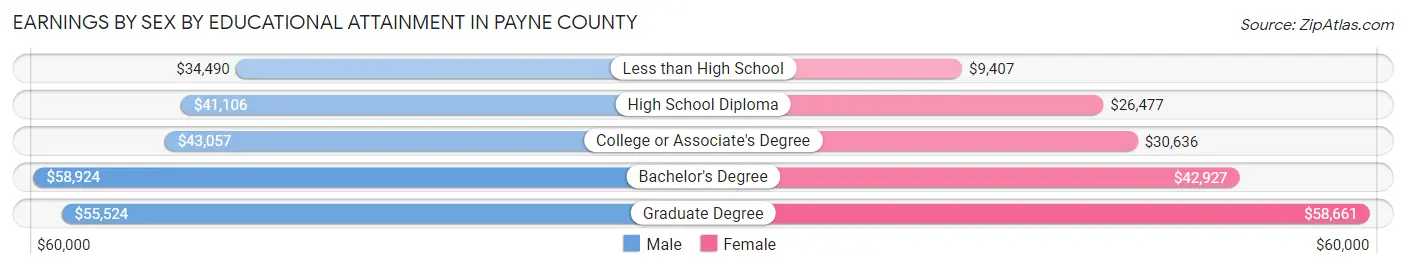
| Educational Attainment | Male Income | Female Income |
| Less than High School | $34,490 | $9,407 |
| High School Diploma | $41,106 | $26,477 |
| College or Associate's Degree | $43,057 | $30,636 |
| Bachelor's Degree | $58,924 | $42,927 |
| Graduate Degree | $55,524 | $58,661 |
| Total | $46,186 | $35,161 |
Family Income in Payne County
Family Income Brackets in Payne County
According to the Payne County family income data, there are 3,317 families falling into the $100,000 to $149,999 income range, which is the most common income bracket and makes up 19.5% of all families. Conversely, the $10,000 to $14,999 income bracket is the least frequent group with only 357 families (2.1%) belonging to this category.
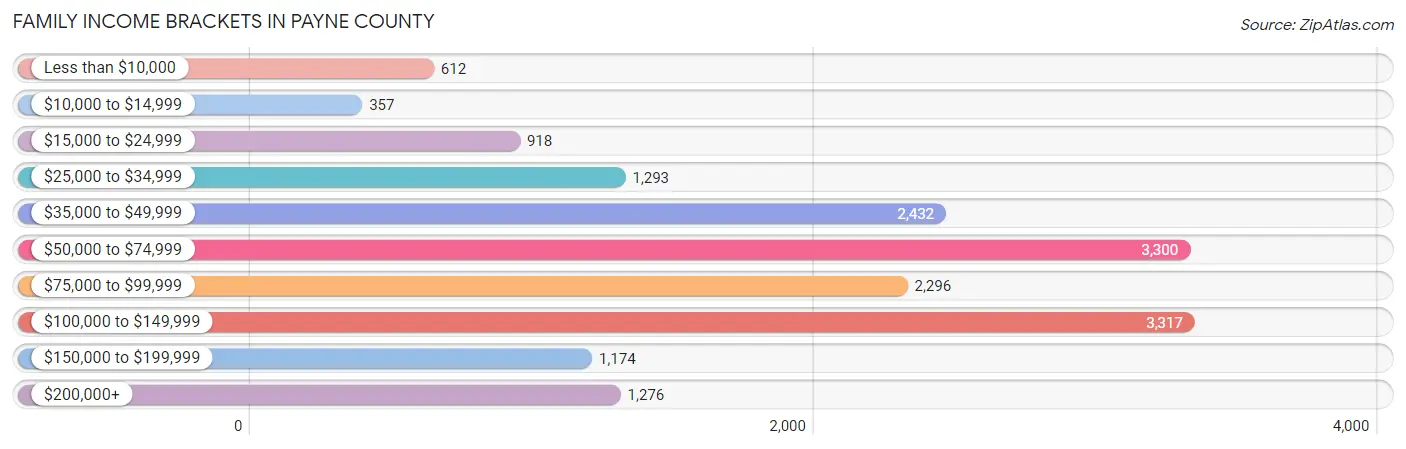
| Income Bracket | # Families | % Families |
| Less than $10,000 | 612 | 3.6% |
| $10,000 to $14,999 | 357 | 2.1% |
| $15,000 to $24,999 | 918 | 5.4% |
| $25,000 to $34,999 | 1,293 | 7.6% |
| $35,000 to $49,999 | 2,432 | 14.3% |
| $50,000 to $74,999 | 3,300 | 19.4% |
| $75,000 to $99,999 | 2,296 | 13.5% |
| $100,000 to $149,999 | 3,317 | 19.5% |
| $150,000 to $199,999 | 1,174 | 6.9% |
| $200,000+ | 1,276 | 7.5% |
Family Income by Famaliy Size in Payne County
4-person families (2,800 | 16.5%) account for the highest median family income in Payne County with $97,421 per family, while 2-person families (8,910 | 52.4%) have the highest median income of $33,335 per family member.
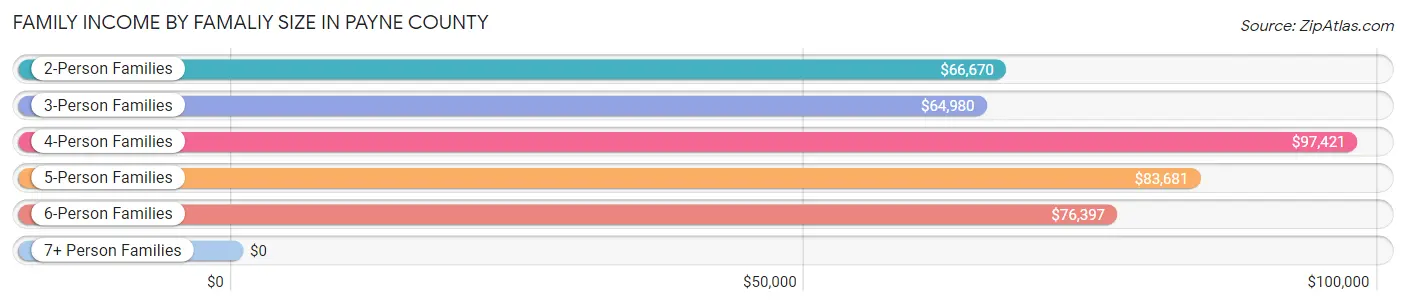
| Income Bracket | # Families | Median Income |
| 2-Person Families | 8,910 (52.4%) | $66,670 |
| 3-Person Families | 3,613 (21.2%) | $64,980 |
| 4-Person Families | 2,800 (16.5%) | $97,421 |
| 5-Person Families | 1,097 (6.5%) | $83,681 |
| 6-Person Families | 294 (1.7%) | $76,397 |
| 7+ Person Families | 295 (1.7%) | $0 |
| Total | 17,009 (100.0%) | $71,757 |
Family Income by Number of Earners in Payne County
The median family income in Payne County is $71,757, with families comprising 3+ earners (1,302) having the highest median family income of $118,154, while families with no earners (3,320) have the lowest median family income of $40,286, accounting for 7.6% and 19.5% of families, respectively.
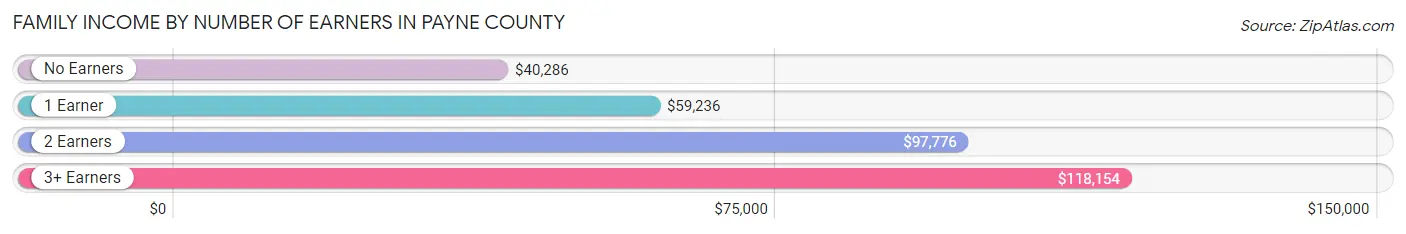
| Number of Earners | # Families | Median Income |
| No Earners | 3,320 (19.5%) | $40,286 |
| 1 Earner | 5,501 (32.3%) | $59,236 |
| 2 Earners | 6,886 (40.5%) | $97,776 |
| 3+ Earners | 1,302 (7.6%) | $118,154 |
| Total | 17,009 (100.0%) | $71,757 |
Household Income in Payne County
Household Income Brackets in Payne County
With 5,477 households falling in the category, the $50,000 to $74,999 income range is the most frequent in Payne County, accounting for 17.2% of all households. In contrast, only 1,306 households (4.1%) fall into the $150,000 to $199,999 income bracket, making it the least populous group.
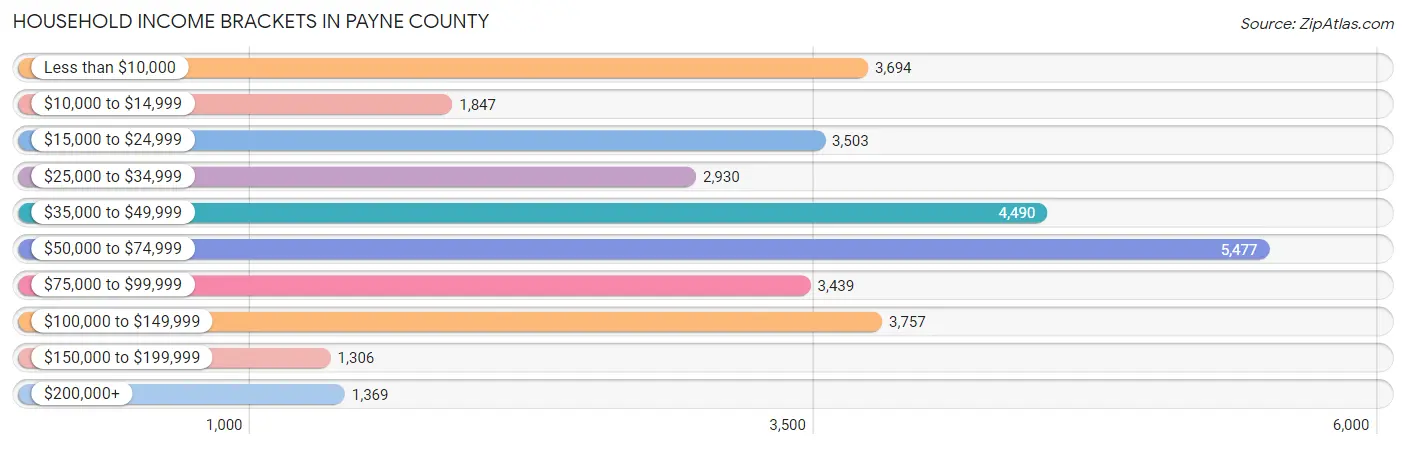
| Income Bracket | # Households | % Households |
| Less than $10,000 | 3,694 | 11.6% |
| $10,000 to $14,999 | 1,847 | 5.8% |
| $15,000 to $24,999 | 3,503 | 11.0% |
| $25,000 to $34,999 | 2,930 | 9.2% |
| $35,000 to $49,999 | 4,490 | 14.1% |
| $50,000 to $74,999 | 5,477 | 17.2% |
| $75,000 to $99,999 | 3,439 | 10.8% |
| $100,000 to $149,999 | 3,757 | 11.8% |
| $150,000 to $199,999 | 1,306 | 4.1% |
| $200,000+ | 1,369 | 4.3% |
Household Income by Householder Age in Payne County
The median household income in Payne County is $46,658, with the highest median household income of $60,227 found in the 45 to 64 years age bracket for the primary householder. A total of 8,154 households (25.6%) fall into this category. Meanwhile, the 15 to 24 years age bracket for the primary householder has the lowest median household income of $17,207, with 6,695 households (21.0%) in this group.
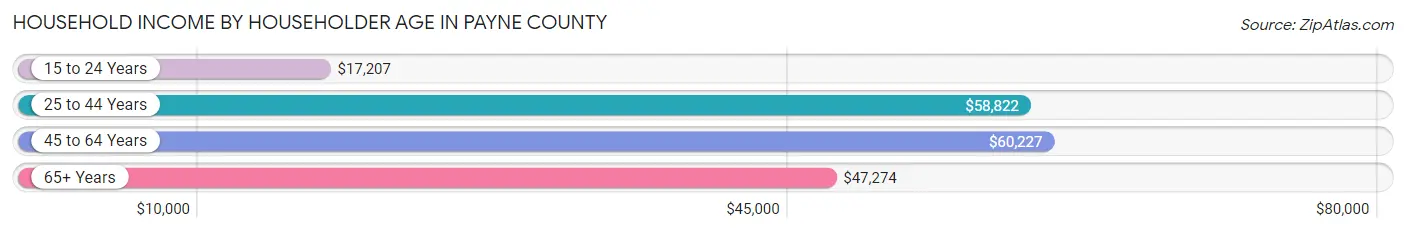
| Income Bracket | # Households | Median Income |
| 15 to 24 Years | 6,695 (21.0%) | $17,207 |
| 25 to 44 Years | 9,934 (31.2%) | $58,822 |
| 45 to 64 Years | 8,154 (25.6%) | $60,227 |
| 65+ Years | 7,060 (22.2%) | $47,274 |
| Total | 31,843 (100.0%) | $46,658 |
Poverty in Payne County
Income Below Poverty by Sex and Age in Payne County
With 24.1% poverty level for males and 24.5% for females among the residents of Payne County, 18 to 24 year old males and 18 to 24 year old females are the most vulnerable to poverty, with 4,543 males (52.2%) and 4,147 females (64.9%) in their respective age groups living below the poverty level.
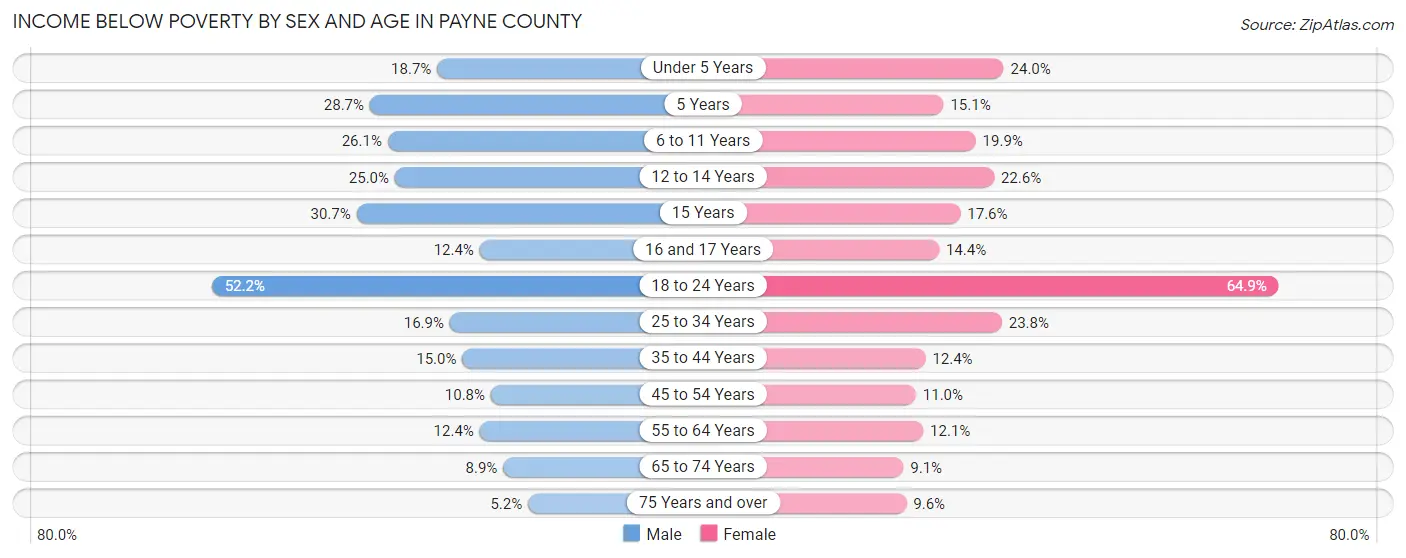
| Age Bracket | Male | Female |
| Under 5 Years | 358 (18.7%) | 448 (24.0%) |
| 5 Years | 152 (28.7%) | 85 (15.1%) |
| 6 to 11 Years | 681 (26.1%) | 509 (19.9%) |
| 12 to 14 Years | 293 (25.0%) | 224 (22.6%) |
| 15 Years | 195 (30.7%) | 84 (17.6%) |
| 16 and 17 Years | 96 (12.4%) | 101 (14.4%) |
| 18 to 24 Years | 4,543 (52.2%) | 4,147 (64.9%) |
| 25 to 34 Years | 960 (16.9%) | 1,108 (23.8%) |
| 35 to 44 Years | 595 (15.0%) | 504 (12.4%) |
| 45 to 54 Years | 354 (10.8%) | 365 (11.0%) |
| 55 to 64 Years | 436 (12.4%) | 440 (12.1%) |
| 65 to 74 Years | 253 (8.9%) | 288 (9.1%) |
| 75 Years and over | 93 (5.2%) | 247 (9.6%) |
| Total | 9,009 (24.1%) | 8,550 (24.5%) |
Income Above Poverty by Sex and Age in Payne County
According to the poverty statistics in Payne County, males aged 75 years and over and females aged 65 to 74 years are the age groups that are most secure financially, with 94.8% of males and 90.9% of females in these age groups living above the poverty line.
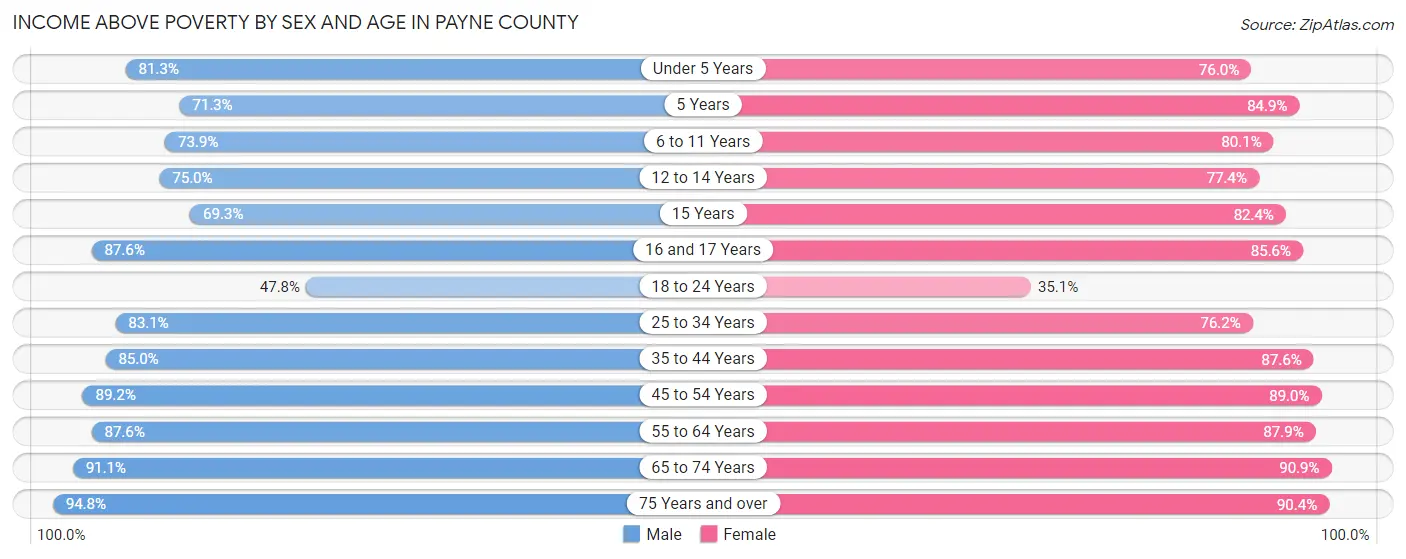
| Age Bracket | Male | Female |
| Under 5 Years | 1,552 (81.3%) | 1,416 (76.0%) |
| 5 Years | 377 (71.3%) | 478 (84.9%) |
| 6 to 11 Years | 1,930 (73.9%) | 2,051 (80.1%) |
| 12 to 14 Years | 878 (75.0%) | 767 (77.4%) |
| 15 Years | 440 (69.3%) | 393 (82.4%) |
| 16 and 17 Years | 677 (87.6%) | 599 (85.6%) |
| 18 to 24 Years | 4,159 (47.8%) | 2,246 (35.1%) |
| 25 to 34 Years | 4,735 (83.1%) | 3,555 (76.2%) |
| 35 to 44 Years | 3,368 (85.0%) | 3,554 (87.6%) |
| 45 to 54 Years | 2,937 (89.2%) | 2,954 (89.0%) |
| 55 to 64 Years | 3,073 (87.6%) | 3,202 (87.9%) |
| 65 to 74 Years | 2,579 (91.1%) | 2,862 (90.9%) |
| 75 Years and over | 1,681 (94.8%) | 2,332 (90.4%) |
| Total | 28,386 (75.9%) | 26,409 (75.5%) |
Income Below Poverty Among Married-Couple Families in Payne County
The poverty statistics for married-couple families in Payne County show that 6.7% or 859 of the total 12,780 families live below the poverty line. Families with 5 or more children have the highest poverty rate of 65.8%, comprising of 104 families. On the other hand, families with no children have the lowest poverty rate of 4.8%, which includes 365 families.
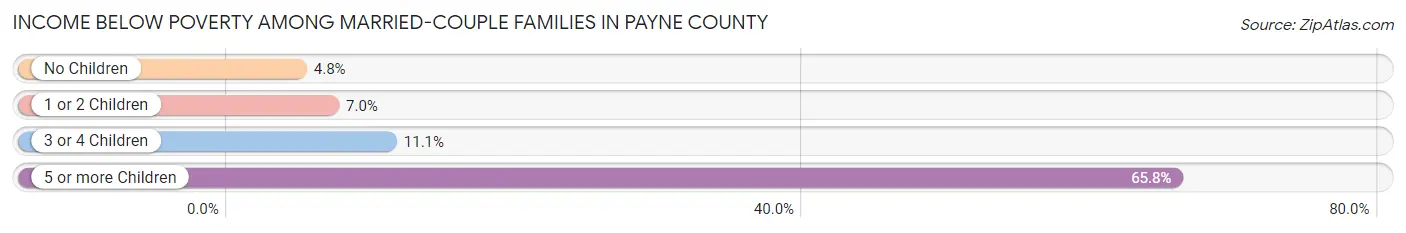
| Children | Above Poverty | Below Poverty |
| No Children | 7,260 (95.2%) | 365 (4.8%) |
| 1 or 2 Children | 3,763 (93.0%) | 285 (7.0%) |
| 3 or 4 Children | 844 (88.9%) | 105 (11.1%) |
| 5 or more Children | 54 (34.2%) | 104 (65.8%) |
| Total | 11,921 (93.3%) | 859 (6.7%) |
Income Below Poverty Among Single-Parent Households in Payne County
According to the poverty data in Payne County, 20.9% or 329 single-father households and 25.9% or 688 single-mother households are living below the poverty line. Among single-father households, those with 5 or more children have the highest poverty rate, with 49 households (100.0%) experiencing poverty. Likewise, among single-mother households, those with 3 or 4 children have the highest poverty rate, with 100 households (60.6%) falling below the poverty line.
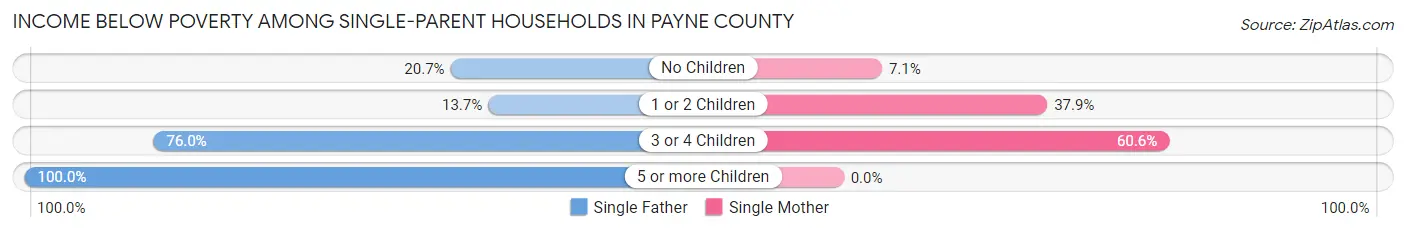
| Children | Single Father | Single Mother |
| No Children | 120 (20.7%) | 80 (7.1%) |
| 1 or 2 Children | 122 (13.7%) | 508 (37.9%) |
| 3 or 4 Children | 38 (76.0%) | 100 (60.6%) |
| 5 or more Children | 49 (100.0%) | 0 (0.0%) |
| Total | 329 (20.9%) | 688 (25.9%) |
Income Below Poverty Among Married-Couple vs Single-Parent Households in Payne County
The poverty data for Payne County shows that 859 of the married-couple family households (6.7%) and 1,017 of the single-parent households (24.0%) are living below the poverty level. Within the married-couple family households, those with 5 or more children have the highest poverty rate, with 104 households (65.8%) falling below the poverty line. Among the single-parent households, those with 3 or 4 children have the highest poverty rate, with 138 household (64.2%) living below poverty.
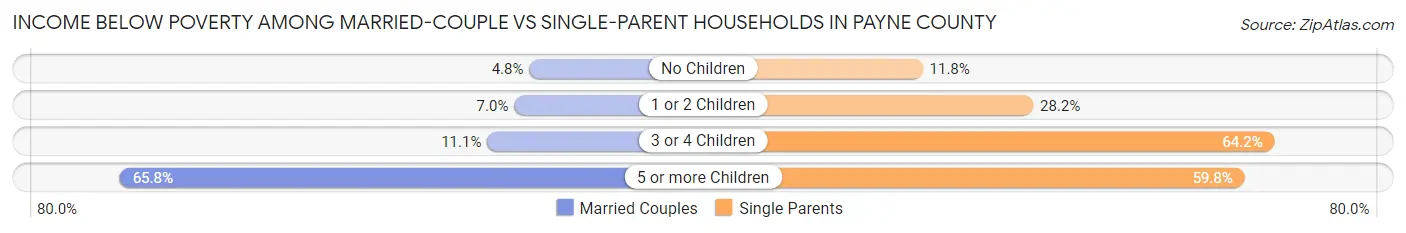
| Children | Married-Couple Families | Single-Parent Households |
| No Children | 365 (4.8%) | 200 (11.8%) |
| 1 or 2 Children | 285 (7.0%) | 630 (28.2%) |
| 3 or 4 Children | 105 (11.1%) | 138 (64.2%) |
| 5 or more Children | 104 (65.8%) | 49 (59.8%) |
| Total | 859 (6.7%) | 1,017 (24.0%) |
Employment Characteristics in Payne County
Employment by Class of Employer in Payne County
Among the 36,655 employed individuals in Payne County, private company employees (21,261 | 58.0%), state government employees (7,009 | 19.1%), and not-for-profit organizations (2,671 | 7.3%) make up the most common classes of employment.
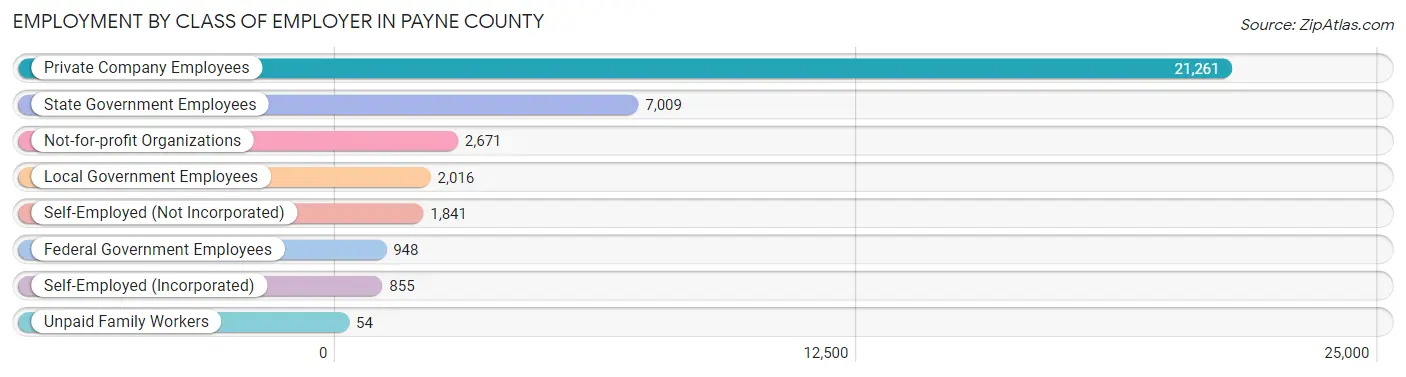
| Employer Class | # Employees | % Employees |
| Private Company Employees | 21,261 | 58.0% |
| Self-Employed (Incorporated) | 855 | 2.3% |
| Self-Employed (Not Incorporated) | 1,841 | 5.0% |
| Not-for-profit Organizations | 2,671 | 7.3% |
| Local Government Employees | 2,016 | 5.5% |
| State Government Employees | 7,009 | 19.1% |
| Federal Government Employees | 948 | 2.6% |
| Unpaid Family Workers | 54 | 0.2% |
| Total | 36,655 | 100.0% |
Employment Status by Age in Payne County
According to the labor force statistics for Payne County, out of the total population over 16 years of age (68,463), 57.1% or 39,092 individuals are in the labor force, with 4.8% or 1,876 of them unemployed. The age group with the highest labor force participation rate is 35 to 44 years, with 80.2% or 6,774 individuals in the labor force. Within the labor force, the 16 to 19 years age range has the highest percentage of unemployed individuals, with 17.6% or 401 of them being unemployed.
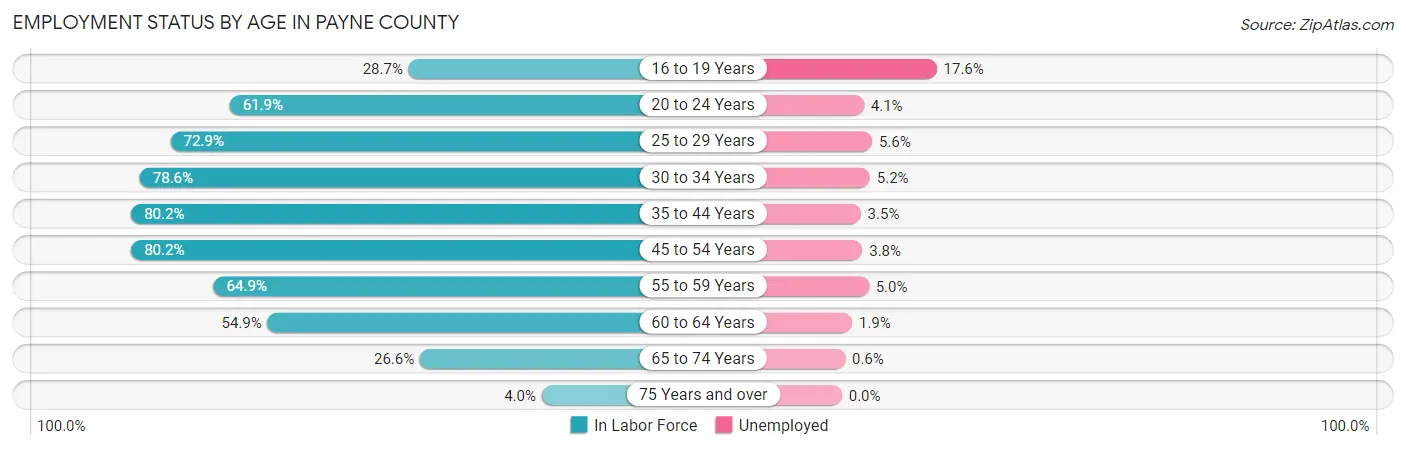
| Age Bracket | In Labor Force | Unemployed |
| 16 to 19 Years | 2,280 (28.7%) | 401 (17.6%) |
| 20 to 24 Years | 10,102 (61.9%) | 414 (4.1%) |
| 25 to 29 Years | 4,504 (72.9%) | 252 (5.6%) |
| 30 to 34 Years | 3,895 (78.6%) | 203 (5.2%) |
| 35 to 44 Years | 6,774 (80.2%) | 237 (3.5%) |
| 45 to 54 Years | 5,412 (80.2%) | 206 (3.8%) |
| 55 to 59 Years | 2,284 (64.9%) | 114 (5.0%) |
| 60 to 64 Years | 2,071 (54.9%) | 39 (1.9%) |
| 65 to 74 Years | 1,606 (26.6%) | 10 (0.6%) |
| 75 Years and over | 182 (4.0%) | 0 (0.0%) |
| Total | 39,092 (57.1%) | 1,876 (4.8%) |
Employment Status by Educational Attainment in Payne County
According to labor force statistics for Payne County, 74.2% of individuals (24,946) out of the total population between 25 and 64 years of age (33,620) are in the labor force, with 4.2% or 1,048 of them being unemployed. The group with the highest labor force participation rate are those with the educational attainment of bachelor's degree or higher, with 83.0% or 11,018 individuals in the labor force. Within the labor force, individuals with college / associate degree education have the highest percentage of unemployment, with 5.6% or 354 of them being unemployed.
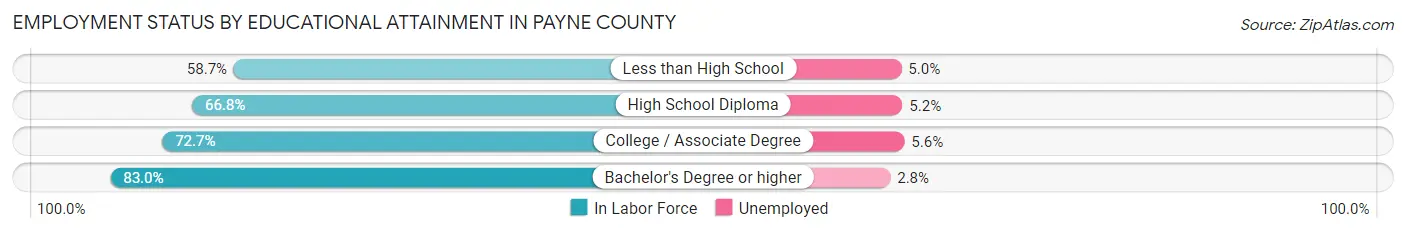
| Educational Attainment | In Labor Force | Unemployed |
| Less than High School | 1,421 (58.7%) | 121 (5.0%) |
| High School Diploma | 6,166 (66.8%) | 480 (5.2%) |
| College / Associate Degree | 6,320 (72.7%) | 487 (5.6%) |
| Bachelor's Degree or higher | 11,018 (83.0%) | 372 (2.8%) |
| Total | 24,946 (74.2%) | 1,412 (4.2%) |
Employment Occupations by Sex in Payne County
Management, Business, Science and Arts Occupations
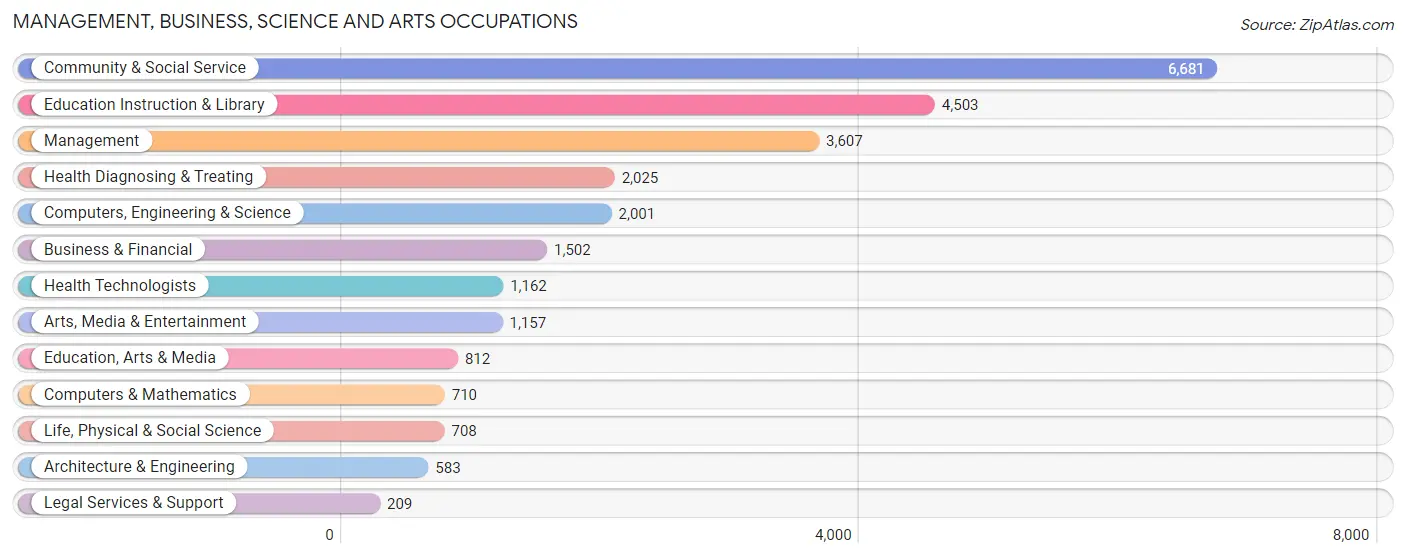
The most common Management, Business, Science and Arts occupations in Payne County are Community & Social Service (6,681 | 18.0%), Education Instruction & Library (4,503 | 12.2%), Management (3,607 | 9.7%), Health Diagnosing & Treating (2,025 | 5.5%), and Computers, Engineering & Science (2,001 | 5.4%).
Management, Business, Science and Arts Occupations by Sex
Within the Management, Business, Science and Arts occupations in Payne County, the most male-oriented occupations are Architecture & Engineering (88.8%), Computers, Engineering & Science (78.7%), and Computers & Mathematics (74.8%), while the most female-oriented occupations are Health Diagnosing & Treating (75.1%), Health Technologists (73.8%), and Business & Financial (59.4%).
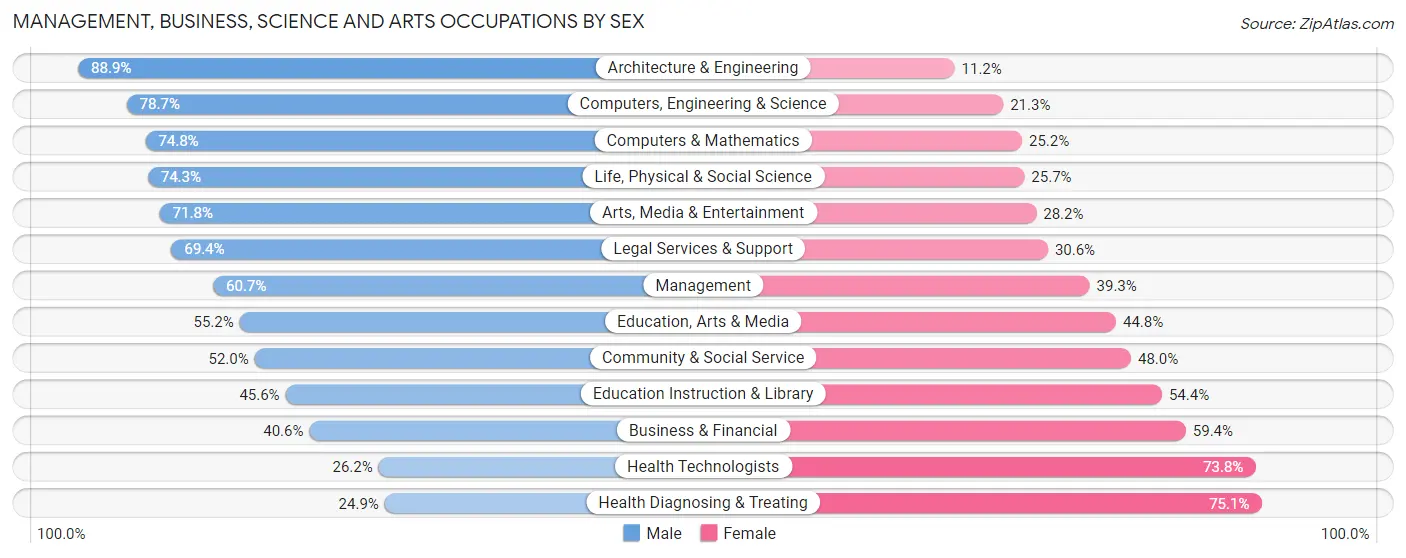
| Occupation | Male | Female |
| Management | 2,189 (60.7%) | 1,418 (39.3%) |
| Business & Financial | 610 (40.6%) | 892 (59.4%) |
| Computers, Engineering & Science | 1,575 (78.7%) | 426 (21.3%) |
| Computers & Mathematics | 531 (74.8%) | 179 (25.2%) |
| Architecture & Engineering | 518 (88.8%) | 65 (11.2%) |
| Life, Physical & Social Science | 526 (74.3%) | 182 (25.7%) |
| Community & Social Service | 3,477 (52.0%) | 3,204 (48.0%) |
| Education, Arts & Media | 448 (55.2%) | 364 (44.8%) |
| Legal Services & Support | 145 (69.4%) | 64 (30.6%) |
| Education Instruction & Library | 2,053 (45.6%) | 2,450 (54.4%) |
| Arts, Media & Entertainment | 831 (71.8%) | 326 (28.2%) |
| Health Diagnosing & Treating | 504 (24.9%) | 1,521 (75.1%) |
| Health Technologists | 304 (26.2%) | 858 (73.8%) |
| Total (Category) | 8,355 (52.8%) | 7,461 (47.2%) |
| Total (Overall) | 20,282 (54.8%) | 16,756 (45.2%) |
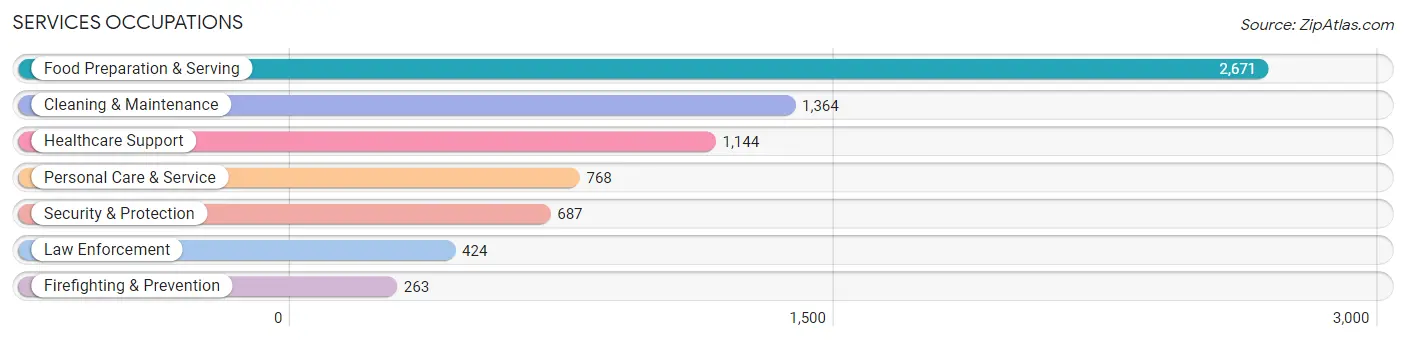
Services Occupations
The most common Services occupations in Payne County are Food Preparation & Serving (2,671 | 7.2%), Cleaning & Maintenance (1,364 | 3.7%), Healthcare Support (1,144 | 3.1%), Personal Care & Service (768 | 2.1%), and Security & Protection (687 | 1.8%).
Services Occupations by Sex
Within the Services occupations in Payne County, the most male-oriented occupations are Law Enforcement (72.4%), Cleaning & Maintenance (71.9%), and Security & Protection (67.7%), while the most female-oriented occupations are Healthcare Support (88.8%), Food Preparation & Serving (70.5%), and Personal Care & Service (65.9%).
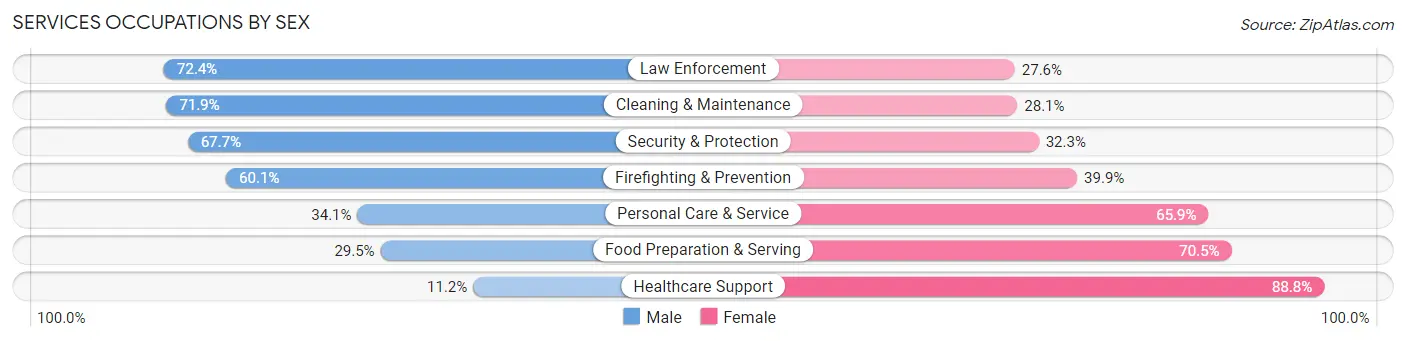
| Occupation | Male | Female |
| Healthcare Support | 128 (11.2%) | 1,016 (88.8%) |
| Security & Protection | 465 (67.7%) | 222 (32.3%) |
| Firefighting & Prevention | 158 (60.1%) | 105 (39.9%) |
| Law Enforcement | 307 (72.4%) | 117 (27.6%) |
| Food Preparation & Serving | 789 (29.5%) | 1,882 (70.5%) |
| Cleaning & Maintenance | 981 (71.9%) | 383 (28.1%) |
| Personal Care & Service | 262 (34.1%) | 506 (65.9%) |
| Total (Category) | 2,625 (39.6%) | 4,009 (60.4%) |
| Total (Overall) | 20,282 (54.8%) | 16,756 (45.2%) |
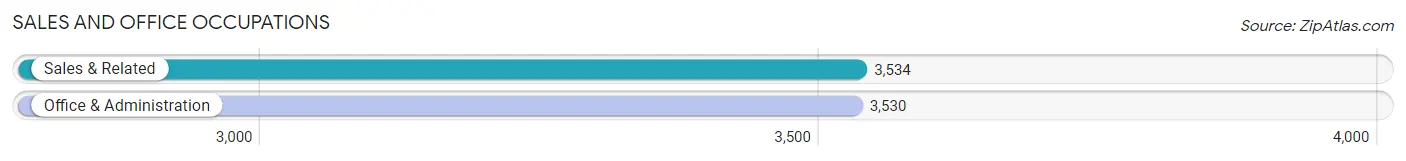
Sales and Office Occupations
The most common Sales and Office occupations in Payne County are Sales & Related (3,534 | 9.5%), and Office & Administration (3,530 | 9.5%).
Sales and Office Occupations by Sex
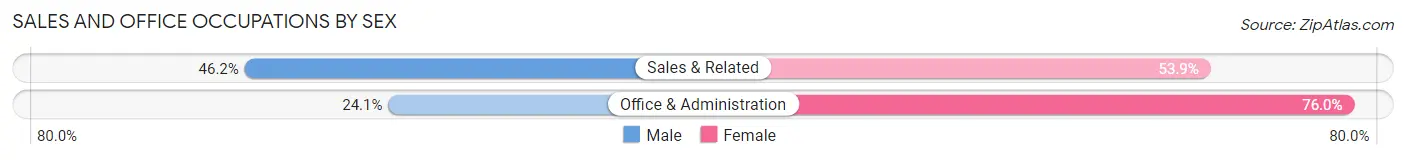
| Occupation | Male | Female |
| Sales & Related | 1,631 (46.2%) | 1,903 (53.8%) |
| Office & Administration | 849 (24.0%) | 2,681 (75.9%) |
| Total (Category) | 2,480 (35.1%) | 4,584 (64.9%) |
| Total (Overall) | 20,282 (54.8%) | 16,756 (45.2%) |
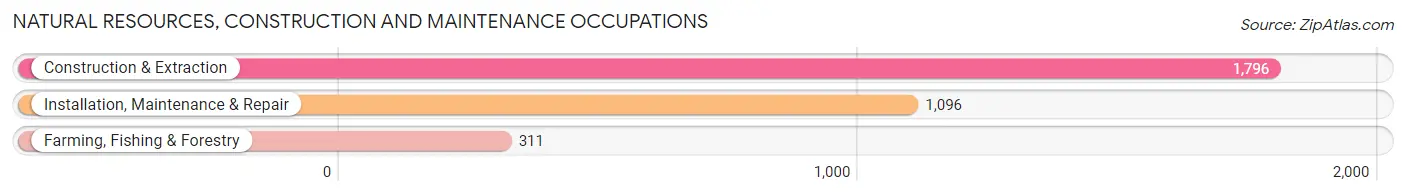
Natural Resources, Construction and Maintenance Occupations
The most common Natural Resources, Construction and Maintenance occupations in Payne County are Construction & Extraction (1,796 | 4.9%), Installation, Maintenance & Repair (1,096 | 3.0%), and Farming, Fishing & Forestry (311 | 0.8%).
Natural Resources, Construction and Maintenance Occupations by Sex
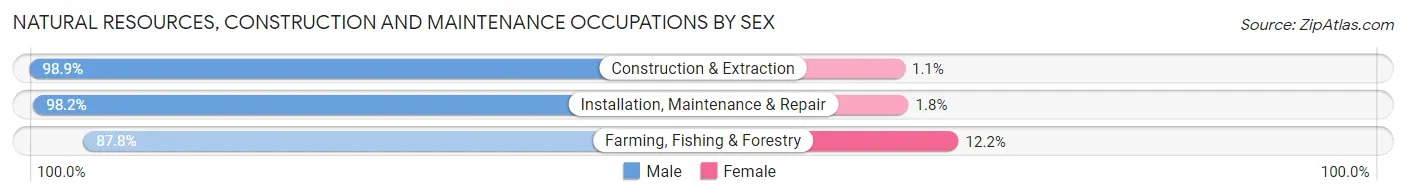
| Occupation | Male | Female |
| Farming, Fishing & Forestry | 273 (87.8%) | 38 (12.2%) |
| Construction & Extraction | 1,777 (98.9%) | 19 (1.1%) |
| Installation, Maintenance & Repair | 1,076 (98.2%) | 20 (1.8%) |
| Total (Category) | 3,126 (97.6%) | 77 (2.4%) |
| Total (Overall) | 20,282 (54.8%) | 16,756 (45.2%) |
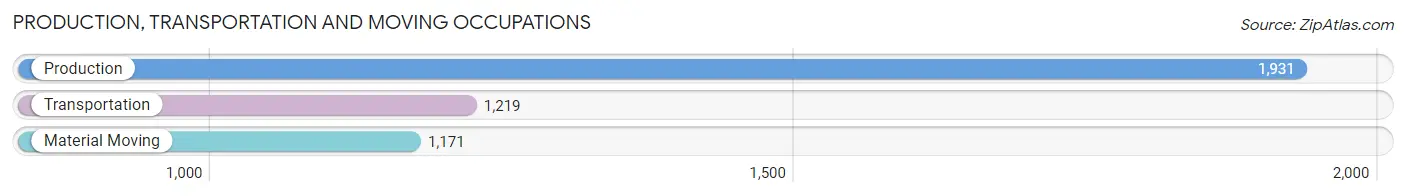
Production, Transportation and Moving Occupations
The most common Production, Transportation and Moving occupations in Payne County are Production (1,931 | 5.2%), Transportation (1,219 | 3.3%), and Material Moving (1,171 | 3.2%).
Production, Transportation and Moving Occupations by Sex
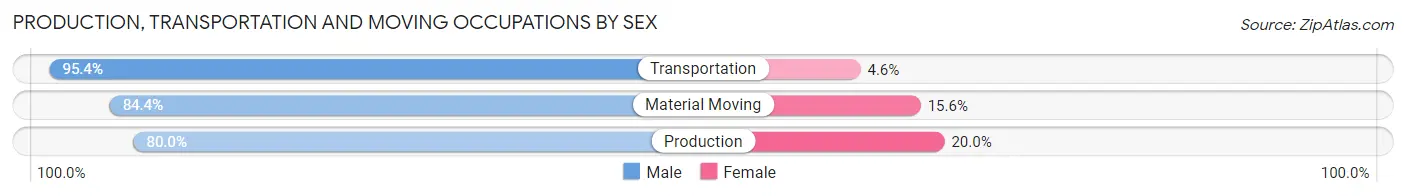
| Occupation | Male | Female |
| Production | 1,545 (80.0%) | 386 (20.0%) |
| Transportation | 1,163 (95.4%) | 56 (4.6%) |
| Material Moving | 988 (84.4%) | 183 (15.6%) |
| Total (Category) | 3,696 (85.5%) | 625 (14.5%) |
| Total (Overall) | 20,282 (54.8%) | 16,756 (45.2%) |
Employment Industries by Sex in Payne County
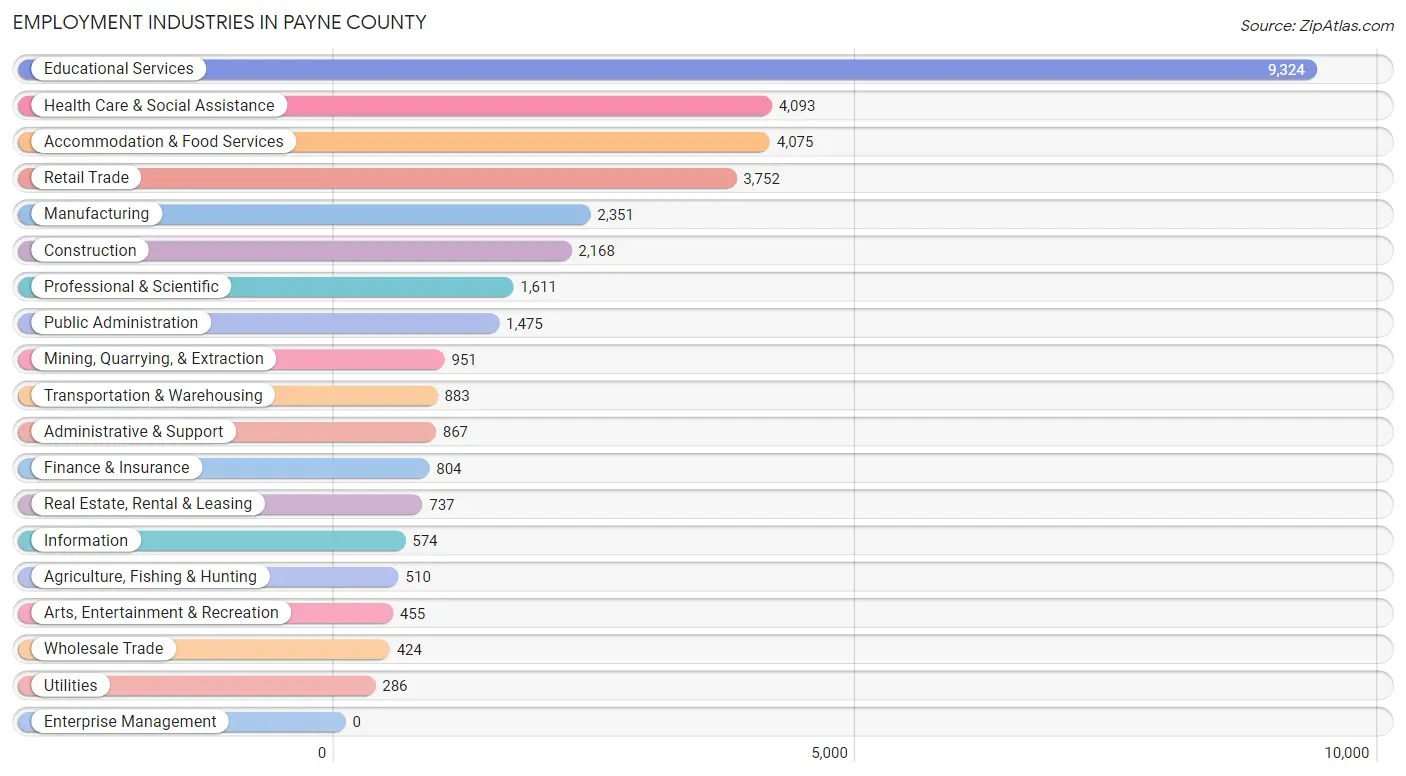
Employment Industries in Payne County
The major employment industries in Payne County include Educational Services (9,324 | 25.2%), Health Care & Social Assistance (4,093 | 11.1%), Accommodation & Food Services (4,075 | 11.0%), Retail Trade (3,752 | 10.1%), and Manufacturing (2,351 | 6.4%).
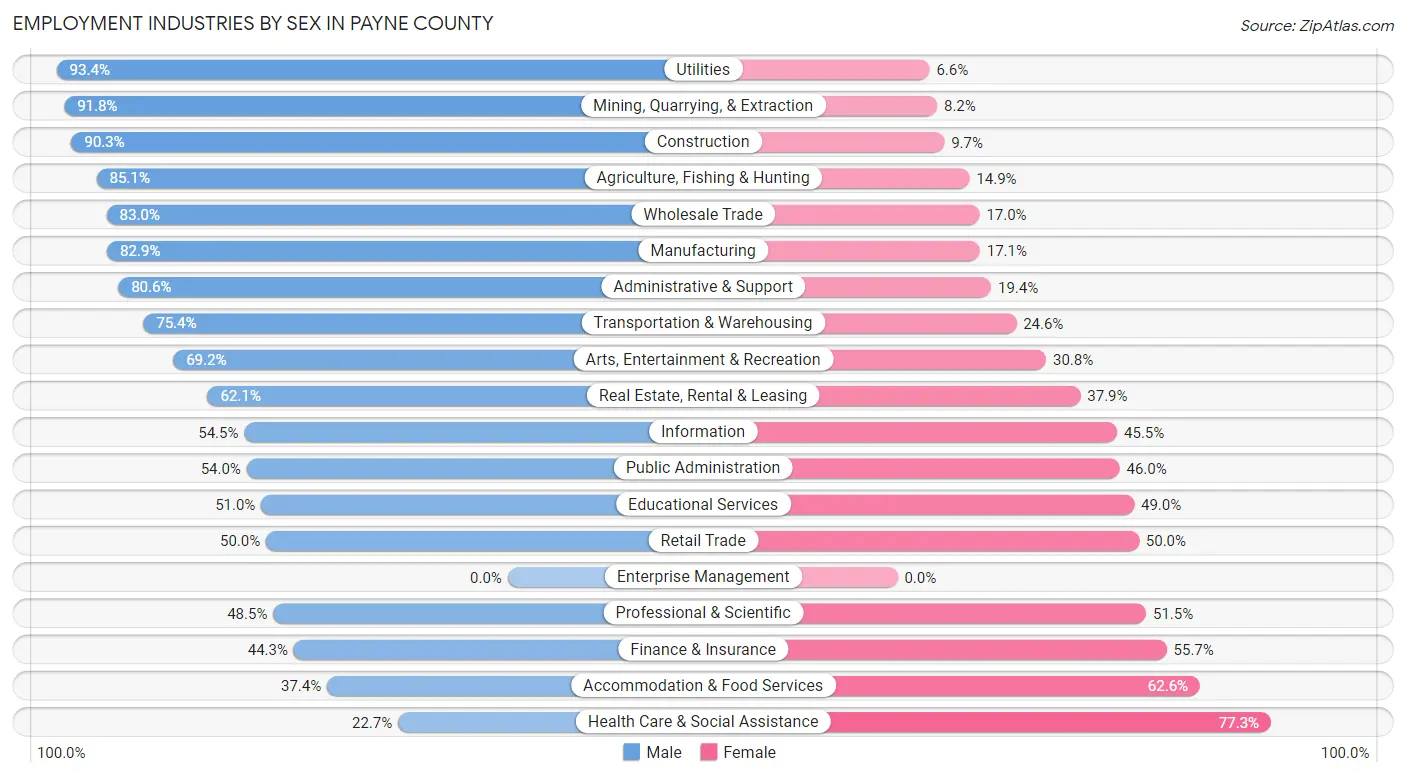
Employment Industries by Sex in Payne County
The Payne County industries that see more men than women are Utilities (93.4%), Mining, Quarrying, & Extraction (91.8%), and Construction (90.3%), whereas the industries that tend to have a higher number of women are Health Care & Social Assistance (77.3%), Accommodation & Food Services (62.6%), and Finance & Insurance (55.7%).
| Industry | Male | Female |
| Agriculture, Fishing & Hunting | 434 (85.1%) | 76 (14.9%) |
| Mining, Quarrying, & Extraction | 873 (91.8%) | 78 (8.2%) |
| Construction | 1,958 (90.3%) | 210 (9.7%) |
| Manufacturing | 1,950 (82.9%) | 401 (17.1%) |
| Wholesale Trade | 352 (83.0%) | 72 (17.0%) |
| Retail Trade | 1,877 (50.0%) | 1,875 (50.0%) |
| Transportation & Warehousing | 666 (75.4%) | 217 (24.6%) |
| Utilities | 267 (93.4%) | 19 (6.6%) |
| Information | 313 (54.5%) | 261 (45.5%) |
| Finance & Insurance | 356 (44.3%) | 448 (55.7%) |
| Real Estate, Rental & Leasing | 458 (62.1%) | 279 (37.9%) |
| Professional & Scientific | 782 (48.5%) | 829 (51.5%) |
| Enterprise Management | 0 (0.0%) | 0 (0.0%) |
| Administrative & Support | 699 (80.6%) | 168 (19.4%) |
| Educational Services | 4,758 (51.0%) | 4,566 (49.0%) |
| Health Care & Social Assistance | 929 (22.7%) | 3,164 (77.3%) |
| Arts, Entertainment & Recreation | 315 (69.2%) | 140 (30.8%) |
| Accommodation & Food Services | 1,524 (37.4%) | 2,551 (62.6%) |
| Public Administration | 797 (54.0%) | 678 (46.0%) |
| Total | 20,282 (54.8%) | 16,756 (45.2%) |
Education in Payne County
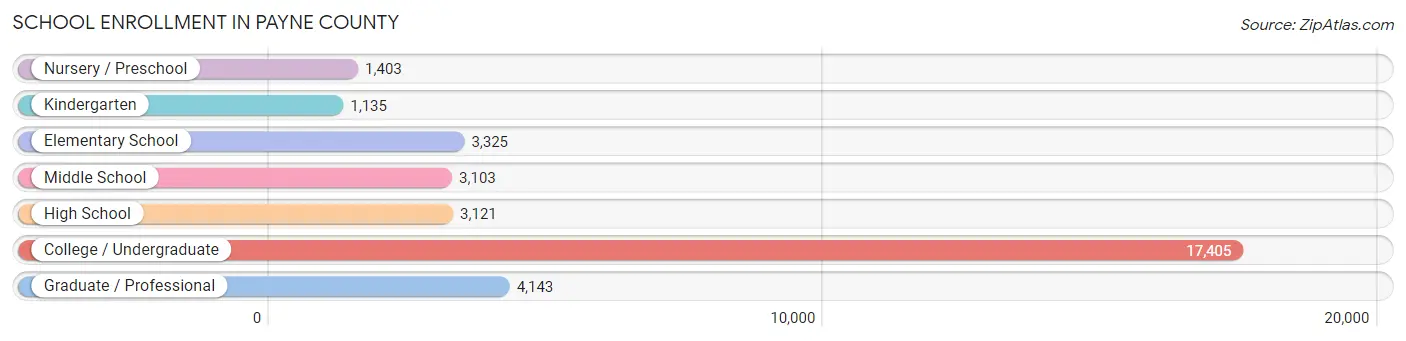
School Enrollment in Payne County
The most common levels of schooling among the 33,635 students in Payne County are college / undergraduate (17,405 | 51.7%), graduate / professional (4,143 | 12.3%), and elementary school (3,325 | 9.9%).
| School Level | # Students | % Students |
| Nursery / Preschool | 1,403 | 4.2% |
| Kindergarten | 1,135 | 3.4% |
| Elementary School | 3,325 | 9.9% |
| Middle School | 3,103 | 9.2% |
| High School | 3,121 | 9.3% |
| College / Undergraduate | 17,405 | 51.7% |
| Graduate / Professional | 4,143 | 12.3% |
| Total | 33,635 | 100.0% |
School Enrollment by Age by Funding Source in Payne County
Out of a total of 33,635 students who are enrolled in schools in Payne County, 2,422 (7.2%) attend a private institution, while the remaining 31,213 (92.8%) are enrolled in public schools. The age group of 3 to 4 year olds has the highest likelihood of being enrolled in private schools, with 394 (43.0% in the age bracket) enrolled. Conversely, the age group of 18 to 19 year olds has the lowest likelihood of being enrolled in a private school, with 6,015 (99.0% in the age bracket) attending a public institution.
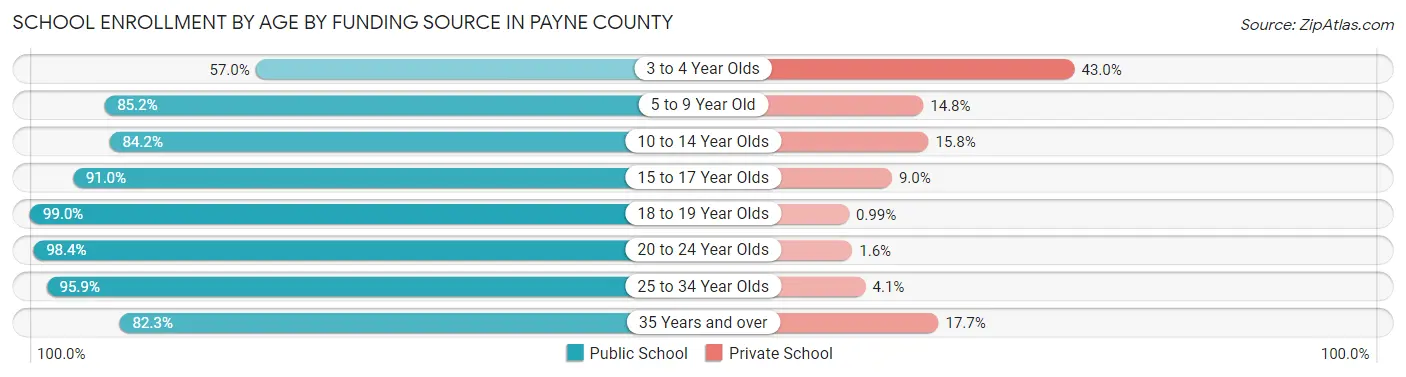
| Age Bracket | Public School | Private School |
| 3 to 4 Year Olds | 522 (57.0%) | 394 (43.0%) |
| 5 to 9 Year Old | 3,822 (85.2%) | 666 (14.8%) |
| 10 to 14 Year Olds | 3,065 (84.2%) | 576 (15.8%) |
| 15 to 17 Year Olds | 2,258 (91.0%) | 223 (9.0%) |
| 18 to 19 Year Olds | 6,015 (99.0%) | 60 (1.0%) |
| 20 to 24 Year Olds | 11,900 (98.4%) | 195 (1.6%) |
| 25 to 34 Year Olds | 2,796 (95.9%) | 119 (4.1%) |
| 35 Years and over | 843 (82.3%) | 181 (17.7%) |
| Total | 31,213 (92.8%) | 2,422 (7.2%) |
Educational Attainment by Field of Study in Payne County
Business (3,003 | 16.3%), education (2,628 | 14.3%), bio, nature & agricultural (2,594 | 14.1%), science & technology (1,715 | 9.3%), and engineering (1,236 | 6.7%) are the most common fields of study among 18,378 individuals in Payne County who have obtained a bachelor's degree or higher.
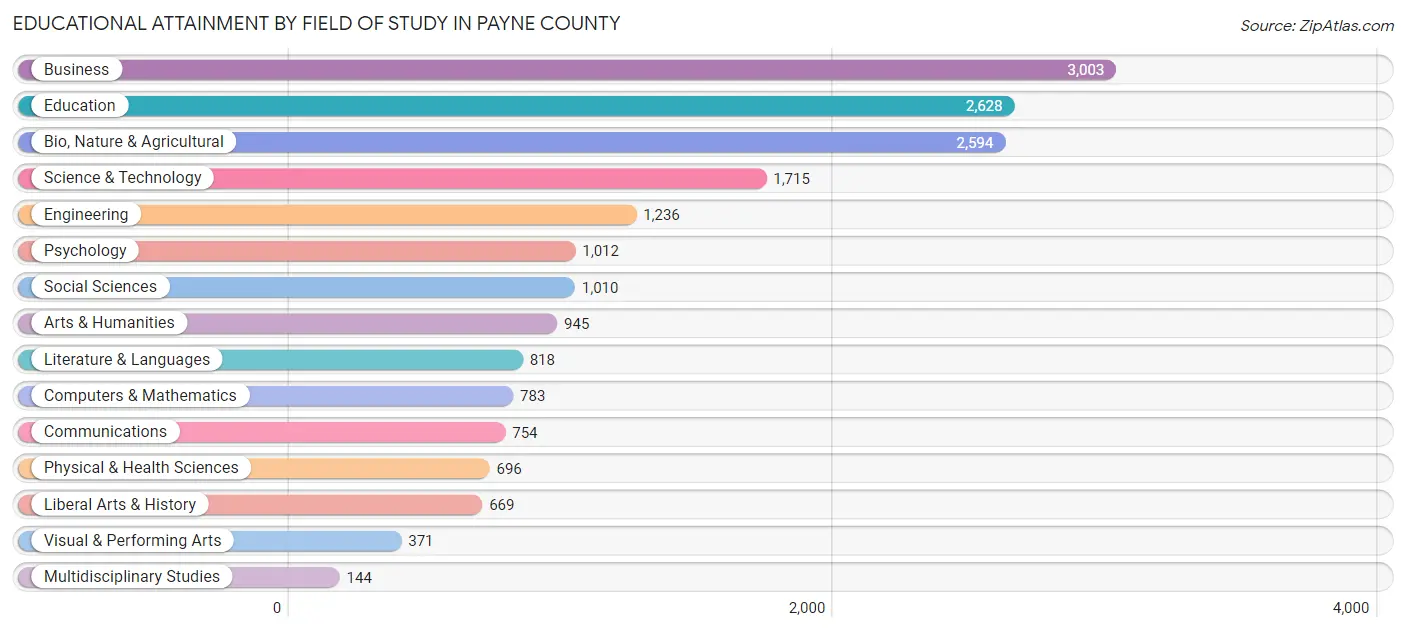
| Field of Study | # Graduates | % Graduates |
| Computers & Mathematics | 783 | 4.3% |
| Bio, Nature & Agricultural | 2,594 | 14.1% |
| Physical & Health Sciences | 696 | 3.8% |
| Psychology | 1,012 | 5.5% |
| Social Sciences | 1,010 | 5.5% |
| Engineering | 1,236 | 6.7% |
| Multidisciplinary Studies | 144 | 0.8% |
| Science & Technology | 1,715 | 9.3% |
| Business | 3,003 | 16.3% |
| Education | 2,628 | 14.3% |
| Literature & Languages | 818 | 4.4% |
| Liberal Arts & History | 669 | 3.6% |
| Visual & Performing Arts | 371 | 2.0% |
| Communications | 754 | 4.1% |
| Arts & Humanities | 945 | 5.1% |
| Total | 18,378 | 100.0% |
Transportation & Commute in Payne County
Vehicle Availability by Sex in Payne County
The most prevalent vehicle ownership categories in Payne County are males with 2 vehicles (7,564, accounting for 38.6%) and females with 2 vehicles (6,098, making up 49.0%).
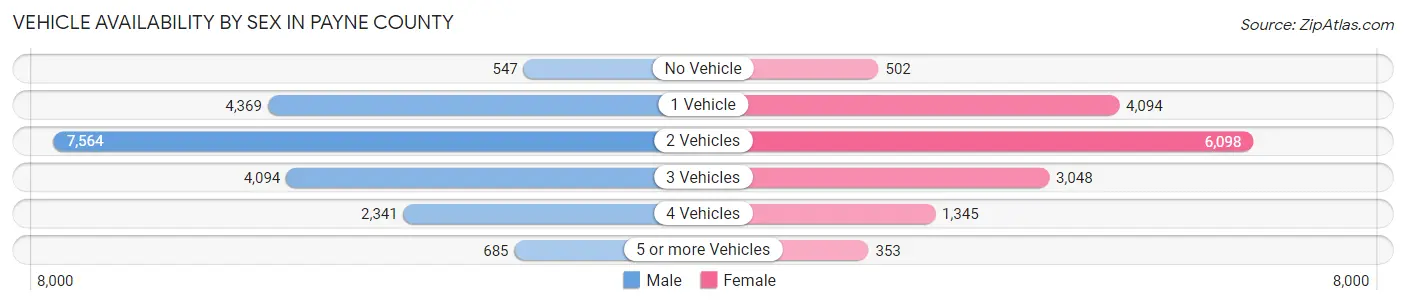
| Vehicles Available | Male | Female |
| No Vehicle | 547 (2.8%) | 502 (3.3%) |
| 1 Vehicle | 4,369 (22.3%) | 4,094 (26.5%) |
| 2 Vehicles | 7,564 (38.6%) | 6,098 (39.5%) |
| 3 Vehicles | 4,094 (20.9%) | 3,048 (19.7%) |
| 4 Vehicles | 2,341 (11.9%) | 1,345 (8.7%) |
| 5 or more Vehicles | 685 (3.5%) | 353 (2.3%) |
| Total | 19,600 (100.0%) | 15,440 (100.0%) |
Commute Time in Payne County
The most frequently occuring commute durations in Payne County are 10 to 14 minutes (7,870 commuters, 23.3%), 5 to 9 minutes (7,744 commuters, 22.9%), and 15 to 19 minutes (6,209 commuters, 18.3%).
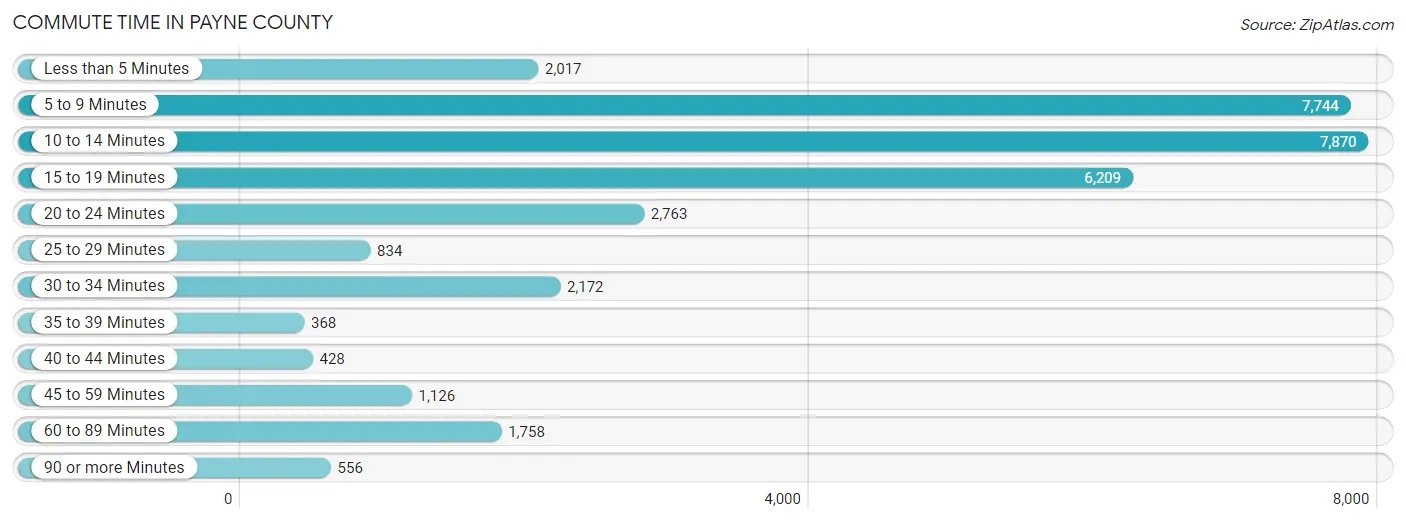
| Commute Time | # Commuters | % Commuters |
| Less than 5 Minutes | 2,017 | 6.0% |
| 5 to 9 Minutes | 7,744 | 22.9% |
| 10 to 14 Minutes | 7,870 | 23.3% |
| 15 to 19 Minutes | 6,209 | 18.3% |
| 20 to 24 Minutes | 2,763 | 8.2% |
| 25 to 29 Minutes | 834 | 2.5% |
| 30 to 34 Minutes | 2,172 | 6.4% |
| 35 to 39 Minutes | 368 | 1.1% |
| 40 to 44 Minutes | 428 | 1.3% |
| 45 to 59 Minutes | 1,126 | 3.3% |
| 60 to 89 Minutes | 1,758 | 5.2% |
| 90 or more Minutes | 556 | 1.6% |
Commute Time by Sex in Payne County
The most common commute times in Payne County are 10 to 14 minutes (4,125 commuters, 22.0%) for males and 5 to 9 minutes (3,857 commuters, 25.6%) for females.
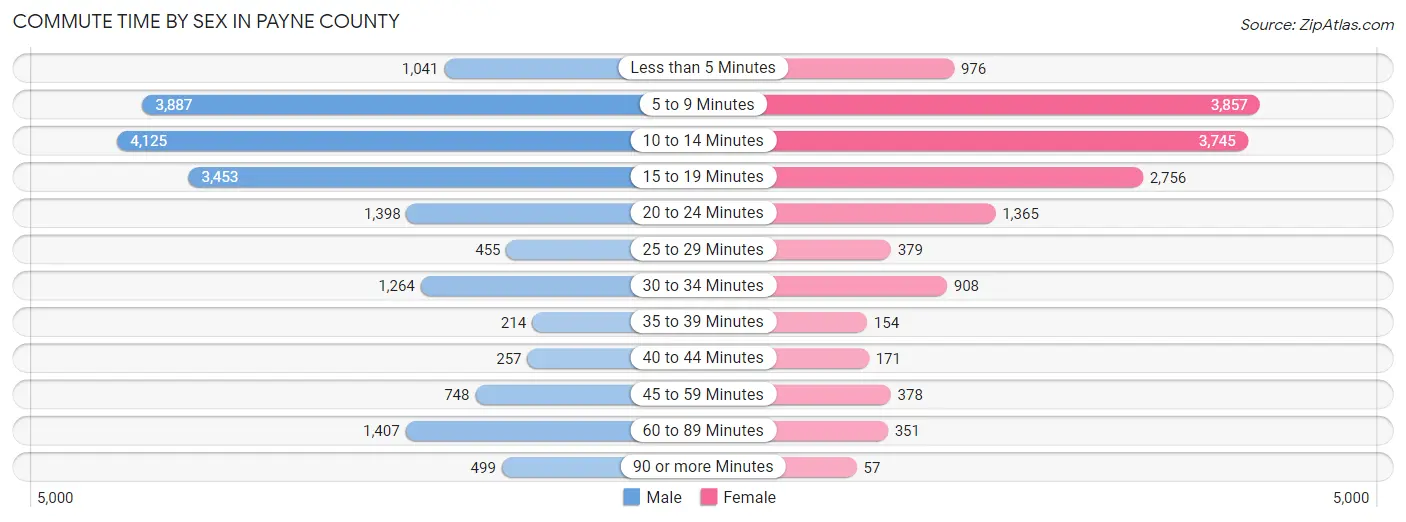
| Commute Time | Male | Female |
| Less than 5 Minutes | 1,041 (5.6%) | 976 (6.5%) |
| 5 to 9 Minutes | 3,887 (20.7%) | 3,857 (25.6%) |
| 10 to 14 Minutes | 4,125 (22.0%) | 3,745 (24.8%) |
| 15 to 19 Minutes | 3,453 (18.4%) | 2,756 (18.3%) |
| 20 to 24 Minutes | 1,398 (7.5%) | 1,365 (9.0%) |
| 25 to 29 Minutes | 455 (2.4%) | 379 (2.5%) |
| 30 to 34 Minutes | 1,264 (6.7%) | 908 (6.0%) |
| 35 to 39 Minutes | 214 (1.1%) | 154 (1.0%) |
| 40 to 44 Minutes | 257 (1.4%) | 171 (1.1%) |
| 45 to 59 Minutes | 748 (4.0%) | 378 (2.5%) |
| 60 to 89 Minutes | 1,407 (7.5%) | 351 (2.3%) |
| 90 or more Minutes | 499 (2.7%) | 57 (0.4%) |
Time of Departure to Work by Sex in Payne County
The most frequent times of departure to work in Payne County are 7:00 AM to 7:29 AM (2,806, 15.0%) for males and 7:30 AM to 7:59 AM (2,520, 16.7%) for females.
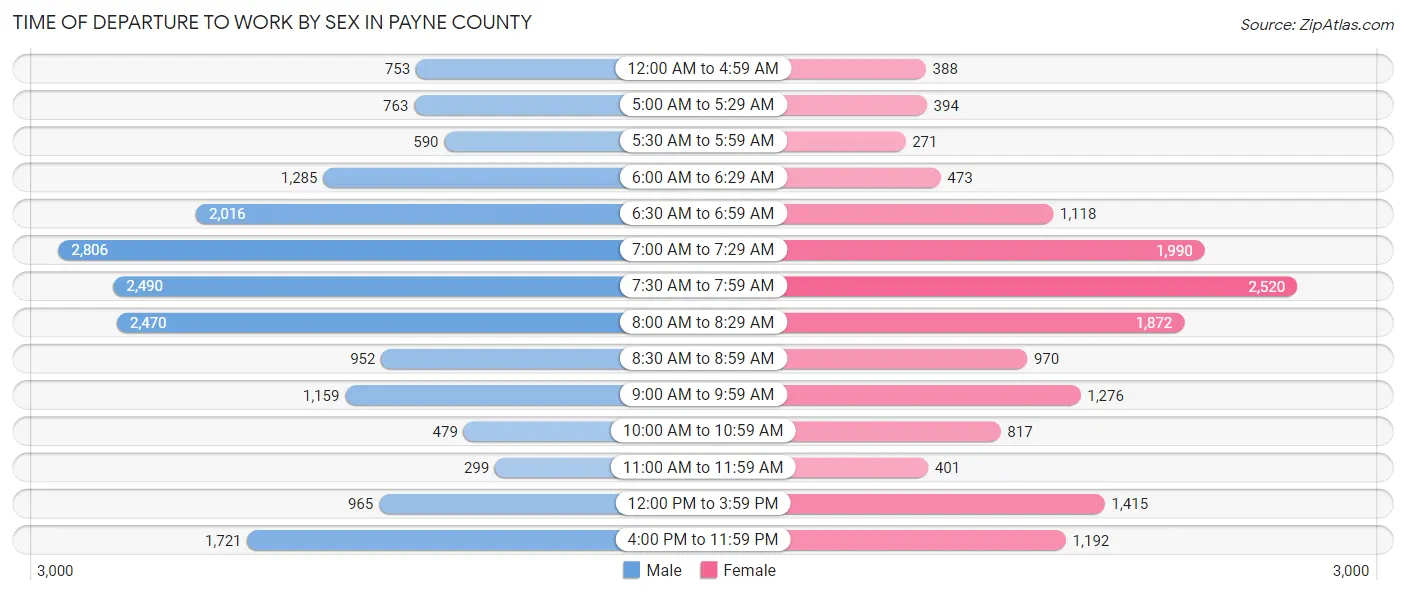
| Time of Departure | Male | Female |
| 12:00 AM to 4:59 AM | 753 (4.0%) | 388 (2.6%) |
| 5:00 AM to 5:29 AM | 763 (4.1%) | 394 (2.6%) |
| 5:30 AM to 5:59 AM | 590 (3.2%) | 271 (1.8%) |
| 6:00 AM to 6:29 AM | 1,285 (6.9%) | 473 (3.1%) |
| 6:30 AM to 6:59 AM | 2,016 (10.7%) | 1,118 (7.4%) |
| 7:00 AM to 7:29 AM | 2,806 (15.0%) | 1,990 (13.2%) |
| 7:30 AM to 7:59 AM | 2,490 (13.3%) | 2,520 (16.7%) |
| 8:00 AM to 8:29 AM | 2,470 (13.2%) | 1,872 (12.4%) |
| 8:30 AM to 8:59 AM | 952 (5.1%) | 970 (6.4%) |
| 9:00 AM to 9:59 AM | 1,159 (6.2%) | 1,276 (8.5%) |
| 10:00 AM to 10:59 AM | 479 (2.5%) | 817 (5.4%) |
| 11:00 AM to 11:59 AM | 299 (1.6%) | 401 (2.7%) |
| 12:00 PM to 3:59 PM | 965 (5.1%) | 1,415 (9.4%) |
| 4:00 PM to 11:59 PM | 1,721 (9.2%) | 1,192 (7.9%) |
| Total | 18,748 (100.0%) | 15,097 (100.0%) |
Housing Occupancy in Payne County
Occupancy by Ownership in Payne County
Of the total 31,843 dwellings in Payne County, owner-occupied units account for 16,387 (51.5%), while renter-occupied units make up 15,456 (48.5%).
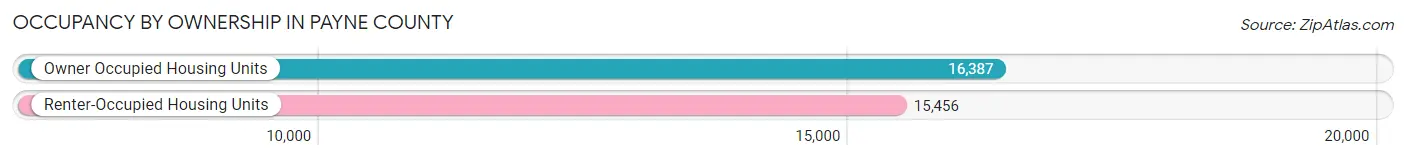
| Occupancy | # Housing Units | % Housing Units |
| Owner Occupied Housing Units | 16,387 | 51.5% |
| Renter-Occupied Housing Units | 15,456 | 48.5% |
| Total Occupied Housing Units | 31,843 | 100.0% |
Occupancy by Household Size in Payne County
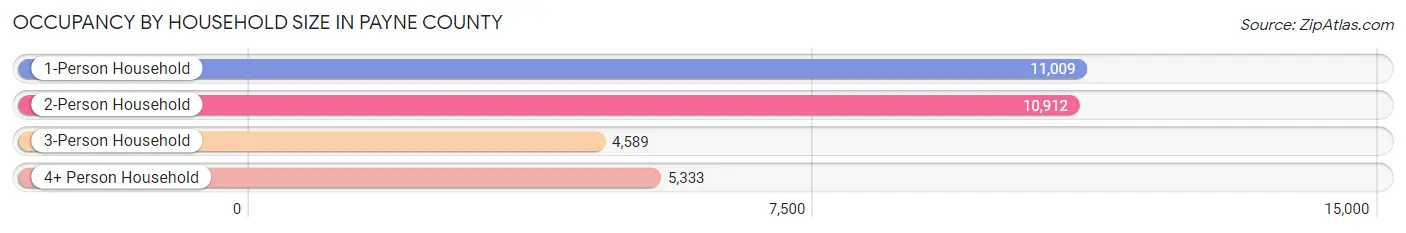
| Household Size | # Housing Units | % Housing Units |
| 1-Person Household | 11,009 | 34.6% |
| 2-Person Household | 10,912 | 34.3% |
| 3-Person Household | 4,589 | 14.4% |
| 4+ Person Household | 5,333 | 16.8% |
| Total Housing Units | 31,843 | 100.0% |
Occupancy by Ownership by Household Size in Payne County
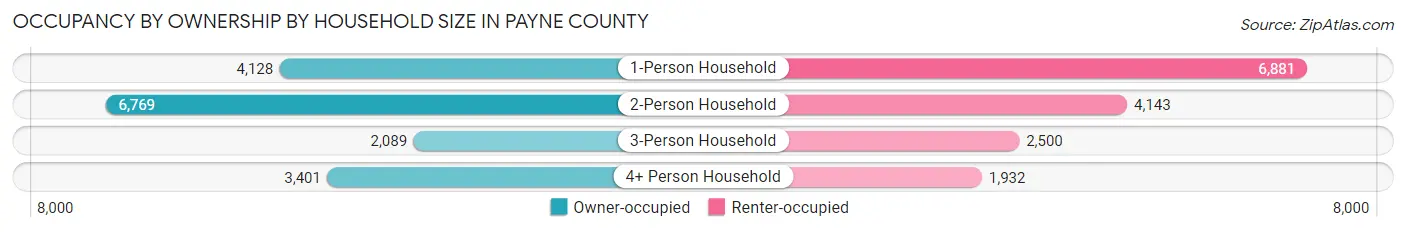
| Household Size | Owner-occupied | Renter-occupied |
| 1-Person Household | 4,128 (37.5%) | 6,881 (62.5%) |
| 2-Person Household | 6,769 (62.0%) | 4,143 (38.0%) |
| 3-Person Household | 2,089 (45.5%) | 2,500 (54.5%) |
| 4+ Person Household | 3,401 (63.8%) | 1,932 (36.2%) |
| Total Housing Units | 16,387 (51.5%) | 15,456 (48.5%) |
Occupancy by Educational Attainment in Payne County
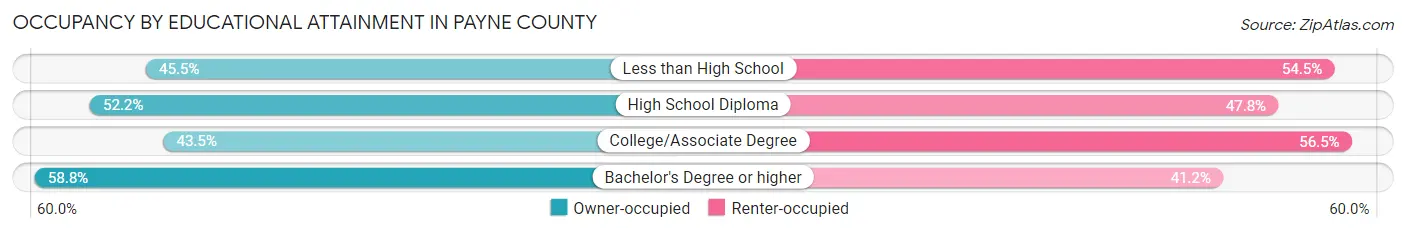
| Household Size | Owner-occupied | Renter-occupied |
| Less than High School | 751 (45.5%) | 898 (54.5%) |
| High School Diploma | 3,716 (52.2%) | 3,402 (47.8%) |
| College/Associate Degree | 4,665 (43.5%) | 6,067 (56.5%) |
| Bachelor's Degree or higher | 7,255 (58.8%) | 5,089 (41.2%) |
Occupancy by Age of Householder in Payne County
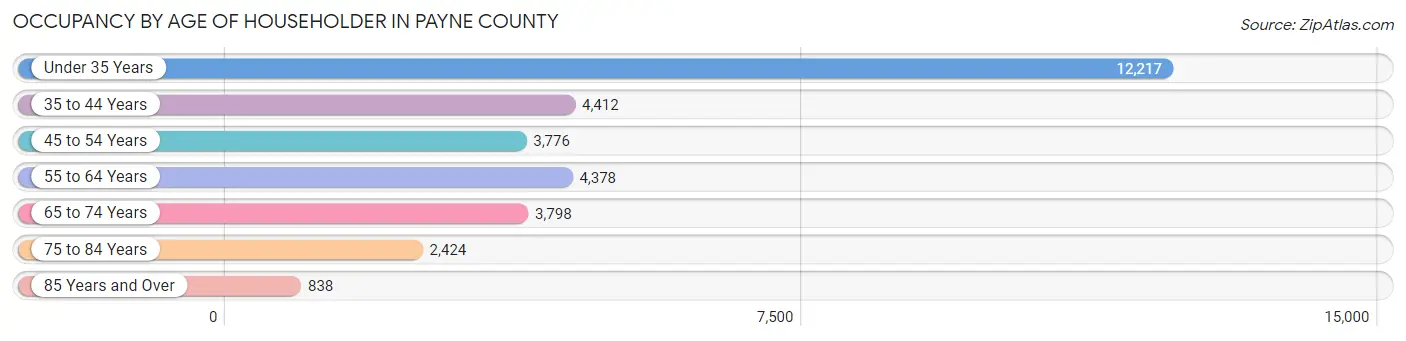
| Age Bracket | # Households | % Households |
| Under 35 Years | 12,217 | 38.4% |
| 35 to 44 Years | 4,412 | 13.9% |
| 45 to 54 Years | 3,776 | 11.9% |
| 55 to 64 Years | 4,378 | 13.8% |
| 65 to 74 Years | 3,798 | 11.9% |
| 75 to 84 Years | 2,424 | 7.6% |
| 85 Years and Over | 838 | 2.6% |
| Total | 31,843 | 100.0% |
Housing Finances in Payne County
Median Income by Occupancy in Payne County
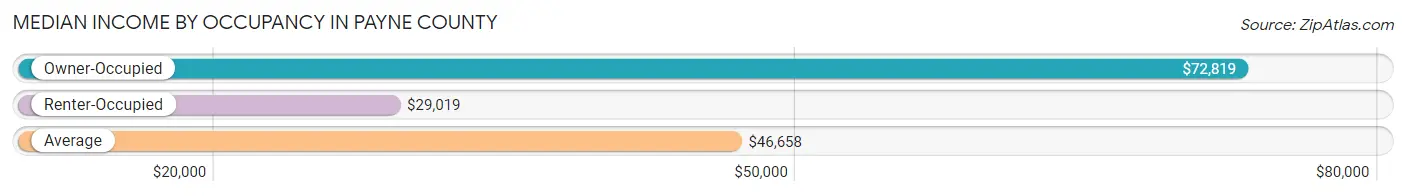
| Occupancy Type | # Households | Median Income |
| Owner-Occupied | 16,387 (51.5%) | $72,819 |
| Renter-Occupied | 15,456 (48.5%) | $29,019 |
| Average | 31,843 (100.0%) | $46,658 |
Occupancy by Householder Income Bracket in Payne County
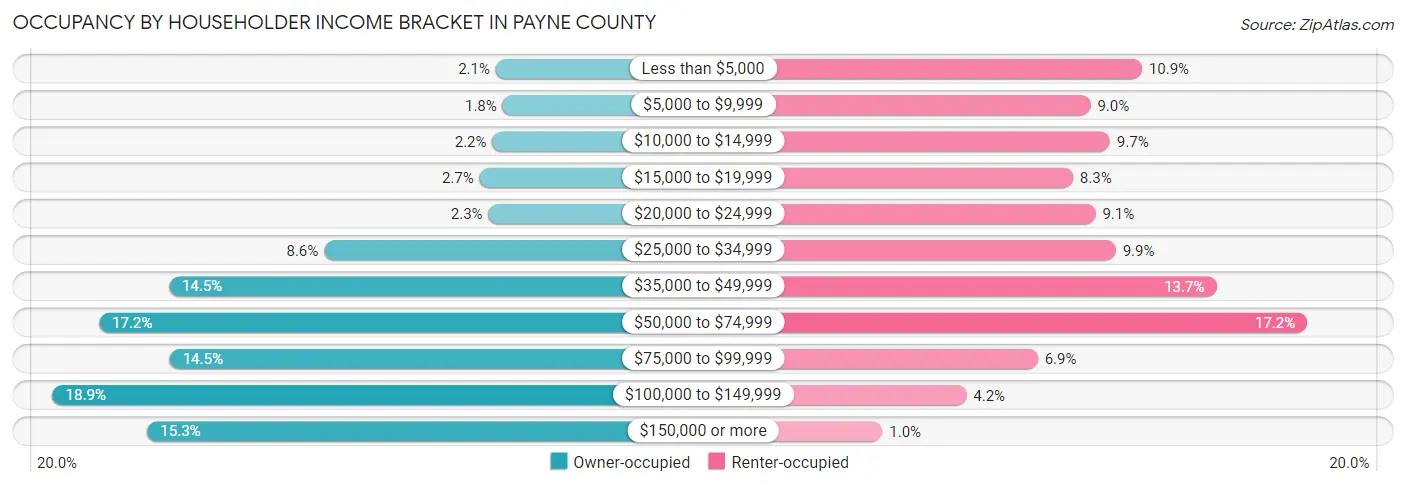
| Income Bracket | Owner-occupied | Renter-occupied |
| Less than $5,000 | 336 (2.1%) | 1,687 (10.9%) |
| $5,000 to $9,999 | 293 (1.8%) | 1,384 (8.9%) |
| $10,000 to $14,999 | 358 (2.2%) | 1,498 (9.7%) |
| $15,000 to $19,999 | 438 (2.7%) | 1,279 (8.3%) |
| $20,000 to $24,999 | 382 (2.3%) | 1,413 (9.1%) |
| $25,000 to $34,999 | 1,407 (8.6%) | 1,531 (9.9%) |
| $35,000 to $49,999 | 2,376 (14.5%) | 2,123 (13.7%) |
| $50,000 to $74,999 | 2,812 (17.2%) | 2,659 (17.2%) |
| $75,000 to $99,999 | 2,372 (14.5%) | 1,072 (6.9%) |
| $100,000 to $149,999 | 3,102 (18.9%) | 653 (4.2%) |
| $150,000 or more | 2,511 (15.3%) | 157 (1.0%) |
| Total | 16,387 (100.0%) | 15,456 (100.0%) |
Monthly Housing Cost Tiers in Payne County
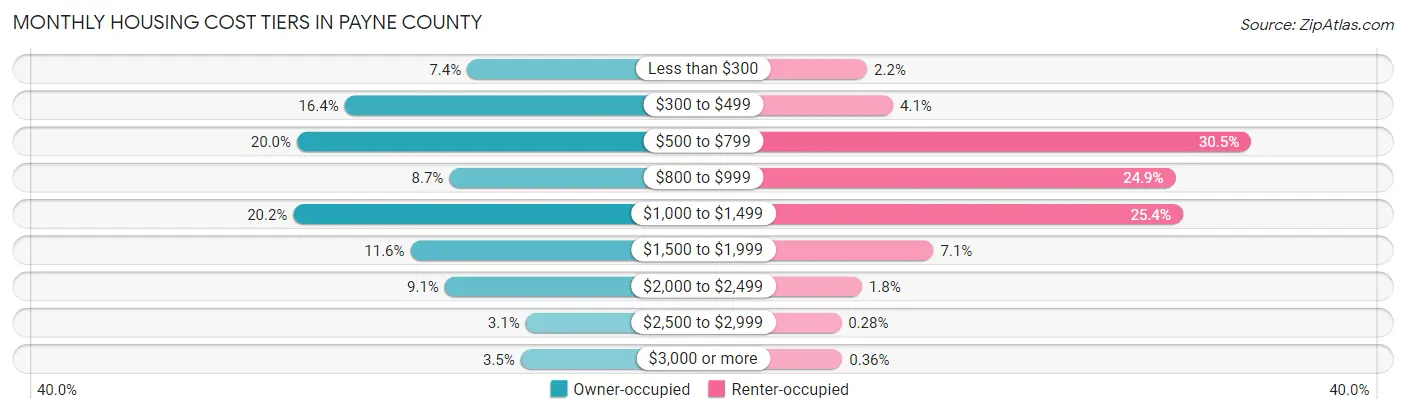
| Monthly Cost | Owner-occupied | Renter-occupied |
| Less than $300 | 1,216 (7.4%) | 339 (2.2%) |
| $300 to $499 | 2,694 (16.4%) | 633 (4.1%) |
| $500 to $799 | 3,270 (20.0%) | 4,708 (30.5%) |
| $800 to $999 | 1,430 (8.7%) | 3,846 (24.9%) |
| $1,000 to $1,499 | 3,314 (20.2%) | 3,930 (25.4%) |
| $1,500 to $1,999 | 1,899 (11.6%) | 1,094 (7.1%) |
| $2,000 to $2,499 | 1,485 (9.1%) | 280 (1.8%) |
| $2,500 to $2,999 | 510 (3.1%) | 43 (0.3%) |
| $3,000 or more | 569 (3.5%) | 55 (0.4%) |
| Total | 16,387 (100.0%) | 15,456 (100.0%) |
Physical Housing Characteristics in Payne County
Housing Structures in Payne County
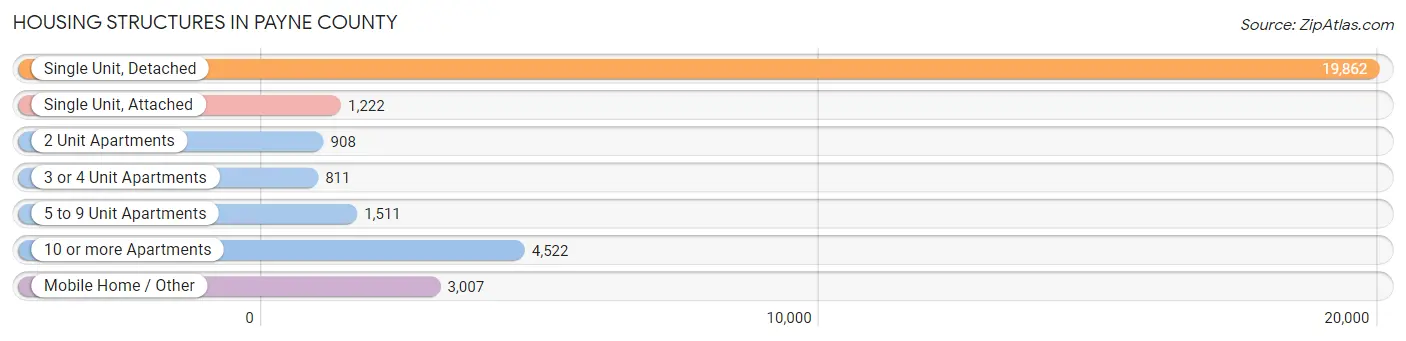
| Structure Type | # Housing Units | % Housing Units |
| Single Unit, Detached | 19,862 | 62.4% |
| Single Unit, Attached | 1,222 | 3.8% |
| 2 Unit Apartments | 908 | 2.9% |
| 3 or 4 Unit Apartments | 811 | 2.5% |
| 5 to 9 Unit Apartments | 1,511 | 4.8% |
| 10 or more Apartments | 4,522 | 14.2% |
| Mobile Home / Other | 3,007 | 9.4% |
| Total | 31,843 | 100.0% |
Housing Structures by Occupancy in Payne County
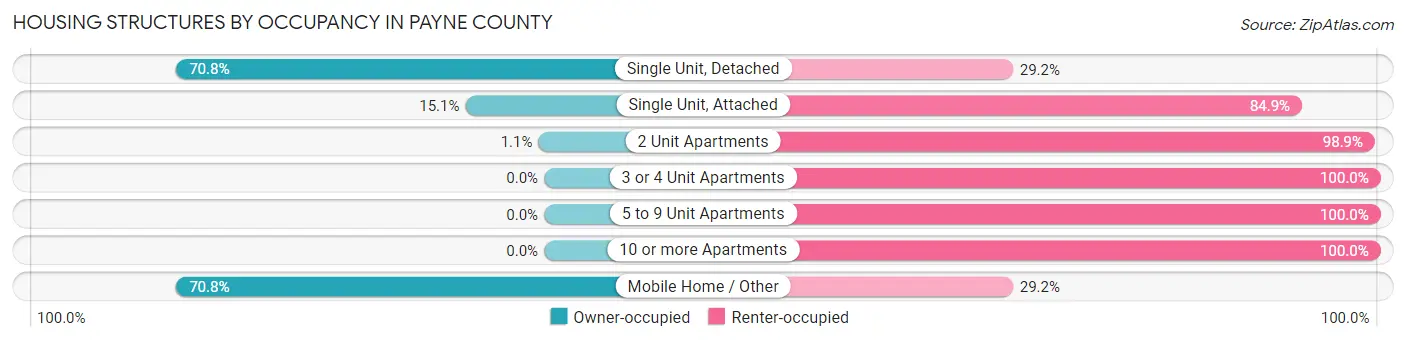
| Structure Type | Owner-occupied | Renter-occupied |
| Single Unit, Detached | 14,063 (70.8%) | 5,799 (29.2%) |
| Single Unit, Attached | 185 (15.1%) | 1,037 (84.9%) |
| 2 Unit Apartments | 10 (1.1%) | 898 (98.9%) |
| 3 or 4 Unit Apartments | 0 (0.0%) | 811 (100.0%) |
| 5 to 9 Unit Apartments | 0 (0.0%) | 1,511 (100.0%) |
| 10 or more Apartments | 0 (0.0%) | 4,522 (100.0%) |
| Mobile Home / Other | 2,129 (70.8%) | 878 (29.2%) |
| Total | 16,387 (51.5%) | 15,456 (48.5%) |
Housing Structures by Number of Rooms in Payne County
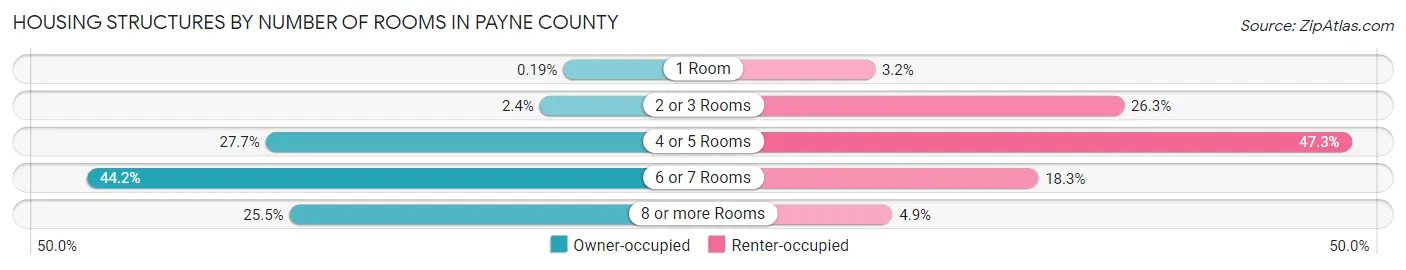
| Number of Rooms | Owner-occupied | Renter-occupied |
| 1 Room | 31 (0.2%) | 501 (3.2%) |
| 2 or 3 Rooms | 386 (2.4%) | 4,061 (26.3%) |
| 4 or 5 Rooms | 4,543 (27.7%) | 7,311 (47.3%) |
| 6 or 7 Rooms | 7,247 (44.2%) | 2,834 (18.3%) |
| 8 or more Rooms | 4,180 (25.5%) | 749 (4.9%) |
| Total | 16,387 (100.0%) | 15,456 (100.0%) |
Housing Structure by Heating Type in Payne County
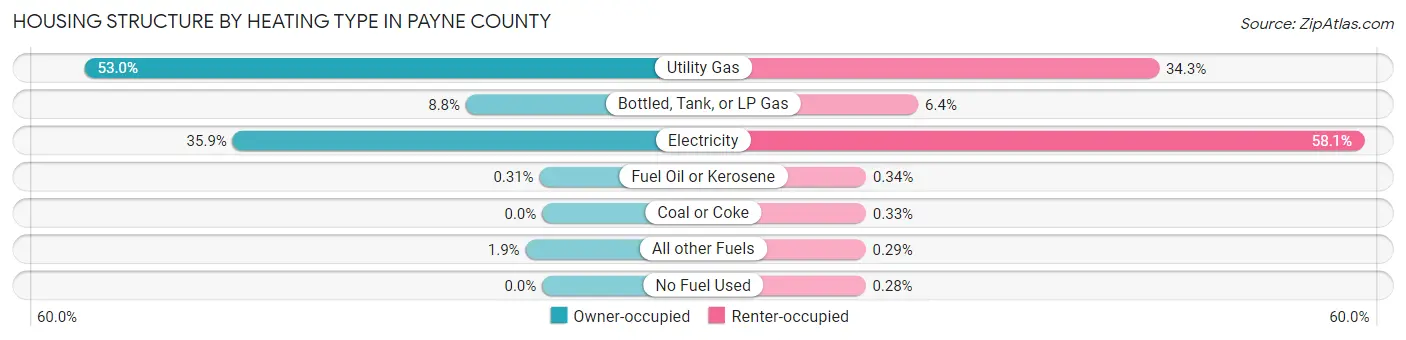
| Heating Type | Owner-occupied | Renter-occupied |
| Utility Gas | 8,691 (53.0%) | 5,303 (34.3%) |
| Bottled, Tank, or LP Gas | 1,449 (8.8%) | 987 (6.4%) |
| Electricity | 5,880 (35.9%) | 8,973 (58.1%) |
| Fuel Oil or Kerosene | 50 (0.3%) | 53 (0.3%) |
| Coal or Coke | 0 (0.0%) | 51 (0.3%) |
| All other Fuels | 317 (1.9%) | 45 (0.3%) |
| No Fuel Used | 0 (0.0%) | 44 (0.3%) |
| Total | 16,387 (100.0%) | 15,456 (100.0%) |
Household Vehicle Usage in Payne County
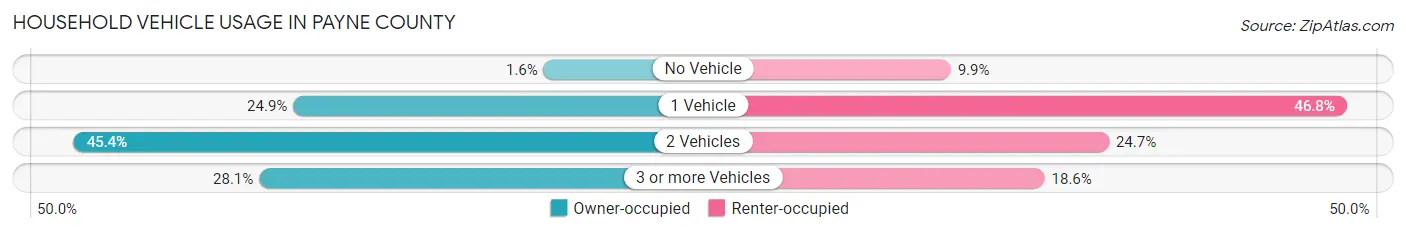
| Vehicles per Household | Owner-occupied | Renter-occupied |
| No Vehicle | 254 (1.5%) | 1,527 (9.9%) |
| 1 Vehicle | 4,085 (24.9%) | 7,238 (46.8%) |
| 2 Vehicles | 7,441 (45.4%) | 3,810 (24.6%) |
| 3 or more Vehicles | 4,607 (28.1%) | 2,881 (18.6%) |
| Total | 16,387 (100.0%) | 15,456 (100.0%) |
Real Estate & Mortgages in Payne County
Real Estate and Mortgage Overview in Payne County
| Characteristic | Without Mortgage | With Mortgage |
| Housing Units | 7,582 | 8,805 |
| Median Property Value | $169,500 | $218,600 |
| Median Household Income | $51,768 | $1,583 |
| Monthly Housing Costs | $496 | $569 |
| Real Estate Taxes | $1,398 | $297 |
Property Value by Mortgage Status in Payne County
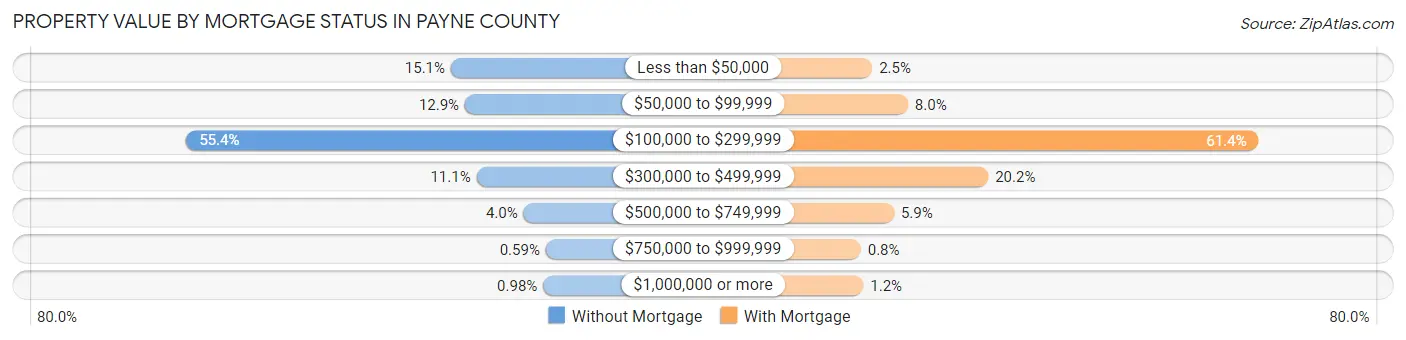
| Property Value | Without Mortgage | With Mortgage |
| Less than $50,000 | 1,141 (15.0%) | 224 (2.5%) |
| $50,000 to $99,999 | 978 (12.9%) | 703 (8.0%) |
| $100,000 to $299,999 | 4,198 (55.4%) | 5,407 (61.4%) |
| $300,000 to $499,999 | 845 (11.1%) | 1,780 (20.2%) |
| $500,000 to $749,999 | 301 (4.0%) | 516 (5.9%) |
| $750,000 to $999,999 | 45 (0.6%) | 70 (0.8%) |
| $1,000,000 or more | 74 (1.0%) | 105 (1.2%) |
| Total | 7,582 (100.0%) | 8,805 (100.0%) |
Household Income by Mortgage Status in Payne County
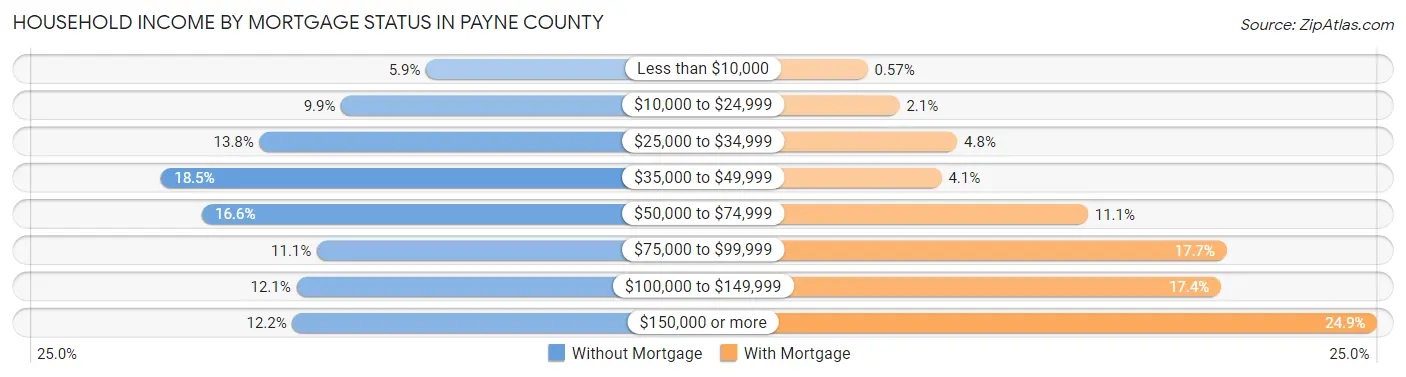
| Household Income | Without Mortgage | With Mortgage |
| Less than $10,000 | 445 (5.9%) | 50 (0.6%) |
| $10,000 to $24,999 | 752 (9.9%) | 184 (2.1%) |
| $25,000 to $34,999 | 1,047 (13.8%) | 426 (4.8%) |
| $35,000 to $49,999 | 1,402 (18.5%) | 360 (4.1%) |
| $50,000 to $74,999 | 1,255 (16.6%) | 974 (11.1%) |
| $75,000 to $99,999 | 839 (11.1%) | 1,557 (17.7%) |
| $100,000 to $149,999 | 914 (12.0%) | 1,533 (17.4%) |
| $150,000 or more | 928 (12.2%) | 2,188 (24.8%) |
| Total | 7,582 (100.0%) | 8,805 (100.0%) |
Property Value to Household Income Ratio in Payne County
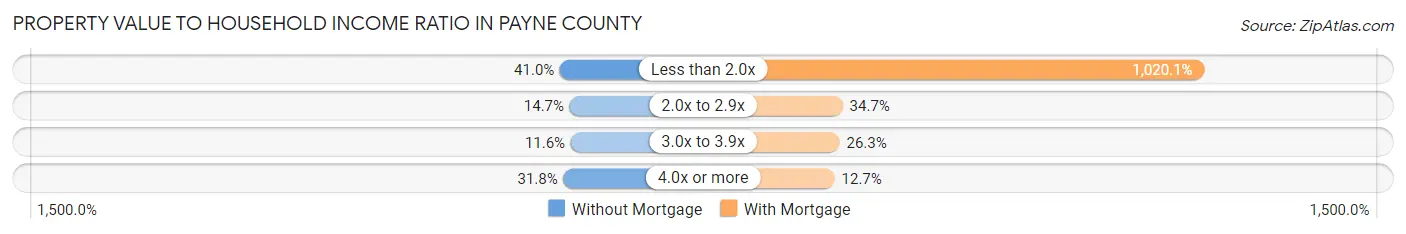
| Value-to-Income Ratio | Without Mortgage | With Mortgage |
| Less than 2.0x | 3,112 (41.0%) | 89,817 (1,020.1%) |
| 2.0x to 2.9x | 1,111 (14.6%) | 3,053 (34.7%) |
| 3.0x to 3.9x | 881 (11.6%) | 2,318 (26.3%) |
| 4.0x or more | 2,413 (31.8%) | 1,120 (12.7%) |
| Total | 7,582 (100.0%) | 8,805 (100.0%) |
Real Estate Taxes by Mortgage Status in Payne County
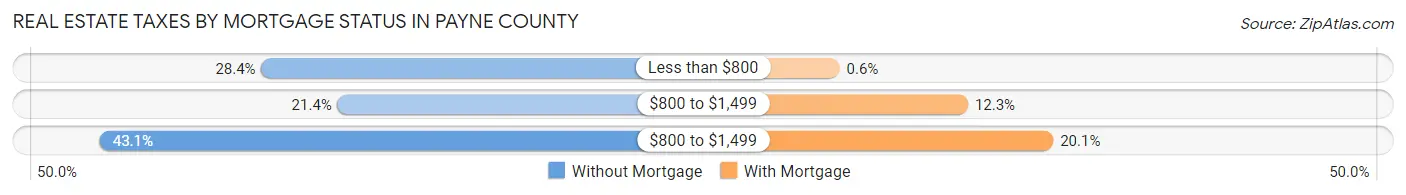
| Property Taxes | Without Mortgage | With Mortgage |
| Less than $800 | 2,151 (28.4%) | 53 (0.6%) |
| $800 to $1,499 | 1,623 (21.4%) | 1,085 (12.3%) |
| $800 to $1,499 | 3,270 (43.1%) | 1,771 (20.1%) |
| Total | 7,582 (100.0%) | 8,805 (100.0%) |
Health & Disability in Payne County
Health Insurance Coverage by Age in Payne County
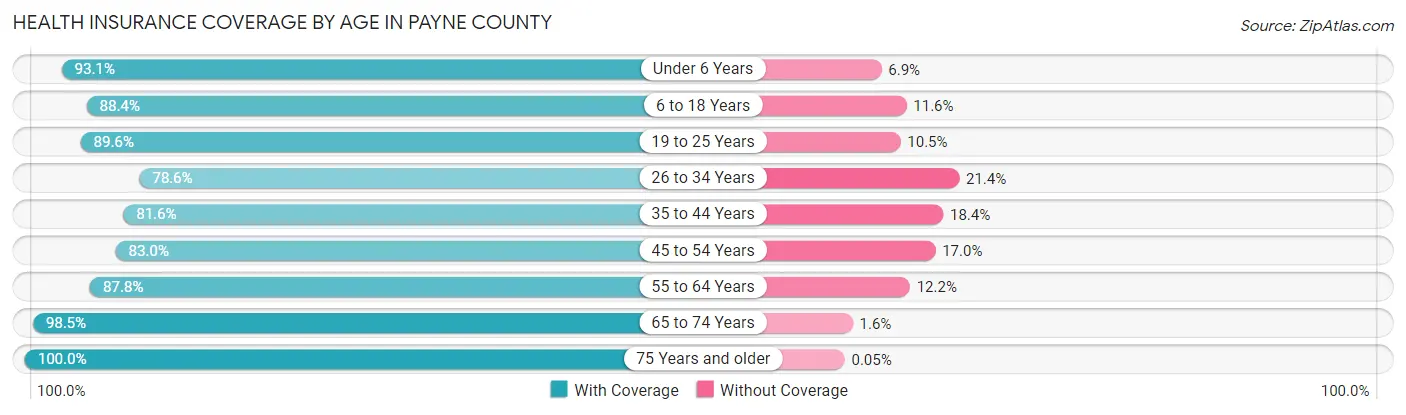
| Age Bracket | With Coverage | Without Coverage |
| Under 6 Years | 4,636 (93.1%) | 344 (6.9%) |
| 6 to 18 Years | 11,914 (88.4%) | 1,559 (11.6%) |
| 19 to 25 Years | 18,507 (89.5%) | 2,159 (10.4%) |
| 26 to 34 Years | 7,144 (78.6%) | 1,945 (21.4%) |
| 35 to 44 Years | 6,597 (81.6%) | 1,489 (18.4%) |
| 45 to 54 Years | 5,488 (83.0%) | 1,121 (17.0%) |
| 55 to 64 Years | 6,296 (87.8%) | 875 (12.2%) |
| 65 to 74 Years | 5,891 (98.5%) | 93 (1.5%) |
| 75 Years and older | 4,351 (100.0%) | 2 (0.1%) |
| Total | 70,824 (88.1%) | 9,587 (11.9%) |
Health Insurance Coverage by Citizenship Status in Payne County
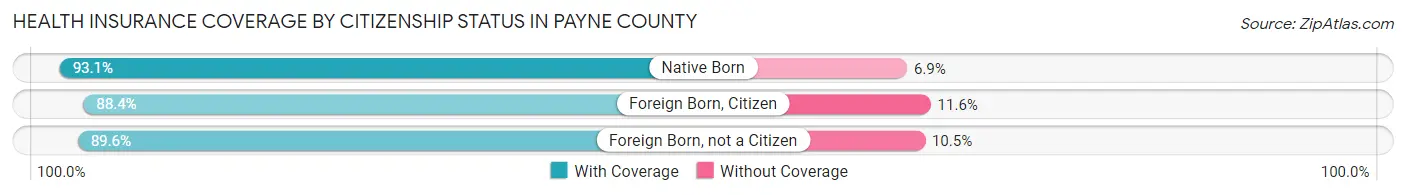
| Citizenship Status | With Coverage | Without Coverage |
| Native Born | 4,636 (93.1%) | 344 (6.9%) |
| Foreign Born, Citizen | 11,914 (88.4%) | 1,559 (11.6%) |
| Foreign Born, not a Citizen | 18,507 (89.5%) | 2,159 (10.4%) |
Health Insurance Coverage by Household Income in Payne County
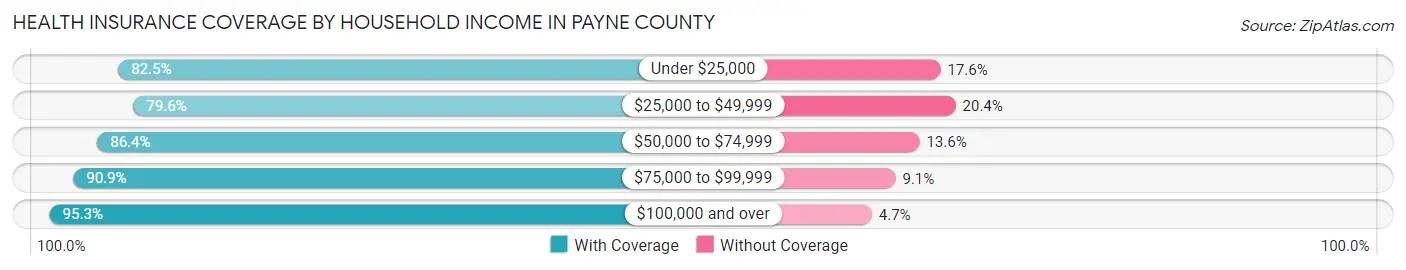
| Household Income | With Coverage | Without Coverage |
| Under $25,000 | 12,690 (82.5%) | 2,702 (17.5%) |
| $25,000 to $49,999 | 12,100 (79.6%) | 3,099 (20.4%) |
| $50,000 to $74,999 | 11,507 (86.4%) | 1,814 (13.6%) |
| $75,000 to $99,999 | 7,965 (90.9%) | 800 (9.1%) |
| $100,000 and over | 18,709 (95.3%) | 922 (4.7%) |
Public vs Private Health Insurance Coverage by Age in Payne County
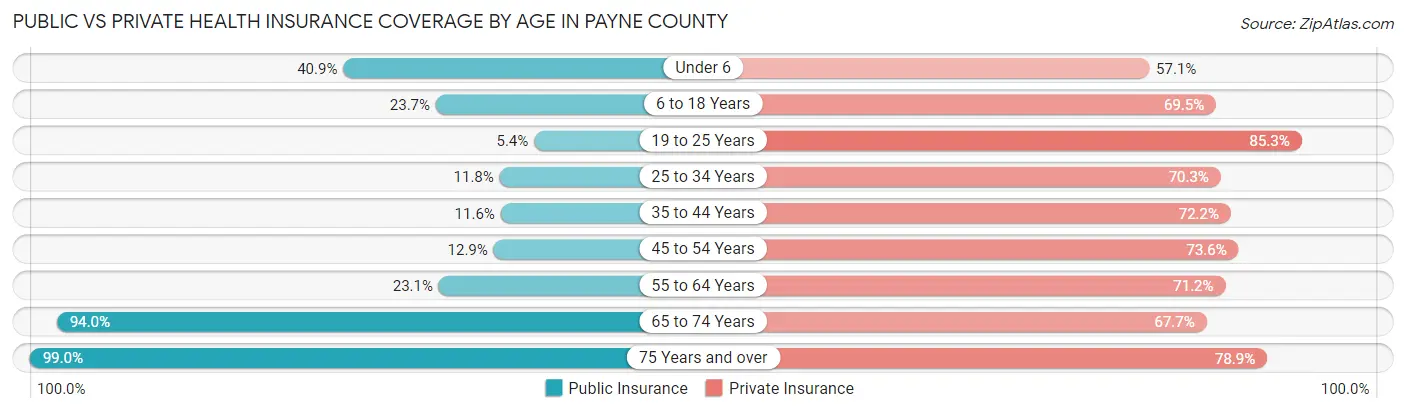
| Age Bracket | Public Insurance | Private Insurance |
| Under 6 | 2,035 (40.9%) | 2,841 (57.1%) |
| 6 to 18 Years | 3,188 (23.7%) | 9,358 (69.5%) |
| 19 to 25 Years | 1,122 (5.4%) | 17,637 (85.3%) |
| 25 to 34 Years | 1,075 (11.8%) | 6,391 (70.3%) |
| 35 to 44 Years | 941 (11.6%) | 5,838 (72.2%) |
| 45 to 54 Years | 855 (12.9%) | 4,866 (73.6%) |
| 55 to 64 Years | 1,658 (23.1%) | 5,105 (71.2%) |
| 65 to 74 Years | 5,627 (94.0%) | 4,051 (67.7%) |
| 75 Years and over | 4,311 (99.0%) | 3,436 (78.9%) |
| Total | 20,812 (25.9%) | 59,523 (74.0%) |
Disability Status by Sex by Age in Payne County
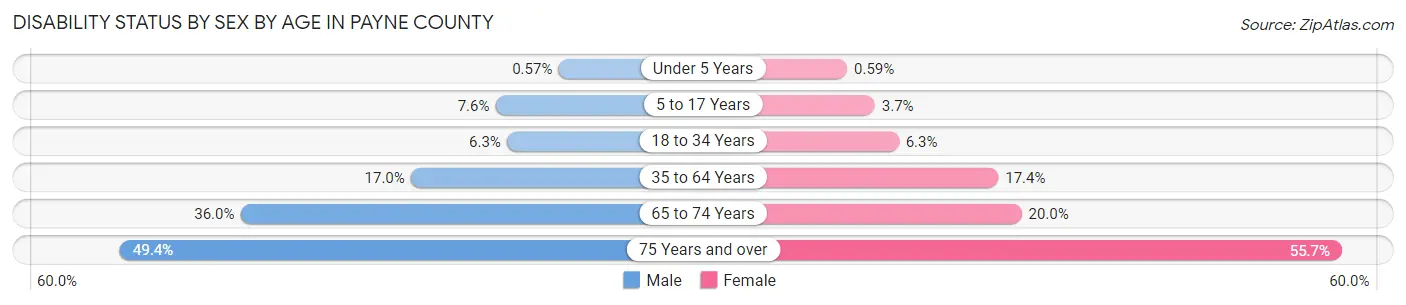
| Age Bracket | Male | Female |
| Under 5 Years | 11 (0.6%) | 11 (0.6%) |
| 5 to 17 Years | 444 (7.6%) | 199 (3.7%) |
| 18 to 34 Years | 1,121 (6.3%) | 974 (6.3%) |
| 35 to 64 Years | 1,843 (17.0%) | 1,923 (17.4%) |
| 65 to 74 Years | 1,019 (36.0%) | 631 (20.0%) |
| 75 Years and over | 876 (49.4%) | 1,436 (55.7%) |
Disability Class by Sex by Age in Payne County
Disability Class: Hearing Difficulty
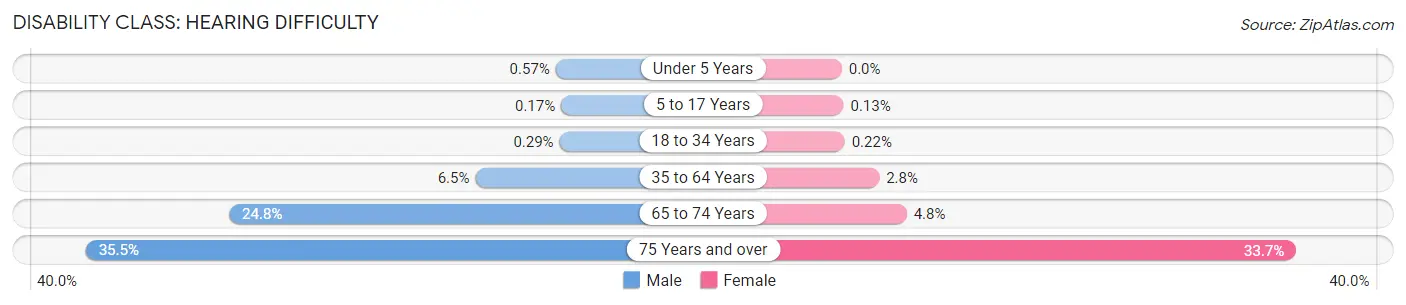
| Age Bracket | Male | Female |
| Under 5 Years | 11 (0.6%) | 0 (0.0%) |
| 5 to 17 Years | 10 (0.2%) | 7 (0.1%) |
| 18 to 34 Years | 52 (0.3%) | 34 (0.2%) |
| 35 to 64 Years | 709 (6.5%) | 307 (2.8%) |
| 65 to 74 Years | 703 (24.8%) | 152 (4.8%) |
| 75 Years and over | 629 (35.5%) | 870 (33.7%) |
Disability Class: Vision Difficulty
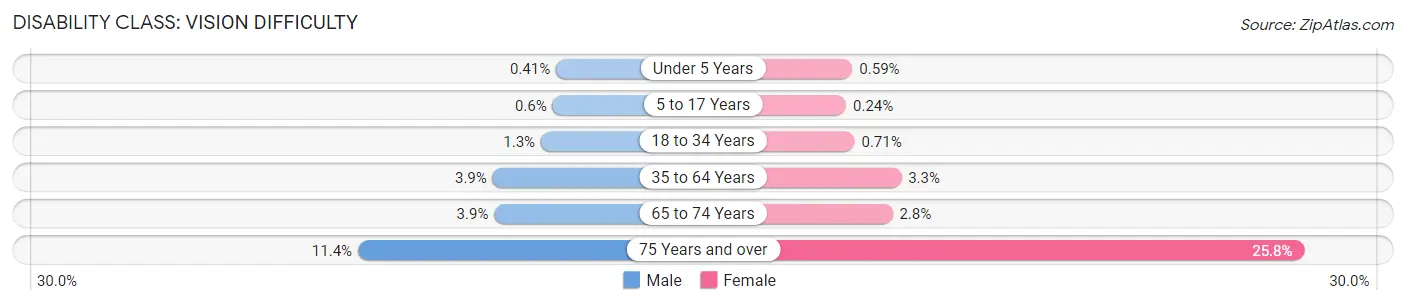
| Age Bracket | Male | Female |
| Under 5 Years | 8 (0.4%) | 11 (0.6%) |
| 5 to 17 Years | 35 (0.6%) | 13 (0.2%) |
| 18 to 34 Years | 222 (1.3%) | 109 (0.7%) |
| 35 to 64 Years | 427 (3.9%) | 365 (3.3%) |
| 65 to 74 Years | 109 (3.8%) | 89 (2.8%) |
| 75 Years and over | 203 (11.4%) | 664 (25.8%) |
Disability Class: Cognitive Difficulty
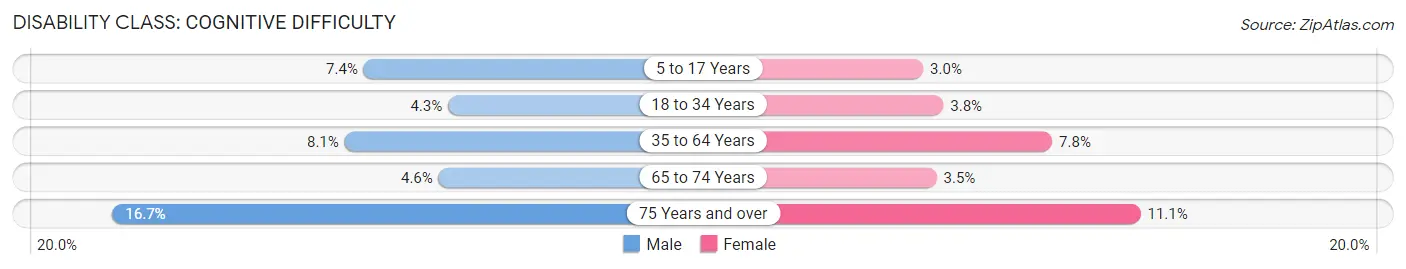
| Age Bracket | Male | Female |
| 5 to 17 Years | 434 (7.4%) | 163 (3.0%) |
| 18 to 34 Years | 760 (4.3%) | 579 (3.8%) |
| 35 to 64 Years | 880 (8.1%) | 862 (7.8%) |
| 65 to 74 Years | 131 (4.6%) | 111 (3.5%) |
| 75 Years and over | 297 (16.7%) | 286 (11.1%) |
Disability Class: Ambulatory Difficulty
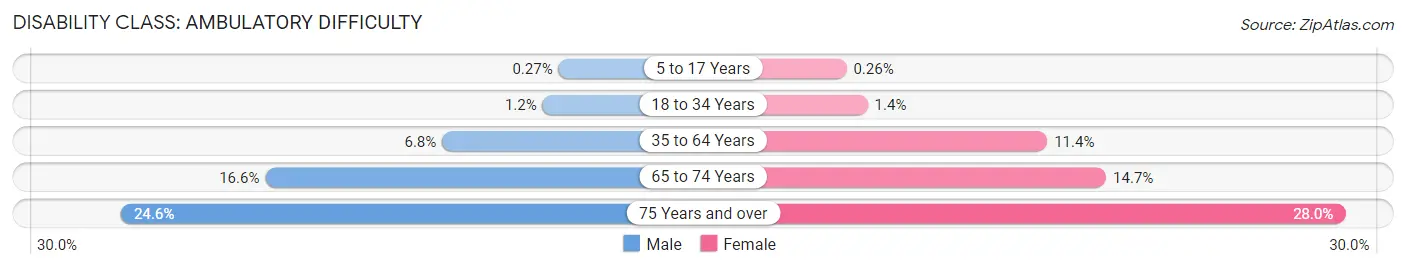
| Age Bracket | Male | Female |
| 5 to 17 Years | 16 (0.3%) | 14 (0.3%) |
| 18 to 34 Years | 206 (1.2%) | 222 (1.4%) |
| 35 to 64 Years | 731 (6.8%) | 1,262 (11.4%) |
| 65 to 74 Years | 470 (16.6%) | 464 (14.7%) |
| 75 Years and over | 437 (24.6%) | 723 (28.0%) |
Disability Class: Self-Care Difficulty
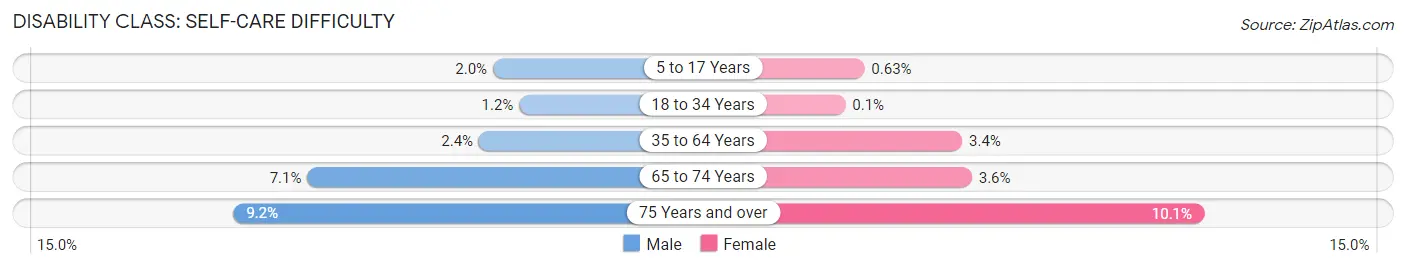
| Age Bracket | Male | Female |
| 5 to 17 Years | 115 (2.0%) | 34 (0.6%) |
| 18 to 34 Years | 218 (1.2%) | 16 (0.1%) |
| 35 to 64 Years | 255 (2.4%) | 369 (3.4%) |
| 65 to 74 Years | 202 (7.1%) | 114 (3.6%) |
| 75 Years and over | 163 (9.2%) | 260 (10.1%) |
Technology Access in Payne County
Computing Device Access in Payne County
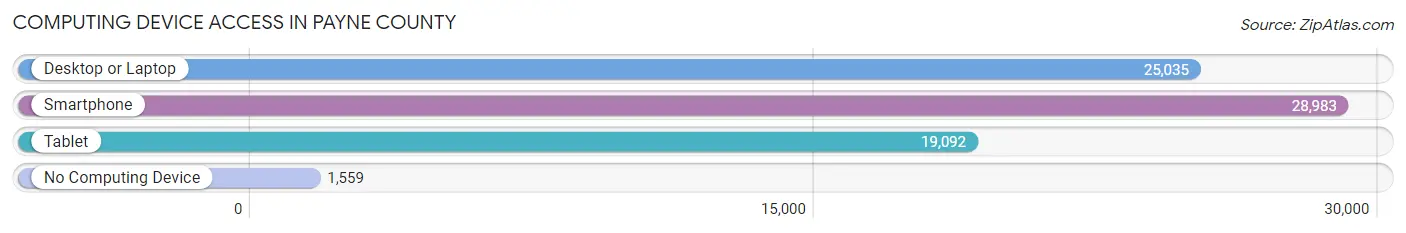
| Device Type | # Households | % Households |
| Desktop or Laptop | 25,035 | 78.6% |
| Smartphone | 28,983 | 91.0% |
| Tablet | 19,092 | 60.0% |
| No Computing Device | 1,559 | 4.9% |
| Total | 31,843 | 100.0% |
Internet Access in Payne County
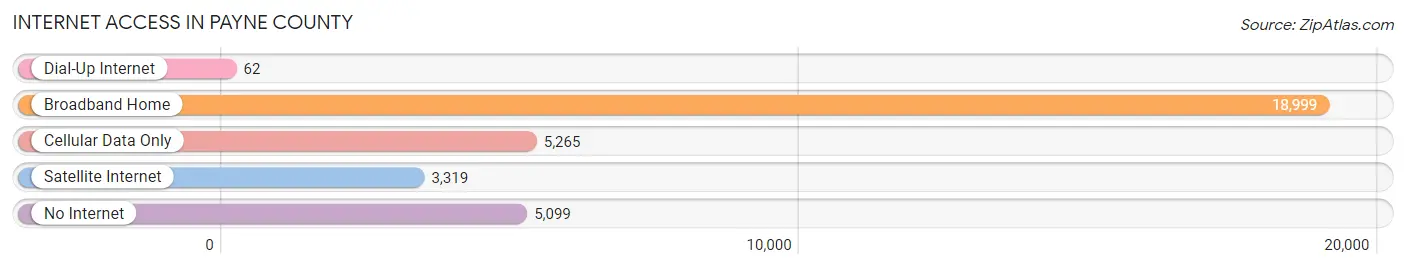
| Internet Type | # Households | % Households |
| Dial-Up Internet | 62 | 0.2% |
| Broadband Home | 18,999 | 59.7% |
| Cellular Data Only | 5,265 | 16.5% |
| Satellite Internet | 3,319 | 10.4% |
| No Internet | 5,099 | 16.0% |
| Total | 31,843 | 100.0% |
Payne County Summary
Payne County is located in the central part of Oklahoma, and is part of the Oklahoma City Metropolitan Statistical Area. The county was created in 1890, and is named after Captain David L. Payne, a leader of the Oklahoma Land Run of 1889. The county seat is Stillwater, and the county has a total area of 718 square miles. As of the 2010 census, the population was 77,350, making it the fourth most populous county in Oklahoma.
Geography
Payne County is located in the central part of Oklahoma, and is bordered by Noble County to the north, Logan County to the east, Lincoln County to the south, and Pawnee County to the west. The county is part of the Oklahoma City Metropolitan Statistical Area. The county is mostly flat, with some rolling hills in the northern part of the county. The county is drained by the Cimarron River, which flows through the county from north to south. The county is also home to several small lakes, including Lake McMurtry, Lake Carl Blackwell, and Lake Boomer.
Climate
Payne County has a humid subtropical climate, with hot summers and mild winters. The average annual temperature is 63°F, and the average annual precipitation is 36 inches.
Demographics
As of the 2010 census, there were 77,350 people, 28,845 households, and 18,945 families living in the county. The population density was 108 people per square mile. The racial makeup of the county was 81.3% White, 5.2% Black or African American, 5.7% Native American, 2.2% Asian, 0.2% Pacific Islander, 2.3% from other races, and 3.2% from two or more races. 6.7% of the population were Hispanic or Latino of any race.
The median income for a household in the county was $41,945, and the median income for a family was $51,945. The per capita income for the county was $20,945. About 11.2% of families and 16.2% of the population were below the poverty line, including 20.2% of those under age 18 and 8.2% of those age 65 or over.
Economy
Payne County is home to several major employers, including Oklahoma State University, Stillwater Medical Center, and the Stillwater Regional Airport. The county is also home to several manufacturing companies, including ConocoPhillips, Halliburton, and Tyson Foods. Agriculture is also an important part of the county's economy, with wheat, soybeans, and hay being the main crops.
History
Payne County was created in 1890, and is named after Captain David L. Payne, a leader of the Oklahoma Land Run of 1889. The county was originally part of the Cherokee Outlet, and was opened to settlement in the Land Run. The county seat is Stillwater, which was founded in 1889. The city was named after the nearby Stillwater Creek, which was named by a group of settlers who were impressed by the stillness of the water.
Payne County has a long history of agriculture, and was once home to several large farms. The county was also home to several Native American tribes, including the Osage, Pawnee, and Quapaw. The county was also home to several oil and gas fields, which were developed in the early 20th century.
Payne County has a long history of education, and is home to Oklahoma State University, which was founded in 1890. The university is the largest in the state, and is home to over 25,000 students. The county is also home to several other colleges and universities, including Northern Oklahoma College and Langston University.
Common Questions
What is the Total Population of Payne County?
Total Population of Payne County is 82,058.
What is the Total Male Population of Payne County?
Total Male Population of Payne County is 42,359.
What is the Total Female Population of Payne County?
Total Female Population of Payne County is 39,699.
What is the Ratio of Males per 100 Females in Payne County?
There are 106.70 Males per 100 Females in Payne County.
What is the Ratio of Females per 100 Males in Payne County?
There are 93.72 Females per 100 Males in Payne County.
What is the Median Population Age in Payne County?
Median Population Age in Payne County is 27.2 Years.
What is the Average Family Size in Payne County
Average Family Size in Payne County is 2.9 People.
What is the Average Household Size in Payne County
Average Household Size in Payne County is 2.3 People.
What is Per Capita Income in Payne County?
Per Capita income in Payne County is $26,916.
What is the Median Family Income in Payne County?
Median Family Income in Payne County is $71,757.
What is the Median Household income in Payne County?
Median Household Income in Payne County is $46,658.
What is Income or Wage Gap in Payne County?
Income or Wage Gap in Payne County is 34.4%.
Women in Payne County earn 65.6 cents for every dollar earned by a man.
What is Family Income Deficit in Payne County?
Family Income Deficit in Payne County is $10,748.
Families that are below poverty line in Payne County earn $10,748 less on average than the poverty threshold level.
What is Inequality or Gini Index in Payne County?
Inequality or Gini Index in Payne County is 0.49.
How Large is the Labor Force in Payne County?
There are 39,092 People in the Labor Forcein in Payne County.
What is the Percentage of People in the Labor Force in Payne County?
57.1% of People are in the Labor Force in Payne County.
What is the Unemployment Rate in Payne County?
Unemployment Rate in Payne County is 4.8%.