Osage County, OK
Osage County Map
Osage County Overview
46,004
TOTAL POPULATION
23,249
MALE POPULATION
22,755
FEMALE POPULATION
102.17
MALES / 100 FEMALES
97.88
FEMALES / 100 MALES
43.2
MEDIAN AGE
3.2
AVG FAMILY SIZE
2.6
AVG HOUSEHOLD SIZE
$29,906
PER CAPITA INCOME
$73,536
AVG FAMILY INCOME
$58,189
AVG HOUSEHOLD INCOME
32.3%
WAGE / INCOME GAP [ % ]
67.7¢/ $1
WAGE / INCOME GAP [ $ ]
$11,607
FAMILY INCOME DEFICIT
0.43
INEQUALITY / GINI INDEX
20,348
LABOR FORCE [ PEOPLE ]
54.2%
PERCENT IN LABOR FORCE
5.6%
UNEMPLOYMENT RATE
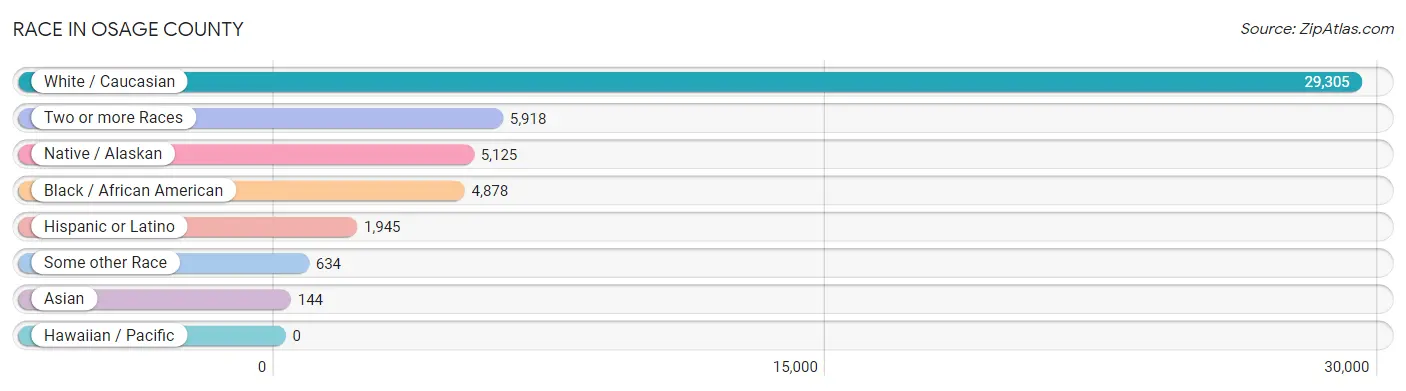
Race in Osage County
The most populous races in Osage County are White / Caucasian (29,305 | 63.7%), Two or more Races (5,918 | 12.9%), and Native / Alaskan (5,125 | 11.1%).
| Race | # Population | % Population |
| Asian | 144 | 0.3% |
| Black / African American | 4,878 | 10.6% |
| Hawaiian / Pacific | 0 | 0.0% |
| Hispanic or Latino | 1,945 | 4.2% |
| Native / Alaskan | 5,125 | 11.1% |
| White / Caucasian | 29,305 | 63.7% |
| Two or more Races | 5,918 | 12.9% |
| Some other Race | 634 | 1.4% |
| Total | 46,004 | 100.0% |
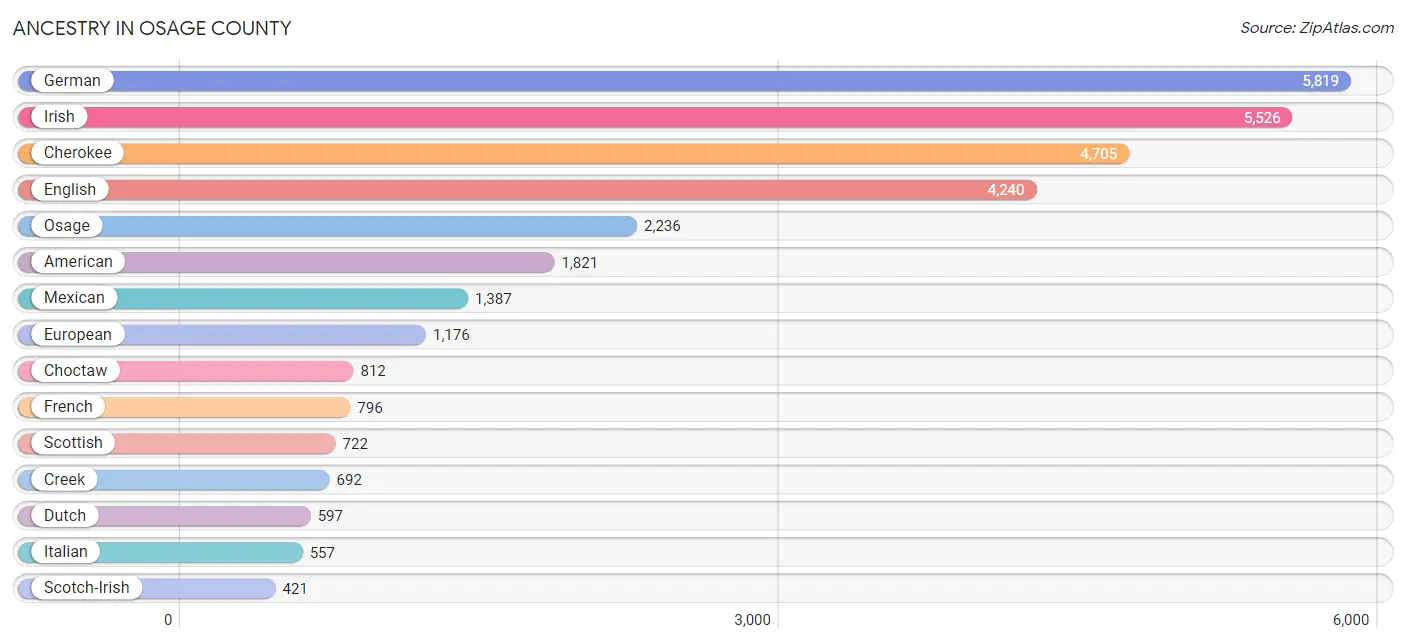
Ancestry in Osage County
The most populous ancestries reported in Osage County are German (5,819 | 12.7%), Irish (5,526 | 12.0%), Cherokee (4,705 | 10.2%), English (4,240 | 9.2%), and Osage (2,236 | 4.9%), together accounting for 49.0% of all Osage County residents.
| Ancestry | # Population | % Population |
| African | 293 | 0.6% |
| Alaska Native | 5 | 0.0% |
| Aleut | 2 | 0.0% |
| American | 1,821 | 4.0% |
| Apache | 68 | 0.2% |
| Arab | 88 | 0.2% |
| Arapaho | 6 | 0.0% |
| Australian | 11 | 0.0% |
| Austrian | 39 | 0.1% |
| Bangladeshi | 105 | 0.2% |
| Basque | 28 | 0.1% |
| Belgian | 24 | 0.1% |
| Bermudan | 7 | 0.0% |
| Bhutanese | 38 | 0.1% |
| Blackfeet | 112 | 0.2% |
| Bolivian | 1 | 0.0% |
| Brazilian | 186 | 0.4% |
| British | 249 | 0.5% |
| Burmese | 8 | 0.0% |
| Cajun | 21 | 0.1% |
| Canadian | 16 | 0.0% |
| Celtic | 7 | 0.0% |
| Central American | 126 | 0.3% |
| Cherokee | 4,705 | 10.2% |
| Cheyenne | 41 | 0.1% |
| Chickasaw | 116 | 0.3% |
| Chippewa | 15 | 0.0% |
| Choctaw | 812 | 1.8% |
| Colombian | 46 | 0.1% |
| Comanche | 47 | 0.1% |
| Costa Rican | 27 | 0.1% |
| Creek | 692 | 1.5% |
| Cuban | 124 | 0.3% |
| Czech | 52 | 0.1% |
| Czechoslovakian | 17 | 0.0% |
| Danish | 71 | 0.2% |
| Delaware | 51 | 0.1% |
| Dutch | 597 | 1.3% |
| Dutch West Indian | 129 | 0.3% |
| Eastern European | 60 | 0.1% |
| English | 4,240 | 9.2% |
| European | 1,176 | 2.6% |
| Finnish | 13 | 0.0% |
| French | 796 | 1.7% |
| French American Indian | 9 | 0.0% |
| French Canadian | 102 | 0.2% |
| German | 5,819 | 12.7% |
| Greek | 3 | 0.0% |
| Guatemalan | 14 | 0.0% |
| Honduran | 81 | 0.2% |
| Hungarian | 75 | 0.2% |
| Indian (Asian) | 16 | 0.0% |
| Iranian | 11 | 0.0% |
| Irish | 5,526 | 12.0% |
| Iroquois | 202 | 0.4% |
| Italian | 557 | 1.2% |
| Jamaican | 17 | 0.0% |
| Kiowa | 29 | 0.1% |
| Korean | 19 | 0.0% |
| Lebanese | 79 | 0.2% |
| Lithuanian | 9 | 0.0% |
| Lumbee | 22 | 0.1% |
| Malaysian | 30 | 0.1% |
| Mexican | 1,387 | 3.0% |
| Mexican American Indian | 42 | 0.1% |
| Native Hawaiian | 14 | 0.0% |
| Navajo | 92 | 0.2% |
| Nigerian | 3 | 0.0% |
| Northern European | 24 | 0.1% |
| Norwegian | 190 | 0.4% |
| Osage | 2,236 | 4.9% |
| Ottawa | 21 | 0.1% |
| Pakistani | 2 | 0.0% |
| Pennsylvania German | 6 | 0.0% |
| Pima | 24 | 0.1% |
| Polish | 388 | 0.8% |
| Portuguese | 152 | 0.3% |
| Potawatomi | 156 | 0.3% |
| Pueblo | 3 | 0.0% |
| Puerto Rican | 132 | 0.3% |
| Romanian | 29 | 0.1% |
| Russian | 109 | 0.2% |
| Salvadoran | 4 | 0.0% |
| Scandinavian | 202 | 0.4% |
| Scotch-Irish | 421 | 0.9% |
| Scottish | 722 | 1.6% |
| Seminole | 64 | 0.1% |
| Sioux | 191 | 0.4% |
| South American | 47 | 0.1% |
| Spaniard | 61 | 0.1% |
| Spanish | 14 | 0.0% |
| Spanish American | 2 | 0.0% |
| Sri Lankan | 22 | 0.1% |
| Subsaharan African | 296 | 0.6% |
| Swedish | 197 | 0.4% |
| Swiss | 46 | 0.1% |
| Ukrainian | 11 | 0.0% |
| Vietnamese | 2 | 0.0% |
| Welsh | 203 | 0.4% |
| Yugoslavian | 18 | 0.0% | View All 100 Rows |
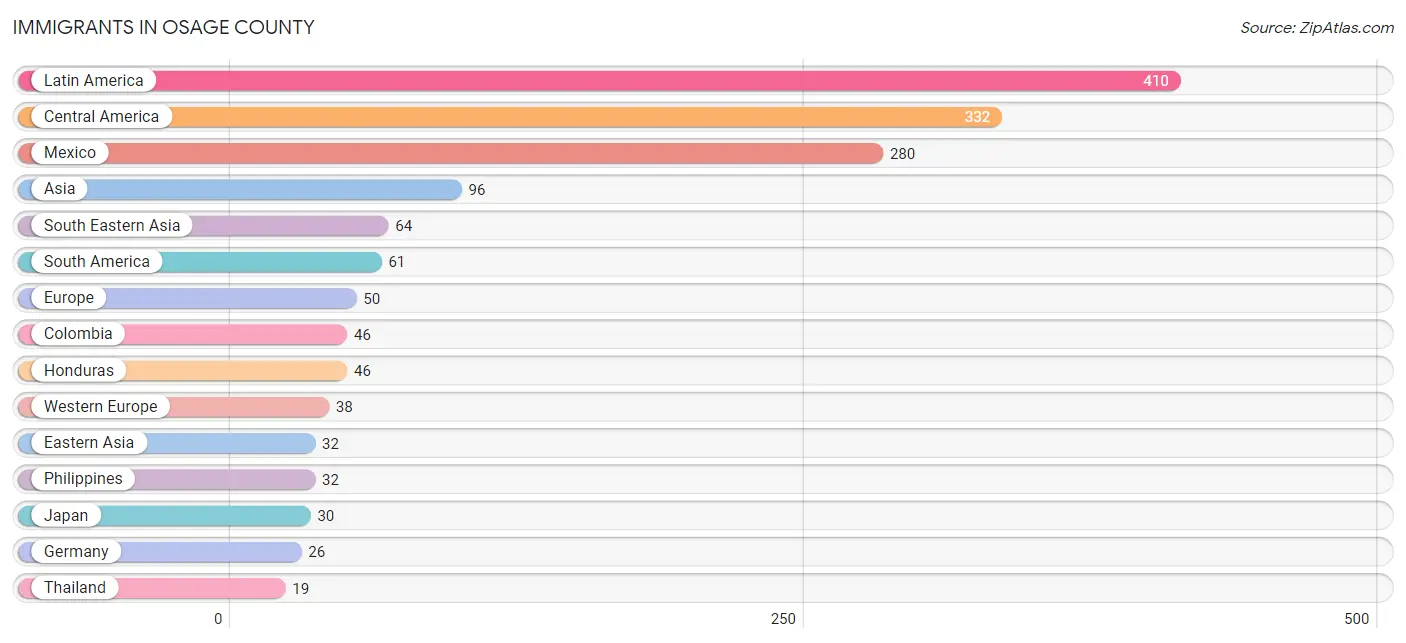
Immigrants in Osage County
The most numerous immigrant groups reported in Osage County came from Latin America (410 | 0.9%), Central America (332 | 0.7%), Mexico (280 | 0.6%), Asia (96 | 0.2%), and South Eastern Asia (64 | 0.1%), together accounting for 2.6% of all Osage County residents.
| Immigration Origin | # Population | % Population |
| Africa | 16 | 0.0% |
| Asia | 96 | 0.2% |
| Australia | 4 | 0.0% |
| Bolivia | 1 | 0.0% |
| Brazil | 14 | 0.0% |
| Bulgaria | 4 | 0.0% |
| Canada | 1 | 0.0% |
| Caribbean | 17 | 0.0% |
| Central America | 332 | 0.7% |
| China | 2 | 0.0% |
| Colombia | 46 | 0.1% |
| Eastern Asia | 32 | 0.1% |
| Eastern Europe | 4 | 0.0% |
| El Salvador | 6 | 0.0% |
| Europe | 50 | 0.1% |
| Germany | 26 | 0.1% |
| Honduras | 46 | 0.1% |
| Hong Kong | 2 | 0.0% |
| Jamaica | 17 | 0.0% |
| Japan | 30 | 0.1% |
| Latin America | 410 | 0.9% |
| Mexico | 280 | 0.6% |
| Netherlands | 12 | 0.0% |
| Nigeria | 3 | 0.0% |
| Northern Europe | 6 | 0.0% |
| Oceania | 4 | 0.0% |
| Philippines | 32 | 0.1% |
| South America | 61 | 0.1% |
| South Eastern Asia | 64 | 0.1% |
| Southern Europe | 2 | 0.0% |
| Spain | 2 | 0.0% |
| Thailand | 19 | 0.0% |
| Vietnam | 13 | 0.0% |
| Western Africa | 3 | 0.0% |
| Western Europe | 38 | 0.1% | View All 35 Rows |
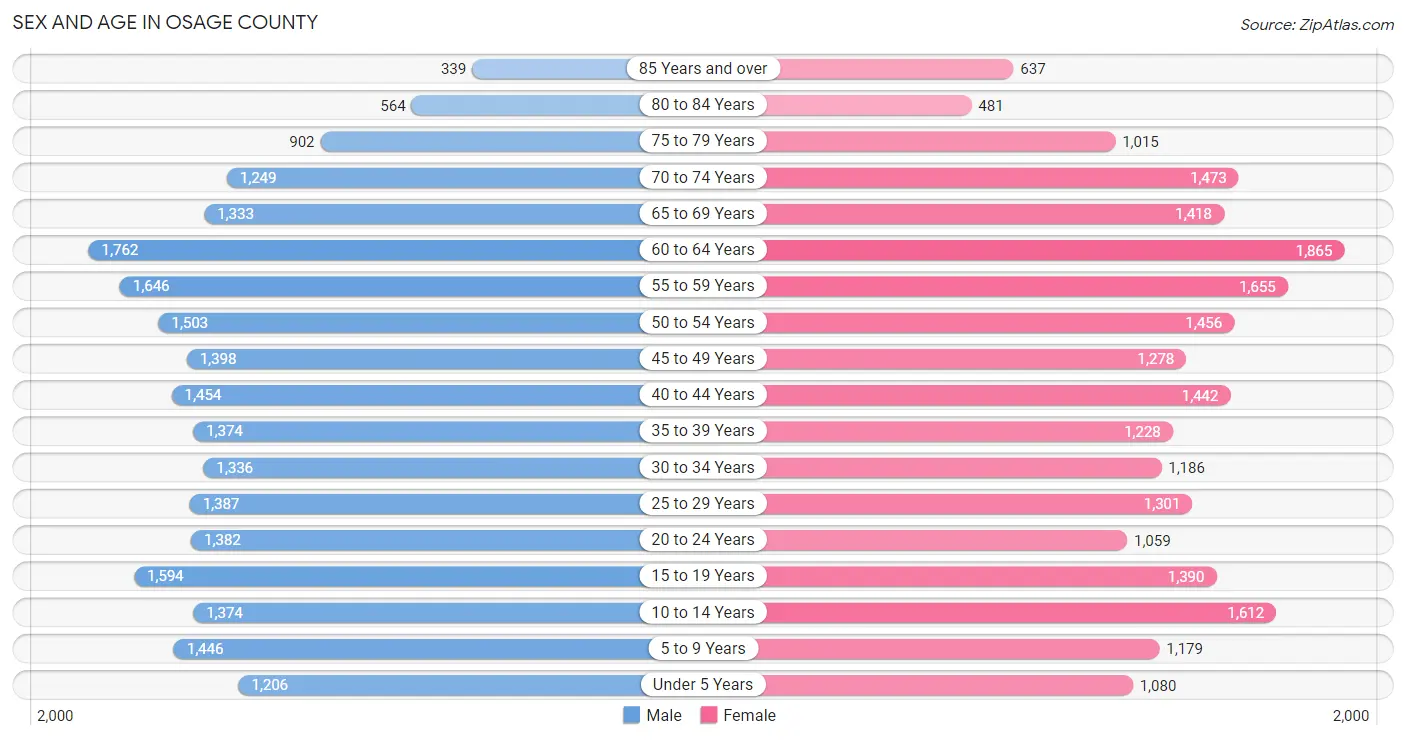
Sex and Age in Osage County
Sex and Age in Osage County
The most populous age groups in Osage County are 60 to 64 Years (1,762 | 7.6%) for men and 60 to 64 Years (1,865 | 8.2%) for women.
| Age Bracket | Male | Female |
| Under 5 Years | 1,206 (5.2%) | 1,080 (4.8%) |
| 5 to 9 Years | 1,446 (6.2%) | 1,179 (5.2%) |
| 10 to 14 Years | 1,374 (5.9%) | 1,612 (7.1%) |
| 15 to 19 Years | 1,594 (6.9%) | 1,390 (6.1%) |
| 20 to 24 Years | 1,382 (5.9%) | 1,059 (4.6%) |
| 25 to 29 Years | 1,387 (6.0%) | 1,301 (5.7%) |
| 30 to 34 Years | 1,336 (5.8%) | 1,186 (5.2%) |
| 35 to 39 Years | 1,374 (5.9%) | 1,228 (5.4%) |
| 40 to 44 Years | 1,454 (6.2%) | 1,442 (6.3%) |
| 45 to 49 Years | 1,398 (6.0%) | 1,278 (5.6%) |
| 50 to 54 Years | 1,503 (6.5%) | 1,456 (6.4%) |
| 55 to 59 Years | 1,646 (7.1%) | 1,655 (7.3%) |
| 60 to 64 Years | 1,762 (7.6%) | 1,865 (8.2%) |
| 65 to 69 Years | 1,333 (5.7%) | 1,418 (6.2%) |
| 70 to 74 Years | 1,249 (5.4%) | 1,473 (6.5%) |
| 75 to 79 Years | 902 (3.9%) | 1,015 (4.5%) |
| 80 to 84 Years | 564 (2.4%) | 481 (2.1%) |
| 85 Years and over | 339 (1.5%) | 637 (2.8%) |
| Total | 23,249 (100.0%) | 22,755 (100.0%) |
Families and Households in Osage County
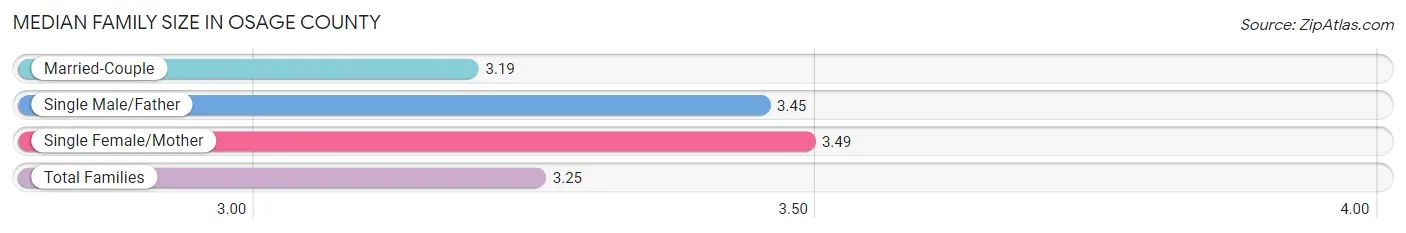
Median Family Size in Osage County
The median family size in Osage County is 3.25 persons per family, with single female/mother families (1,736 | 15.2%) accounting for the largest median family size of 3.49 persons per family. On the other hand, married-couple families (9,060 | 79.2%) represent the smallest median family size with 3.19 persons per family.
| Family Type | # Families | Family Size |
| Married-Couple | 9,060 (79.2%) | 3.19 |
| Single Male/Father | 637 (5.6%) | 3.45 |
| Single Female/Mother | 1,736 (15.2%) | 3.49 |
| Total Families | 11,433 (100.0%) | 3.25 |
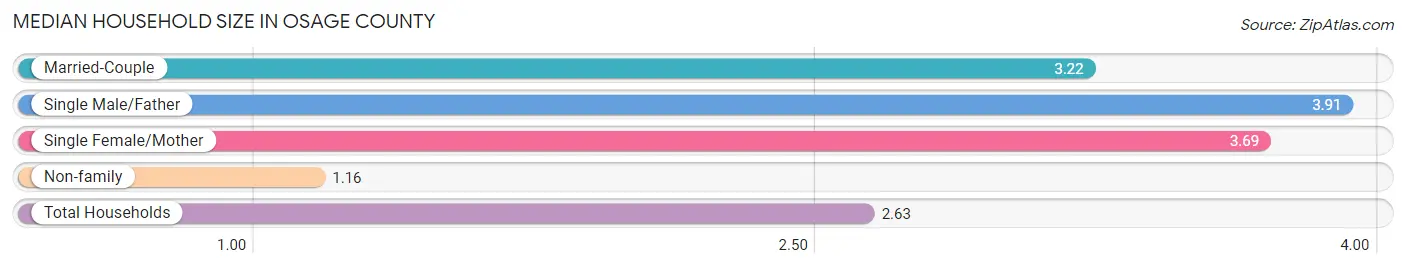
Median Household Size in Osage County
The median household size in Osage County is 2.63 persons per household, with single male/father households (637 | 3.8%) accounting for the largest median household size of 3.91 persons per household. non-family households (5,418 | 32.2%) represent the smallest median household size with 1.16 persons per household.
| Household Type | # Households | Household Size |
| Married-Couple | 9,060 (53.8%) | 3.22 |
| Single Male/Father | 637 (3.8%) | 3.91 |
| Single Female/Mother | 1,736 (10.3%) | 3.69 |
| Non-family | 5,418 (32.2%) | 1.16 |
| Total Households | 16,851 (100.0%) | 2.63 |
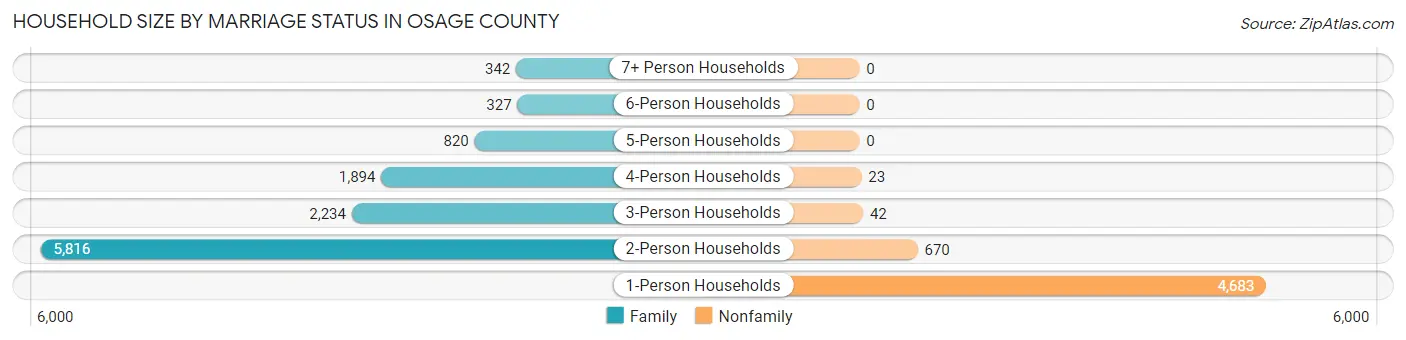
Household Size by Marriage Status in Osage County
Out of a total of 16,851 households in Osage County, 11,433 (67.8%) are family households, while 5,418 (32.2%) are nonfamily households. The most numerous type of family households are 2-person households, comprising 5,816, and the most common type of nonfamily households are 1-person households, comprising 4,683.
| Household Size | Family Households | Nonfamily Households |
| 1-Person Households | - | 4,683 (27.8%) |
| 2-Person Households | 5,816 (34.5%) | 670 (4.0%) |
| 3-Person Households | 2,234 (13.3%) | 42 (0.3%) |
| 4-Person Households | 1,894 (11.2%) | 23 (0.1%) |
| 5-Person Households | 820 (4.9%) | 0 (0.0%) |
| 6-Person Households | 327 (1.9%) | 0 (0.0%) |
| 7+ Person Households | 342 (2.0%) | 0 (0.0%) |
| Total | 11,433 (67.8%) | 5,418 (32.2%) |
Female Fertility in Osage County
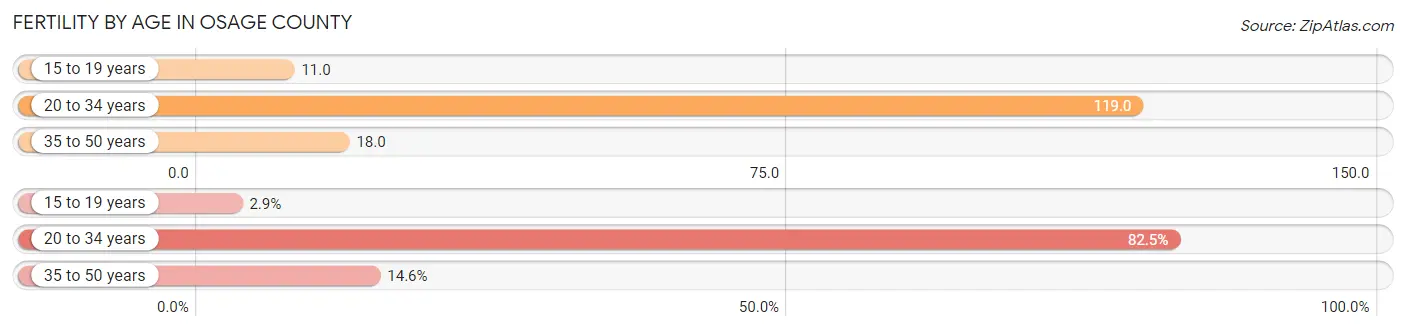
Fertility by Age in Osage County
Average fertility rate in Osage County is 56.0 births per 1,000 women. Women in the age bracket of 20 to 34 years have the highest fertility rate with 119.0 births per 1,000 women. Women in the age bracket of 20 to 34 years acount for 82.5% of all women with births.
| Age Bracket | Women with Births | Births / 1,000 Women |
| 15 to 19 years | 15 (2.9%) | 11.0 |
| 20 to 34 years | 423 (82.5%) | 119.0 |
| 35 to 50 years | 75 (14.6%) | 18.0 |
| Total | 513 (100.0%) | 56.0 |
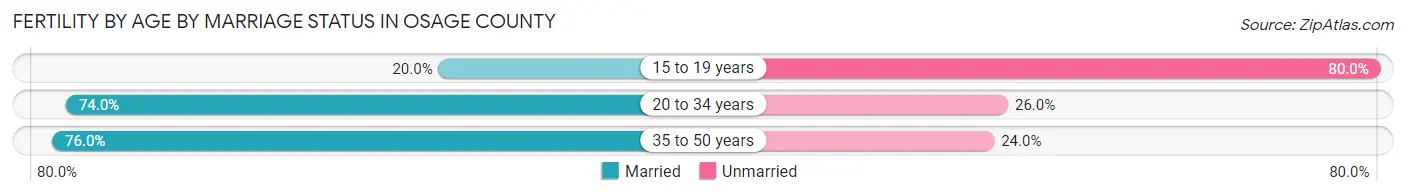
Fertility by Age by Marriage Status in Osage County
72.7% of women with births (513) in Osage County are married. The highest percentage of unmarried women with births falls into 15 to 19 years age bracket with 80.0% of them unmarried at the time of birth, while the lowest percentage of unmarried women with births belong to 35 to 50 years age bracket with 24.0% of them unmarried.
| Age Bracket | Married | Unmarried |
| 15 to 19 years | 3 (20.0%) | 12 (80.0%) |
| 20 to 34 years | 313 (74.0%) | 110 (26.0%) |
| 35 to 50 years | 57 (76.0%) | 18 (24.0%) |
| Total | 373 (72.7%) | 140 (27.3%) |
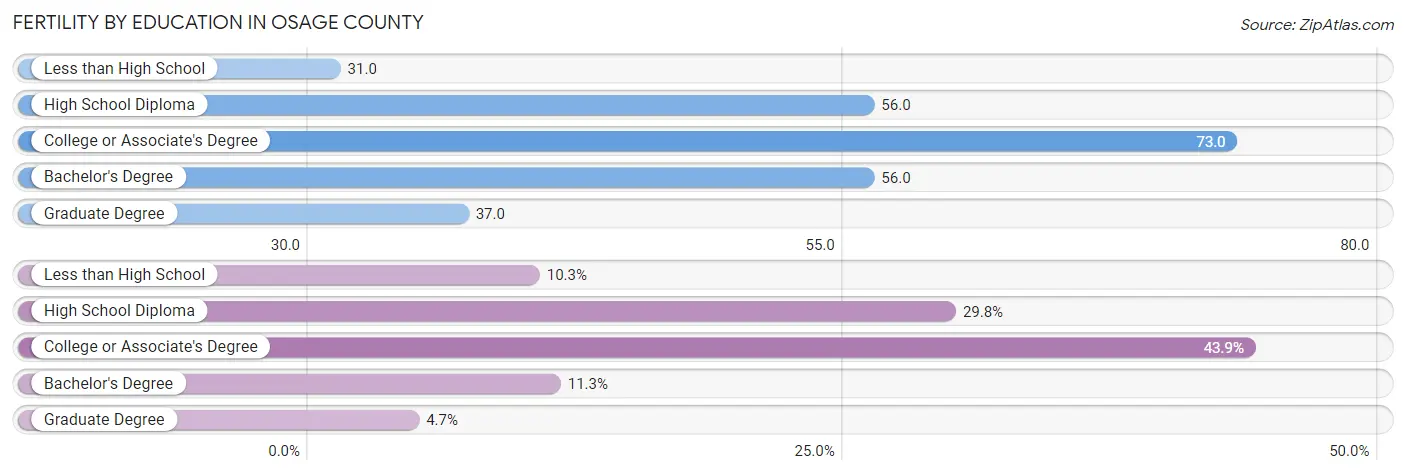
Fertility by Education in Osage County
Average fertility rate in Osage County is 56.0 births per 1,000 women. Women with the education attainment of college or associate's degree have the highest fertility rate of 73.0 births per 1,000 women, while women with the education attainment of less than high school have the lowest fertility at 31.0 births per 1,000 women. Women with the education attainment of college or associate's degree represent 43.9% of all women with births.
| Educational Attainment | Women with Births | Births / 1,000 Women |
| Less than High School | 53 (10.3%) | 31.0 |
| High School Diploma | 153 (29.8%) | 56.0 |
| College or Associate's Degree | 225 (43.9%) | 73.0 |
| Bachelor's Degree | 58 (11.3%) | 56.0 |
| Graduate Degree | 24 (4.7%) | 37.0 |
| Total | 513 (100.0%) | 56.0 |
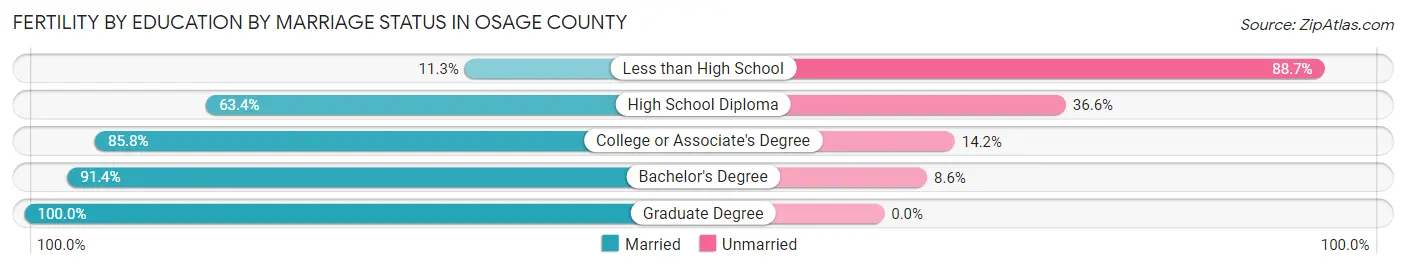
Fertility by Education by Marriage Status in Osage County
27.3% of women with births in Osage County are unmarried. Women with the educational attainment of graduate degree are most likely to be married with 100.0% of them married at childbirth, while women with the educational attainment of less than high school are least likely to be married with 88.7% of them unmarried at childbirth.
| Educational Attainment | Married | Unmarried |
| Less than High School | 6 (11.3%) | 47 (88.7%) |
| High School Diploma | 97 (63.4%) | 56 (36.6%) |
| College or Associate's Degree | 193 (85.8%) | 32 (14.2%) |
| Bachelor's Degree | 53 (91.4%) | 5 (8.6%) |
| Graduate Degree | 24 (100.0%) | 0 (0.0%) |
| Total | 373 (72.7%) | 140 (27.3%) |
Income in Osage County
Income Overview in Osage County
Per Capita Income in Osage County is $29,906, while median incomes of families and households are $73,536 and $58,189 respectively.
| Characteristic | Number | Measure |
| Per Capita Income | 46,004 | $29,906 |
| Median Family Income | 11,433 | $73,536 |
| Mean Family Income | 11,433 | $90,761 |
| Median Household Income | 16,851 | $58,189 |
| Mean Household Income | 16,851 | $76,698 |
| Income Deficit | 11,433 | $11,607 |
| Wage / Income Gap (%) | 46,004 | 32.26% |
| Wage / Income Gap ($) | 46,004 | 67.74¢ per $1 |
| Gini / Inequality Index | 46,004 | 0.43 |
Earnings by Sex in Osage County
Average Earnings in Osage County are $35,330, $43,211 for men and $29,271 for women, a difference of 32.3%.
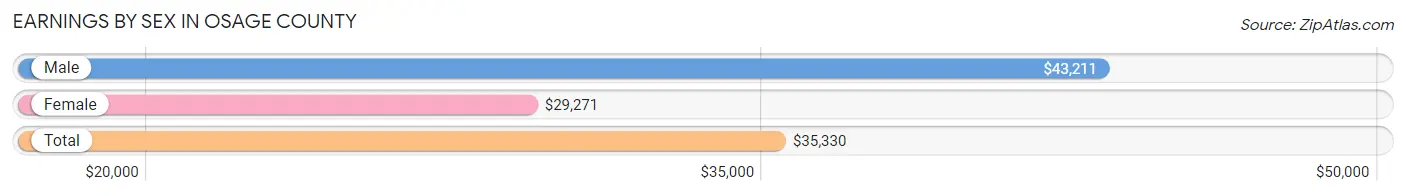
| Sex | Number | Average Earnings |
| Male | 11,094 (51.9%) | $43,211 |
| Female | 10,288 (48.1%) | $29,271 |
| Total | 21,382 (100.0%) | $35,330 |
Earnings by Sex by Income Bracket in Osage County
The most common earnings brackets in Osage County are $100,000+ for men (1,522 | 13.7%) and $30,000 to $34,999 for women (924 | 9.0%).
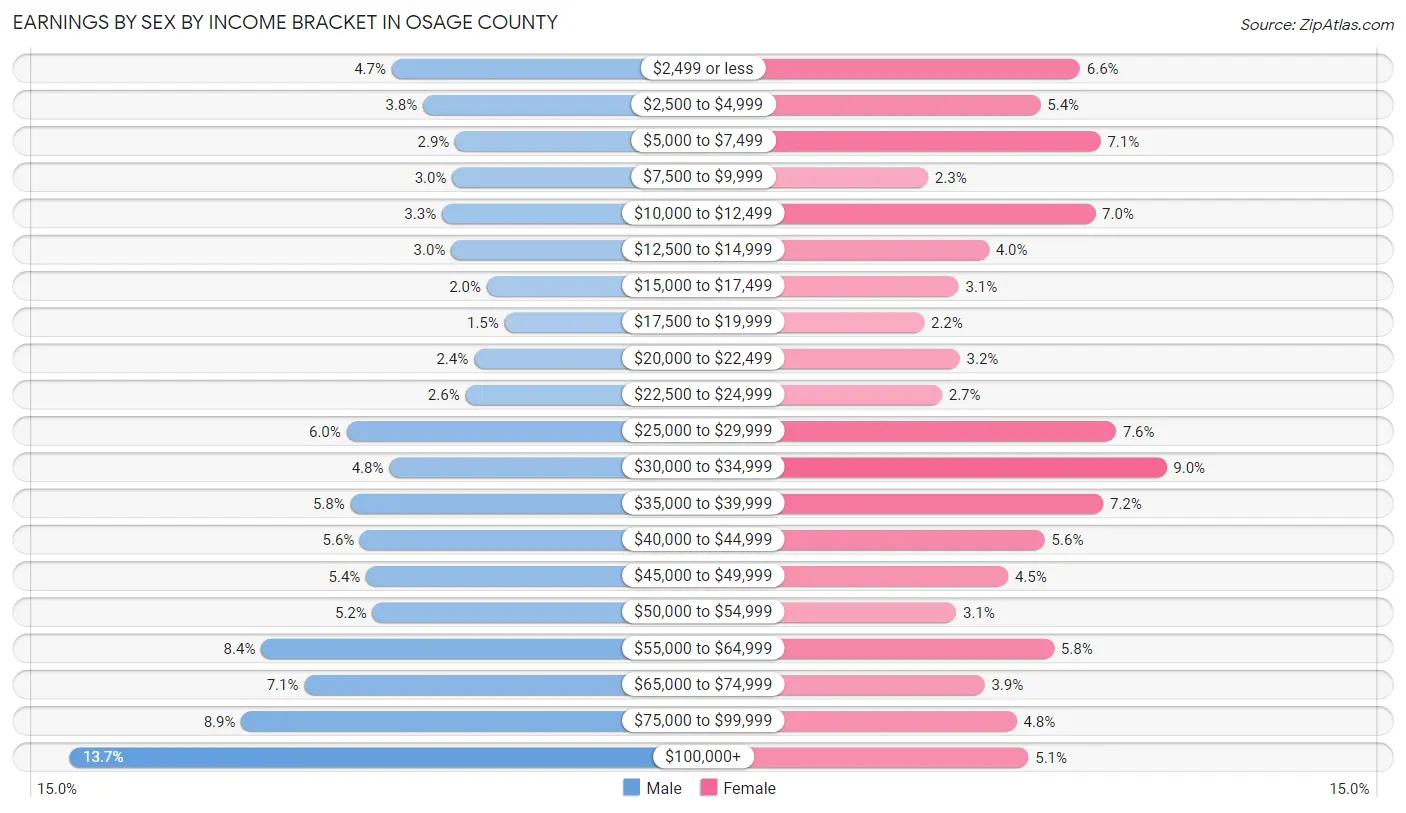
| Income | Male | Female |
| $2,499 or less | 519 (4.7%) | 674 (6.6%) |
| $2,500 to $4,999 | 422 (3.8%) | 560 (5.4%) |
| $5,000 to $7,499 | 322 (2.9%) | 734 (7.1%) |
| $7,500 to $9,999 | 331 (3.0%) | 235 (2.3%) |
| $10,000 to $12,499 | 363 (3.3%) | 718 (7.0%) |
| $12,500 to $14,999 | 334 (3.0%) | 410 (4.0%) |
| $15,000 to $17,499 | 223 (2.0%) | 323 (3.1%) |
| $17,500 to $19,999 | 168 (1.5%) | 223 (2.2%) |
| $20,000 to $22,499 | 263 (2.4%) | 326 (3.2%) |
| $22,500 to $24,999 | 290 (2.6%) | 275 (2.7%) |
| $25,000 to $29,999 | 660 (5.9%) | 778 (7.6%) |
| $30,000 to $34,999 | 527 (4.8%) | 924 (9.0%) |
| $35,000 to $39,999 | 648 (5.8%) | 741 (7.2%) |
| $40,000 to $44,999 | 618 (5.6%) | 572 (5.6%) |
| $45,000 to $49,999 | 599 (5.4%) | 466 (4.5%) |
| $50,000 to $54,999 | 579 (5.2%) | 316 (3.1%) |
| $55,000 to $64,999 | 926 (8.4%) | 599 (5.8%) |
| $65,000 to $74,999 | 792 (7.1%) | 398 (3.9%) |
| $75,000 to $99,999 | 988 (8.9%) | 491 (4.8%) |
| $100,000+ | 1,522 (13.7%) | 525 (5.1%) |
| Total | 11,094 (100.0%) | 10,288 (100.0%) |
Earnings by Sex by Educational Attainment in Osage County
Average earnings in Osage County are $48,866 for men and $32,595 for women, a difference of 33.3%. Men with an educational attainment of graduate degree enjoy the highest average annual earnings of $76,369, while those with less than high school education earn the least with $36,474. Women with an educational attainment of graduate degree earn the most with the average annual earnings of $54,112, while those with less than high school education have the smallest earnings of $15,114.
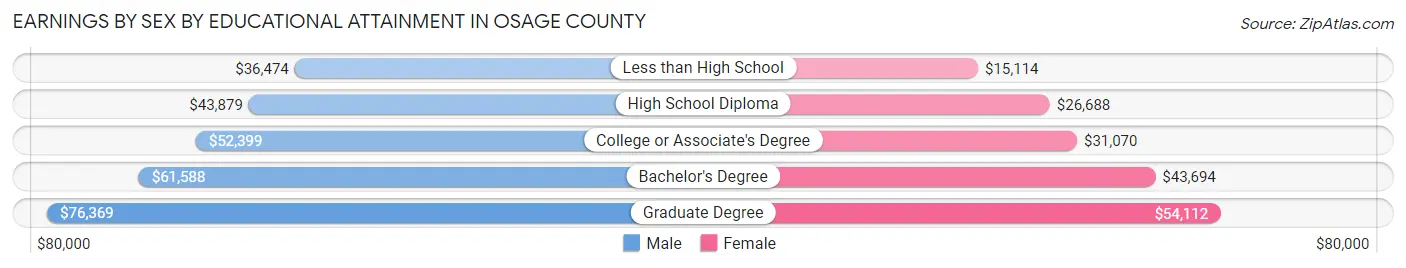
| Educational Attainment | Male Income | Female Income |
| Less than High School | $36,474 | $15,114 |
| High School Diploma | $43,879 | $26,688 |
| College or Associate's Degree | $52,399 | $31,070 |
| Bachelor's Degree | $61,588 | $43,694 |
| Graduate Degree | $76,369 | $54,112 |
| Total | $48,866 | $32,595 |
Family Income in Osage County
Family Income Brackets in Osage County
According to the Osage County family income data, there are 2,309 families falling into the $50,000 to $74,999 income range, which is the most common income bracket and makes up 20.2% of all families. Conversely, the $10,000 to $14,999 income bracket is the least frequent group with only 274 families (2.4%) belonging to this category.
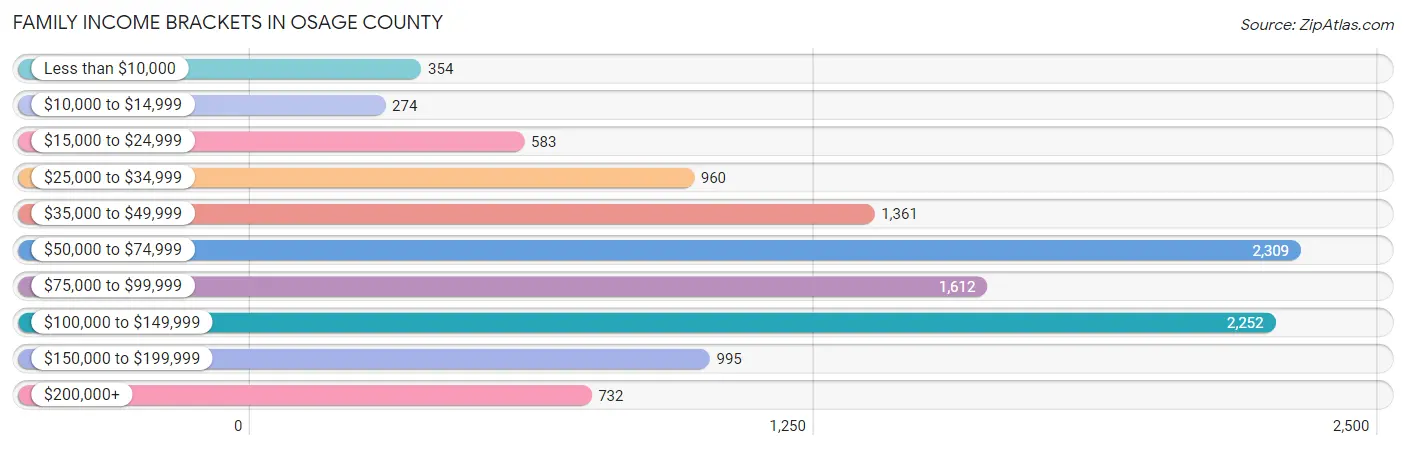
| Income Bracket | # Families | % Families |
| Less than $10,000 | 354 | 3.1% |
| $10,000 to $14,999 | 274 | 2.4% |
| $15,000 to $24,999 | 583 | 5.1% |
| $25,000 to $34,999 | 960 | 8.4% |
| $35,000 to $49,999 | 1,361 | 11.9% |
| $50,000 to $74,999 | 2,309 | 20.2% |
| $75,000 to $99,999 | 1,612 | 14.1% |
| $100,000 to $149,999 | 2,252 | 19.7% |
| $150,000 to $199,999 | 995 | 8.7% |
| $200,000+ | 732 | 6.4% |
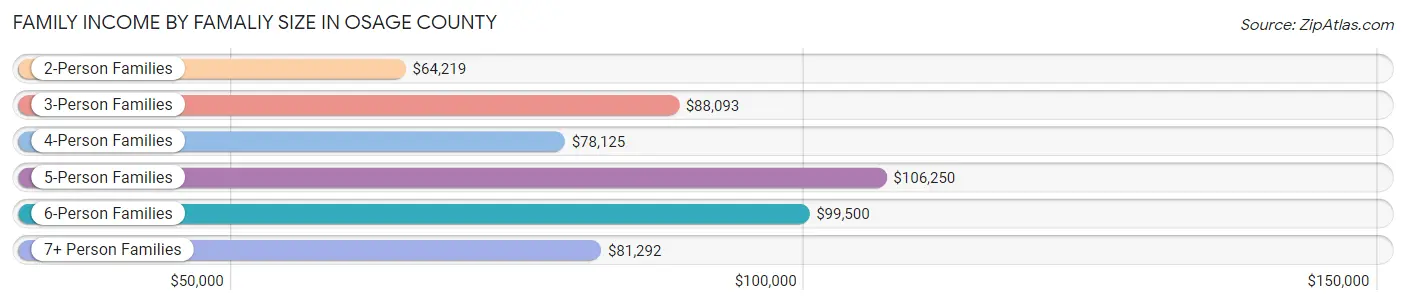
Family Income by Famaliy Size in Osage County
5-person families (780 | 6.8%) account for the highest median family income in Osage County with $106,250 per family, while 2-person families (6,017 | 52.6%) have the highest median income of $32,110 per family member.
| Income Bracket | # Families | Median Income |
| 2-Person Families | 6,017 (52.6%) | $64,219 |
| 3-Person Families | 2,263 (19.8%) | $88,093 |
| 4-Person Families | 1,764 (15.4%) | $78,125 |
| 5-Person Families | 780 (6.8%) | $106,250 |
| 6-Person Families | 330 (2.9%) | $99,500 |
| 7+ Person Families | 279 (2.4%) | $81,292 |
| Total | 11,433 (100.0%) | $73,536 |
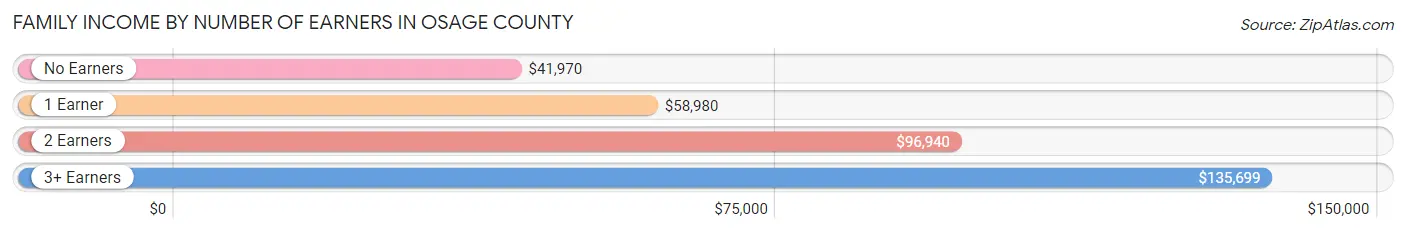
Family Income by Number of Earners in Osage County
The median family income in Osage County is $73,536, with families comprising 3+ earners (1,071) having the highest median family income of $135,699, while families with no earners (2,247) have the lowest median family income of $41,970, accounting for 9.4% and 19.7% of families, respectively.
| Number of Earners | # Families | Median Income |
| No Earners | 2,247 (19.7%) | $41,970 |
| 1 Earner | 3,602 (31.5%) | $58,980 |
| 2 Earners | 4,513 (39.5%) | $96,940 |
| 3+ Earners | 1,071 (9.4%) | $135,699 |
| Total | 11,433 (100.0%) | $73,536 |
Household Income in Osage County
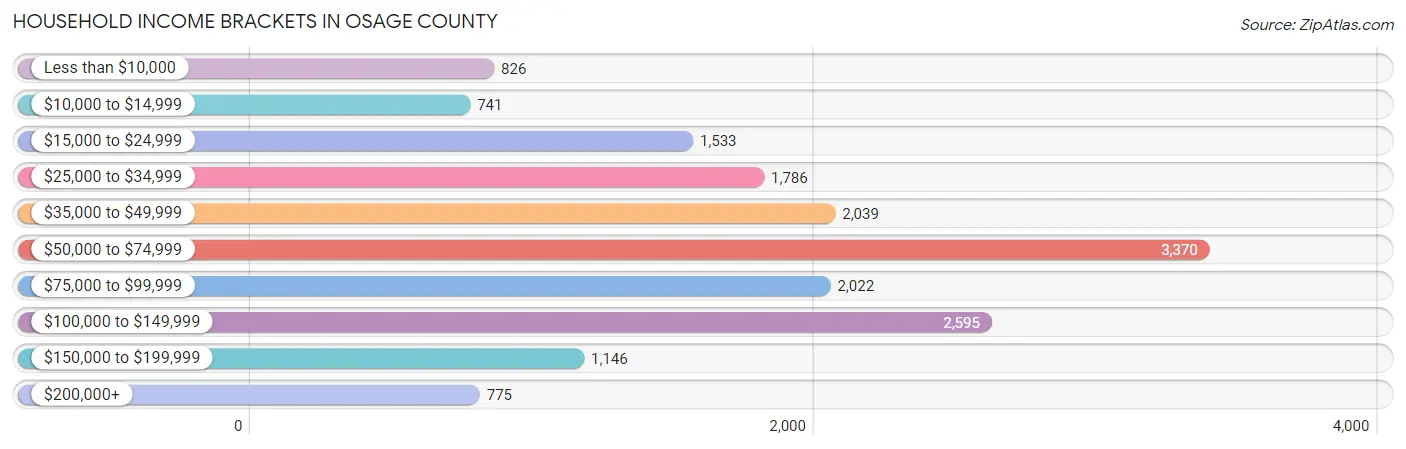
Household Income Brackets in Osage County
With 3,370 households falling in the category, the $50,000 to $74,999 income range is the most frequent in Osage County, accounting for 20.0% of all households. In contrast, only 741 households (4.4%) fall into the $10,000 to $14,999 income bracket, making it the least populous group.
| Income Bracket | # Households | % Households |
| Less than $10,000 | 826 | 4.9% |
| $10,000 to $14,999 | 741 | 4.4% |
| $15,000 to $24,999 | 1,533 | 9.1% |
| $25,000 to $34,999 | 1,786 | 10.6% |
| $35,000 to $49,999 | 2,039 | 12.1% |
| $50,000 to $74,999 | 3,370 | 20.0% |
| $75,000 to $99,999 | 2,022 | 12.0% |
| $100,000 to $149,999 | 2,595 | 15.4% |
| $150,000 to $199,999 | 1,146 | 6.8% |
| $200,000+ | 775 | 4.6% |
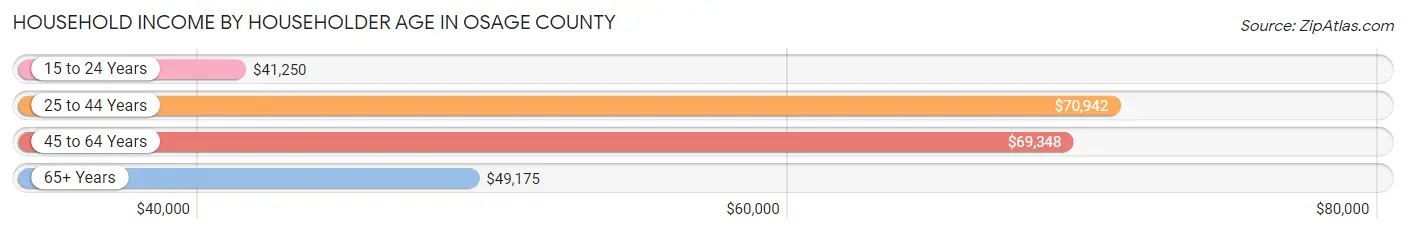
Household Income by Householder Age in Osage County
The median household income in Osage County is $58,189, with the highest median household income of $70,942 found in the 25 to 44 years age bracket for the primary householder. A total of 4,271 households (25.4%) fall into this category. Meanwhile, the 15 to 24 years age bracket for the primary householder has the lowest median household income of $41,250, with 507 households (3.0%) in this group.
| Income Bracket | # Households | Median Income |
| 15 to 24 Years | 507 (3.0%) | $41,250 |
| 25 to 44 Years | 4,271 (25.4%) | $70,942 |
| 45 to 64 Years | 6,341 (37.6%) | $69,348 |
| 65+ Years | 5,732 (34.0%) | $49,175 |
| Total | 16,851 (100.0%) | $58,189 |
Poverty in Osage County
Income Below Poverty by Sex and Age in Osage County
With 12.1% poverty level for males and 13.0% for females among the residents of Osage County, under 5 year old males and 15 year old females are the most vulnerable to poverty, with 376 males (31.7%) and 81 females (24.0%) in their respective age groups living below the poverty level.
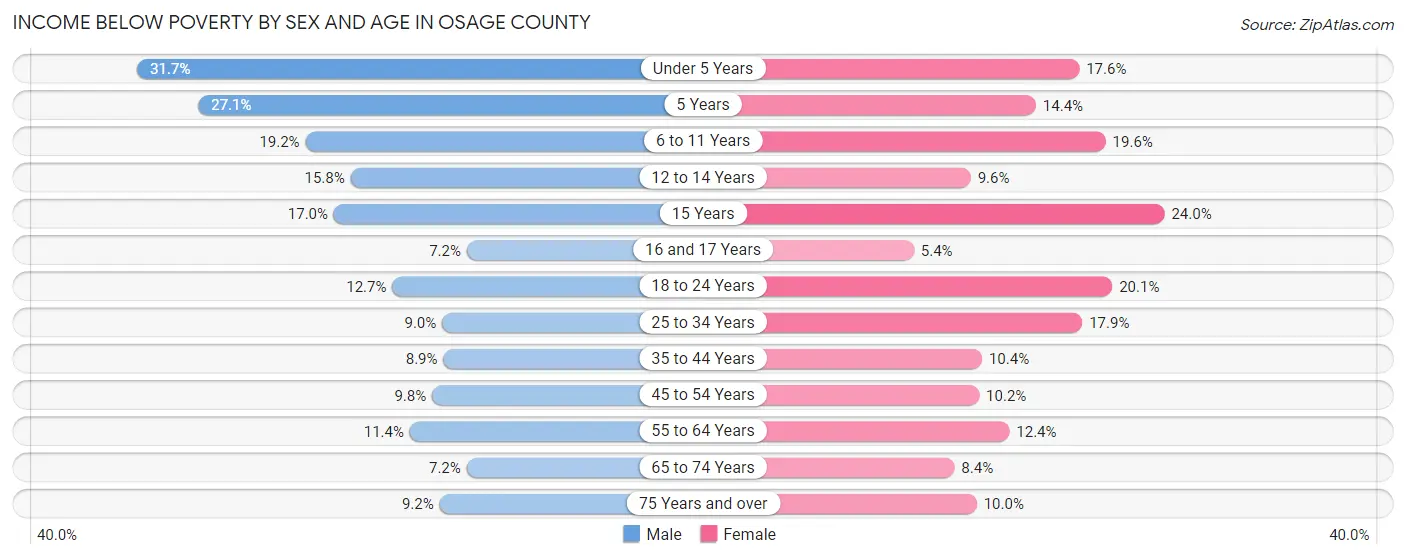
| Age Bracket | Male | Female |
| Under 5 Years | 376 (31.7%) | 189 (17.6%) |
| 5 Years | 74 (27.1%) | 33 (14.4%) |
| 6 to 11 Years | 320 (19.2%) | 315 (19.6%) |
| 12 to 14 Years | 125 (15.8%) | 82 (9.6%) |
| 15 Years | 38 (17.0%) | 81 (24.0%) |
| 16 and 17 Years | 52 (7.2%) | 30 (5.3%) |
| 18 to 24 Years | 245 (12.7%) | 311 (20.1%) |
| 25 to 34 Years | 214 (9.0%) | 444 (17.8%) |
| 35 to 44 Years | 223 (8.9%) | 278 (10.4%) |
| 45 to 54 Years | 268 (9.8%) | 279 (10.2%) |
| 55 to 64 Years | 344 (11.4%) | 438 (12.4%) |
| 65 to 74 Years | 179 (7.2%) | 241 (8.4%) |
| 75 Years and over | 163 (9.2%) | 206 (10.0%) |
| Total | 2,621 (12.1%) | 2,927 (13.0%) |
Income Above Poverty by Sex and Age in Osage County
According to the poverty statistics in Osage County, males aged 16 and 17 years and females aged 16 and 17 years are the age groups that are most secure financially, with 92.8% of males and 94.7% of females in these age groups living above the poverty line.
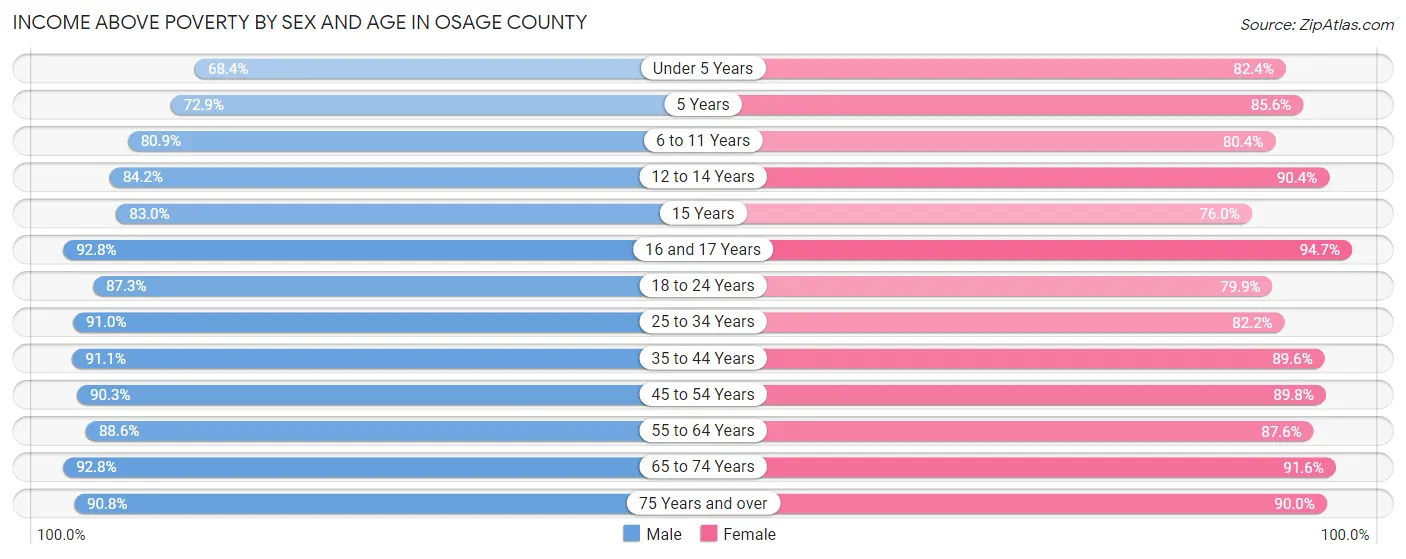
| Age Bracket | Male | Female |
| Under 5 Years | 812 (68.3%) | 883 (82.4%) |
| 5 Years | 199 (72.9%) | 196 (85.6%) |
| 6 to 11 Years | 1,351 (80.8%) | 1,293 (80.4%) |
| 12 to 14 Years | 666 (84.2%) | 775 (90.4%) |
| 15 Years | 185 (83.0%) | 257 (76.0%) |
| 16 and 17 Years | 673 (92.8%) | 531 (94.7%) |
| 18 to 24 Years | 1,684 (87.3%) | 1,238 (79.9%) |
| 25 to 34 Years | 2,164 (91.0%) | 2,043 (82.2%) |
| 35 to 44 Years | 2,281 (91.1%) | 2,392 (89.6%) |
| 45 to 54 Years | 2,482 (90.2%) | 2,455 (89.8%) |
| 55 to 64 Years | 2,673 (88.6%) | 3,082 (87.6%) |
| 65 to 74 Years | 2,314 (92.8%) | 2,642 (91.6%) |
| 75 Years and over | 1,610 (90.8%) | 1,849 (90.0%) |
| Total | 19,094 (87.9%) | 19,636 (87.0%) |
Income Below Poverty Among Married-Couple Families in Osage County
The poverty statistics for married-couple families in Osage County show that 5.5% or 500 of the total 9,060 families live below the poverty line. Families with 5 or more children have the highest poverty rate of 13.9%, comprising of 9 families. On the other hand, families with no children have the lowest poverty rate of 4.8%, which includes 285 families.
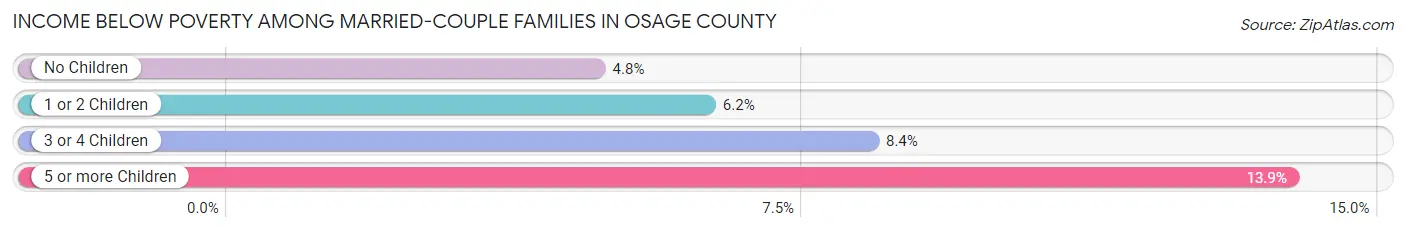
| Children | Above Poverty | Below Poverty |
| No Children | 5,647 (95.2%) | 285 (4.8%) |
| 1 or 2 Children | 2,222 (93.8%) | 148 (6.2%) |
| 3 or 4 Children | 635 (91.6%) | 58 (8.4%) |
| 5 or more Children | 56 (86.2%) | 9 (13.9%) |
| Total | 8,560 (94.5%) | 500 (5.5%) |
Income Below Poverty Among Single-Parent Households in Osage County
According to the poverty data in Osage County, 15.2% or 97 single-father households and 22.8% or 396 single-mother households are living below the poverty line. Among single-father households, those with 5 or more children have the highest poverty rate, with 6 households (50.0%) experiencing poverty. Likewise, among single-mother households, those with 5 or more children have the highest poverty rate, with 33 households (100.0%) falling below the poverty line.
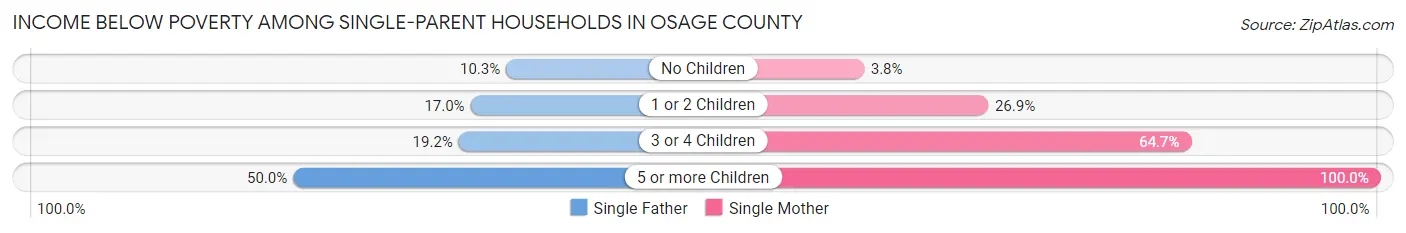
| Children | Single Father | Single Mother |
| No Children | 25 (10.3%) | 26 (3.7%) |
| 1 or 2 Children | 57 (17.0%) | 225 (26.9%) |
| 3 or 4 Children | 9 (19.2%) | 112 (64.7%) |
| 5 or more Children | 6 (50.0%) | 33 (100.0%) |
| Total | 97 (15.2%) | 396 (22.8%) |
Income Below Poverty Among Married-Couple vs Single-Parent Households in Osage County
The poverty data for Osage County shows that 500 of the married-couple family households (5.5%) and 493 of the single-parent households (20.8%) are living below the poverty level. Within the married-couple family households, those with 5 or more children have the highest poverty rate, with 9 households (13.9%) falling below the poverty line. Among the single-parent households, those with 5 or more children have the highest poverty rate, with 39 household (86.7%) living below poverty.

| Children | Married-Couple Families | Single-Parent Households |
| No Children | 285 (4.8%) | 51 (5.4%) |
| 1 or 2 Children | 148 (6.2%) | 282 (24.0%) |
| 3 or 4 Children | 58 (8.4%) | 121 (55.0%) |
| 5 or more Children | 9 (13.9%) | 39 (86.7%) |
| Total | 500 (5.5%) | 493 (20.8%) |
Employment Characteristics in Osage County
Employment by Class of Employer in Osage County
Among the 18,825 employed individuals in Osage County, private company employees (12,488 | 66.3%), local government employees (1,526 | 8.1%), and self-employed (not incorporated) (1,463 | 7.8%) make up the most common classes of employment.
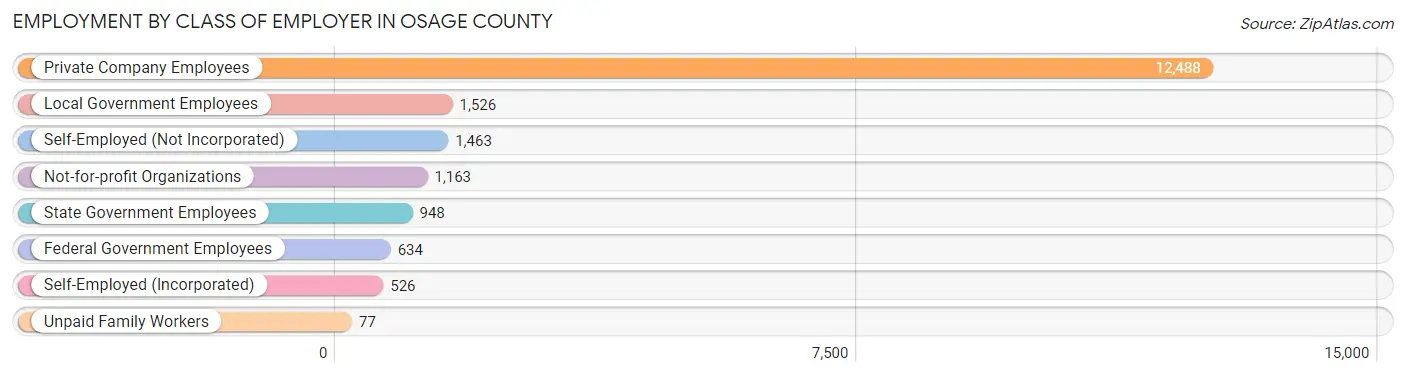
| Employer Class | # Employees | % Employees |
| Private Company Employees | 12,488 | 66.3% |
| Self-Employed (Incorporated) | 526 | 2.8% |
| Self-Employed (Not Incorporated) | 1,463 | 7.8% |
| Not-for-profit Organizations | 1,163 | 6.2% |
| Local Government Employees | 1,526 | 8.1% |
| State Government Employees | 948 | 5.0% |
| Federal Government Employees | 634 | 3.4% |
| Unpaid Family Workers | 77 | 0.4% |
| Total | 18,825 | 100.0% |
Employment Status by Age in Osage County
According to the labor force statistics for Osage County, out of the total population over 16 years of age (37,543), 54.2% or 20,348 individuals are in the labor force, with 5.6% or 1,139 of them unemployed. The age group with the highest labor force participation rate is 20 to 24 years, with 76.2% or 1,860 individuals in the labor force. Within the labor force, the 16 to 19 years age range has the highest percentage of unemployed individuals, with 15.7% or 141 of them being unemployed.
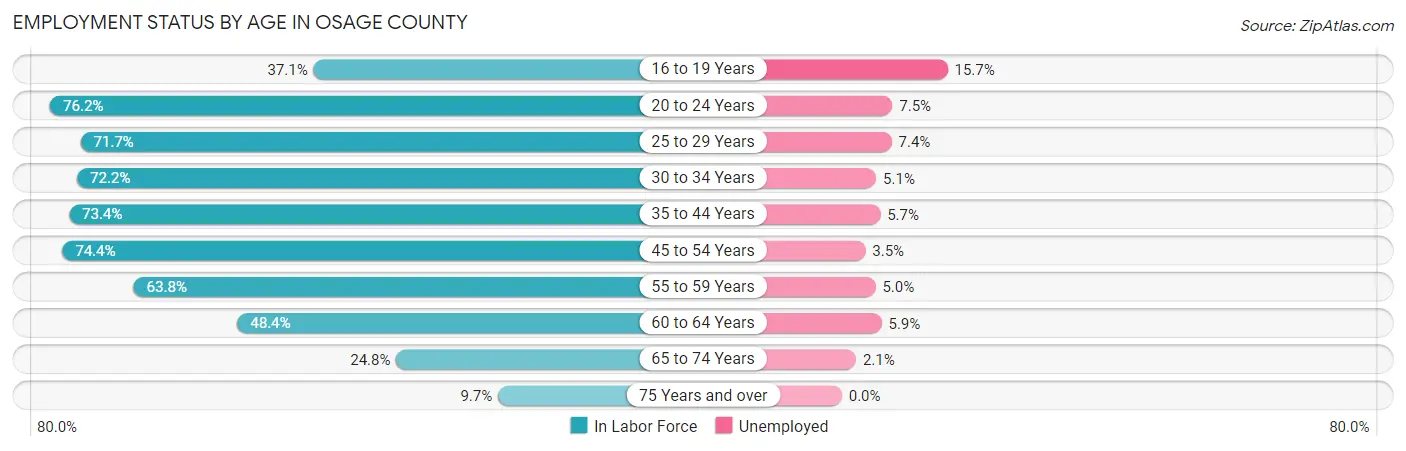
| Age Bracket | In Labor Force | Unemployed |
| 16 to 19 Years | 898 (37.1%) | 141 (15.7%) |
| 20 to 24 Years | 1,860 (76.2%) | 140 (7.5%) |
| 25 to 29 Years | 1,927 (71.7%) | 143 (7.4%) |
| 30 to 34 Years | 1,821 (72.2%) | 93 (5.1%) |
| 35 to 44 Years | 4,036 (73.4%) | 230 (5.7%) |
| 45 to 54 Years | 4,192 (74.4%) | 147 (3.5%) |
| 55 to 59 Years | 2,106 (63.8%) | 105 (5.0%) |
| 60 to 64 Years | 1,755 (48.4%) | 104 (5.9%) |
| 65 to 74 Years | 1,357 (24.8%) | 28 (2.1%) |
| 75 Years and over | 382 (9.7%) | 0 (0.0%) |
| Total | 20,348 (54.2%) | 1,139 (5.6%) |
Employment Status by Educational Attainment in Osage County
According to labor force statistics for Osage County, 68.1% of individuals (15,848) out of the total population between 25 and 64 years of age (23,271) are in the labor force, with 5.2% or 824 of them being unemployed. The group with the highest labor force participation rate are those with the educational attainment of bachelor's degree or higher, with 84.0% or 4,021 individuals in the labor force. Within the labor force, individuals with less than high school education have the highest percentage of unemployment, with 13.6% or 142 of them being unemployed.
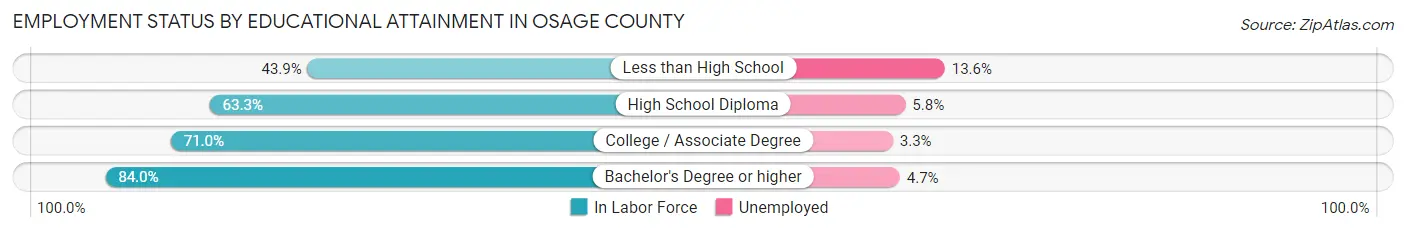
| Educational Attainment | In Labor Force | Unemployed |
| Less than High School | 1,043 (43.9%) | 323 (13.6%) |
| High School Diploma | 5,482 (63.3%) | 502 (5.8%) |
| College / Associate Degree | 5,288 (71.0%) | 246 (3.3%) |
| Bachelor's Degree or higher | 4,021 (84.0%) | 225 (4.7%) |
| Total | 15,848 (68.1%) | 1,210 (5.2%) |
Employment Occupations by Sex in Osage County
Management, Business, Science and Arts Occupations
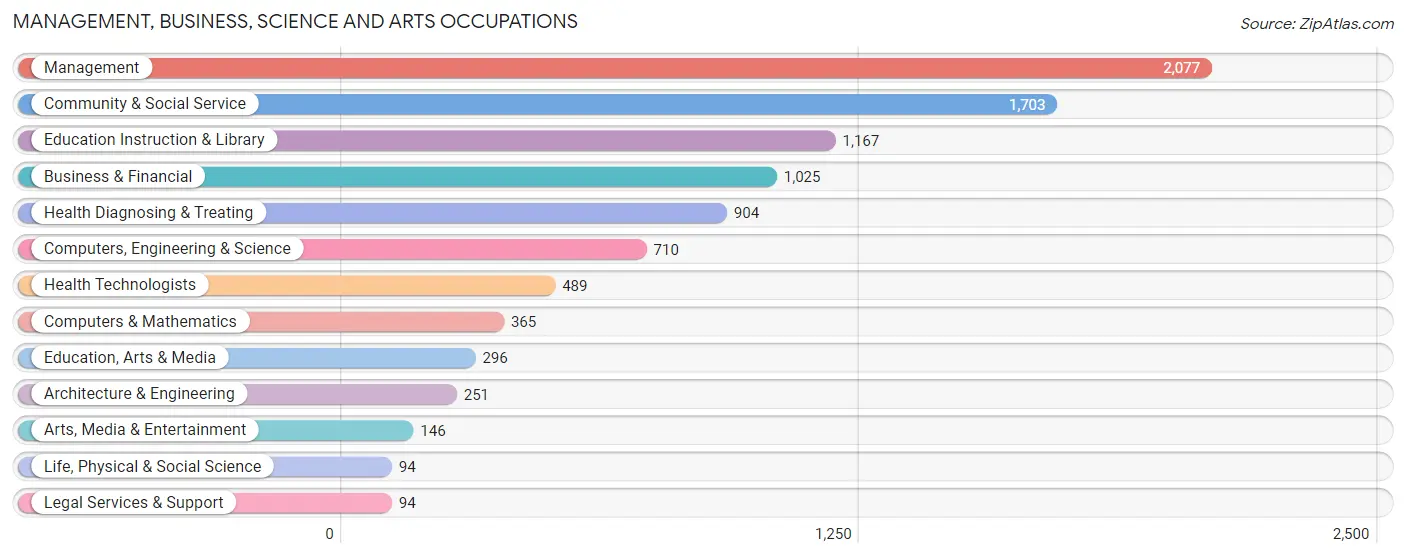
The most common Management, Business, Science and Arts occupations in Osage County are Management (2,077 | 10.8%), Community & Social Service (1,703 | 8.9%), Education Instruction & Library (1,167 | 6.1%), Business & Financial (1,025 | 5.3%), and Health Diagnosing & Treating (904 | 4.7%).
Management, Business, Science and Arts Occupations by Sex
Within the Management, Business, Science and Arts occupations in Osage County, the most male-oriented occupations are Architecture & Engineering (88.0%), Computers, Engineering & Science (74.2%), and Computers & Mathematics (72.6%), while the most female-oriented occupations are Health Diagnosing & Treating (85.4%), Health Technologists (84.9%), and Education Instruction & Library (72.2%).
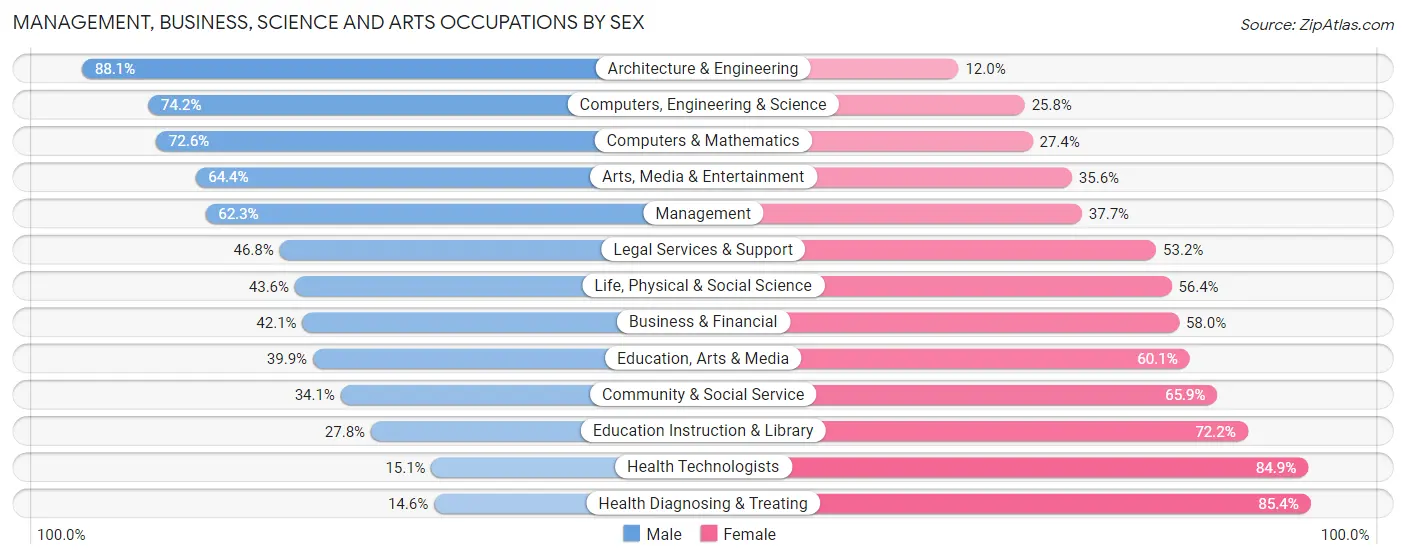
| Occupation | Male | Female |
| Management | 1,294 (62.3%) | 783 (37.7%) |
| Business & Financial | 431 (42.0%) | 594 (58.0%) |
| Computers, Engineering & Science | 527 (74.2%) | 183 (25.8%) |
| Computers & Mathematics | 265 (72.6%) | 100 (27.4%) |
| Architecture & Engineering | 221 (88.0%) | 30 (11.9%) |
| Life, Physical & Social Science | 41 (43.6%) | 53 (56.4%) |
| Community & Social Service | 580 (34.1%) | 1,123 (65.9%) |
| Education, Arts & Media | 118 (39.9%) | 178 (60.1%) |
| Legal Services & Support | 44 (46.8%) | 50 (53.2%) |
| Education Instruction & Library | 324 (27.8%) | 843 (72.2%) |
| Arts, Media & Entertainment | 94 (64.4%) | 52 (35.6%) |
| Health Diagnosing & Treating | 132 (14.6%) | 772 (85.4%) |
| Health Technologists | 74 (15.1%) | 415 (84.9%) |
| Total (Category) | 2,964 (46.2%) | 3,455 (53.8%) |
| Total (Overall) | 10,016 (52.2%) | 9,156 (47.8%) |
Services Occupations
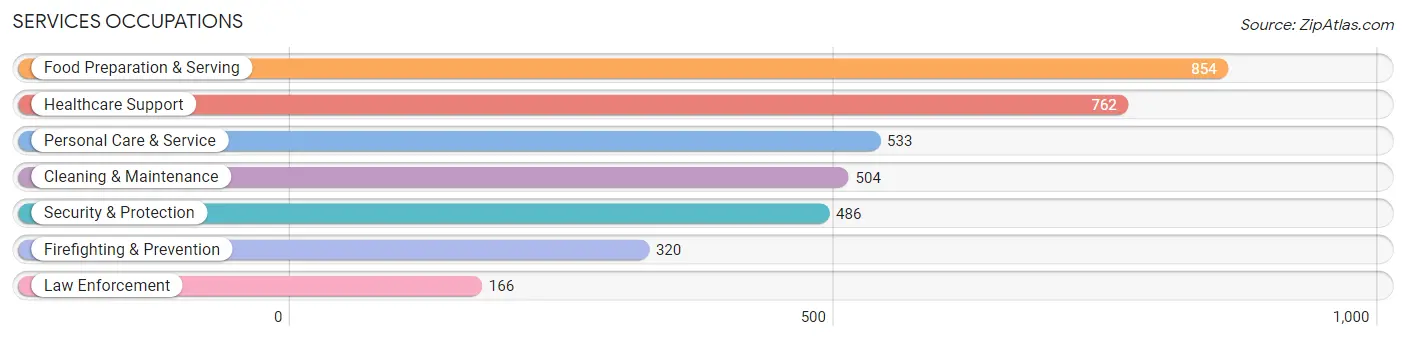
The most common Services occupations in Osage County are Food Preparation & Serving (854 | 4.4%), Healthcare Support (762 | 4.0%), Personal Care & Service (533 | 2.8%), Cleaning & Maintenance (504 | 2.6%), and Security & Protection (486 | 2.5%).
Services Occupations by Sex
Within the Services occupations in Osage County, the most male-oriented occupations are Law Enforcement (85.5%), Security & Protection (78.2%), and Firefighting & Prevention (74.4%), while the most female-oriented occupations are Healthcare Support (89.6%), Personal Care & Service (86.1%), and Food Preparation & Serving (49.1%).
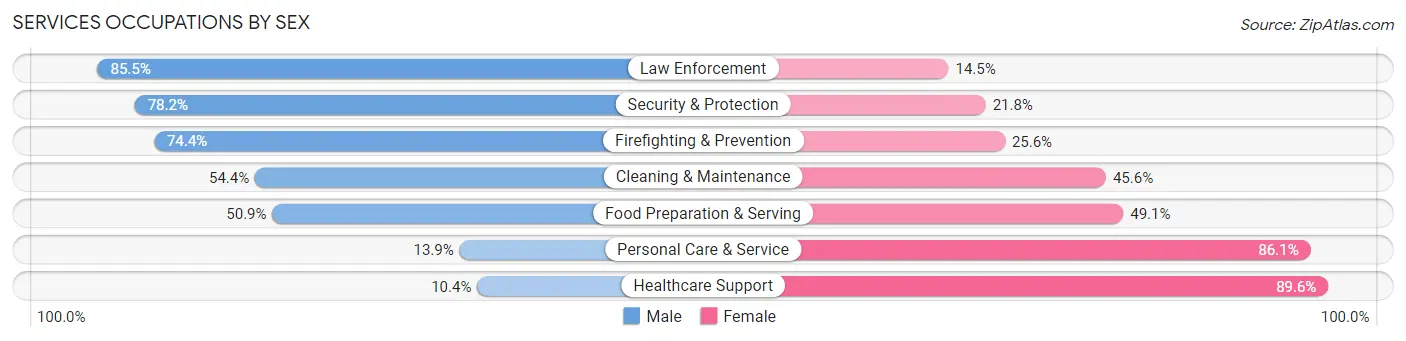
| Occupation | Male | Female |
| Healthcare Support | 79 (10.4%) | 683 (89.6%) |
| Security & Protection | 380 (78.2%) | 106 (21.8%) |
| Firefighting & Prevention | 238 (74.4%) | 82 (25.6%) |
| Law Enforcement | 142 (85.5%) | 24 (14.5%) |
| Food Preparation & Serving | 435 (50.9%) | 419 (49.1%) |
| Cleaning & Maintenance | 274 (54.4%) | 230 (45.6%) |
| Personal Care & Service | 74 (13.9%) | 459 (86.1%) |
| Total (Category) | 1,242 (39.6%) | 1,897 (60.4%) |
| Total (Overall) | 10,016 (52.2%) | 9,156 (47.8%) |
Sales and Office Occupations
The most common Sales and Office occupations in Osage County are Office & Administration (2,515 | 13.1%), and Sales & Related (1,943 | 10.1%).

Sales and Office Occupations by Sex

| Occupation | Male | Female |
| Sales & Related | 870 (44.8%) | 1,073 (55.2%) |
| Office & Administration | 433 (17.2%) | 2,082 (82.8%) |
| Total (Category) | 1,303 (29.2%) | 3,155 (70.8%) |
| Total (Overall) | 10,016 (52.2%) | 9,156 (47.8%) |
Natural Resources, Construction and Maintenance Occupations
The most common Natural Resources, Construction and Maintenance occupations in Osage County are Construction & Extraction (1,186 | 6.2%), Installation, Maintenance & Repair (898 | 4.7%), and Farming, Fishing & Forestry (122 | 0.6%).

Natural Resources, Construction and Maintenance Occupations by Sex
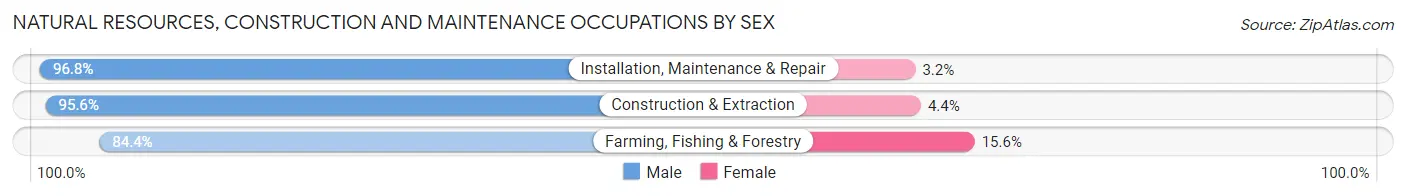
| Occupation | Male | Female |
| Farming, Fishing & Forestry | 103 (84.4%) | 19 (15.6%) |
| Construction & Extraction | 1,134 (95.6%) | 52 (4.4%) |
| Installation, Maintenance & Repair | 869 (96.8%) | 29 (3.2%) |
| Total (Category) | 2,106 (95.5%) | 100 (4.5%) |
| Total (Overall) | 10,016 (52.2%) | 9,156 (47.8%) |
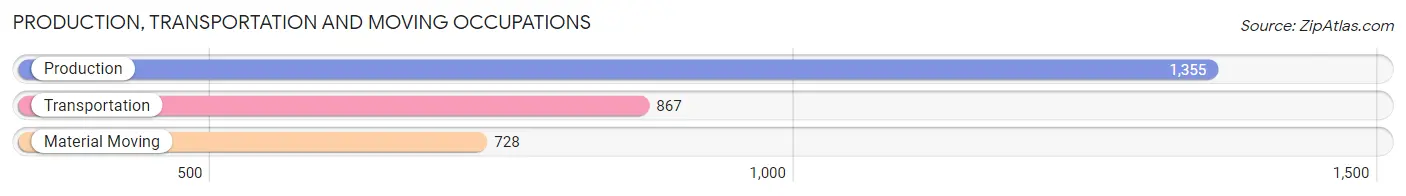
Production, Transportation and Moving Occupations
The most common Production, Transportation and Moving occupations in Osage County are Production (1,355 | 7.1%), Transportation (867 | 4.5%), and Material Moving (728 | 3.8%).
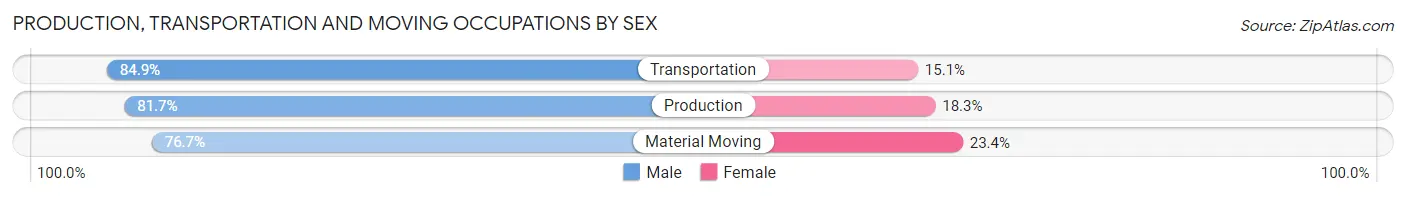
Production, Transportation and Moving Occupations by Sex
| Occupation | Male | Female |
| Production | 1,107 (81.7%) | 248 (18.3%) |
| Transportation | 736 (84.9%) | 131 (15.1%) |
| Material Moving | 558 (76.6%) | 170 (23.4%) |
| Total (Category) | 2,401 (81.4%) | 549 (18.6%) |
| Total (Overall) | 10,016 (52.2%) | 9,156 (47.8%) |
Employment Industries by Sex in Osage County
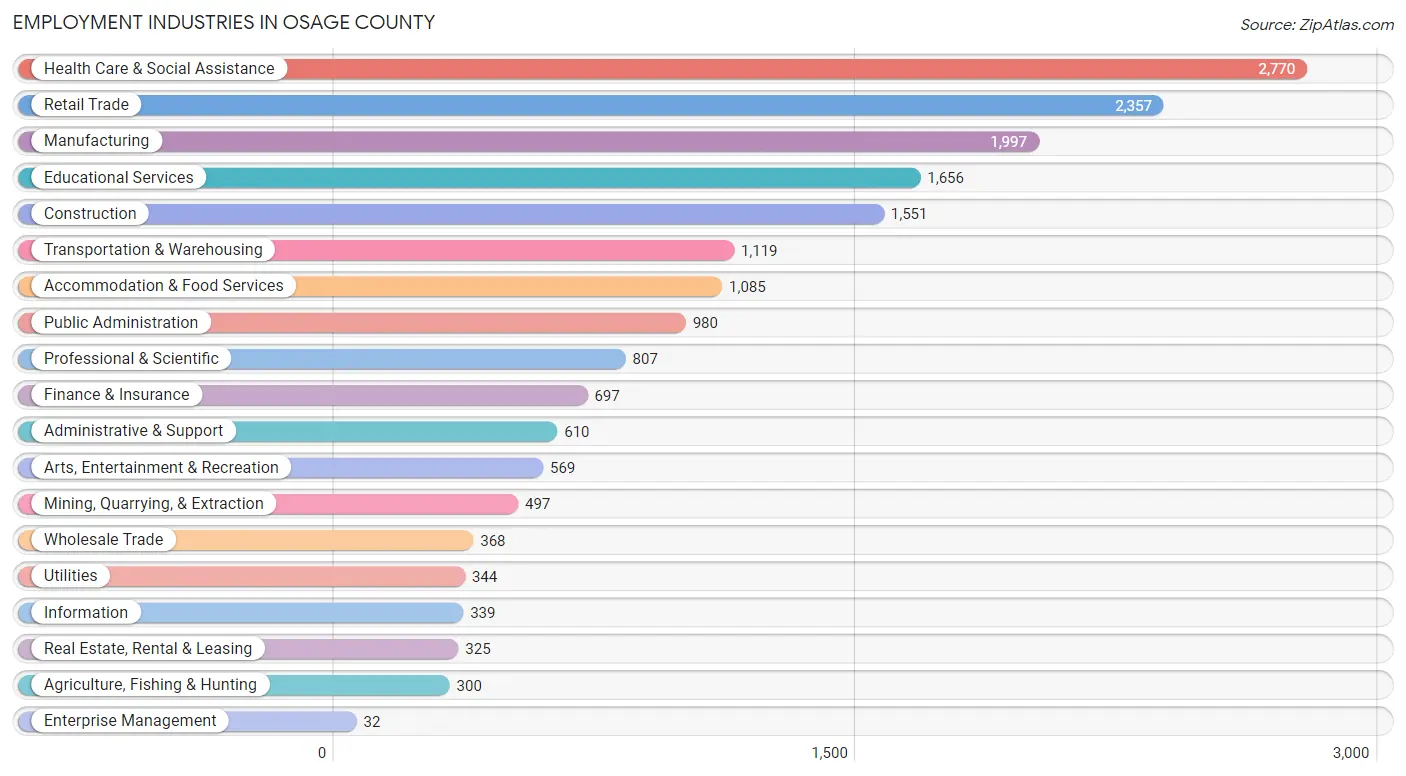
Employment Industries in Osage County
The major employment industries in Osage County include Health Care & Social Assistance (2,770 | 14.4%), Retail Trade (2,357 | 12.3%), Manufacturing (1,997 | 10.4%), Educational Services (1,656 | 8.6%), and Construction (1,551 | 8.1%).
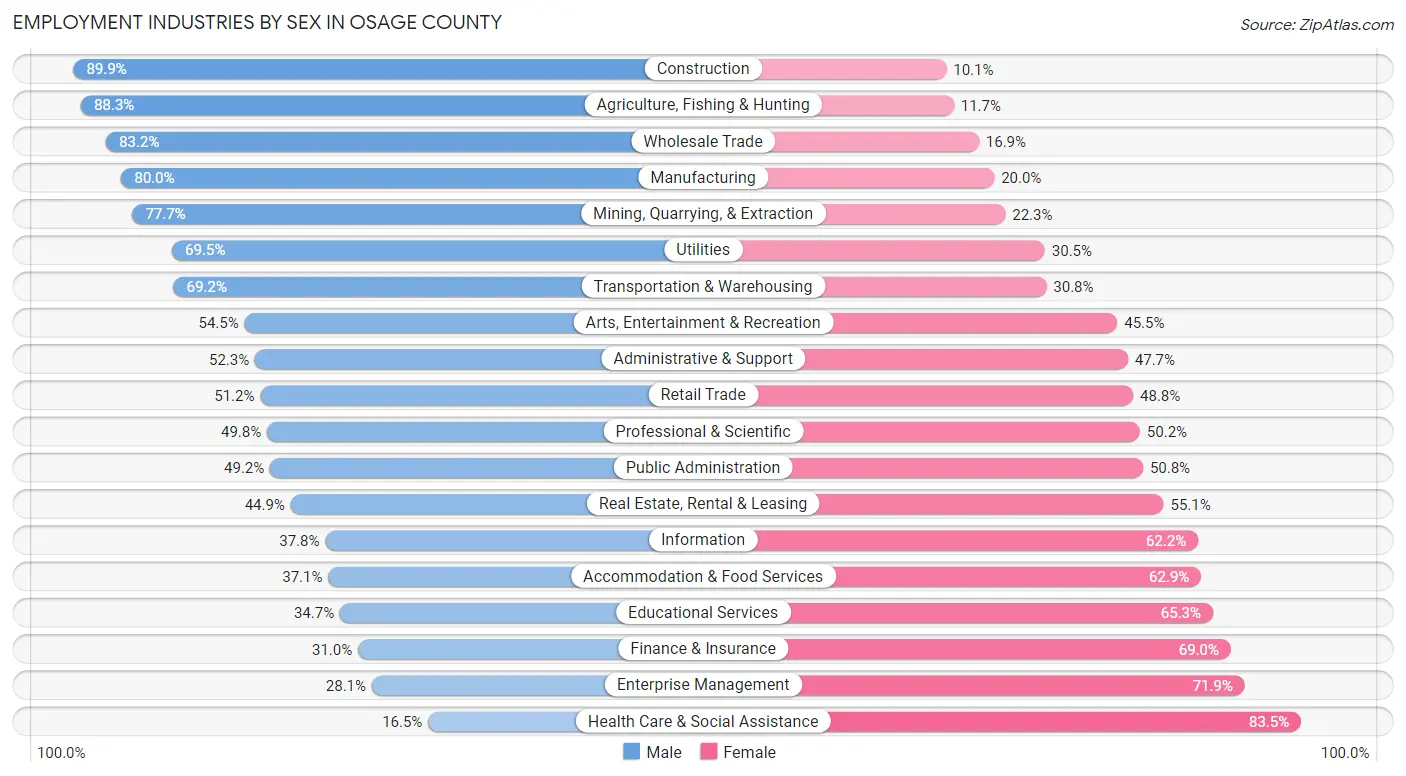
Employment Industries by Sex in Osage County
The Osage County industries that see more men than women are Construction (89.9%), Agriculture, Fishing & Hunting (88.3%), and Wholesale Trade (83.2%), whereas the industries that tend to have a higher number of women are Health Care & Social Assistance (83.5%), Enterprise Management (71.9%), and Finance & Insurance (69.0%).
| Industry | Male | Female |
| Agriculture, Fishing & Hunting | 265 (88.3%) | 35 (11.7%) |
| Mining, Quarrying, & Extraction | 386 (77.7%) | 111 (22.3%) |
| Construction | 1,394 (89.9%) | 157 (10.1%) |
| Manufacturing | 1,597 (80.0%) | 400 (20.0%) |
| Wholesale Trade | 306 (83.2%) | 62 (16.9%) |
| Retail Trade | 1,207 (51.2%) | 1,150 (48.8%) |
| Transportation & Warehousing | 774 (69.2%) | 345 (30.8%) |
| Utilities | 239 (69.5%) | 105 (30.5%) |
| Information | 128 (37.8%) | 211 (62.2%) |
| Finance & Insurance | 216 (31.0%) | 481 (69.0%) |
| Real Estate, Rental & Leasing | 146 (44.9%) | 179 (55.1%) |
| Professional & Scientific | 402 (49.8%) | 405 (50.2%) |
| Enterprise Management | 9 (28.1%) | 23 (71.9%) |
| Administrative & Support | 319 (52.3%) | 291 (47.7%) |
| Educational Services | 575 (34.7%) | 1,081 (65.3%) |
| Health Care & Social Assistance | 456 (16.5%) | 2,314 (83.5%) |
| Arts, Entertainment & Recreation | 310 (54.5%) | 259 (45.5%) |
| Accommodation & Food Services | 403 (37.1%) | 682 (62.9%) |
| Public Administration | 482 (49.2%) | 498 (50.8%) |
| Total | 10,016 (52.2%) | 9,156 (47.8%) |
Education in Osage County
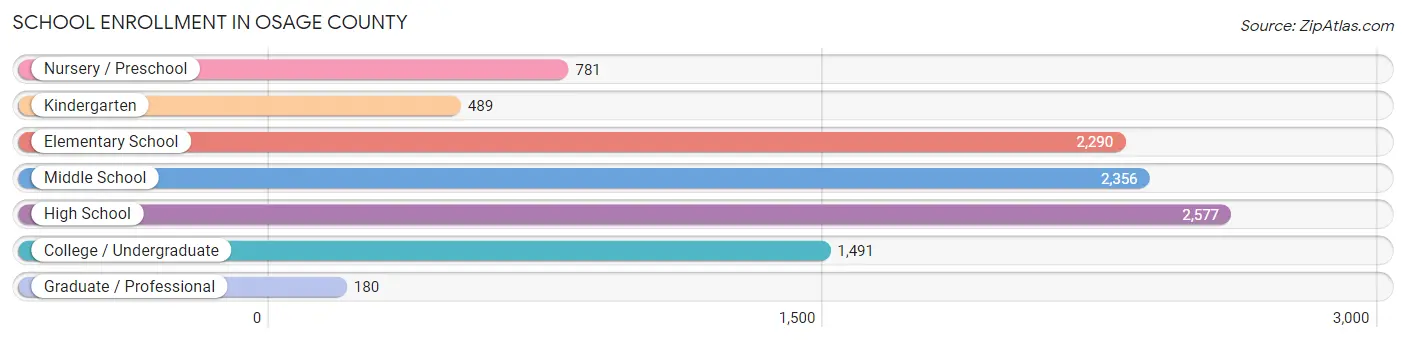
School Enrollment in Osage County
The most common levels of schooling among the 10,164 students in Osage County are high school (2,577 | 25.4%), middle school (2,356 | 23.2%), and elementary school (2,290 | 22.5%).
| School Level | # Students | % Students |
| Nursery / Preschool | 781 | 7.7% |
| Kindergarten | 489 | 4.8% |
| Elementary School | 2,290 | 22.5% |
| Middle School | 2,356 | 23.2% |
| High School | 2,577 | 25.4% |
| College / Undergraduate | 1,491 | 14.7% |
| Graduate / Professional | 180 | 1.8% |
| Total | 10,164 | 100.0% |
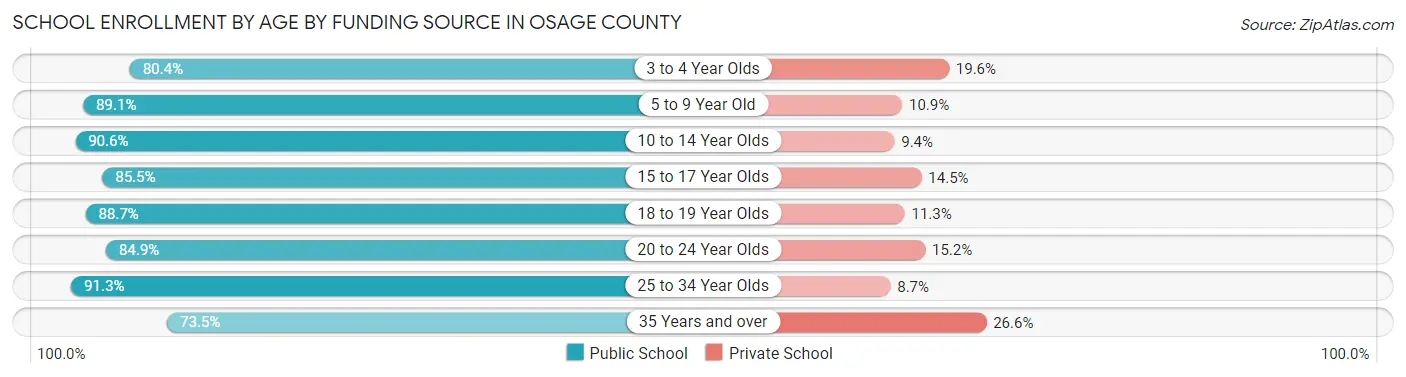
School Enrollment by Age by Funding Source in Osage County
Out of a total of 10,164 students who are enrolled in schools in Osage County, 1,281 (12.6%) attend a private institution, while the remaining 8,883 (87.4%) are enrolled in public schools. The age group of 35 years and over has the highest likelihood of being enrolled in private schools, with 137 (26.6% in the age bracket) enrolled. Conversely, the age group of 25 to 34 year olds has the lowest likelihood of being enrolled in a private school, with 400 (91.3% in the age bracket) attending a public institution.
| Age Bracket | Public School | Private School |
| 3 to 4 Year Olds | 468 (80.4%) | 114 (19.6%) |
| 5 to 9 Year Old | 2,237 (89.1%) | 273 (10.9%) |
| 10 to 14 Year Olds | 2,642 (90.6%) | 275 (9.4%) |
| 15 to 17 Year Olds | 1,547 (85.5%) | 262 (14.5%) |
| 18 to 19 Year Olds | 719 (88.7%) | 92 (11.3%) |
| 20 to 24 Year Olds | 493 (84.9%) | 88 (15.1%) |
| 25 to 34 Year Olds | 400 (91.3%) | 38 (8.7%) |
| 35 Years and over | 379 (73.5%) | 137 (26.6%) |
| Total | 8,883 (87.4%) | 1,281 (12.6%) |
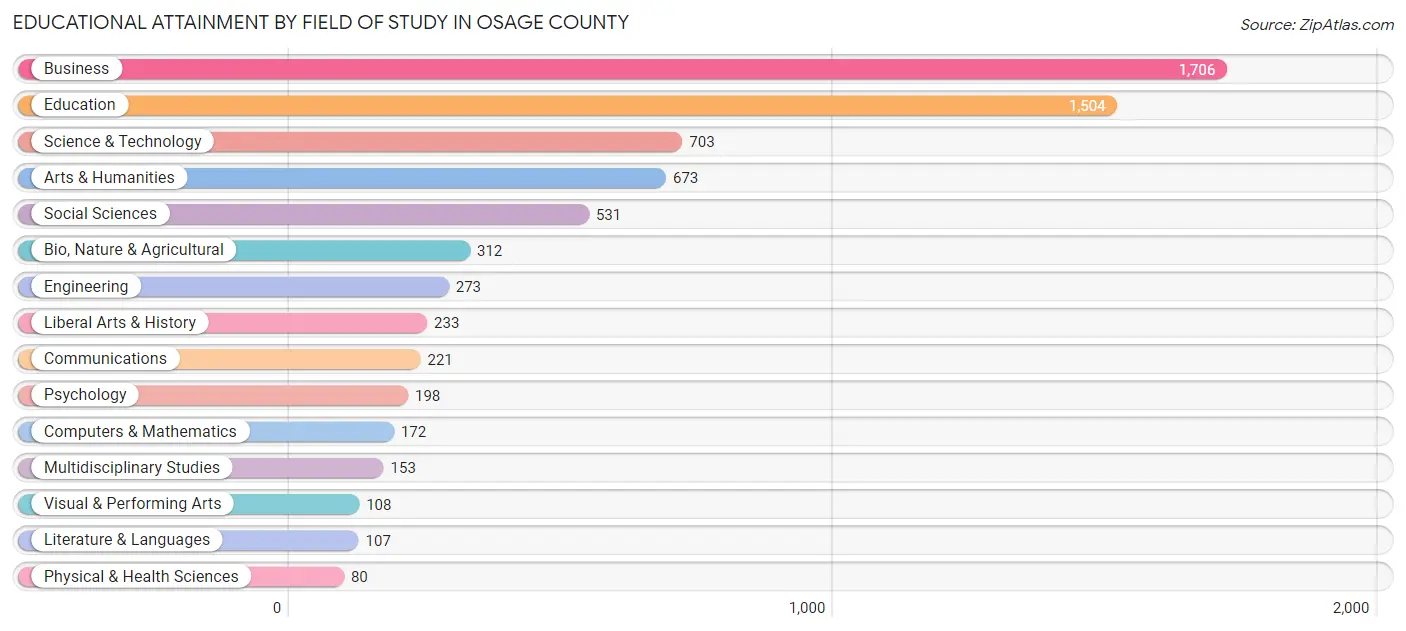
Educational Attainment by Field of Study in Osage County
Business (1,706 | 24.5%), education (1,504 | 21.6%), science & technology (703 | 10.1%), arts & humanities (673 | 9.7%), and social sciences (531 | 7.6%) are the most common fields of study among 6,974 individuals in Osage County who have obtained a bachelor's degree or higher.
| Field of Study | # Graduates | % Graduates |
| Computers & Mathematics | 172 | 2.5% |
| Bio, Nature & Agricultural | 312 | 4.5% |
| Physical & Health Sciences | 80 | 1.1% |
| Psychology | 198 | 2.8% |
| Social Sciences | 531 | 7.6% |
| Engineering | 273 | 3.9% |
| Multidisciplinary Studies | 153 | 2.2% |
| Science & Technology | 703 | 10.1% |
| Business | 1,706 | 24.5% |
| Education | 1,504 | 21.6% |
| Literature & Languages | 107 | 1.5% |
| Liberal Arts & History | 233 | 3.3% |
| Visual & Performing Arts | 108 | 1.5% |
| Communications | 221 | 3.2% |
| Arts & Humanities | 673 | 9.7% |
| Total | 6,974 | 100.0% |
Transportation & Commute in Osage County
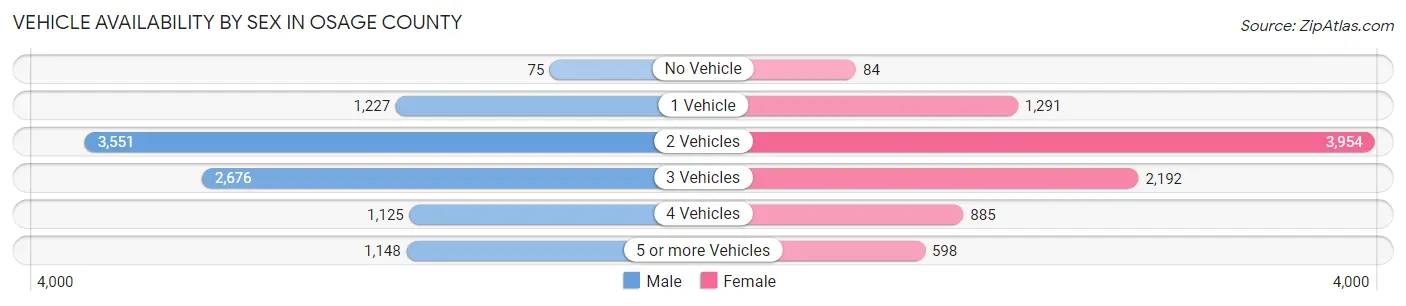
Vehicle Availability by Sex in Osage County
The most prevalent vehicle ownership categories in Osage County are males with 2 vehicles (3,551, accounting for 36.2%) and females with 2 vehicles (3,954, making up 39.4%).
| Vehicles Available | Male | Female |
| No Vehicle | 75 (0.8%) | 84 (0.9%) |
| 1 Vehicle | 1,227 (12.5%) | 1,291 (14.3%) |
| 2 Vehicles | 3,551 (36.2%) | 3,954 (43.9%) |
| 3 Vehicles | 2,676 (27.3%) | 2,192 (24.3%) |
| 4 Vehicles | 1,125 (11.5%) | 885 (9.8%) |
| 5 or more Vehicles | 1,148 (11.7%) | 598 (6.6%) |
| Total | 9,802 (100.0%) | 9,004 (100.0%) |
Commute Time in Osage County
The most frequently occuring commute durations in Osage County are 30 to 34 minutes (2,627 commuters, 14.9%), 15 to 19 minutes (2,253 commuters, 12.8%), and 5 to 9 minutes (2,176 commuters, 12.4%).
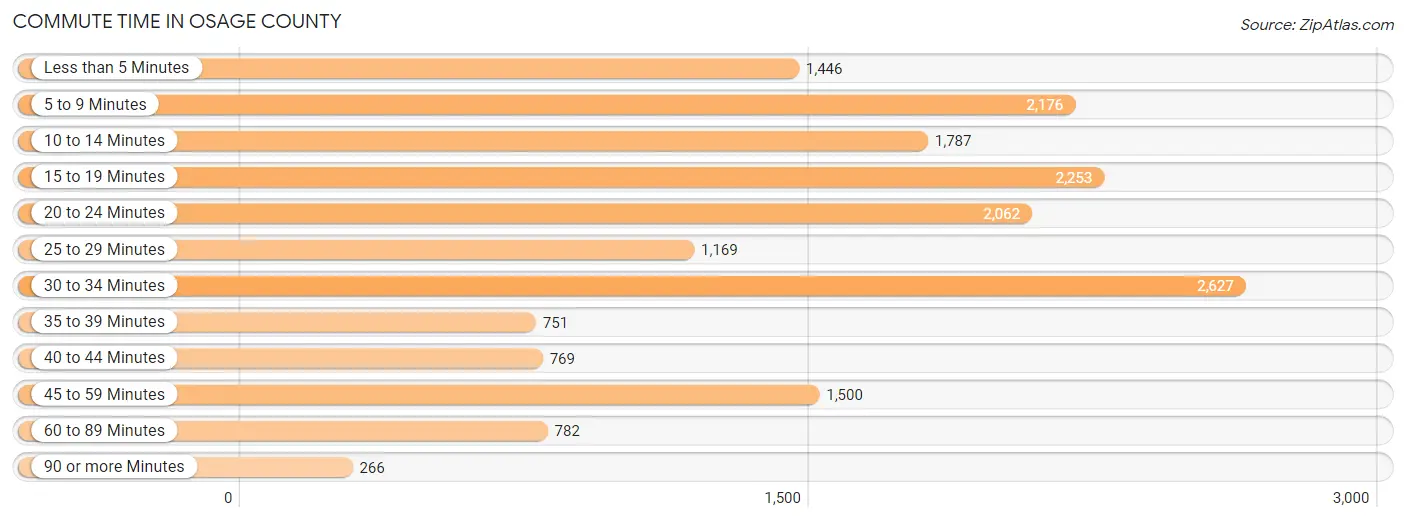
| Commute Time | # Commuters | % Commuters |
| Less than 5 Minutes | 1,446 | 8.2% |
| 5 to 9 Minutes | 2,176 | 12.4% |
| 10 to 14 Minutes | 1,787 | 10.2% |
| 15 to 19 Minutes | 2,253 | 12.8% |
| 20 to 24 Minutes | 2,062 | 11.7% |
| 25 to 29 Minutes | 1,169 | 6.7% |
| 30 to 34 Minutes | 2,627 | 14.9% |
| 35 to 39 Minutes | 751 | 4.3% |
| 40 to 44 Minutes | 769 | 4.4% |
| 45 to 59 Minutes | 1,500 | 8.5% |
| 60 to 89 Minutes | 782 | 4.4% |
| 90 or more Minutes | 266 | 1.5% |
Commute Time by Sex in Osage County
The most common commute times in Osage County are 30 to 34 minutes (1,454 commuters, 15.7%) for males and 5 to 9 minutes (1,250 commuters, 15.0%) for females.
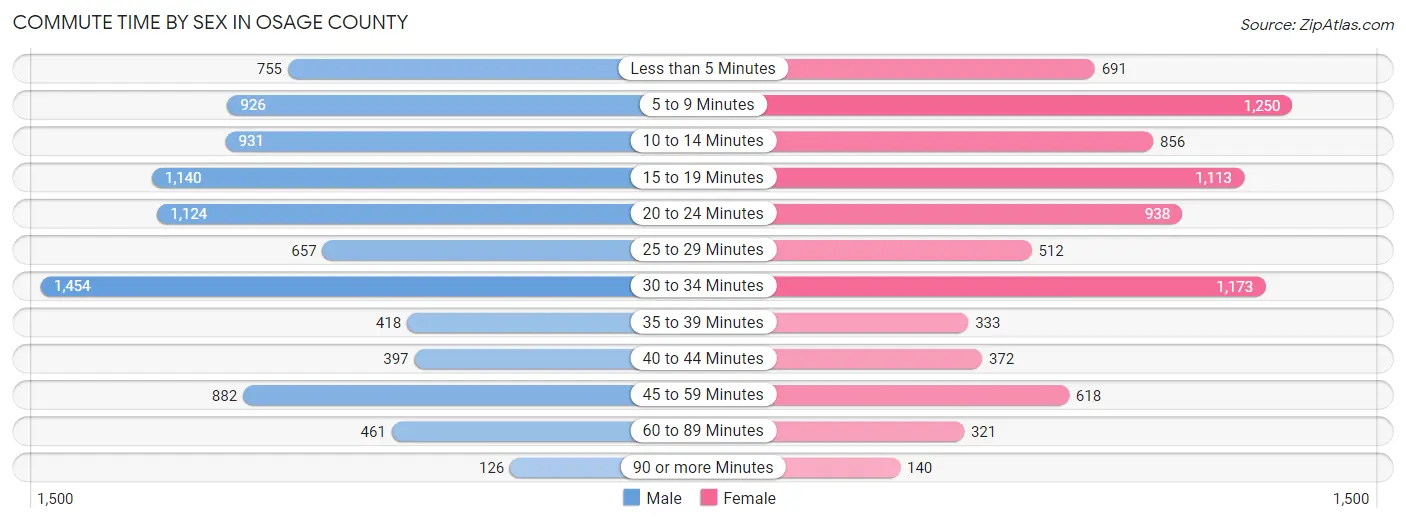
| Commute Time | Male | Female |
| Less than 5 Minutes | 755 (8.1%) | 691 (8.3%) |
| 5 to 9 Minutes | 926 (10.0%) | 1,250 (15.0%) |
| 10 to 14 Minutes | 931 (10.0%) | 856 (10.3%) |
| 15 to 19 Minutes | 1,140 (12.3%) | 1,113 (13.4%) |
| 20 to 24 Minutes | 1,124 (12.1%) | 938 (11.3%) |
| 25 to 29 Minutes | 657 (7.1%) | 512 (6.2%) |
| 30 to 34 Minutes | 1,454 (15.7%) | 1,173 (14.1%) |
| 35 to 39 Minutes | 418 (4.5%) | 333 (4.0%) |
| 40 to 44 Minutes | 397 (4.3%) | 372 (4.5%) |
| 45 to 59 Minutes | 882 (9.5%) | 618 (7.4%) |
| 60 to 89 Minutes | 461 (5.0%) | 321 (3.9%) |
| 90 or more Minutes | 126 (1.4%) | 140 (1.7%) |
Time of Departure to Work by Sex in Osage County
The most frequent times of departure to work in Osage County are 7:00 AM to 7:29 AM (1,631, 17.6%) for males and 7:00 AM to 7:29 AM (1,682, 20.2%) for females.
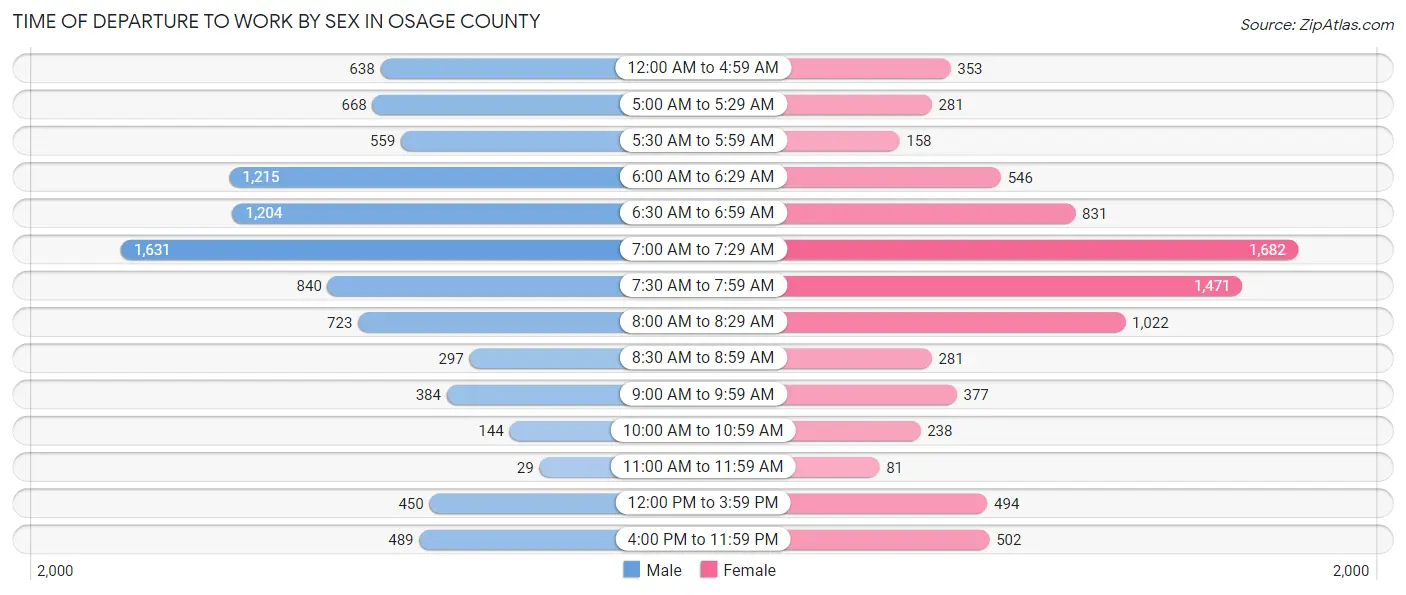
| Time of Departure | Male | Female |
| 12:00 AM to 4:59 AM | 638 (6.9%) | 353 (4.2%) |
| 5:00 AM to 5:29 AM | 668 (7.2%) | 281 (3.4%) |
| 5:30 AM to 5:59 AM | 559 (6.0%) | 158 (1.9%) |
| 6:00 AM to 6:29 AM | 1,215 (13.1%) | 546 (6.6%) |
| 6:30 AM to 6:59 AM | 1,204 (13.0%) | 831 (10.0%) |
| 7:00 AM to 7:29 AM | 1,631 (17.6%) | 1,682 (20.2%) |
| 7:30 AM to 7:59 AM | 840 (9.1%) | 1,471 (17.7%) |
| 8:00 AM to 8:29 AM | 723 (7.8%) | 1,022 (12.3%) |
| 8:30 AM to 8:59 AM | 297 (3.2%) | 281 (3.4%) |
| 9:00 AM to 9:59 AM | 384 (4.1%) | 377 (4.5%) |
| 10:00 AM to 10:59 AM | 144 (1.5%) | 238 (2.9%) |
| 11:00 AM to 11:59 AM | 29 (0.3%) | 81 (1.0%) |
| 12:00 PM to 3:59 PM | 450 (4.9%) | 494 (5.9%) |
| 4:00 PM to 11:59 PM | 489 (5.3%) | 502 (6.0%) |
| Total | 9,271 (100.0%) | 8,317 (100.0%) |
Housing Occupancy in Osage County
Occupancy by Ownership in Osage County
Of the total 16,851 dwellings in Osage County, owner-occupied units account for 13,186 (78.2%), while renter-occupied units make up 3,665 (21.7%).
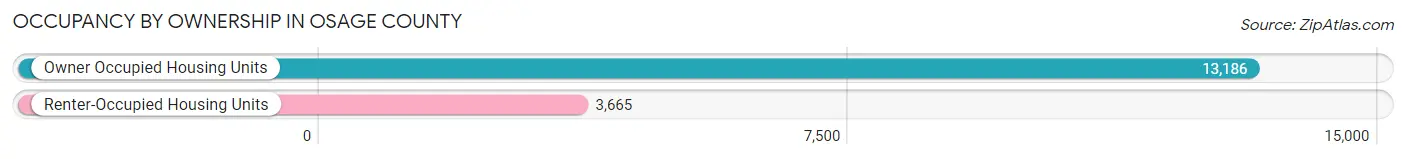
| Occupancy | # Housing Units | % Housing Units |
| Owner Occupied Housing Units | 13,186 | 78.2% |
| Renter-Occupied Housing Units | 3,665 | 21.7% |
| Total Occupied Housing Units | 16,851 | 100.0% |
Occupancy by Household Size in Osage County
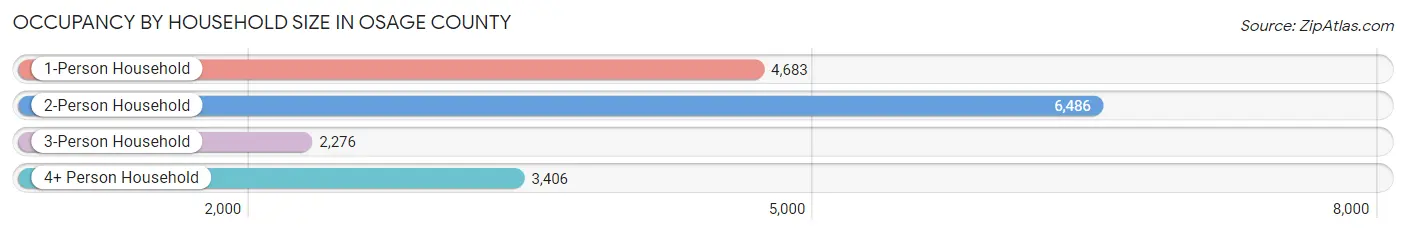
| Household Size | # Housing Units | % Housing Units |
| 1-Person Household | 4,683 | 27.8% |
| 2-Person Household | 6,486 | 38.5% |
| 3-Person Household | 2,276 | 13.5% |
| 4+ Person Household | 3,406 | 20.2% |
| Total Housing Units | 16,851 | 100.0% |
Occupancy by Ownership by Household Size in Osage County
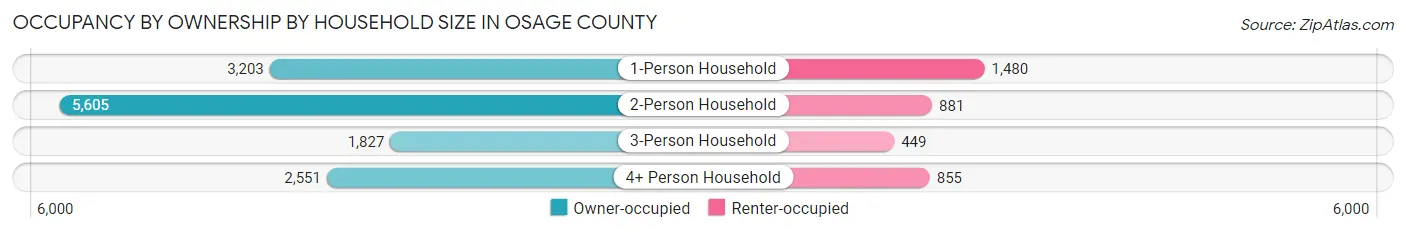
| Household Size | Owner-occupied | Renter-occupied |
| 1-Person Household | 3,203 (68.4%) | 1,480 (31.6%) |
| 2-Person Household | 5,605 (86.4%) | 881 (13.6%) |
| 3-Person Household | 1,827 (80.3%) | 449 (19.7%) |
| 4+ Person Household | 2,551 (74.9%) | 855 (25.1%) |
| Total Housing Units | 13,186 (78.2%) | 3,665 (21.7%) |
Occupancy by Educational Attainment in Osage County
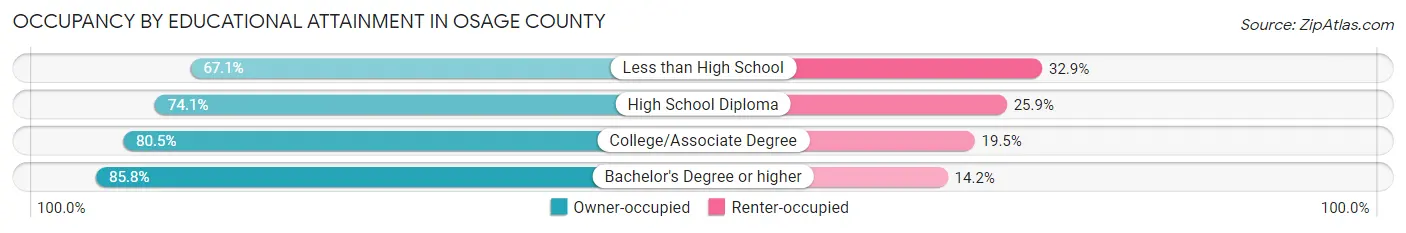
| Household Size | Owner-occupied | Renter-occupied |
| Less than High School | 1,071 (67.1%) | 525 (32.9%) |
| High School Diploma | 4,194 (74.1%) | 1,465 (25.9%) |
| College/Associate Degree | 4,747 (80.5%) | 1,151 (19.5%) |
| Bachelor's Degree or higher | 3,174 (85.8%) | 524 (14.2%) |
Occupancy by Age of Householder in Osage County
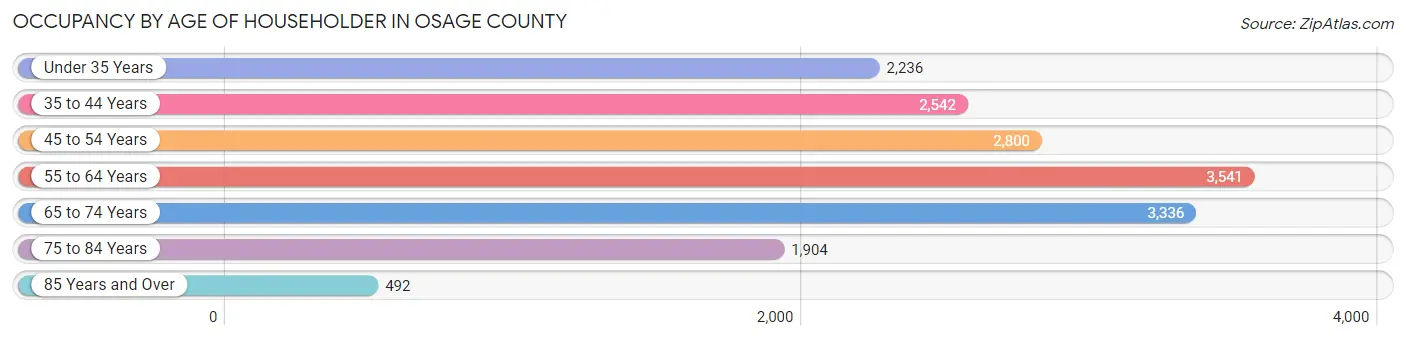
| Age Bracket | # Households | % Households |
| Under 35 Years | 2,236 | 13.3% |
| 35 to 44 Years | 2,542 | 15.1% |
| 45 to 54 Years | 2,800 | 16.6% |
| 55 to 64 Years | 3,541 | 21.0% |
| 65 to 74 Years | 3,336 | 19.8% |
| 75 to 84 Years | 1,904 | 11.3% |
| 85 Years and Over | 492 | 2.9% |
| Total | 16,851 | 100.0% |
Housing Finances in Osage County
Median Income by Occupancy in Osage County
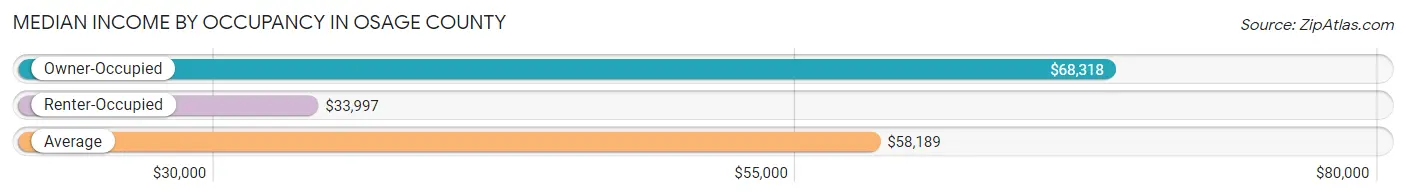
| Occupancy Type | # Households | Median Income |
| Owner-Occupied | 13,186 (78.2%) | $68,318 |
| Renter-Occupied | 3,665 (21.7%) | $33,997 |
| Average | 16,851 (100.0%) | $58,189 |
Occupancy by Householder Income Bracket in Osage County
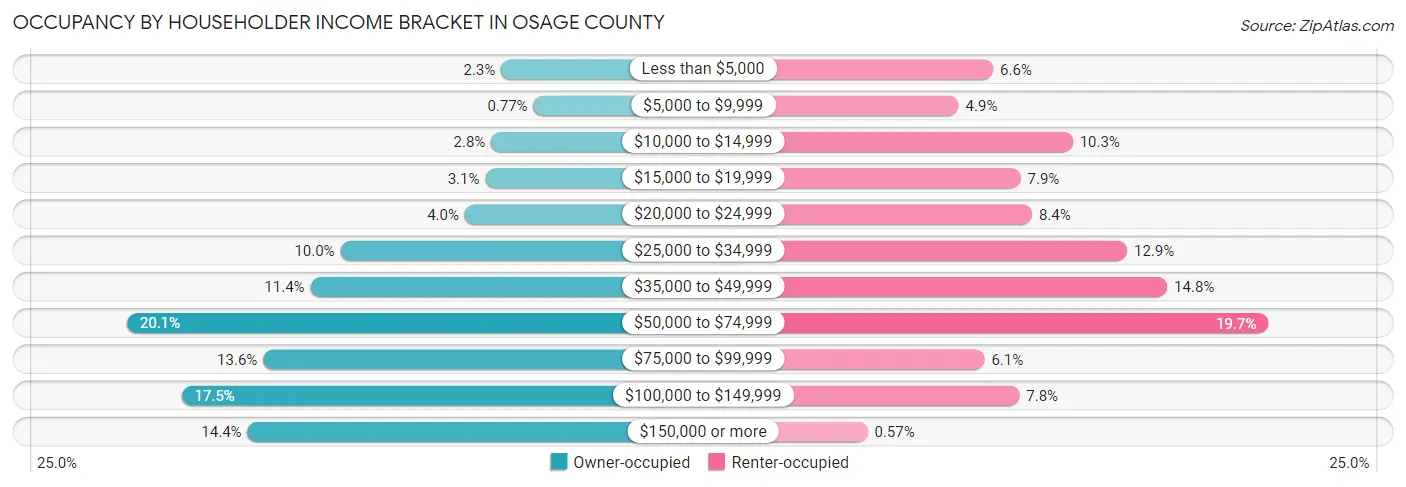
| Income Bracket | Owner-occupied | Renter-occupied |
| Less than $5,000 | 304 (2.3%) | 240 (6.6%) |
| $5,000 to $9,999 | 101 (0.8%) | 180 (4.9%) |
| $10,000 to $14,999 | 366 (2.8%) | 379 (10.3%) |
| $15,000 to $19,999 | 403 (3.1%) | 288 (7.9%) |
| $20,000 to $24,999 | 533 (4.0%) | 308 (8.4%) |
| $25,000 to $34,999 | 1,313 (10.0%) | 474 (12.9%) |
| $35,000 to $49,999 | 1,502 (11.4%) | 544 (14.8%) |
| $50,000 to $74,999 | 2,655 (20.1%) | 720 (19.7%) |
| $75,000 to $99,999 | 1,799 (13.6%) | 225 (6.1%) |
| $100,000 to $149,999 | 2,312 (17.5%) | 286 (7.8%) |
| $150,000 or more | 1,898 (14.4%) | 21 (0.6%) |
| Total | 13,186 (100.0%) | 3,665 (100.0%) |
Monthly Housing Cost Tiers in Osage County
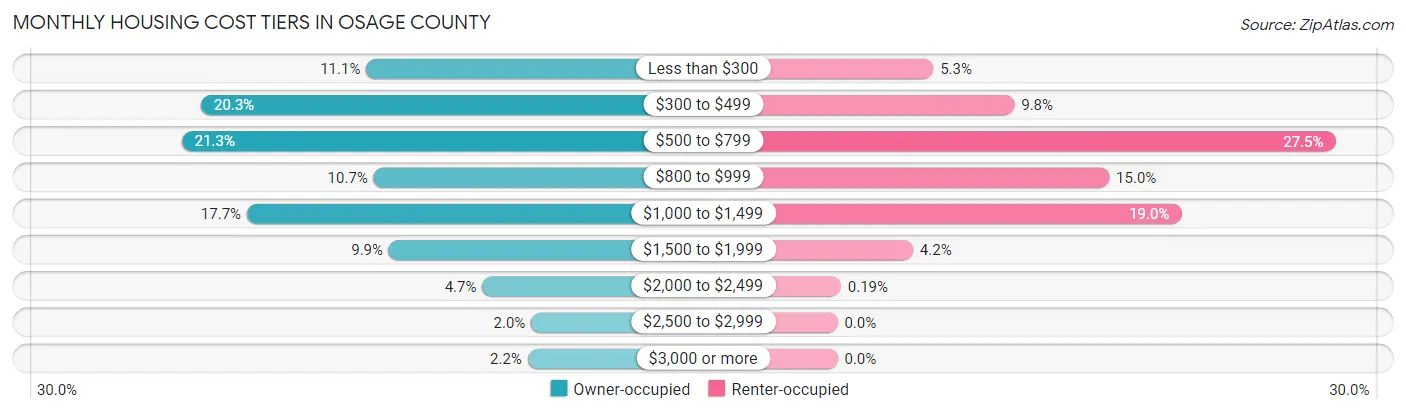
| Monthly Cost | Owner-occupied | Renter-occupied |
| Less than $300 | 1,467 (11.1%) | 194 (5.3%) |
| $300 to $499 | 2,672 (20.3%) | 358 (9.8%) |
| $500 to $799 | 2,813 (21.3%) | 1,008 (27.5%) |
| $800 to $999 | 1,413 (10.7%) | 550 (15.0%) |
| $1,000 to $1,499 | 2,337 (17.7%) | 696 (19.0%) |
| $1,500 to $1,999 | 1,303 (9.9%) | 153 (4.2%) |
| $2,000 to $2,499 | 623 (4.7%) | 7 (0.2%) |
| $2,500 to $2,999 | 266 (2.0%) | 0 (0.0%) |
| $3,000 or more | 292 (2.2%) | 0 (0.0%) |
| Total | 13,186 (100.0%) | 3,665 (100.0%) |
Physical Housing Characteristics in Osage County
Housing Structures in Osage County
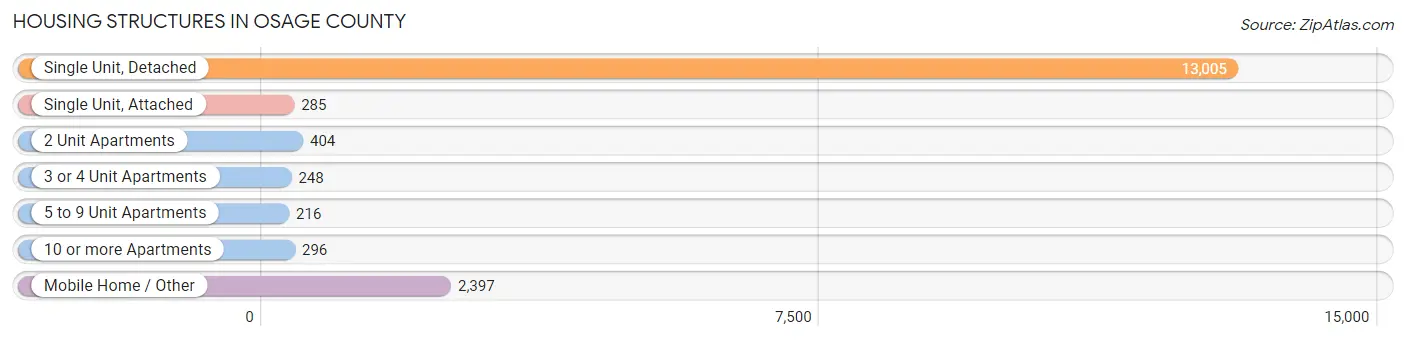
| Structure Type | # Housing Units | % Housing Units |
| Single Unit, Detached | 13,005 | 77.2% |
| Single Unit, Attached | 285 | 1.7% |
| 2 Unit Apartments | 404 | 2.4% |
| 3 or 4 Unit Apartments | 248 | 1.5% |
| 5 to 9 Unit Apartments | 216 | 1.3% |
| 10 or more Apartments | 296 | 1.8% |
| Mobile Home / Other | 2,397 | 14.2% |
| Total | 16,851 | 100.0% |
Housing Structures by Occupancy in Osage County
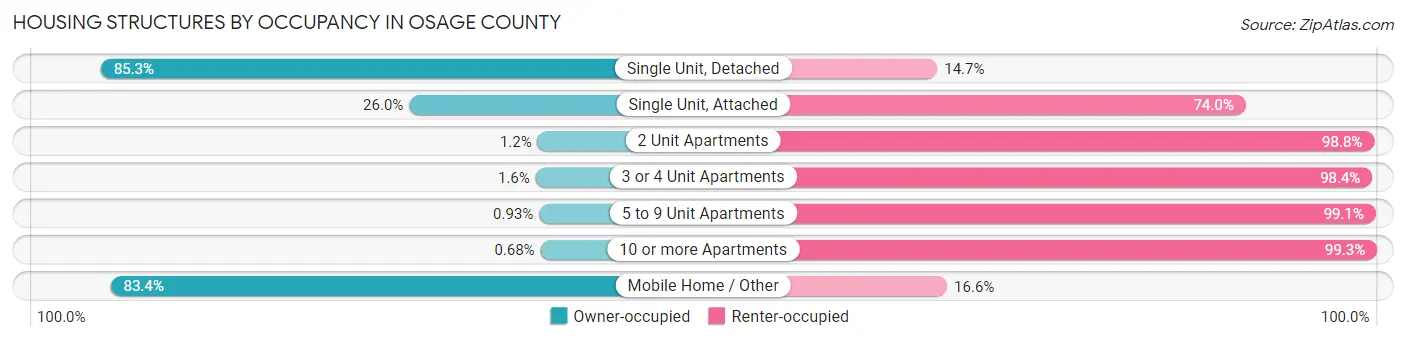
| Structure Type | Owner-occupied | Renter-occupied |
| Single Unit, Detached | 11,099 (85.3%) | 1,906 (14.7%) |
| Single Unit, Attached | 74 (26.0%) | 211 (74.0%) |
| 2 Unit Apartments | 5 (1.2%) | 399 (98.8%) |
| 3 or 4 Unit Apartments | 4 (1.6%) | 244 (98.4%) |
| 5 to 9 Unit Apartments | 2 (0.9%) | 214 (99.1%) |
| 10 or more Apartments | 2 (0.7%) | 294 (99.3%) |
| Mobile Home / Other | 2,000 (83.4%) | 397 (16.6%) |
| Total | 13,186 (78.2%) | 3,665 (21.7%) |
Housing Structures by Number of Rooms in Osage County
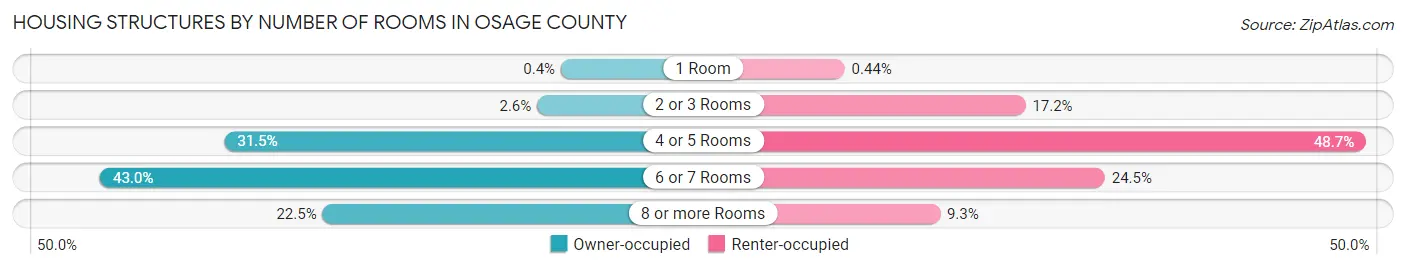
| Number of Rooms | Owner-occupied | Renter-occupied |
| 1 Room | 53 (0.4%) | 16 (0.4%) |
| 2 or 3 Rooms | 343 (2.6%) | 629 (17.2%) |
| 4 or 5 Rooms | 4,158 (31.5%) | 1,783 (48.6%) |
| 6 or 7 Rooms | 5,672 (43.0%) | 898 (24.5%) |
| 8 or more Rooms | 2,960 (22.5%) | 339 (9.2%) |
| Total | 13,186 (100.0%) | 3,665 (100.0%) |
Housing Structure by Heating Type in Osage County
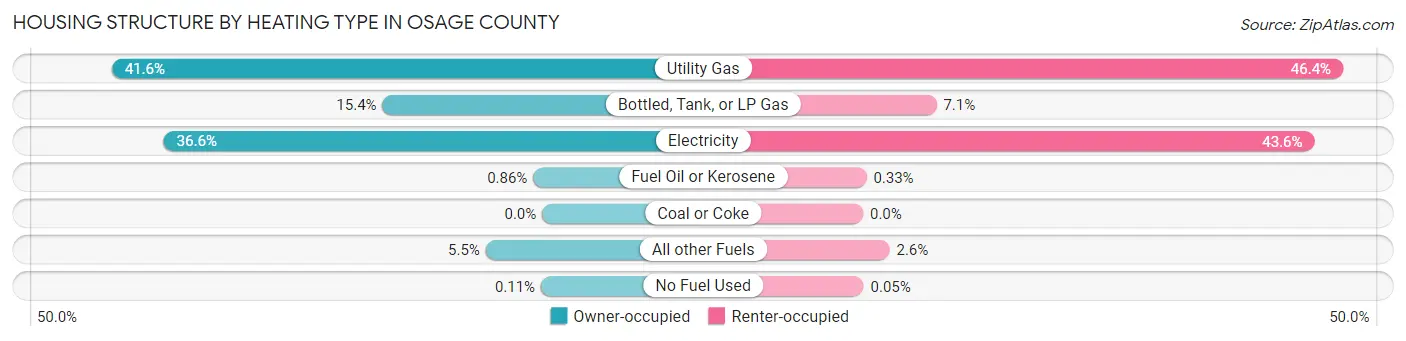
| Heating Type | Owner-occupied | Renter-occupied |
| Utility Gas | 5,483 (41.6%) | 1,699 (46.4%) |
| Bottled, Tank, or LP Gas | 2,035 (15.4%) | 260 (7.1%) |
| Electricity | 4,821 (36.6%) | 1,598 (43.6%) |
| Fuel Oil or Kerosene | 113 (0.9%) | 12 (0.3%) |
| Coal or Coke | 0 (0.0%) | 0 (0.0%) |
| All other Fuels | 719 (5.4%) | 94 (2.6%) |
| No Fuel Used | 15 (0.1%) | 2 (0.1%) |
| Total | 13,186 (100.0%) | 3,665 (100.0%) |
Household Vehicle Usage in Osage County
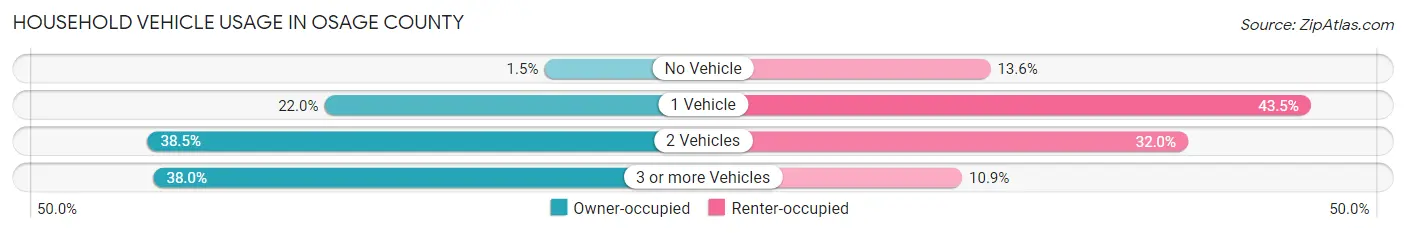
| Vehicles per Household | Owner-occupied | Renter-occupied |
| No Vehicle | 197 (1.5%) | 498 (13.6%) |
| 1 Vehicle | 2,905 (22.0%) | 1,593 (43.5%) |
| 2 Vehicles | 5,079 (38.5%) | 1,173 (32.0%) |
| 3 or more Vehicles | 5,005 (38.0%) | 401 (10.9%) |
| Total | 13,186 (100.0%) | 3,665 (100.0%) |
Real Estate & Mortgages in Osage County
Real Estate and Mortgage Overview in Osage County
| Characteristic | Without Mortgage | With Mortgage |
| Housing Units | 7,037 | 6,149 |
| Median Property Value | $119,100 | $179,600 |
| Median Household Income | $55,038 | $1,290 |
| Monthly Housing Costs | $456 | $288 |
| Real Estate Taxes | $868 | $270 |
Property Value by Mortgage Status in Osage County
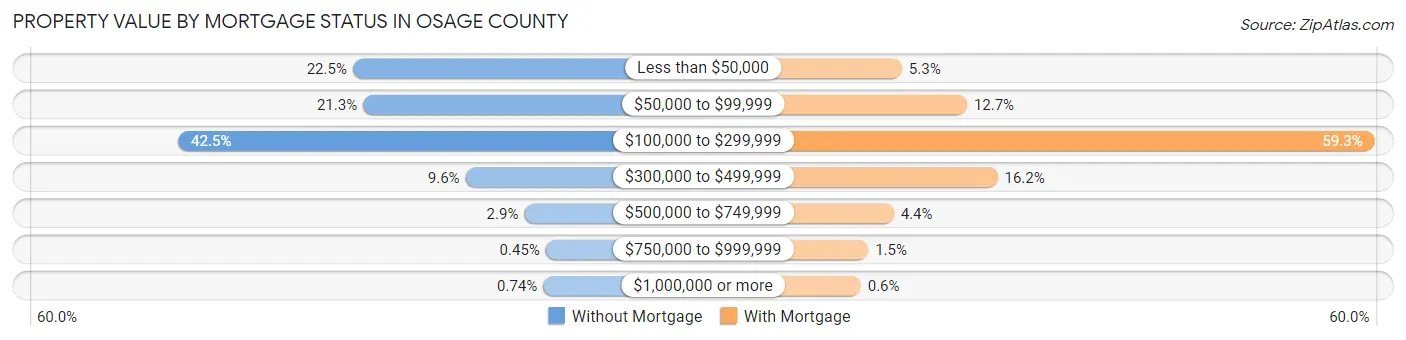
| Property Value | Without Mortgage | With Mortgage |
| Less than $50,000 | 1,583 (22.5%) | 326 (5.3%) |
| $50,000 to $99,999 | 1,501 (21.3%) | 783 (12.7%) |
| $100,000 to $299,999 | 2,988 (42.5%) | 3,647 (59.3%) |
| $300,000 to $499,999 | 677 (9.6%) | 998 (16.2%) |
| $500,000 to $749,999 | 204 (2.9%) | 269 (4.4%) |
| $750,000 to $999,999 | 32 (0.4%) | 89 (1.5%) |
| $1,000,000 or more | 52 (0.7%) | 37 (0.6%) |
| Total | 7,037 (100.0%) | 6,149 (100.0%) |
Household Income by Mortgage Status in Osage County
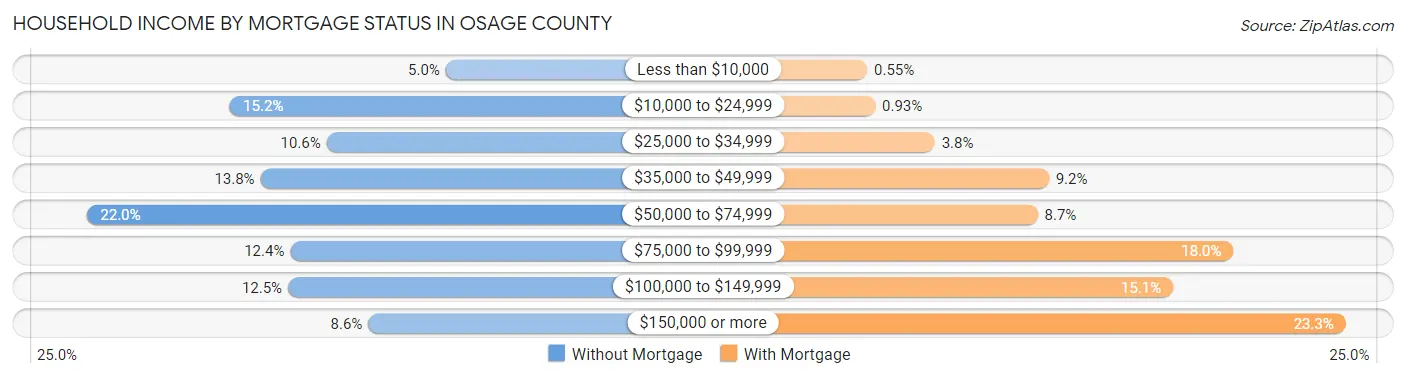
| Household Income | Without Mortgage | With Mortgage |
| Less than $10,000 | 348 (5.0%) | 34 (0.5%) |
| $10,000 to $24,999 | 1,070 (15.2%) | 57 (0.9%) |
| $25,000 to $34,999 | 747 (10.6%) | 232 (3.8%) |
| $35,000 to $49,999 | 969 (13.8%) | 566 (9.2%) |
| $50,000 to $74,999 | 1,549 (22.0%) | 533 (8.7%) |
| $75,000 to $99,999 | 869 (12.3%) | 1,106 (18.0%) |
| $100,000 to $149,999 | 877 (12.5%) | 930 (15.1%) |
| $150,000 or more | 608 (8.6%) | 1,435 (23.3%) |
| Total | 7,037 (100.0%) | 6,149 (100.0%) |
Property Value to Household Income Ratio in Osage County
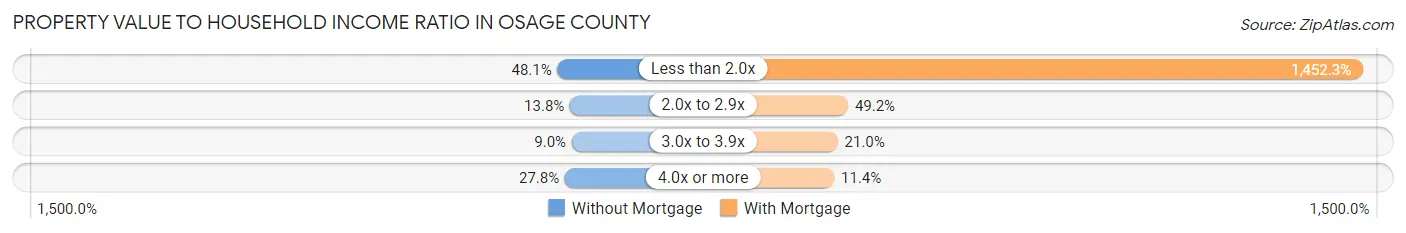
| Value-to-Income Ratio | Without Mortgage | With Mortgage |
| Less than 2.0x | 3,387 (48.1%) | 89,304 (1,452.3%) |
| 2.0x to 2.9x | 970 (13.8%) | 3,023 (49.2%) |
| 3.0x to 3.9x | 633 (9.0%) | 1,290 (21.0%) |
| 4.0x or more | 1,953 (27.8%) | 703 (11.4%) |
| Total | 7,037 (100.0%) | 6,149 (100.0%) |
Real Estate Taxes by Mortgage Status in Osage County
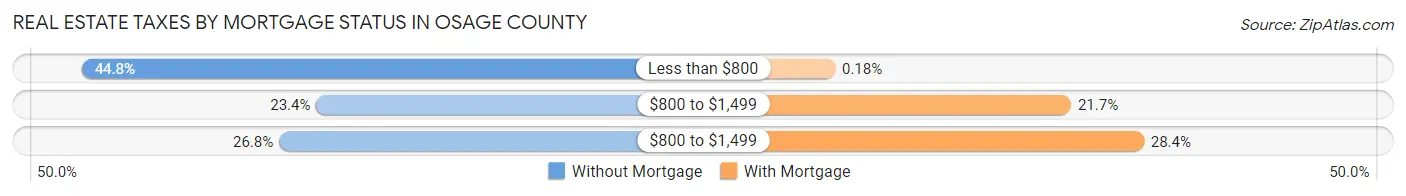
| Property Taxes | Without Mortgage | With Mortgage |
| Less than $800 | 3,151 (44.8%) | 11 (0.2%) |
| $800 to $1,499 | 1,644 (23.4%) | 1,336 (21.7%) |
| $800 to $1,499 | 1,883 (26.8%) | 1,745 (28.4%) |
| Total | 7,037 (100.0%) | 6,149 (100.0%) |
Health & Disability in Osage County
Health Insurance Coverage by Age in Osage County
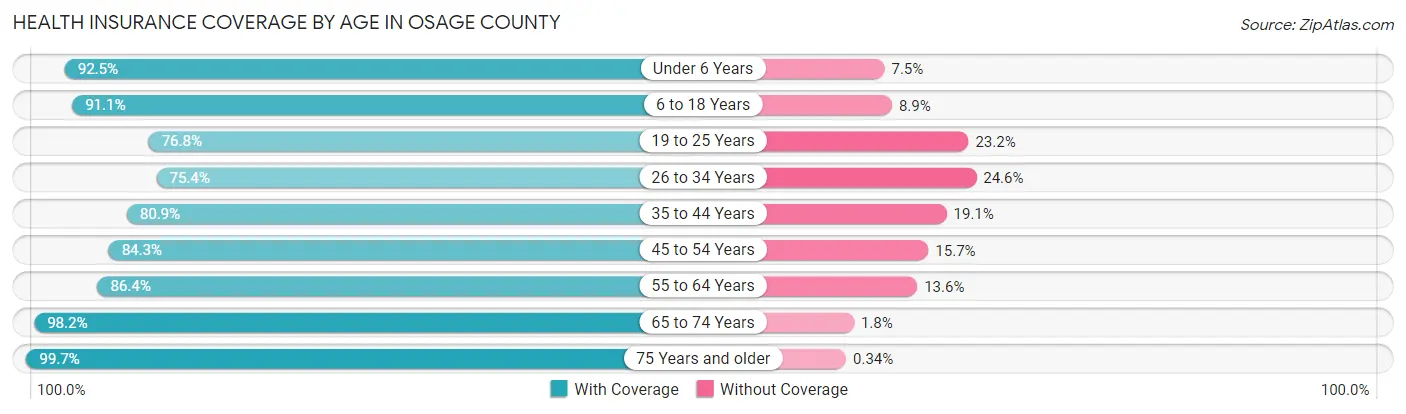
| Age Bracket | With Coverage | Without Coverage |
| Under 6 Years | 2,579 (92.5%) | 209 (7.5%) |
| 6 to 18 Years | 6,955 (91.1%) | 679 (8.9%) |
| 19 to 25 Years | 2,491 (76.8%) | 751 (23.2%) |
| 26 to 34 Years | 3,311 (75.4%) | 1,081 (24.6%) |
| 35 to 44 Years | 4,187 (80.9%) | 987 (19.1%) |
| 45 to 54 Years | 4,616 (84.3%) | 859 (15.7%) |
| 55 to 64 Years | 5,648 (86.4%) | 889 (13.6%) |
| 65 to 74 Years | 5,279 (98.2%) | 97 (1.8%) |
| 75 Years and older | 3,815 (99.7%) | 13 (0.3%) |
| Total | 38,881 (87.5%) | 5,565 (12.5%) |
Health Insurance Coverage by Citizenship Status in Osage County
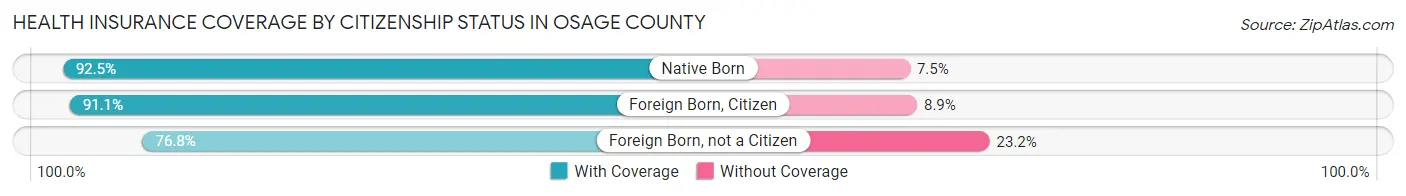
| Citizenship Status | With Coverage | Without Coverage |
| Native Born | 2,579 (92.5%) | 209 (7.5%) |
| Foreign Born, Citizen | 6,955 (91.1%) | 679 (8.9%) |
| Foreign Born, not a Citizen | 2,491 (76.8%) | 751 (23.2%) |
Health Insurance Coverage by Household Income in Osage County
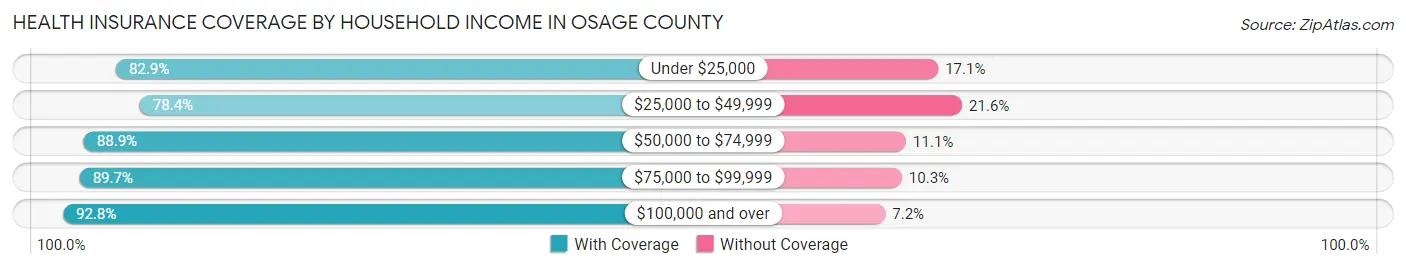
| Household Income | With Coverage | Without Coverage |
| Under $25,000 | 4,653 (82.9%) | 962 (17.1%) |
| $25,000 to $49,999 | 6,782 (78.4%) | 1,870 (21.6%) |
| $50,000 to $74,999 | 7,942 (88.9%) | 994 (11.1%) |
| $75,000 to $99,999 | 4,972 (89.7%) | 573 (10.3%) |
| $100,000 and over | 14,477 (92.8%) | 1,127 (7.2%) |
Public vs Private Health Insurance Coverage by Age in Osage County
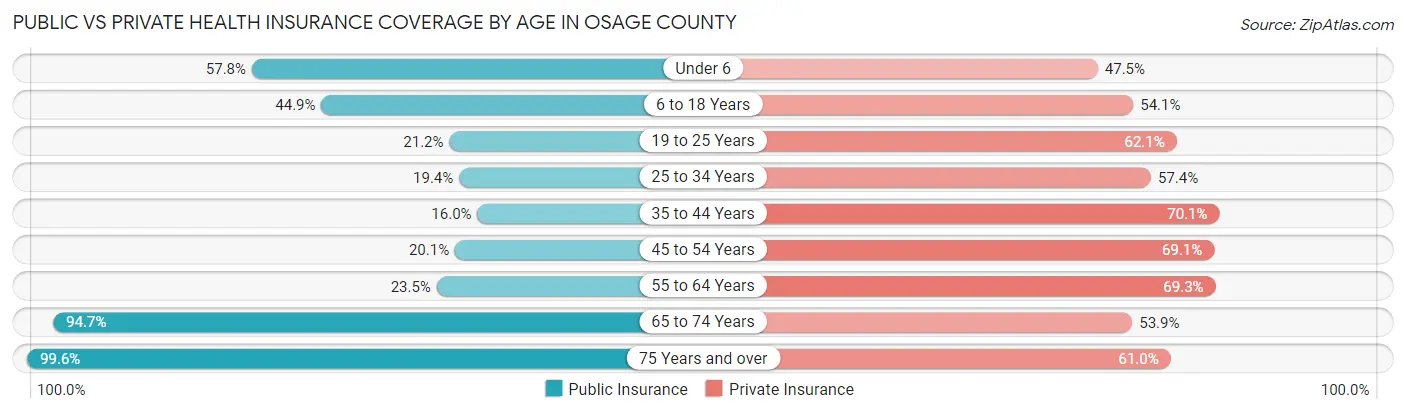
| Age Bracket | Public Insurance | Private Insurance |
| Under 6 | 1,612 (57.8%) | 1,325 (47.5%) |
| 6 to 18 Years | 3,429 (44.9%) | 4,131 (54.1%) |
| 19 to 25 Years | 686 (21.2%) | 2,014 (62.1%) |
| 25 to 34 Years | 850 (19.4%) | 2,521 (57.4%) |
| 35 to 44 Years | 825 (16.0%) | 3,626 (70.1%) |
| 45 to 54 Years | 1,101 (20.1%) | 3,783 (69.1%) |
| 55 to 64 Years | 1,537 (23.5%) | 4,533 (69.3%) |
| 65 to 74 Years | 5,092 (94.7%) | 2,899 (53.9%) |
| 75 Years and over | 3,811 (99.6%) | 2,336 (61.0%) |
| Total | 18,943 (42.6%) | 27,168 (61.1%) |
Disability Status by Sex by Age in Osage County
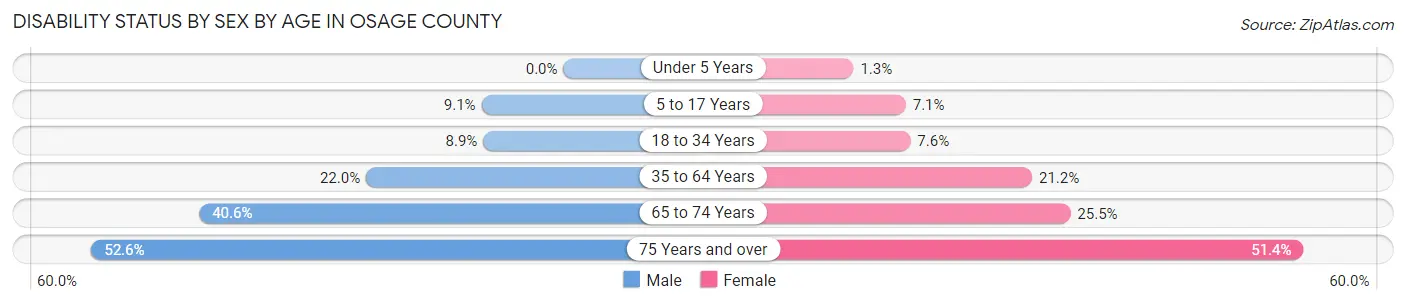
| Age Bracket | Male | Female |
| Under 5 Years | 0 (0.0%) | 14 (1.3%) |
| 5 to 17 Years | 343 (9.1%) | 263 (7.1%) |
| 18 to 34 Years | 383 (8.9%) | 308 (7.6%) |
| 35 to 64 Years | 1,816 (22.0%) | 1,891 (21.2%) |
| 65 to 74 Years | 1,011 (40.6%) | 734 (25.5%) |
| 75 Years and over | 932 (52.6%) | 1,056 (51.4%) |
Disability Class by Sex by Age in Osage County
Disability Class: Hearing Difficulty
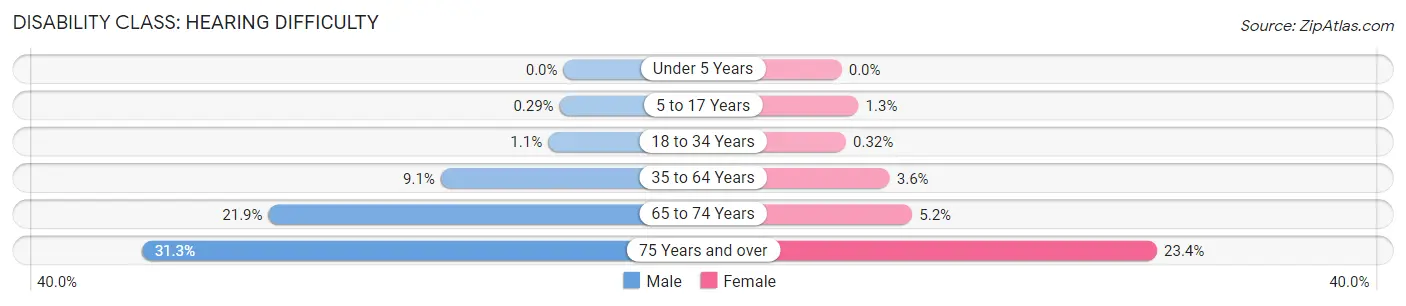
| Age Bracket | Male | Female |
| Under 5 Years | 0 (0.0%) | 0 (0.0%) |
| 5 to 17 Years | 11 (0.3%) | 46 (1.3%) |
| 18 to 34 Years | 49 (1.1%) | 13 (0.3%) |
| 35 to 64 Years | 753 (9.1%) | 319 (3.6%) |
| 65 to 74 Years | 546 (21.9%) | 151 (5.2%) |
| 75 Years and over | 555 (31.3%) | 481 (23.4%) |
Disability Class: Vision Difficulty
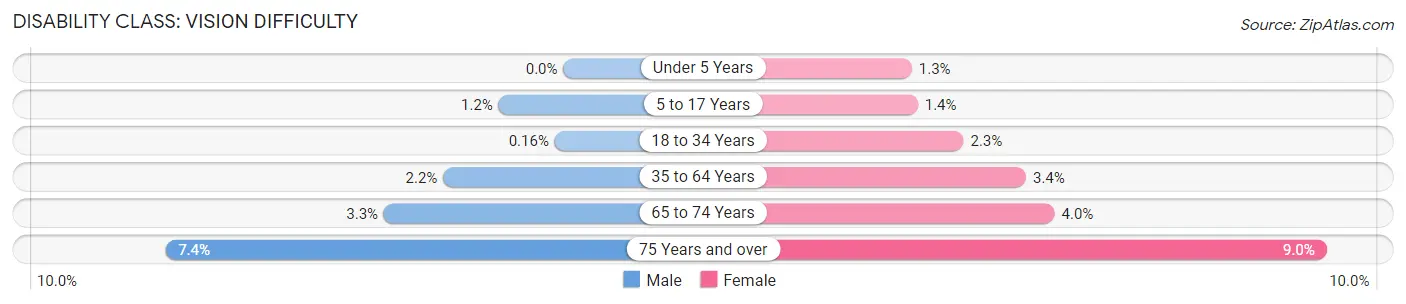
| Age Bracket | Male | Female |
| Under 5 Years | 0 (0.0%) | 14 (1.3%) |
| 5 to 17 Years | 45 (1.2%) | 52 (1.4%) |
| 18 to 34 Years | 7 (0.2%) | 91 (2.3%) |
| 35 to 64 Years | 184 (2.2%) | 305 (3.4%) |
| 65 to 74 Years | 83 (3.3%) | 114 (4.0%) |
| 75 Years and over | 131 (7.4%) | 185 (9.0%) |
Disability Class: Cognitive Difficulty
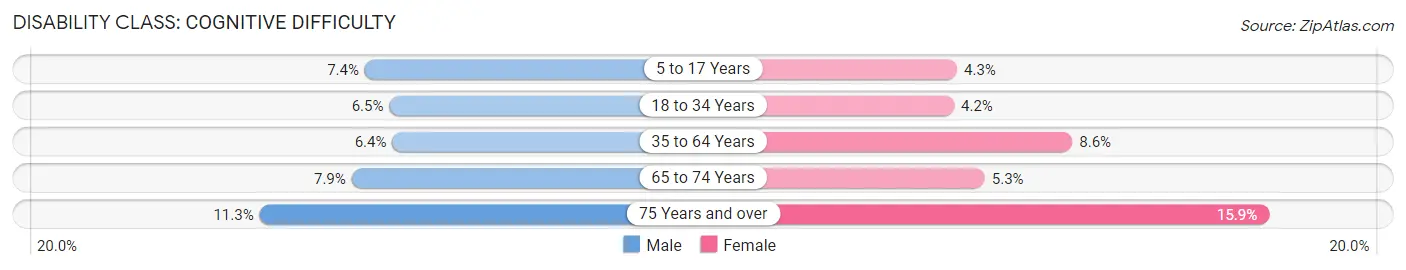
| Age Bracket | Male | Female |
| 5 to 17 Years | 277 (7.4%) | 158 (4.3%) |
| 18 to 34 Years | 277 (6.5%) | 168 (4.2%) |
| 35 to 64 Years | 525 (6.4%) | 764 (8.6%) |
| 65 to 74 Years | 196 (7.9%) | 153 (5.3%) |
| 75 Years and over | 200 (11.3%) | 326 (15.9%) |
Disability Class: Ambulatory Difficulty
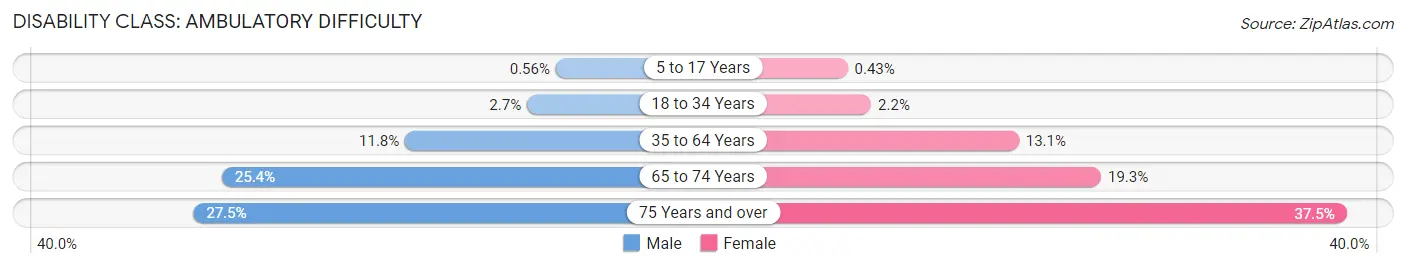
| Age Bracket | Male | Female |
| 5 to 17 Years | 21 (0.6%) | 16 (0.4%) |
| 18 to 34 Years | 116 (2.7%) | 88 (2.2%) |
| 35 to 64 Years | 971 (11.7%) | 1,173 (13.1%) |
| 65 to 74 Years | 632 (25.4%) | 555 (19.3%) |
| 75 Years and over | 487 (27.5%) | 770 (37.5%) |
Disability Class: Self-Care Difficulty
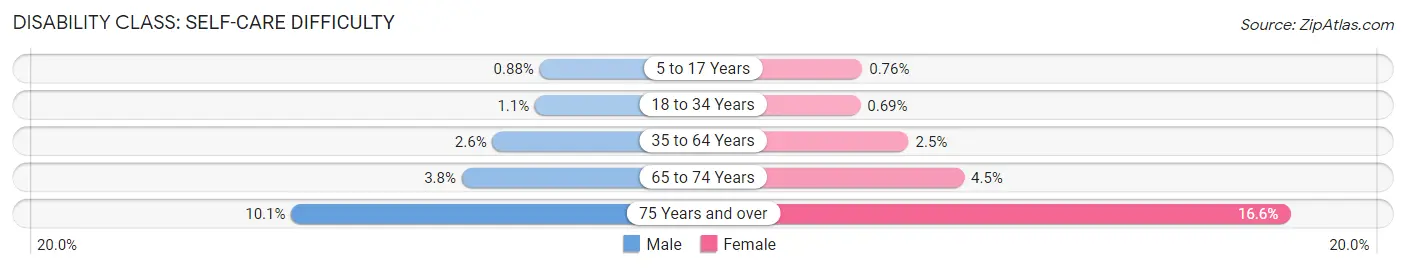
| Age Bracket | Male | Female |
| 5 to 17 Years | 33 (0.9%) | 28 (0.8%) |
| 18 to 34 Years | 45 (1.1%) | 28 (0.7%) |
| 35 to 64 Years | 217 (2.6%) | 221 (2.5%) |
| 65 to 74 Years | 94 (3.8%) | 131 (4.5%) |
| 75 Years and over | 179 (10.1%) | 342 (16.6%) |
Technology Access in Osage County
Computing Device Access in Osage County
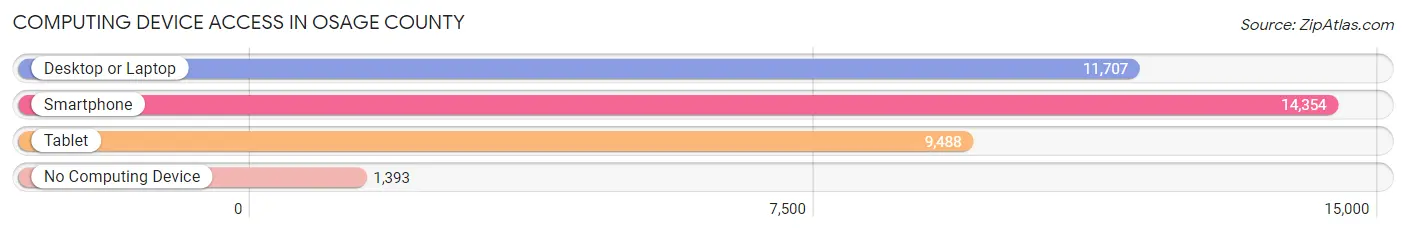
| Device Type | # Households | % Households |
| Desktop or Laptop | 11,707 | 69.5% |
| Smartphone | 14,354 | 85.2% |
| Tablet | 9,488 | 56.3% |
| No Computing Device | 1,393 | 8.3% |
| Total | 16,851 | 100.0% |
Internet Access in Osage County
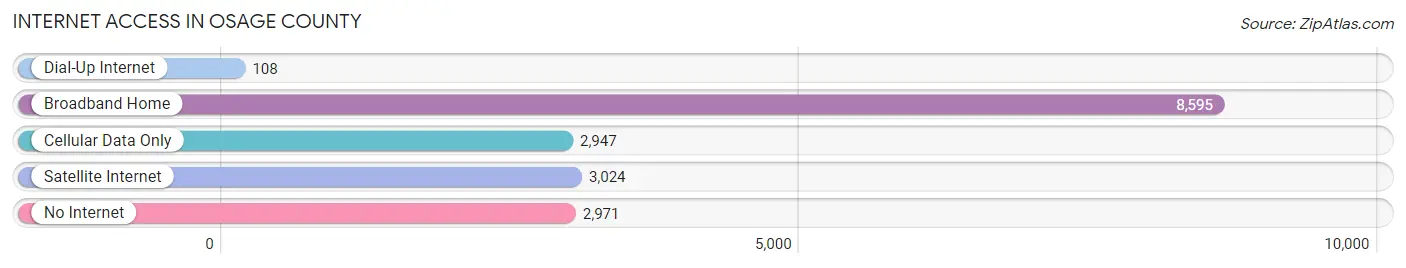
| Internet Type | # Households | % Households |
| Dial-Up Internet | 108 | 0.6% |
| Broadband Home | 8,595 | 51.0% |
| Cellular Data Only | 2,947 | 17.5% |
| Satellite Internet | 3,024 | 17.9% |
| No Internet | 2,971 | 17.6% |
| Total | 16,851 | 100.0% |
Osage County Summary
Osage County is located in the north-central region of Oklahoma and is part of the Tulsa Metropolitan Statistical Area. It is bordered by Washington County to the north, Tulsa County to the east, Creek County to the south, and Kay and Noble counties to the west. The county seat is Pawhuska, and the largest city is Hominy. As of the 2010 census, the population was 47,472.
History
Osage County was established in 1907, when Oklahoma became a state. It was named for the Osage Nation, which had been relocated to the area in the early 19th century. The Osage were originally from the Great Plains region, and were relocated to the area by the United States government in 1872.
The county was originally part of the Creek Nation, and was part of the Indian Territory until Oklahoma became a state. The area was settled by white settlers in the late 19th century, and the county was organized in 1907.
Geography
Osage County covers an area of 1,845 square miles, making it the largest county in Oklahoma. It is located in the north-central region of the state, and is bordered by Washington County to the north, Tulsa County to the east, Creek County to the south, and Kay and Noble counties to the west.
The county is mostly rural, with rolling hills and prairies. The Arkansas River runs through the county, and there are several small lakes and reservoirs. The county is home to several state parks, including Osage Hills State Park and Osage Prairie State Park.
Economy
Osage County has a diverse economy, with a mix of agriculture, manufacturing, and services. The county is home to several large companies, including the Osage Nation, which is the largest employer in the county. Other major employers include the Osage County Sheriff's Office, the Osage County Health Department, and the Osage County Public Schools.
Agriculture is a major part of the economy, with the county producing wheat, corn, soybeans, hay, and other crops. Livestock production is also important, with cattle, hogs, and poultry being raised in the county.
Manufacturing is also an important part of the economy, with several companies producing a variety of products, including furniture, clothing, and automotive parts.
Demographics
As of the 2010 census, the population of Osage County was 47,472. The population is mostly white (83.3%), with a small percentage of African Americans (7.2%), Native Americans (4.7%), and Hispanics (2.7%). The median household income is $41,945, and the median home value is $90,000.
The county is home to several Native American tribes, including the Osage Nation, the Kaw Nation, the Pawnee Nation, and the Otoe-Missouria Tribe. The county is also home to several small towns, including Pawhuska, Hominy, Fairfax, and Wynona.
Conclusion
Osage County is a large, rural county located in the north-central region of Oklahoma. It is home to several Native American tribes, and has a diverse economy that includes agriculture, manufacturing, and services. The population is mostly white, with a small percentage of African Americans, Native Americans, and Hispanics. The median household income is $41,945, and the median home value is $90,000.
Common Questions
What is the Total Population of Osage County?
Total Population of Osage County is 46,004.
What is the Total Male Population of Osage County?
Total Male Population of Osage County is 23,249.
What is the Total Female Population of Osage County?
Total Female Population of Osage County is 22,755.
What is the Ratio of Males per 100 Females in Osage County?
There are 102.17 Males per 100 Females in Osage County.
What is the Ratio of Females per 100 Males in Osage County?
There are 97.88 Females per 100 Males in Osage County.
What is the Median Population Age in Osage County?
Median Population Age in Osage County is 43.2 Years.
What is the Average Family Size in Osage County
Average Family Size in Osage County is 3.2 People.
What is the Average Household Size in Osage County
Average Household Size in Osage County is 2.6 People.
What is Per Capita Income in Osage County?
Per Capita income in Osage County is $29,906.
What is the Median Family Income in Osage County?
Median Family Income in Osage County is $73,536.
What is the Median Household income in Osage County?
Median Household Income in Osage County is $58,189.
What is Income or Wage Gap in Osage County?
Income or Wage Gap in Osage County is 32.3%.
Women in Osage County earn 67.7 cents for every dollar earned by a man.
What is Family Income Deficit in Osage County?
Family Income Deficit in Osage County is $11,607.
Families that are below poverty line in Osage County earn $11,607 less on average than the poverty threshold level.
What is Inequality or Gini Index in Osage County?
Inequality or Gini Index in Osage County is 0.43.
How Large is the Labor Force in Osage County?
There are 20,348 People in the Labor Forcein in Osage County.
What is the Percentage of People in the Labor Force in Osage County?
54.2% of People are in the Labor Force in Osage County.
What is the Unemployment Rate in Osage County?
Unemployment Rate in Osage County is 5.6%.