Okmulgee County, OK
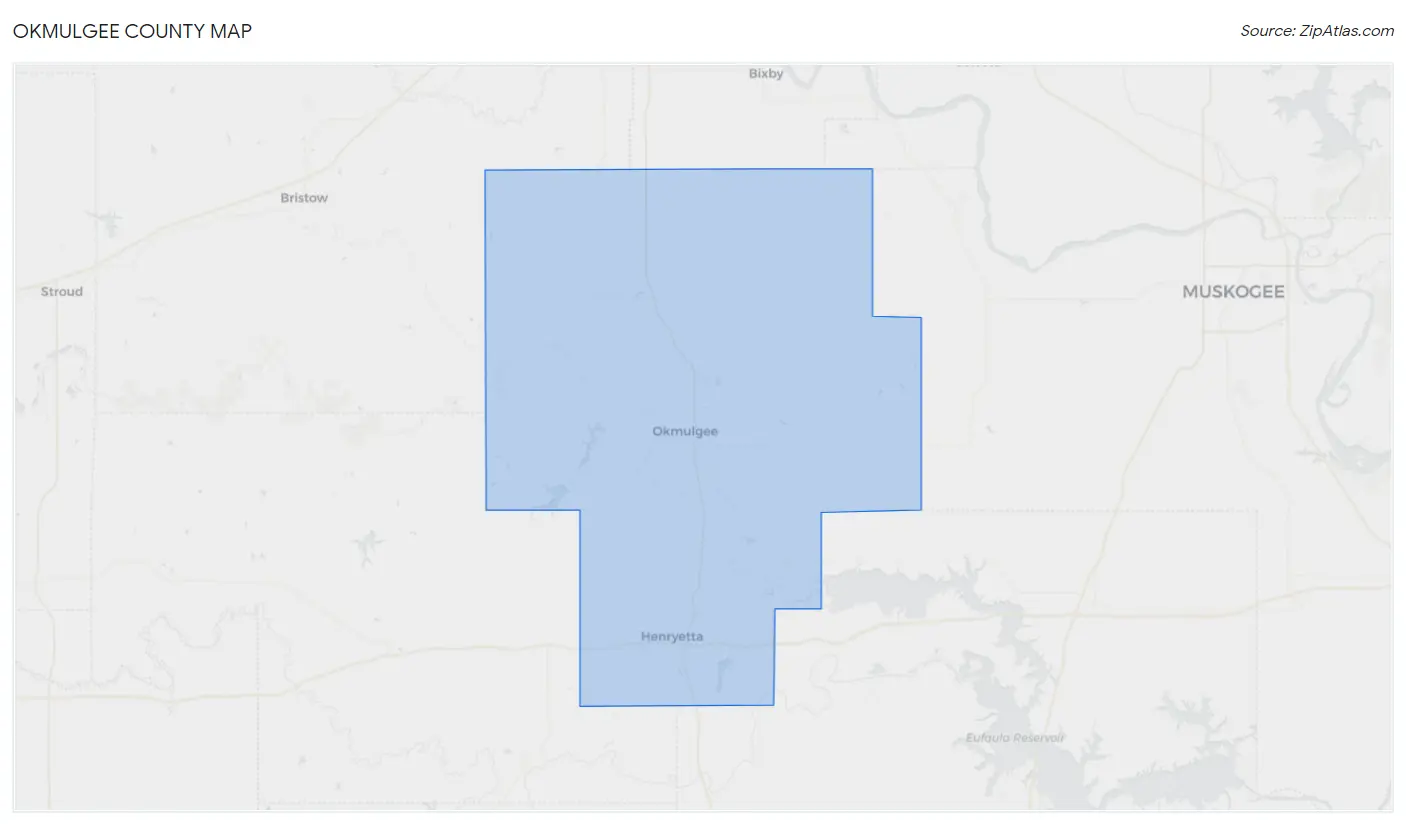
Okmulgee County Map
Okmulgee County Overview
36,900
TOTAL POPULATION
18,390
MALE POPULATION
18,510
FEMALE POPULATION
99.35
MALES / 100 FEMALES
100.65
FEMALES / 100 MALES
39.3
MEDIAN AGE
3.1
AVG FAMILY SIZE
2.5
AVG HOUSEHOLD SIZE
$27,821
PER CAPITA INCOME
$62,740
AVG FAMILY INCOME
$50,819
AVG HOUSEHOLD INCOME
33.6%
WAGE / INCOME GAP [ % ]
66.4¢/ $1
WAGE / INCOME GAP [ $ ]
$9,789
FAMILY INCOME DEFICIT
0.47
INEQUALITY / GINI INDEX
16,148
LABOR FORCE [ PEOPLE ]
55.2%
PERCENT IN LABOR FORCE
7.2%
UNEMPLOYMENT RATE
Okmulgee County Area Codes
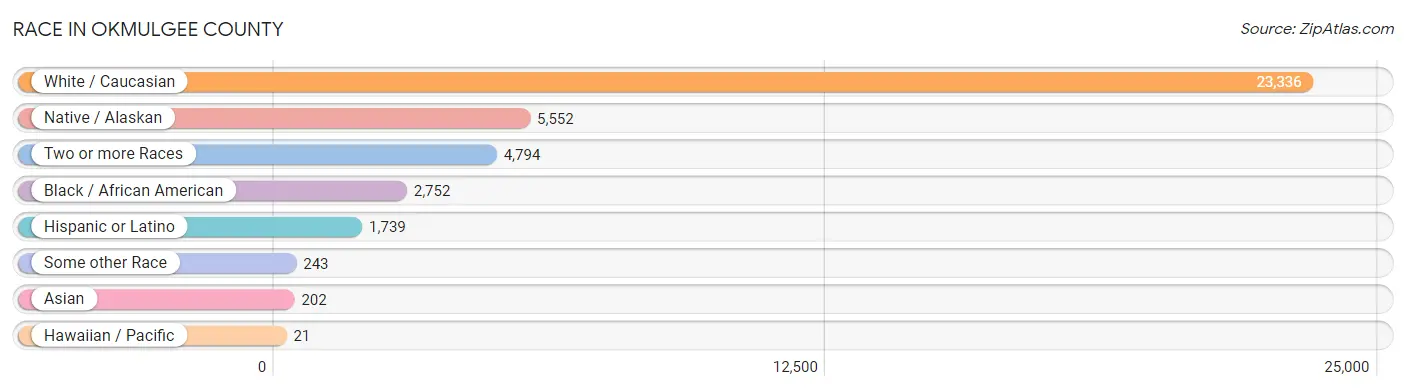
Race in Okmulgee County
The most populous races in Okmulgee County are White / Caucasian (23,336 | 63.2%), Native / Alaskan (5,552 | 15.0%), and Two or more Races (4,794 | 13.0%).
| Race | # Population | % Population |
| Asian | 202 | 0.5% |
| Black / African American | 2,752 | 7.5% |
| Hawaiian / Pacific | 21 | 0.1% |
| Hispanic or Latino | 1,739 | 4.7% |
| Native / Alaskan | 5,552 | 15.0% |
| White / Caucasian | 23,336 | 63.2% |
| Two or more Races | 4,794 | 13.0% |
| Some other Race | 243 | 0.7% |
| Total | 36,900 | 100.0% |
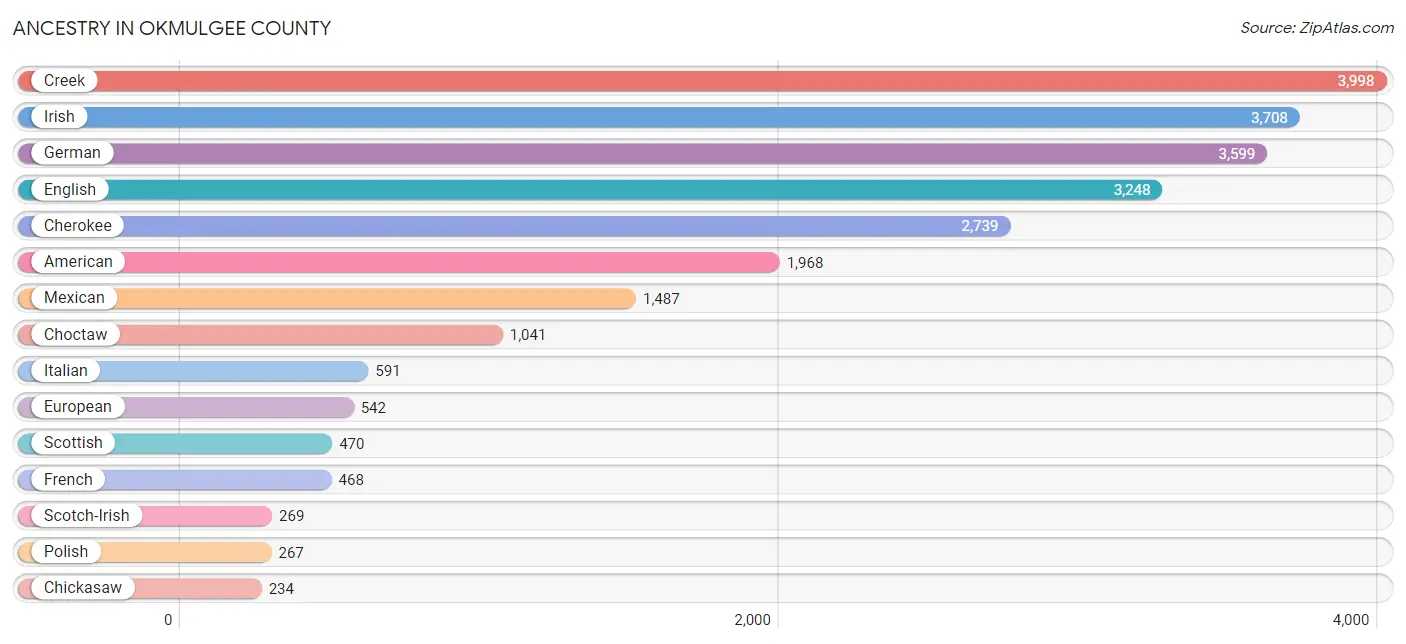
Ancestry in Okmulgee County
The most populous ancestries reported in Okmulgee County are Creek (3,998 | 10.8%), Irish (3,708 | 10.1%), German (3,599 | 9.8%), English (3,248 | 8.8%), and Cherokee (2,739 | 7.4%), together accounting for 46.8% of all Okmulgee County residents.
| Ancestry | # Population | % Population |
| African | 74 | 0.2% |
| American | 1,968 | 5.3% |
| Apache | 27 | 0.1% |
| Arab | 3 | 0.0% |
| Arapaho | 27 | 0.1% |
| Austrian | 5 | 0.0% |
| Belgian | 3 | 0.0% |
| Bhutanese | 30 | 0.1% |
| Blackfeet | 22 | 0.1% |
| British | 193 | 0.5% |
| Burmese | 27 | 0.1% |
| Cajun | 37 | 0.1% |
| Canadian | 12 | 0.0% |
| Celtic | 65 | 0.2% |
| Central American | 3 | 0.0% |
| Cherokee | 2,739 | 7.4% |
| Cheyenne | 23 | 0.1% |
| Chickasaw | 234 | 0.6% |
| Chippewa | 23 | 0.1% |
| Choctaw | 1,041 | 2.8% |
| Colville | 12 | 0.0% |
| Comanche | 14 | 0.0% |
| Creek | 3,998 | 10.8% |
| Croatian | 6 | 0.0% |
| Cuban | 3 | 0.0% |
| Czech | 128 | 0.4% |
| Czechoslovakian | 13 | 0.0% |
| Danish | 123 | 0.3% |
| Delaware | 32 | 0.1% |
| Dutch | 216 | 0.6% |
| Dutch West Indian | 231 | 0.6% |
| Eastern European | 19 | 0.1% |
| English | 3,248 | 8.8% |
| European | 542 | 1.5% |
| Finnish | 14 | 0.0% |
| French | 468 | 1.3% |
| French Canadian | 41 | 0.1% |
| German | 3,599 | 9.8% |
| German Russian | 12 | 0.0% |
| Greek | 22 | 0.1% |
| Guatemalan | 3 | 0.0% |
| Hungarian | 45 | 0.1% |
| Indian (Asian) | 159 | 0.4% |
| Indonesian | 16 | 0.0% |
| Irish | 3,708 | 10.1% |
| Iroquois | 50 | 0.1% |
| Italian | 591 | 1.6% |
| Jamaican | 12 | 0.0% |
| Jordanian | 3 | 0.0% |
| Kiowa | 23 | 0.1% |
| Korean | 100 | 0.3% |
| Lithuanian | 21 | 0.1% |
| Lumbee | 10 | 0.0% |
| Malaysian | 9 | 0.0% |
| Mexican | 1,487 | 4.0% |
| Mexican American Indian | 32 | 0.1% |
| Native Hawaiian | 115 | 0.3% |
| Navajo | 39 | 0.1% |
| Nigerian | 52 | 0.1% |
| Northern European | 9 | 0.0% |
| Norwegian | 184 | 0.5% |
| Osage | 43 | 0.1% |
| Ottawa | 13 | 0.0% |
| Peruvian | 6 | 0.0% |
| Polish | 267 | 0.7% |
| Portuguese | 60 | 0.2% |
| Potawatomi | 110 | 0.3% |
| Puerto Rican | 74 | 0.2% |
| Russian | 116 | 0.3% |
| Scandinavian | 6 | 0.0% |
| Scotch-Irish | 269 | 0.7% |
| Scottish | 470 | 1.3% |
| Seminole | 233 | 0.6% |
| Sioux | 2 | 0.0% |
| Slovene | 18 | 0.1% |
| South American | 16 | 0.0% |
| South American Indian | 3 | 0.0% |
| Spaniard | 116 | 0.3% |
| Spanish | 12 | 0.0% |
| Spanish American | 3 | 0.0% |
| Sri Lankan | 27 | 0.1% |
| Subsaharan African | 107 | 0.3% |
| Swedish | 142 | 0.4% |
| Swiss | 20 | 0.1% |
| Thai | 51 | 0.1% |
| Tohono O'Odham | 1 | 0.0% |
| Venezuelan | 10 | 0.0% |
| Welsh | 91 | 0.3% |
| Yugoslavian | 2 | 0.0% | View All 89 Rows |
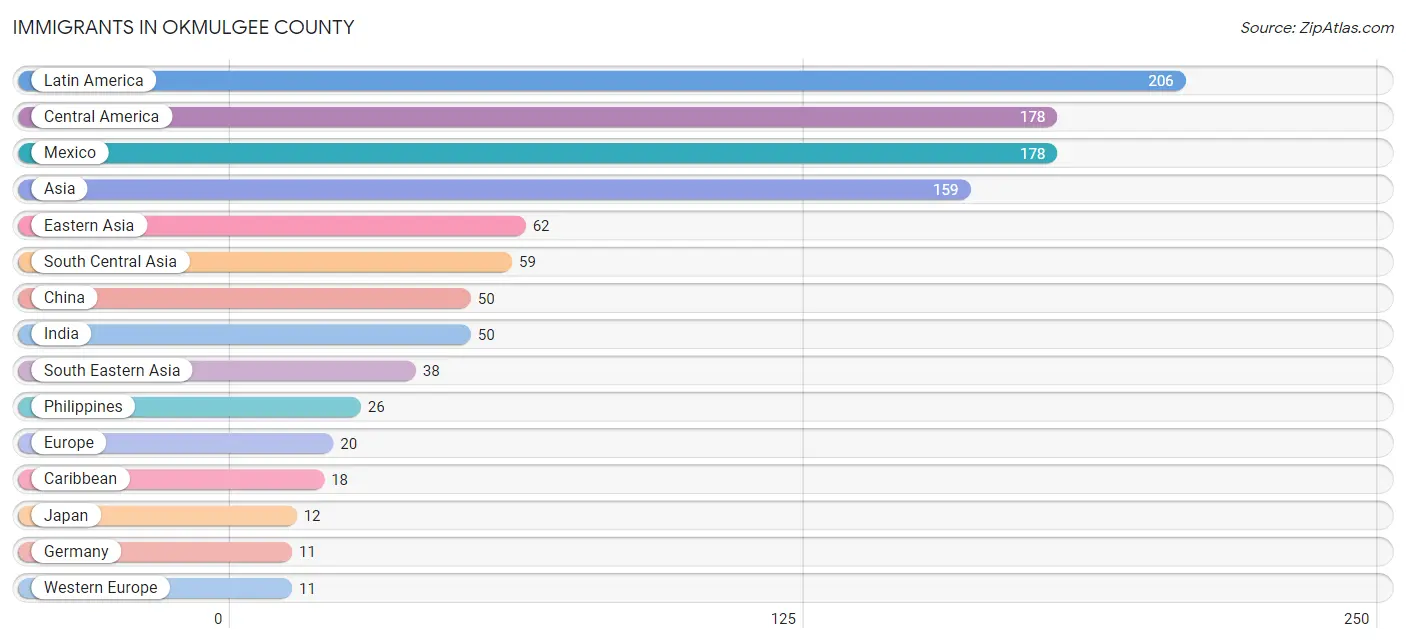
Immigrants in Okmulgee County
The most numerous immigrant groups reported in Okmulgee County came from Latin America (206 | 0.6%), Central America (178 | 0.5%), Mexico (178 | 0.5%), Asia (159 | 0.4%), and Eastern Asia (62 | 0.2%), together accounting for 2.1% of all Okmulgee County residents.
| Immigration Origin | # Population | % Population |
| Asia | 159 | 0.4% |
| Canada | 10 | 0.0% |
| Caribbean | 18 | 0.1% |
| Central America | 178 | 0.5% |
| China | 50 | 0.1% |
| Eastern Asia | 62 | 0.2% |
| England | 2 | 0.0% |
| Europe | 20 | 0.1% |
| Germany | 11 | 0.0% |
| India | 50 | 0.1% |
| Japan | 12 | 0.0% |
| Kazakhstan | 1 | 0.0% |
| Laos | 3 | 0.0% |
| Latin America | 206 | 0.6% |
| Mexico | 178 | 0.5% |
| Northern Europe | 9 | 0.0% |
| Oceania | 4 | 0.0% |
| Pakistan | 8 | 0.0% |
| Philippines | 26 | 0.1% |
| Scotland | 7 | 0.0% |
| South America | 10 | 0.0% |
| South Central Asia | 59 | 0.2% |
| South Eastern Asia | 38 | 0.1% |
| Venezuela | 10 | 0.0% |
| Vietnam | 9 | 0.0% |
| Western Europe | 11 | 0.0% | View All 26 Rows |
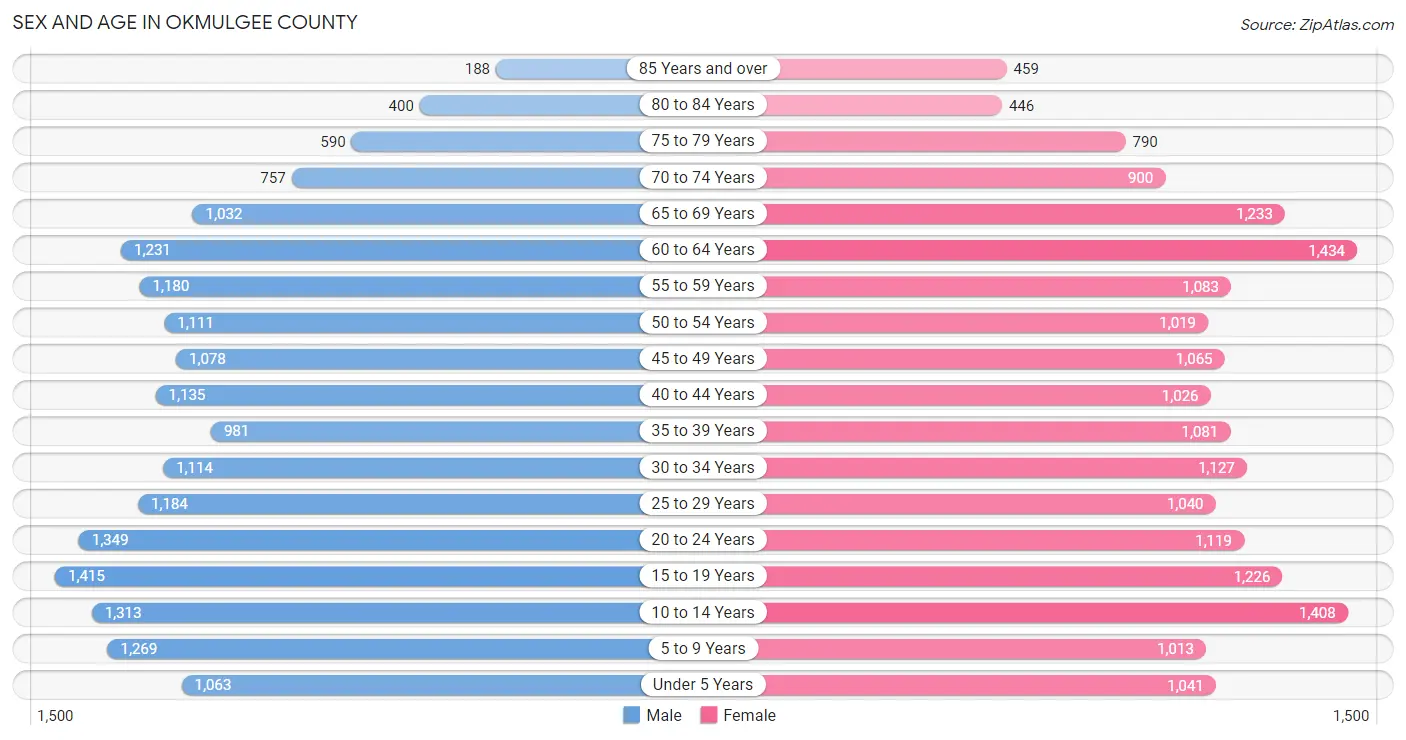
Sex and Age in Okmulgee County
Sex and Age in Okmulgee County
The most populous age groups in Okmulgee County are 15 to 19 Years (1,415 | 7.7%) for men and 60 to 64 Years (1,434 | 7.7%) for women.
| Age Bracket | Male | Female |
| Under 5 Years | 1,063 (5.8%) | 1,041 (5.6%) |
| 5 to 9 Years | 1,269 (6.9%) | 1,013 (5.5%) |
| 10 to 14 Years | 1,313 (7.1%) | 1,408 (7.6%) |
| 15 to 19 Years | 1,415 (7.7%) | 1,226 (6.6%) |
| 20 to 24 Years | 1,349 (7.3%) | 1,119 (6.0%) |
| 25 to 29 Years | 1,184 (6.4%) | 1,040 (5.6%) |
| 30 to 34 Years | 1,114 (6.1%) | 1,127 (6.1%) |
| 35 to 39 Years | 981 (5.3%) | 1,081 (5.8%) |
| 40 to 44 Years | 1,135 (6.2%) | 1,026 (5.5%) |
| 45 to 49 Years | 1,078 (5.9%) | 1,065 (5.8%) |
| 50 to 54 Years | 1,111 (6.0%) | 1,019 (5.5%) |
| 55 to 59 Years | 1,180 (6.4%) | 1,083 (5.9%) |
| 60 to 64 Years | 1,231 (6.7%) | 1,434 (7.7%) |
| 65 to 69 Years | 1,032 (5.6%) | 1,233 (6.7%) |
| 70 to 74 Years | 757 (4.1%) | 900 (4.9%) |
| 75 to 79 Years | 590 (3.2%) | 790 (4.3%) |
| 80 to 84 Years | 400 (2.2%) | 446 (2.4%) |
| 85 Years and over | 188 (1.0%) | 459 (2.5%) |
| Total | 18,390 (100.0%) | 18,510 (100.0%) |
Families and Households in Okmulgee County
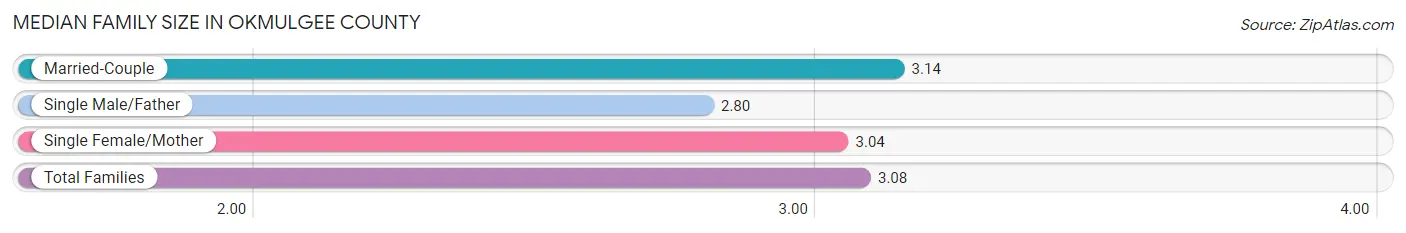
Median Family Size in Okmulgee County
The median family size in Okmulgee County is 3.08 persons per family, with married-couple families (6,326 | 68.3%) accounting for the largest median family size of 3.14 persons per family. On the other hand, single male/father families (917 | 9.9%) represent the smallest median family size with 2.80 persons per family.
| Family Type | # Families | Family Size |
| Married-Couple | 6,326 (68.3%) | 3.14 |
| Single Male/Father | 917 (9.9%) | 2.80 |
| Single Female/Mother | 2,015 (21.8%) | 3.04 |
| Total Families | 9,258 (100.0%) | 3.08 |
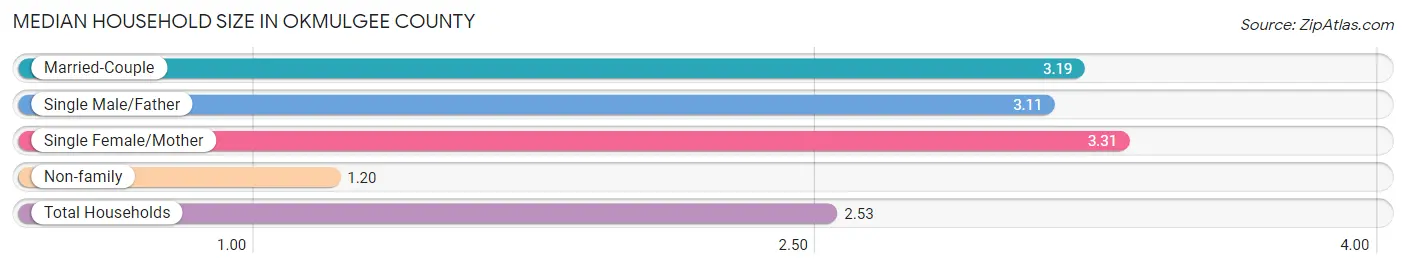
Median Household Size in Okmulgee County
The median household size in Okmulgee County is 2.53 persons per household, with single female/mother households (2,015 | 14.4%) accounting for the largest median household size of 3.31 persons per household. non-family households (4,725 | 33.8%) represent the smallest median household size with 1.20 persons per household.
| Household Type | # Households | Household Size |
| Married-Couple | 6,326 (45.2%) | 3.19 |
| Single Male/Father | 917 (6.6%) | 3.11 |
| Single Female/Mother | 2,015 (14.4%) | 3.31 |
| Non-family | 4,725 (33.8%) | 1.20 |
| Total Households | 13,983 (100.0%) | 2.53 |
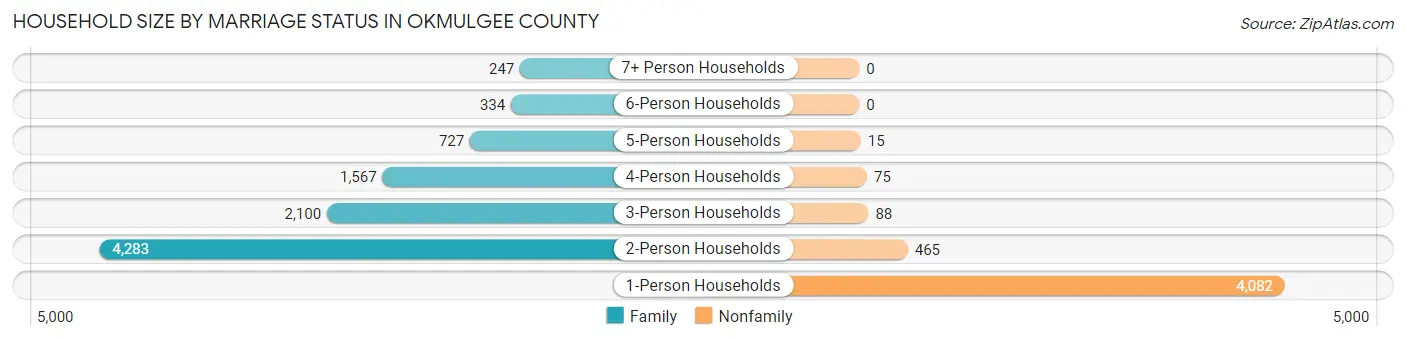
Household Size by Marriage Status in Okmulgee County
Out of a total of 13,983 households in Okmulgee County, 9,258 (66.2%) are family households, while 4,725 (33.8%) are nonfamily households. The most numerous type of family households are 2-person households, comprising 4,283, and the most common type of nonfamily households are 1-person households, comprising 4,082.
| Household Size | Family Households | Nonfamily Households |
| 1-Person Households | - | 4,082 (29.2%) |
| 2-Person Households | 4,283 (30.6%) | 465 (3.3%) |
| 3-Person Households | 2,100 (15.0%) | 88 (0.6%) |
| 4-Person Households | 1,567 (11.2%) | 75 (0.5%) |
| 5-Person Households | 727 (5.2%) | 15 (0.1%) |
| 6-Person Households | 334 (2.4%) | 0 (0.0%) |
| 7+ Person Households | 247 (1.8%) | 0 (0.0%) |
| Total | 9,258 (66.2%) | 4,725 (33.8%) |
Female Fertility in Okmulgee County
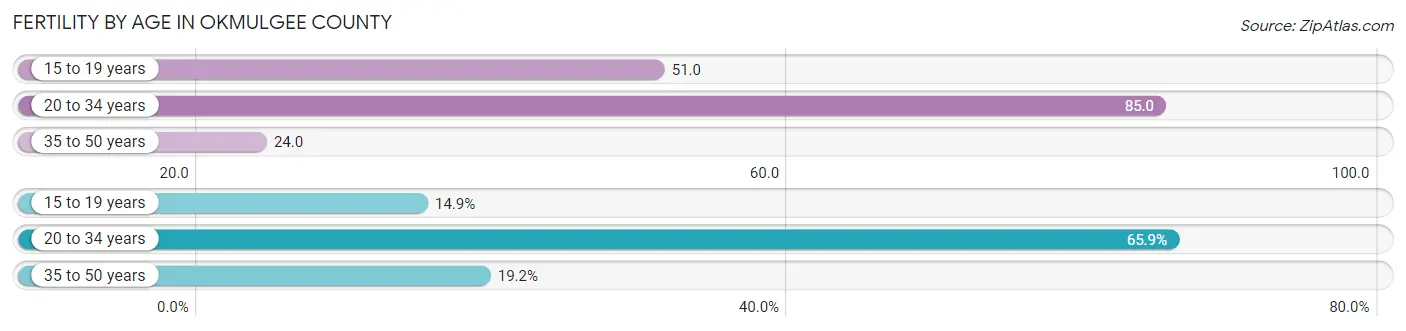
Fertility by Age in Okmulgee County
Average fertility rate in Okmulgee County is 54.0 births per 1,000 women. Women in the age bracket of 20 to 34 years have the highest fertility rate with 85.0 births per 1,000 women. Women in the age bracket of 20 to 34 years acount for 65.9% of all women with births.
| Age Bracket | Women with Births | Births / 1,000 Women |
| 15 to 19 years | 63 (14.9%) | 51.0 |
| 20 to 34 years | 278 (65.9%) | 85.0 |
| 35 to 50 years | 81 (19.2%) | 24.0 |
| Total | 422 (100.0%) | 54.0 |
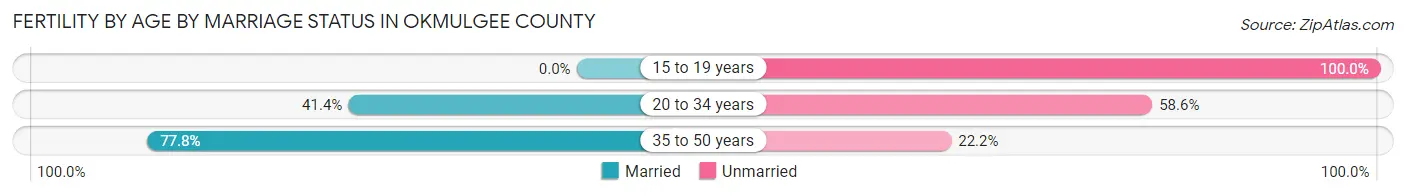
Fertility by Age by Marriage Status in Okmulgee County
42.2% of women with births (422) in Okmulgee County are married. The highest percentage of unmarried women with births falls into 15 to 19 years age bracket with 100.0% of them unmarried at the time of birth, while the lowest percentage of unmarried women with births belong to 35 to 50 years age bracket with 22.2% of them unmarried.
| Age Bracket | Married | Unmarried |
| 15 to 19 years | 0 (0.0%) | 63 (100.0%) |
| 20 to 34 years | 115 (41.4%) | 163 (58.6%) |
| 35 to 50 years | 63 (77.8%) | 18 (22.2%) |
| Total | 178 (42.2%) | 244 (57.8%) |
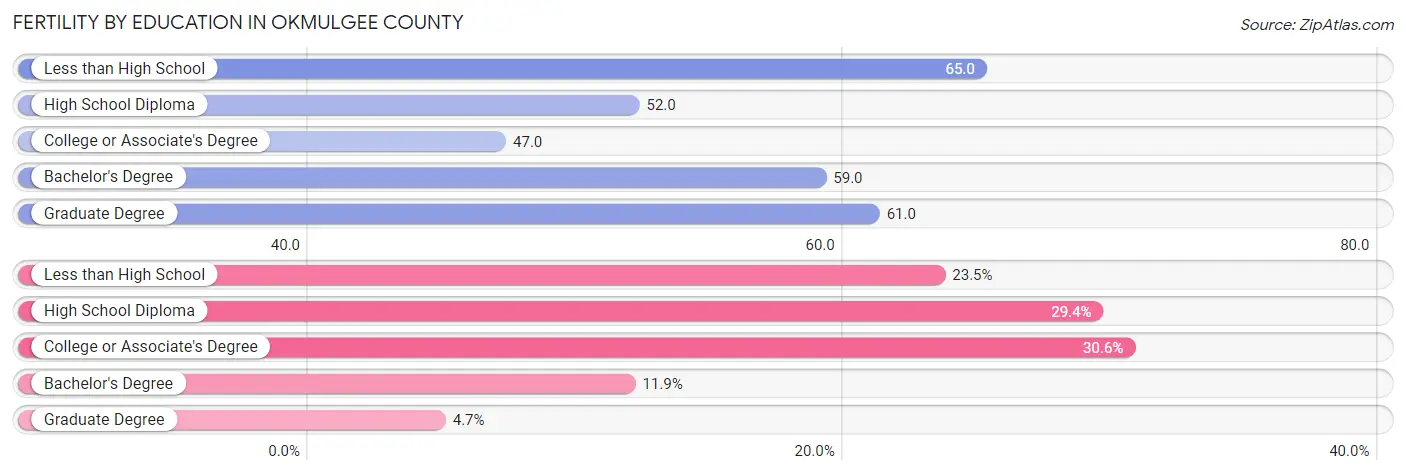
Fertility by Education in Okmulgee County
Average fertility rate in Okmulgee County is 54.0 births per 1,000 women. Women with the education attainment of less than high school have the highest fertility rate of 65.0 births per 1,000 women, while women with the education attainment of college or associate's degree have the lowest fertility at 47.0 births per 1,000 women. Women with the education attainment of college or associate's degree represent 30.6% of all women with births.
| Educational Attainment | Women with Births | Births / 1,000 Women |
| Less than High School | 99 (23.5%) | 65.0 |
| High School Diploma | 124 (29.4%) | 52.0 |
| College or Associate's Degree | 129 (30.6%) | 47.0 |
| Bachelor's Degree | 50 (11.8%) | 59.0 |
| Graduate Degree | 20 (4.7%) | 61.0 |
| Total | 422 (100.0%) | 54.0 |
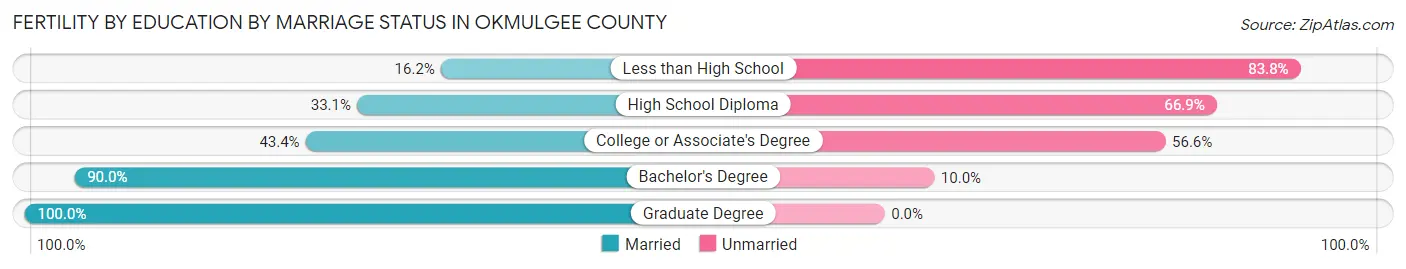
Fertility by Education by Marriage Status in Okmulgee County
57.8% of women with births in Okmulgee County are unmarried. Women with the educational attainment of graduate degree are most likely to be married with 100.0% of them married at childbirth, while women with the educational attainment of less than high school are least likely to be married with 83.8% of them unmarried at childbirth.
| Educational Attainment | Married | Unmarried |
| Less than High School | 16 (16.2%) | 83 (83.8%) |
| High School Diploma | 41 (33.1%) | 83 (66.9%) |
| College or Associate's Degree | 56 (43.4%) | 73 (56.6%) |
| Bachelor's Degree | 45 (90.0%) | 5 (10.0%) |
| Graduate Degree | 20 (100.0%) | 0 (0.0%) |
| Total | 178 (42.2%) | 244 (57.8%) |
Income in Okmulgee County
Income Overview in Okmulgee County
Per Capita Income in Okmulgee County is $27,821, while median incomes of families and households are $62,740 and $50,819 respectively.
| Characteristic | Number | Measure |
| Per Capita Income | 36,900 | $27,821 |
| Median Family Income | 9,258 | $62,740 |
| Mean Family Income | 9,258 | $79,184 |
| Median Household Income | 13,983 | $50,819 |
| Mean Household Income | 13,983 | $70,584 |
| Income Deficit | 9,258 | $9,789 |
| Wage / Income Gap (%) | 36,900 | 33.60% |
| Wage / Income Gap ($) | 36,900 | 66.40¢ per $1 |
| Gini / Inequality Index | 36,900 | 0.47 |
Earnings by Sex in Okmulgee County
Average Earnings in Okmulgee County are $32,538, $39,293 for men and $26,092 for women, a difference of 33.6%.
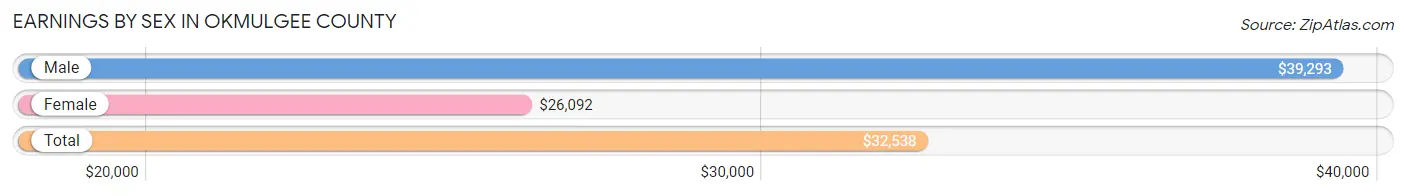
| Sex | Number | Average Earnings |
| Male | 8,816 (52.9%) | $39,293 |
| Female | 7,862 (47.1%) | $26,092 |
| Total | 16,678 (100.0%) | $32,538 |
Earnings by Sex by Income Bracket in Okmulgee County
The most common earnings brackets in Okmulgee County are $100,000+ for men (938 | 10.6%) and $30,000 to $34,999 for women (621 | 7.9%).
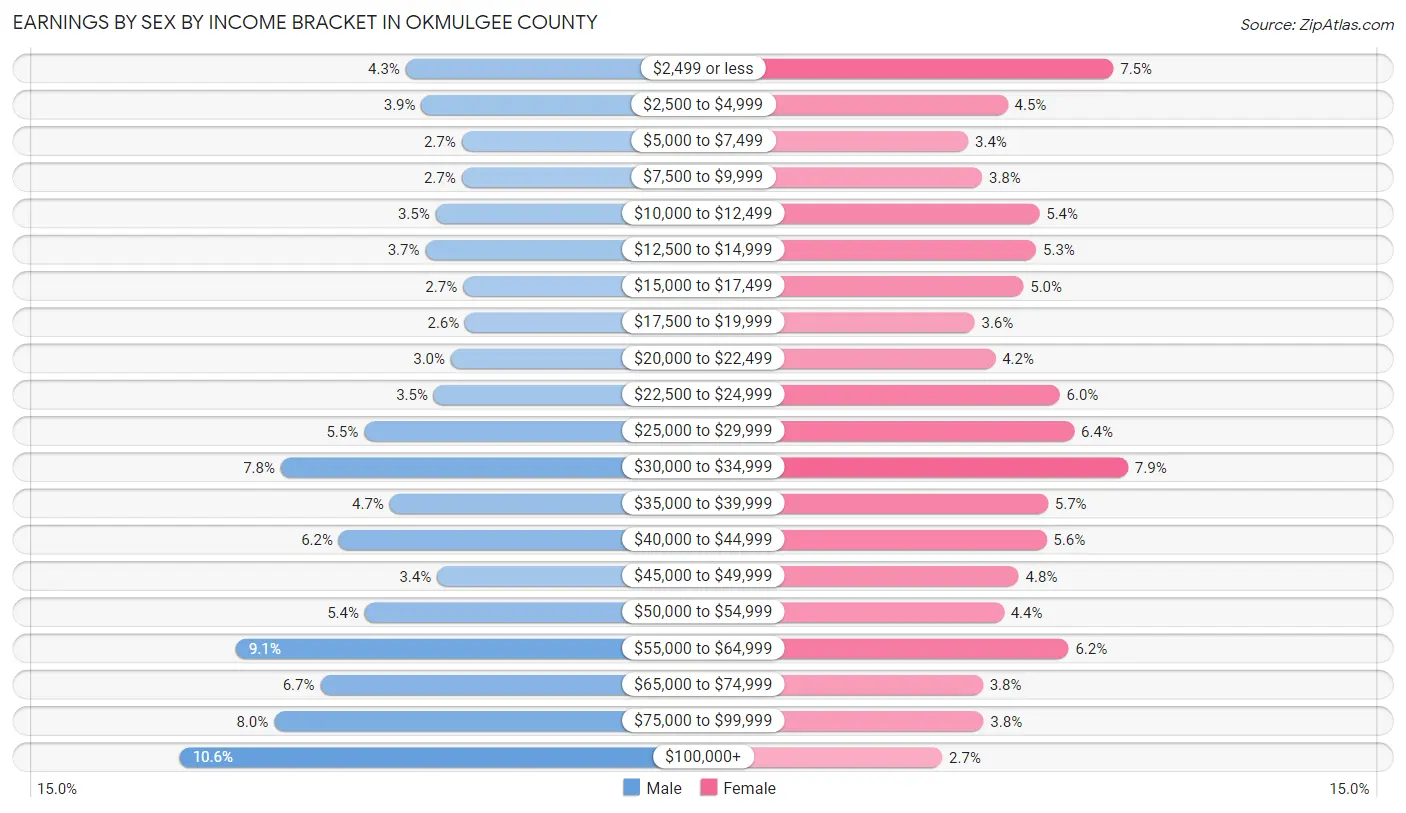
| Income | Male | Female |
| $2,499 or less | 378 (4.3%) | 589 (7.5%) |
| $2,500 to $4,999 | 339 (3.8%) | 355 (4.5%) |
| $5,000 to $7,499 | 240 (2.7%) | 268 (3.4%) |
| $7,500 to $9,999 | 240 (2.7%) | 299 (3.8%) |
| $10,000 to $12,499 | 304 (3.5%) | 425 (5.4%) |
| $12,500 to $14,999 | 330 (3.7%) | 418 (5.3%) |
| $15,000 to $17,499 | 236 (2.7%) | 390 (5.0%) |
| $17,500 to $19,999 | 231 (2.6%) | 282 (3.6%) |
| $20,000 to $22,499 | 266 (3.0%) | 328 (4.2%) |
| $22,500 to $24,999 | 309 (3.5%) | 470 (6.0%) |
| $25,000 to $29,999 | 481 (5.5%) | 502 (6.4%) |
| $30,000 to $34,999 | 688 (7.8%) | 621 (7.9%) |
| $35,000 to $39,999 | 418 (4.7%) | 444 (5.7%) |
| $40,000 to $44,999 | 544 (6.2%) | 441 (5.6%) |
| $45,000 to $49,999 | 301 (3.4%) | 380 (4.8%) |
| $50,000 to $54,999 | 480 (5.4%) | 347 (4.4%) |
| $55,000 to $64,999 | 799 (9.1%) | 490 (6.2%) |
| $65,000 to $74,999 | 590 (6.7%) | 300 (3.8%) |
| $75,000 to $99,999 | 704 (8.0%) | 302 (3.8%) |
| $100,000+ | 938 (10.6%) | 211 (2.7%) |
| Total | 8,816 (100.0%) | 7,862 (100.0%) |
Earnings by Sex by Educational Attainment in Okmulgee County
Average earnings in Okmulgee County are $45,071 for men and $31,282 for women, a difference of 30.6%. Men with an educational attainment of graduate degree enjoy the highest average annual earnings of $64,967, while those with less than high school education earn the least with $35,214. Women with an educational attainment of graduate degree earn the most with the average annual earnings of $55,850, while those with less than high school education have the smallest earnings of $19,712.
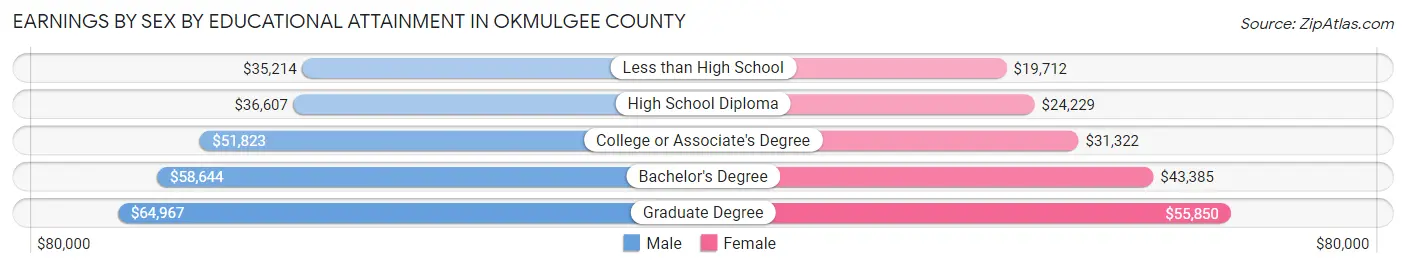
| Educational Attainment | Male Income | Female Income |
| Less than High School | $35,214 | $19,712 |
| High School Diploma | $36,607 | $24,229 |
| College or Associate's Degree | $51,823 | $31,322 |
| Bachelor's Degree | $58,644 | $43,385 |
| Graduate Degree | $64,967 | $55,850 |
| Total | $45,071 | $31,282 |
Family Income in Okmulgee County
Family Income Brackets in Okmulgee County
According to the Okmulgee County family income data, there are 1,787 families falling into the $50,000 to $74,999 income range, which is the most common income bracket and makes up 19.3% of all families. Conversely, the $10,000 to $14,999 income bracket is the least frequent group with only 333 families (3.6%) belonging to this category.
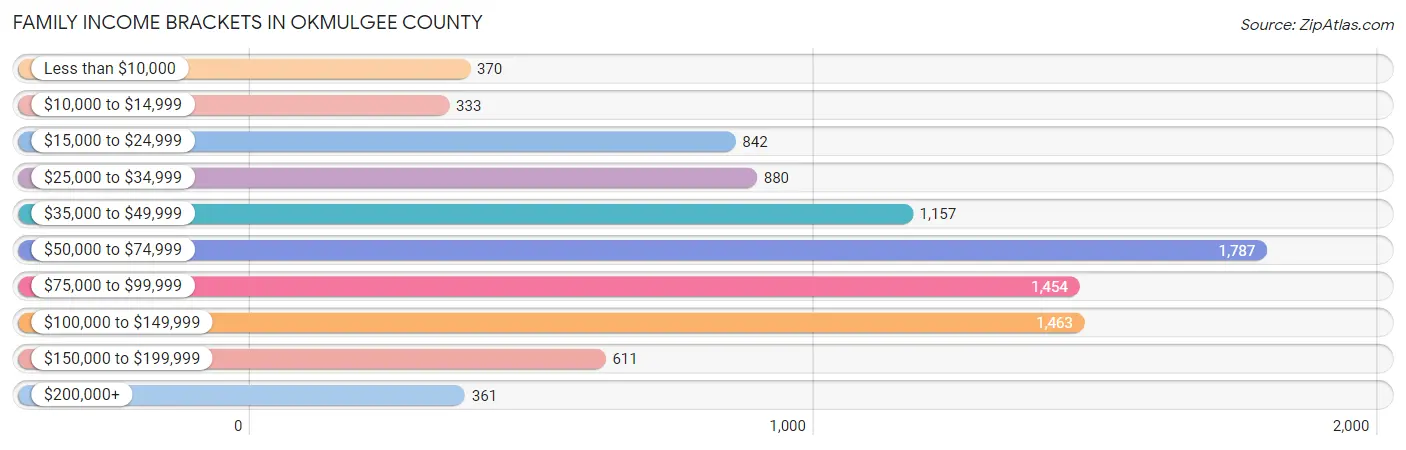
| Income Bracket | # Families | % Families |
| Less than $10,000 | 370 | 4.0% |
| $10,000 to $14,999 | 333 | 3.6% |
| $15,000 to $24,999 | 842 | 9.1% |
| $25,000 to $34,999 | 880 | 9.5% |
| $35,000 to $49,999 | 1,157 | 12.5% |
| $50,000 to $74,999 | 1,787 | 19.3% |
| $75,000 to $99,999 | 1,454 | 15.7% |
| $100,000 to $149,999 | 1,463 | 15.8% |
| $150,000 to $199,999 | 611 | 6.6% |
| $200,000+ | 361 | 3.9% |
Family Income by Famaliy Size in Okmulgee County
6-person families (307 | 3.3%) account for the highest median family income in Okmulgee County with $90,547 per family, while 2-person families (4,604 | 49.7%) have the highest median income of $28,372 per family member.
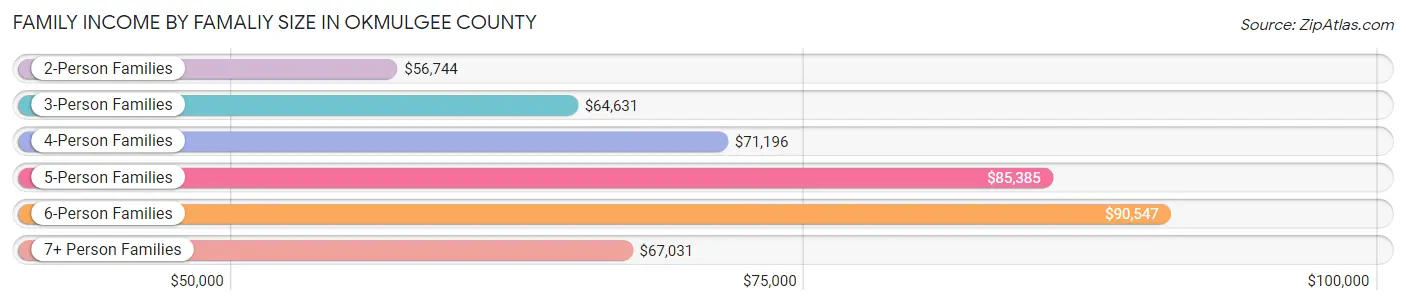
| Income Bracket | # Families | Median Income |
| 2-Person Families | 4,604 (49.7%) | $56,744 |
| 3-Person Families | 2,158 (23.3%) | $64,631 |
| 4-Person Families | 1,310 (14.1%) | $71,196 |
| 5-Person Families | 666 (7.2%) | $85,385 |
| 6-Person Families | 307 (3.3%) | $90,547 |
| 7+ Person Families | 213 (2.3%) | $67,031 |
| Total | 9,258 (100.0%) | $62,740 |
Family Income by Number of Earners in Okmulgee County
The median family income in Okmulgee County is $62,740, with families comprising 3+ earners (871) having the highest median family income of $116,094, while families with no earners (1,855) have the lowest median family income of $35,563, accounting for 9.4% and 20.0% of families, respectively.
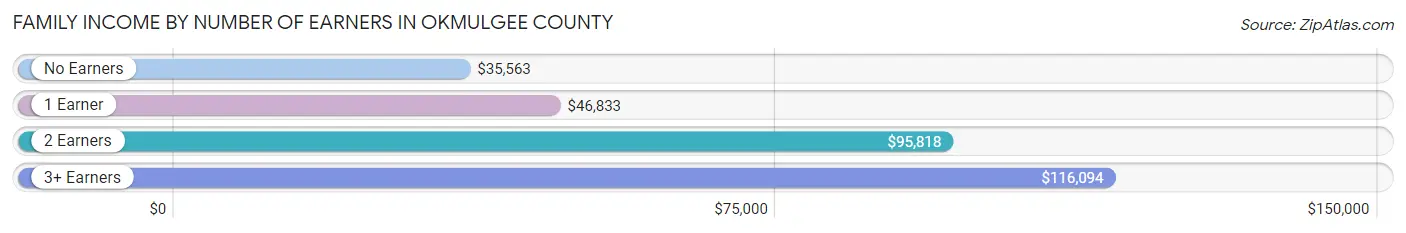
| Number of Earners | # Families | Median Income |
| No Earners | 1,855 (20.0%) | $35,563 |
| 1 Earner | 3,542 (38.3%) | $46,833 |
| 2 Earners | 2,990 (32.3%) | $95,818 |
| 3+ Earners | 871 (9.4%) | $116,094 |
| Total | 9,258 (100.0%) | $62,740 |
Household Income in Okmulgee County
Household Income Brackets in Okmulgee County
With 2,587 households falling in the category, the $50,000 to $74,999 income range is the most frequent in Okmulgee County, accounting for 18.5% of all households. In contrast, only 433 households (3.1%) fall into the $200,000+ income bracket, making it the least populous group.
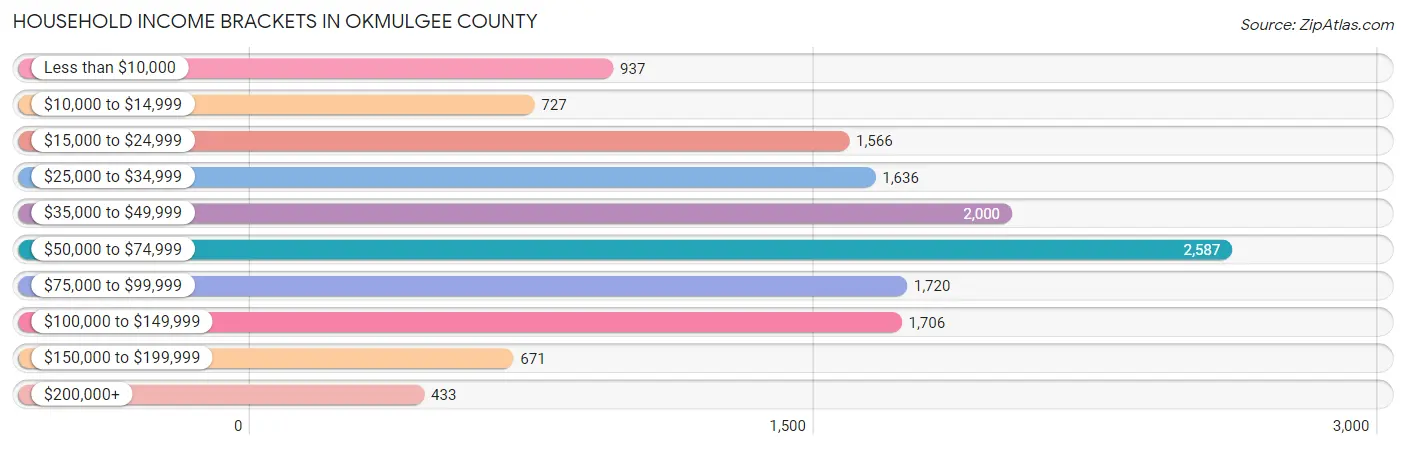
| Income Bracket | # Households | % Households |
| Less than $10,000 | 937 | 6.7% |
| $10,000 to $14,999 | 727 | 5.2% |
| $15,000 to $24,999 | 1,566 | 11.2% |
| $25,000 to $34,999 | 1,636 | 11.7% |
| $35,000 to $49,999 | 2,000 | 14.3% |
| $50,000 to $74,999 | 2,587 | 18.5% |
| $75,000 to $99,999 | 1,720 | 12.3% |
| $100,000 to $149,999 | 1,706 | 12.2% |
| $150,000 to $199,999 | 671 | 4.8% |
| $200,000+ | 433 | 3.1% |
Household Income by Householder Age in Okmulgee County
The median household income in Okmulgee County is $50,819, with the highest median household income of $59,243 found in the 25 to 44 years age bracket for the primary householder. A total of 3,783 households (27.1%) fall into this category. Meanwhile, the 65+ years age bracket for the primary householder has the lowest median household income of $41,244, with 4,559 households (32.6%) in this group.
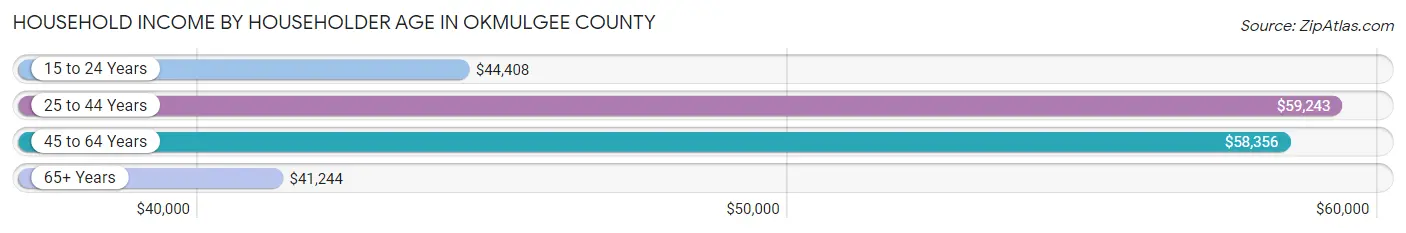
| Income Bracket | # Households | Median Income |
| 15 to 24 Years | 535 (3.8%) | $44,408 |
| 25 to 44 Years | 3,783 (27.1%) | $59,243 |
| 45 to 64 Years | 5,106 (36.5%) | $58,356 |
| 65+ Years | 4,559 (32.6%) | $41,244 |
| Total | 13,983 (100.0%) | $50,819 |
Poverty in Okmulgee County
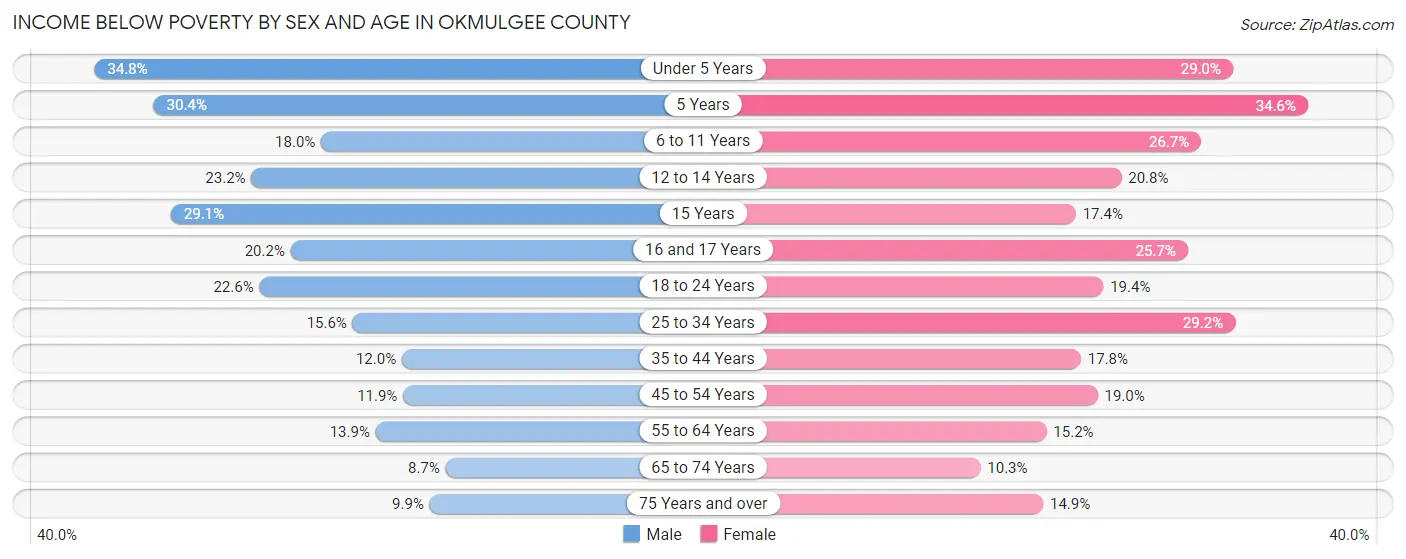
Income Below Poverty by Sex and Age in Okmulgee County
With 16.3% poverty level for males and 19.7% for females among the residents of Okmulgee County, under 5 year old males and 5 year old females are the most vulnerable to poverty, with 358 males (34.8%) and 73 females (34.6%) in their respective age groups living below the poverty level.
| Age Bracket | Male | Female |
| Under 5 Years | 358 (34.8%) | 288 (29.0%) |
| 5 Years | 80 (30.4%) | 73 (34.6%) |
| 6 to 11 Years | 249 (18.0%) | 320 (26.7%) |
| 12 to 14 Years | 204 (23.2%) | 183 (20.7%) |
| 15 Years | 95 (29.1%) | 37 (17.4%) |
| 16 and 17 Years | 100 (20.2%) | 132 (25.7%) |
| 18 to 24 Years | 315 (22.6%) | 296 (19.4%) |
| 25 to 34 Years | 327 (15.6%) | 609 (29.2%) |
| 35 to 44 Years | 249 (12.0%) | 369 (17.7%) |
| 45 to 54 Years | 253 (11.9%) | 387 (19.0%) |
| 55 to 64 Years | 322 (13.9%) | 382 (15.2%) |
| 65 to 74 Years | 153 (8.7%) | 218 (10.3%) |
| 75 Years and over | 116 (9.9%) | 244 (14.9%) |
| Total | 2,821 (16.3%) | 3,538 (19.7%) |
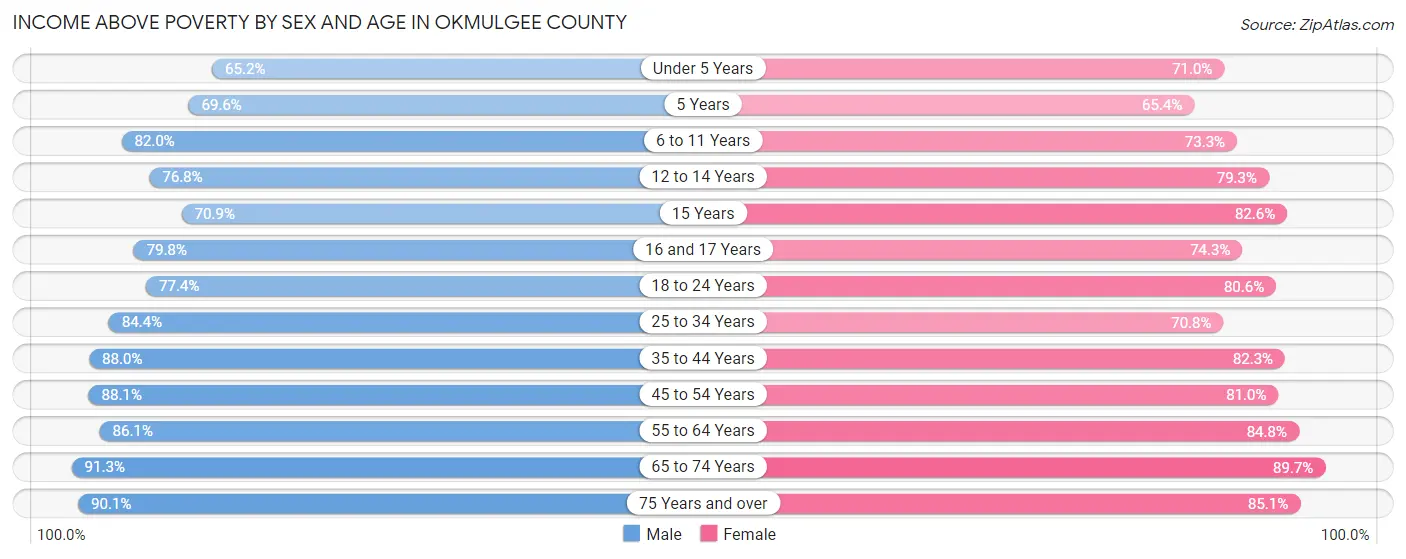
Income Above Poverty by Sex and Age in Okmulgee County
According to the poverty statistics in Okmulgee County, males aged 65 to 74 years and females aged 65 to 74 years are the age groups that are most secure financially, with 91.3% of males and 89.7% of females in these age groups living above the poverty line.
| Age Bracket | Male | Female |
| Under 5 Years | 670 (65.2%) | 704 (71.0%) |
| 5 Years | 183 (69.6%) | 138 (65.4%) |
| 6 to 11 Years | 1,136 (82.0%) | 880 (73.3%) |
| 12 to 14 Years | 677 (76.8%) | 699 (79.2%) |
| 15 Years | 231 (70.9%) | 176 (82.6%) |
| 16 and 17 Years | 394 (79.8%) | 382 (74.3%) |
| 18 to 24 Years | 1,081 (77.4%) | 1,229 (80.6%) |
| 25 to 34 Years | 1,764 (84.4%) | 1,477 (70.8%) |
| 35 to 44 Years | 1,829 (88.0%) | 1,710 (82.3%) |
| 45 to 54 Years | 1,875 (88.1%) | 1,651 (81.0%) |
| 55 to 64 Years | 1,989 (86.1%) | 2,133 (84.8%) |
| 65 to 74 Years | 1,598 (91.3%) | 1,900 (89.7%) |
| 75 Years and over | 1,053 (90.1%) | 1,389 (85.1%) |
| Total | 14,480 (83.7%) | 14,468 (80.3%) |
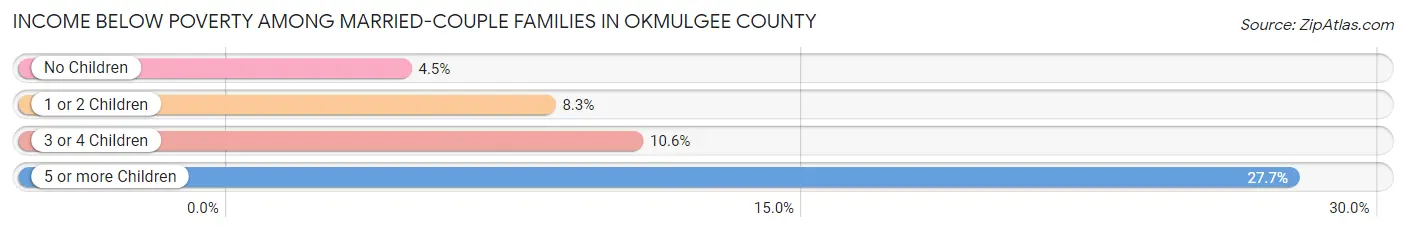
Income Below Poverty Among Married-Couple Families in Okmulgee County
The poverty statistics for married-couple families in Okmulgee County show that 6.5% or 408 of the total 6,326 families live below the poverty line. Families with 5 or more children have the highest poverty rate of 27.7%, comprising of 28 families. On the other hand, families with no children have the lowest poverty rate of 4.5%, which includes 179 families.
| Children | Above Poverty | Below Poverty |
| No Children | 3,772 (95.5%) | 179 (4.5%) |
| 1 or 2 Children | 1,583 (91.7%) | 143 (8.3%) |
| 3 or 4 Children | 490 (89.4%) | 58 (10.6%) |
| 5 or more Children | 73 (72.3%) | 28 (27.7%) |
| Total | 5,918 (93.5%) | 408 (6.5%) |
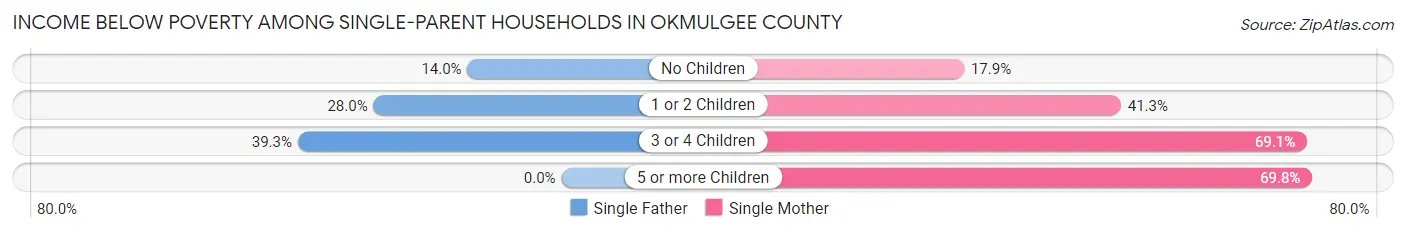
Income Below Poverty Among Single-Parent Households in Okmulgee County
According to the poverty data in Okmulgee County, 22.1% or 203 single-father households and 35.8% or 722 single-mother households are living below the poverty line. Among single-father households, those with 3 or 4 children have the highest poverty rate, with 44 households (39.3%) experiencing poverty. Likewise, among single-mother households, those with 5 or more children have the highest poverty rate, with 37 households (69.8%) falling below the poverty line.
| Children | Single Father | Single Mother |
| No Children | 59 (14.0%) | 132 (17.9%) |
| 1 or 2 Children | 100 (28.0%) | 437 (41.3%) |
| 3 or 4 Children | 44 (39.3%) | 116 (69.1%) |
| 5 or more Children | 0 (0.0%) | 37 (69.8%) |
| Total | 203 (22.1%) | 722 (35.8%) |
Income Below Poverty Among Married-Couple vs Single-Parent Households in Okmulgee County
The poverty data for Okmulgee County shows that 408 of the married-couple family households (6.5%) and 925 of the single-parent households (31.6%) are living below the poverty level. Within the married-couple family households, those with 5 or more children have the highest poverty rate, with 28 households (27.7%) falling below the poverty line. Among the single-parent households, those with 3 or 4 children have the highest poverty rate, with 160 household (57.1%) living below poverty.
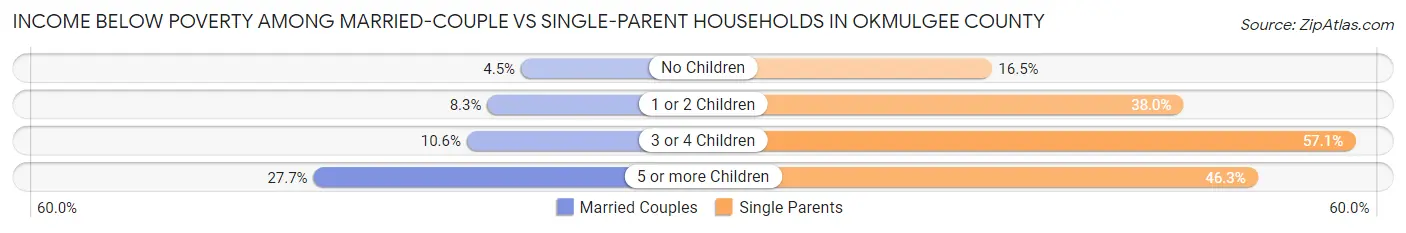
| Children | Married-Couple Families | Single-Parent Households |
| No Children | 179 (4.5%) | 191 (16.5%) |
| 1 or 2 Children | 143 (8.3%) | 537 (38.0%) |
| 3 or 4 Children | 58 (10.6%) | 160 (57.1%) |
| 5 or more Children | 28 (27.7%) | 37 (46.3%) |
| Total | 408 (6.5%) | 925 (31.6%) |
Employment Characteristics in Okmulgee County
Employment by Class of Employer in Okmulgee County
Among the 14,677 employed individuals in Okmulgee County, private company employees (9,428 | 64.2%), local government employees (1,574 | 10.7%), and state government employees (930 | 6.3%) make up the most common classes of employment.
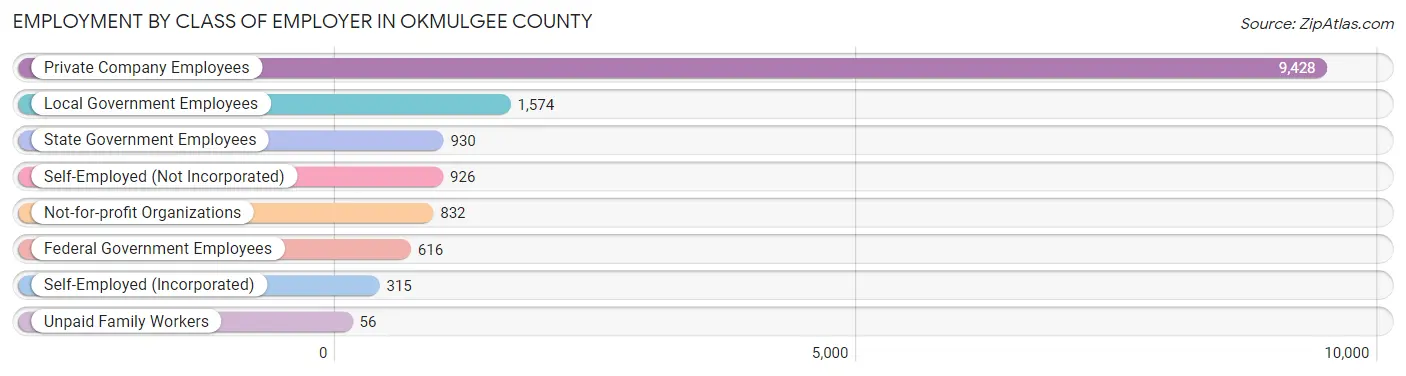
| Employer Class | # Employees | % Employees |
| Private Company Employees | 9,428 | 64.2% |
| Self-Employed (Incorporated) | 315 | 2.1% |
| Self-Employed (Not Incorporated) | 926 | 6.3% |
| Not-for-profit Organizations | 832 | 5.7% |
| Local Government Employees | 1,574 | 10.7% |
| State Government Employees | 930 | 6.3% |
| Federal Government Employees | 616 | 4.2% |
| Unpaid Family Workers | 56 | 0.4% |
| Total | 14,677 | 100.0% |
Employment Status by Age in Okmulgee County
According to the labor force statistics for Okmulgee County, out of the total population over 16 years of age (29,254), 55.2% or 16,148 individuals are in the labor force, with 7.2% or 1,163 of them unemployed. The age group with the highest labor force participation rate is 35 to 44 years, with 81.3% or 3,433 individuals in the labor force. Within the labor force, the 16 to 19 years age range has the highest percentage of unemployed individuals, with 16.5% or 142 of them being unemployed.
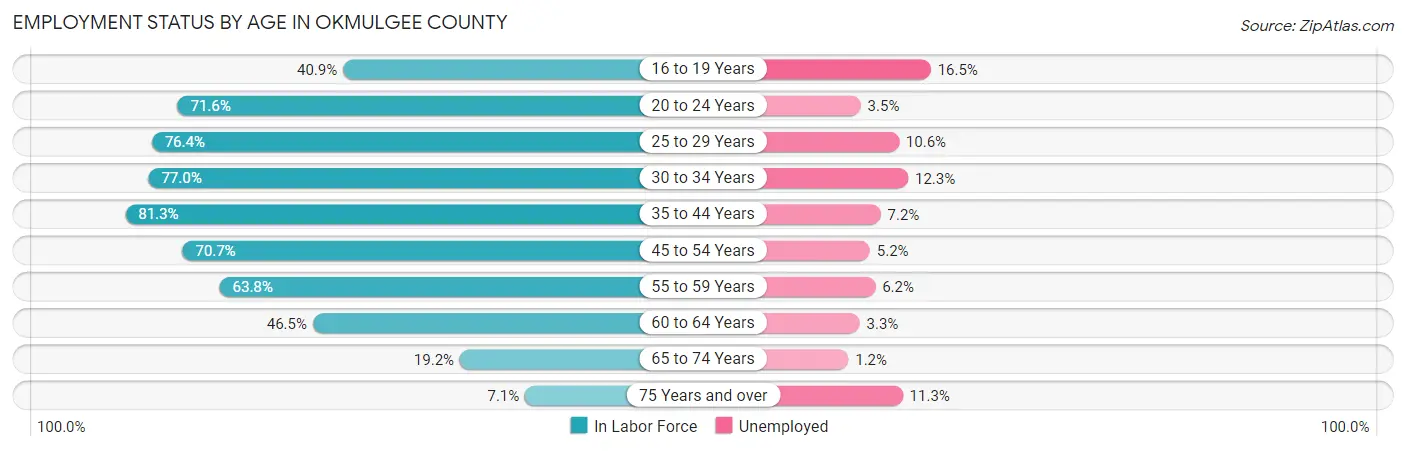
| Age Bracket | In Labor Force | Unemployed |
| 16 to 19 Years | 860 (40.9%) | 142 (16.5%) |
| 20 to 24 Years | 1,767 (71.6%) | 62 (3.5%) |
| 25 to 29 Years | 1,699 (76.4%) | 180 (10.6%) |
| 30 to 34 Years | 1,726 (77.0%) | 212 (12.3%) |
| 35 to 44 Years | 3,433 (81.3%) | 247 (7.2%) |
| 45 to 54 Years | 3,021 (70.7%) | 157 (5.2%) |
| 55 to 59 Years | 1,444 (63.8%) | 90 (6.2%) |
| 60 to 64 Years | 1,239 (46.5%) | 41 (3.3%) |
| 65 to 74 Years | 753 (19.2%) | 9 (1.2%) |
| 75 Years and over | 204 (7.1%) | 23 (11.3%) |
| Total | 16,148 (55.2%) | 1,163 (7.2%) |
Employment Status by Educational Attainment in Okmulgee County
According to labor force statistics for Okmulgee County, 70.2% of individuals (12,558) out of the total population between 25 and 64 years of age (17,889) are in the labor force, with 7.4% or 929 of them being unemployed. The group with the highest labor force participation rate are those with the educational attainment of bachelor's degree or higher, with 85.8% or 2,260 individuals in the labor force. Within the labor force, individuals with less than high school education have the highest percentage of unemployment, with 12.2% or 153 of them being unemployed.
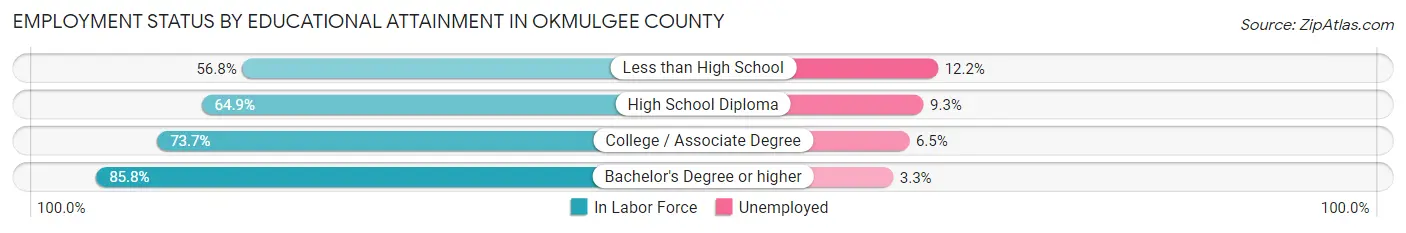
| Educational Attainment | In Labor Force | Unemployed |
| Less than High School | 1,256 (56.8%) | 270 (12.2%) |
| High School Diploma | 4,120 (64.9%) | 590 (9.3%) |
| College / Associate Degree | 4,934 (73.7%) | 435 (6.5%) |
| Bachelor's Degree or higher | 2,260 (85.8%) | 87 (3.3%) |
| Total | 12,558 (70.2%) | 1,324 (7.4%) |
Employment Occupations by Sex in Okmulgee County
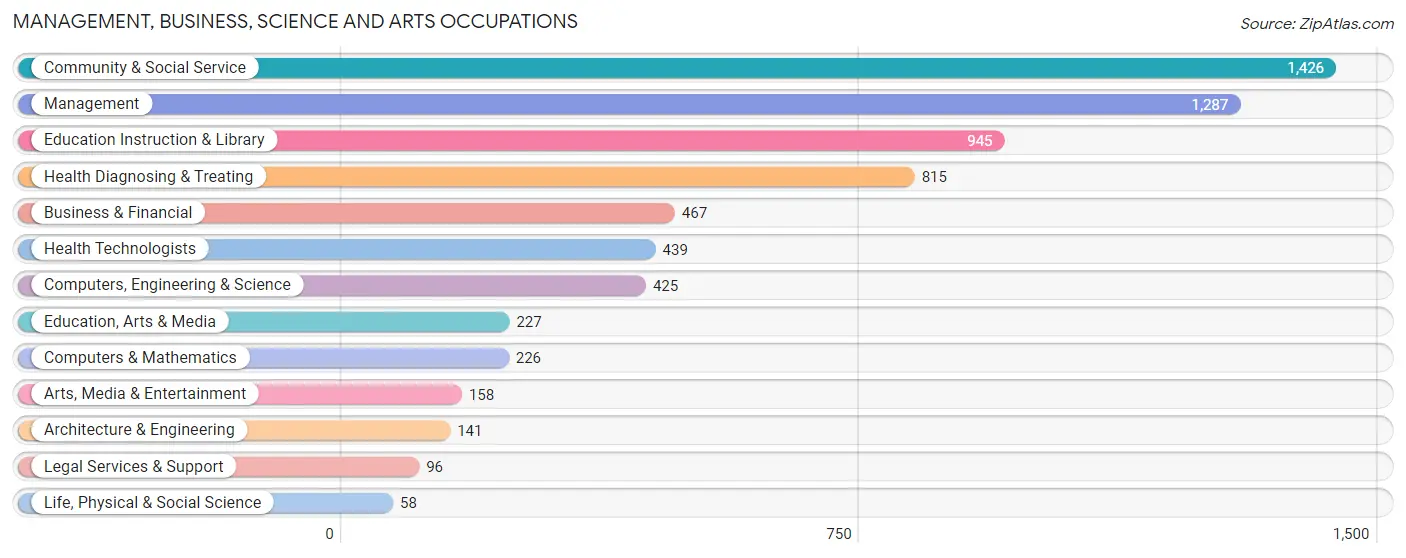
Management, Business, Science and Arts Occupations
The most common Management, Business, Science and Arts occupations in Okmulgee County are Community & Social Service (1,426 | 9.5%), Management (1,287 | 8.6%), Education Instruction & Library (945 | 6.3%), Health Diagnosing & Treating (815 | 5.4%), and Business & Financial (467 | 3.1%).
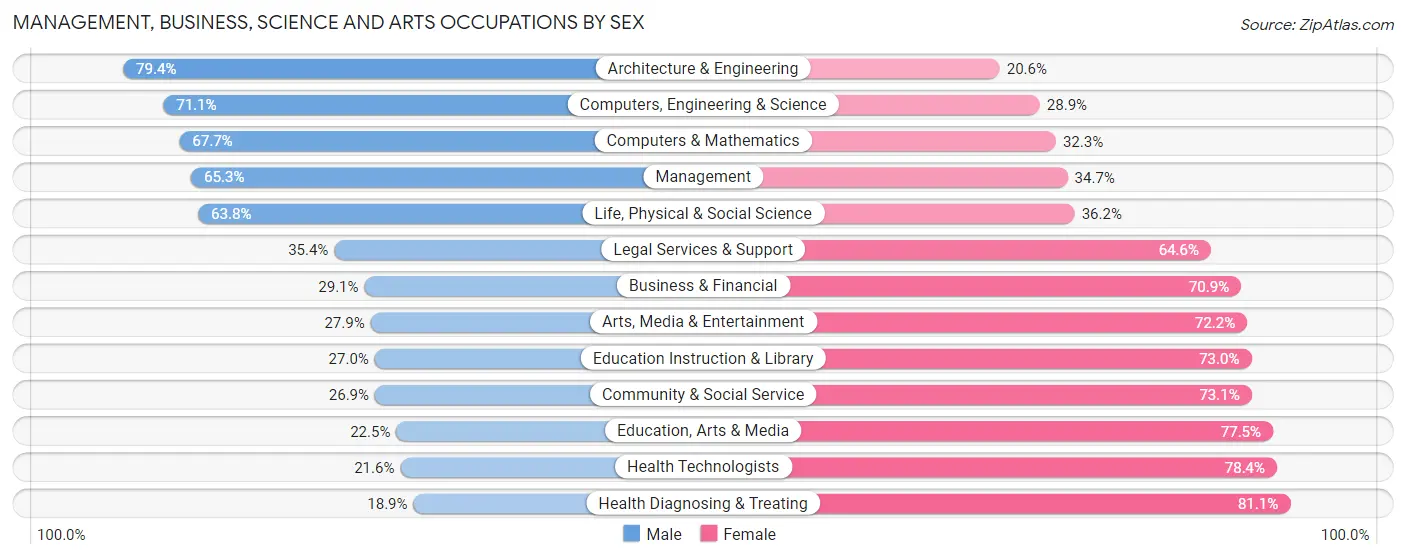
Management, Business, Science and Arts Occupations by Sex
Within the Management, Business, Science and Arts occupations in Okmulgee County, the most male-oriented occupations are Architecture & Engineering (79.4%), Computers, Engineering & Science (71.1%), and Computers & Mathematics (67.7%), while the most female-oriented occupations are Health Diagnosing & Treating (81.1%), Health Technologists (78.4%), and Education, Arts & Media (77.5%).
| Occupation | Male | Female |
| Management | 840 (65.3%) | 447 (34.7%) |
| Business & Financial | 136 (29.1%) | 331 (70.9%) |
| Computers, Engineering & Science | 302 (71.1%) | 123 (28.9%) |
| Computers & Mathematics | 153 (67.7%) | 73 (32.3%) |
| Architecture & Engineering | 112 (79.4%) | 29 (20.6%) |
| Life, Physical & Social Science | 37 (63.8%) | 21 (36.2%) |
| Community & Social Service | 384 (26.9%) | 1,042 (73.1%) |
| Education, Arts & Media | 51 (22.5%) | 176 (77.5%) |
| Legal Services & Support | 34 (35.4%) | 62 (64.6%) |
| Education Instruction & Library | 255 (27.0%) | 690 (73.0%) |
| Arts, Media & Entertainment | 44 (27.9%) | 114 (72.2%) |
| Health Diagnosing & Treating | 154 (18.9%) | 661 (81.1%) |
| Health Technologists | 95 (21.6%) | 344 (78.4%) |
| Total (Category) | 1,816 (41.1%) | 2,604 (58.9%) |
| Total (Overall) | 7,862 (52.6%) | 7,094 (47.4%) |
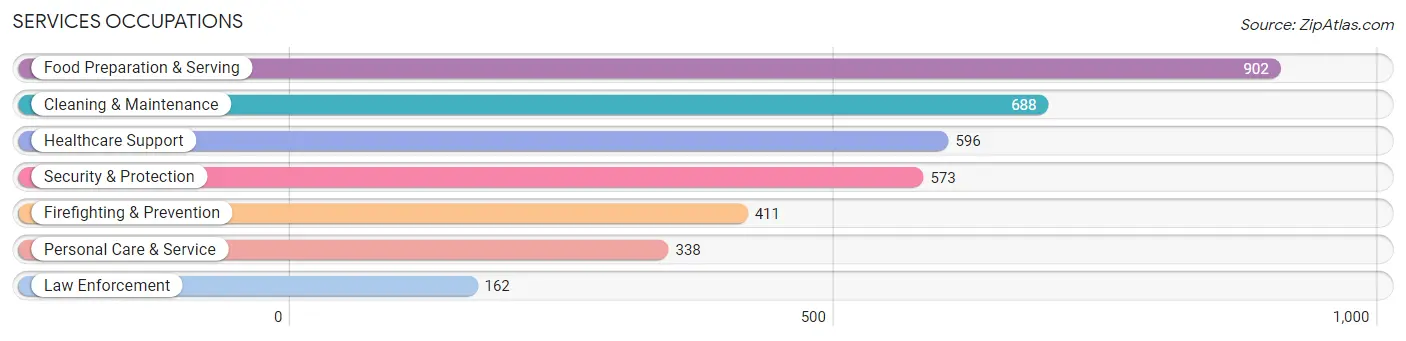
Services Occupations
The most common Services occupations in Okmulgee County are Food Preparation & Serving (902 | 6.0%), Cleaning & Maintenance (688 | 4.6%), Healthcare Support (596 | 4.0%), Security & Protection (573 | 3.8%), and Firefighting & Prevention (411 | 2.8%).
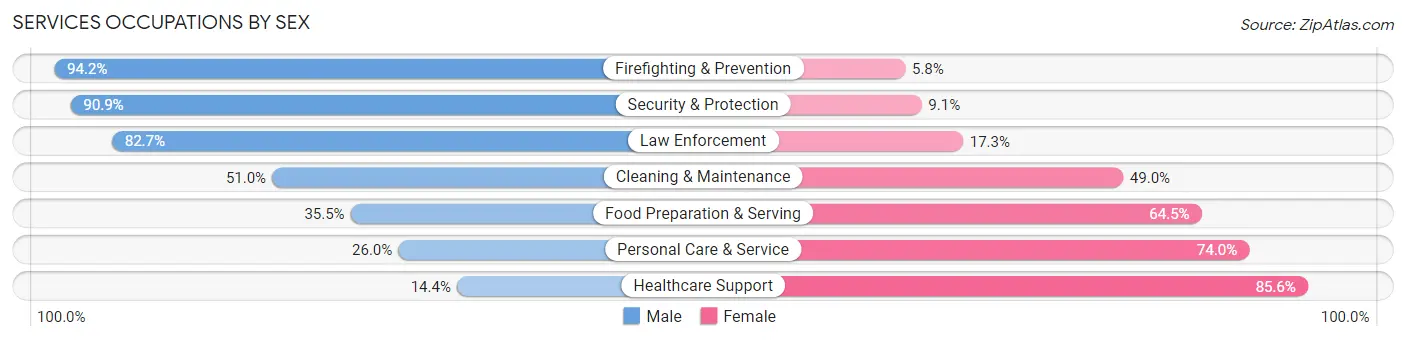
Services Occupations by Sex
Within the Services occupations in Okmulgee County, the most male-oriented occupations are Firefighting & Prevention (94.2%), Security & Protection (90.9%), and Law Enforcement (82.7%), while the most female-oriented occupations are Healthcare Support (85.6%), Personal Care & Service (74.0%), and Food Preparation & Serving (64.5%).
| Occupation | Male | Female |
| Healthcare Support | 86 (14.4%) | 510 (85.6%) |
| Security & Protection | 521 (90.9%) | 52 (9.1%) |
| Firefighting & Prevention | 387 (94.2%) | 24 (5.8%) |
| Law Enforcement | 134 (82.7%) | 28 (17.3%) |
| Food Preparation & Serving | 320 (35.5%) | 582 (64.5%) |
| Cleaning & Maintenance | 351 (51.0%) | 337 (49.0%) |
| Personal Care & Service | 88 (26.0%) | 250 (74.0%) |
| Total (Category) | 1,366 (44.1%) | 1,731 (55.9%) |
| Total (Overall) | 7,862 (52.6%) | 7,094 (47.4%) |
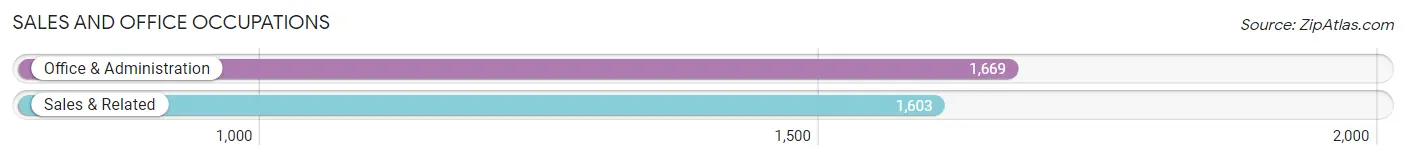
Sales and Office Occupations
The most common Sales and Office occupations in Okmulgee County are Office & Administration (1,669 | 11.2%), and Sales & Related (1,603 | 10.7%).
Sales and Office Occupations by Sex
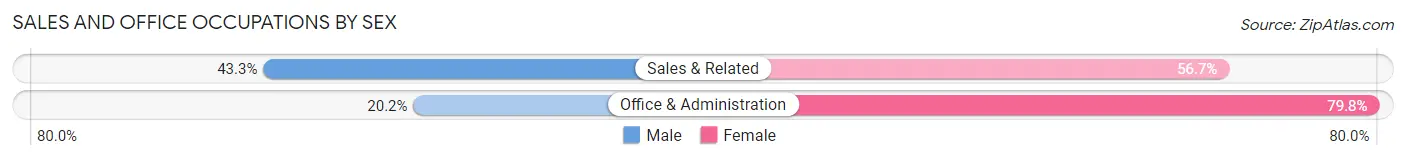
| Occupation | Male | Female |
| Sales & Related | 694 (43.3%) | 909 (56.7%) |
| Office & Administration | 337 (20.2%) | 1,332 (79.8%) |
| Total (Category) | 1,031 (31.5%) | 2,241 (68.5%) |
| Total (Overall) | 7,862 (52.6%) | 7,094 (47.4%) |
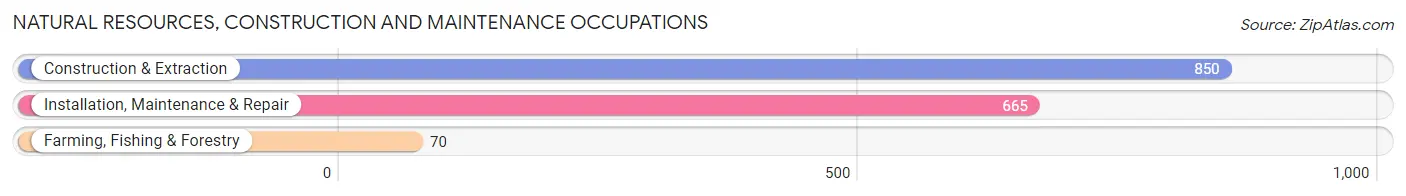
Natural Resources, Construction and Maintenance Occupations
The most common Natural Resources, Construction and Maintenance occupations in Okmulgee County are Construction & Extraction (850 | 5.7%), Installation, Maintenance & Repair (665 | 4.4%), and Farming, Fishing & Forestry (70 | 0.5%).
Natural Resources, Construction and Maintenance Occupations by Sex
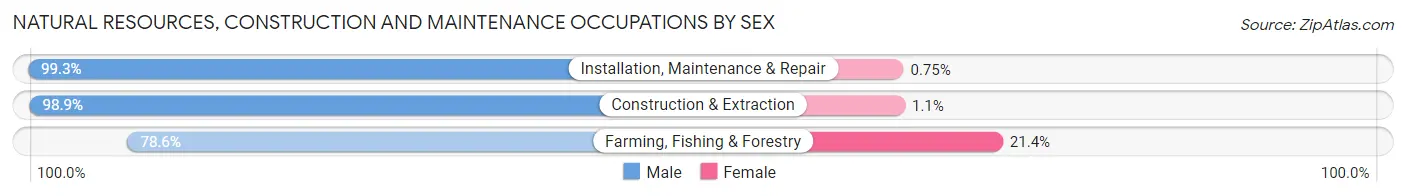
| Occupation | Male | Female |
| Farming, Fishing & Forestry | 55 (78.6%) | 15 (21.4%) |
| Construction & Extraction | 841 (98.9%) | 9 (1.1%) |
| Installation, Maintenance & Repair | 660 (99.3%) | 5 (0.7%) |
| Total (Category) | 1,556 (98.2%) | 29 (1.8%) |
| Total (Overall) | 7,862 (52.6%) | 7,094 (47.4%) |
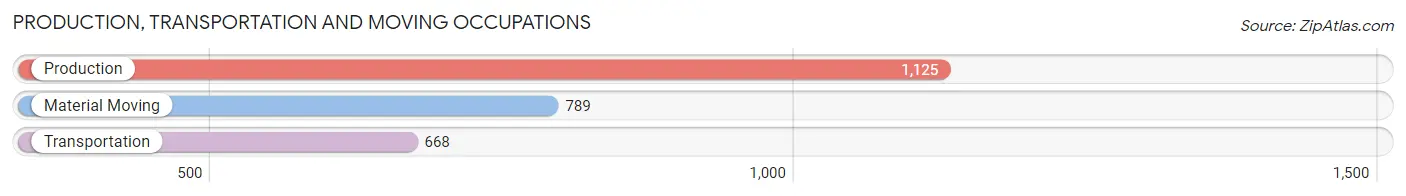
Production, Transportation and Moving Occupations
The most common Production, Transportation and Moving occupations in Okmulgee County are Production (1,125 | 7.5%), Material Moving (789 | 5.3%), and Transportation (668 | 4.5%).
Production, Transportation and Moving Occupations by Sex
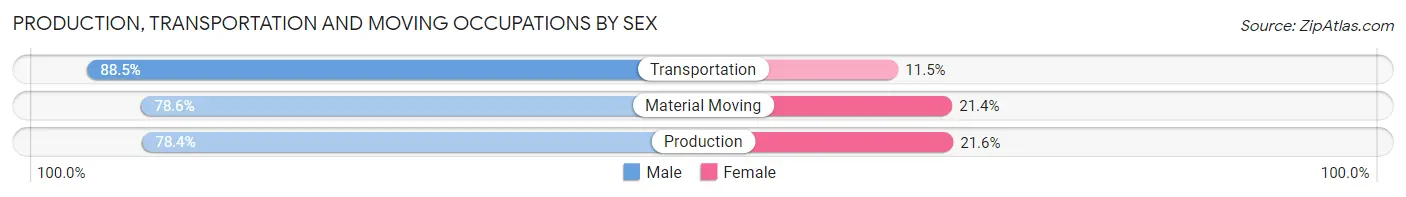
| Occupation | Male | Female |
| Production | 882 (78.4%) | 243 (21.6%) |
| Transportation | 591 (88.5%) | 77 (11.5%) |
| Material Moving | 620 (78.6%) | 169 (21.4%) |
| Total (Category) | 2,093 (81.1%) | 489 (18.9%) |
| Total (Overall) | 7,862 (52.6%) | 7,094 (47.4%) |
Employment Industries by Sex in Okmulgee County
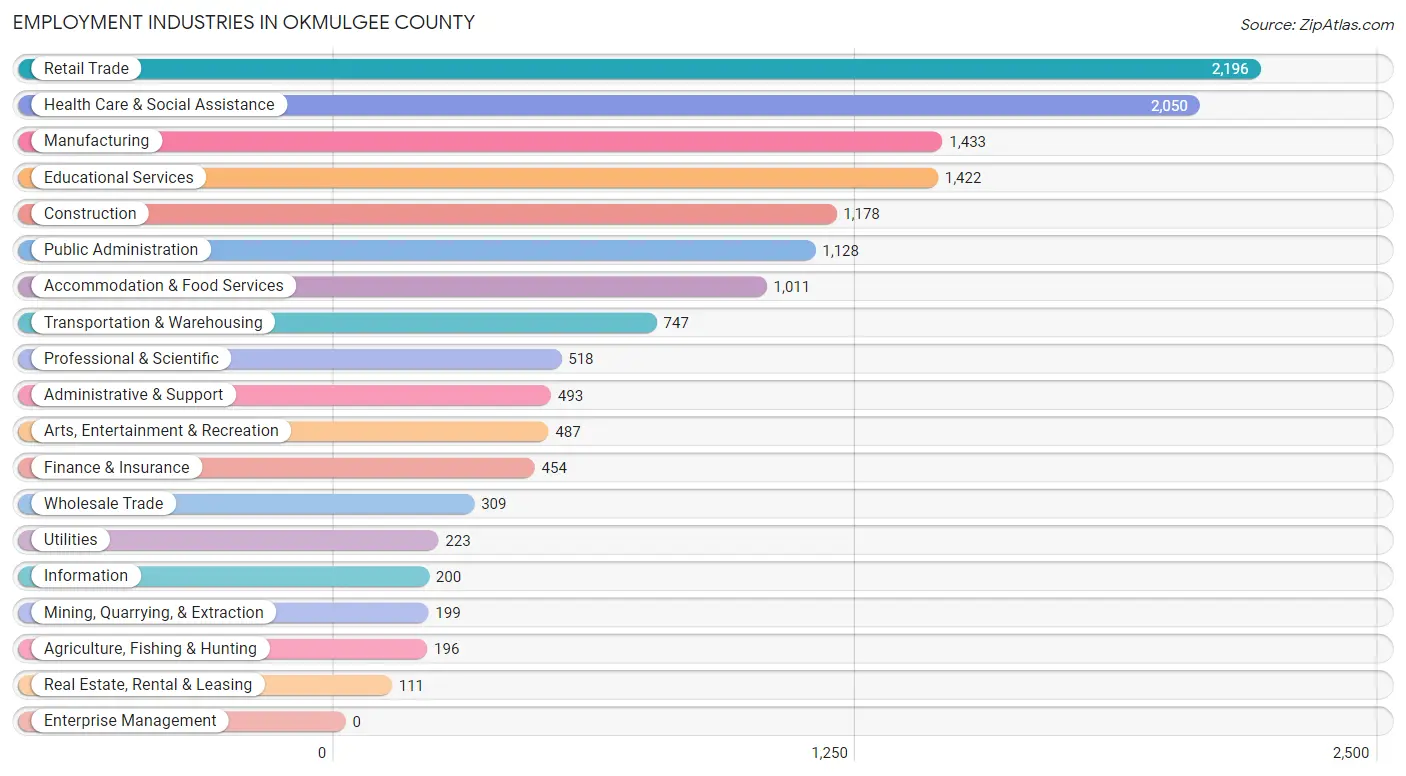
Employment Industries in Okmulgee County
The major employment industries in Okmulgee County include Retail Trade (2,196 | 14.7%), Health Care & Social Assistance (2,050 | 13.7%), Manufacturing (1,433 | 9.6%), Educational Services (1,422 | 9.5%), and Construction (1,178 | 7.9%).
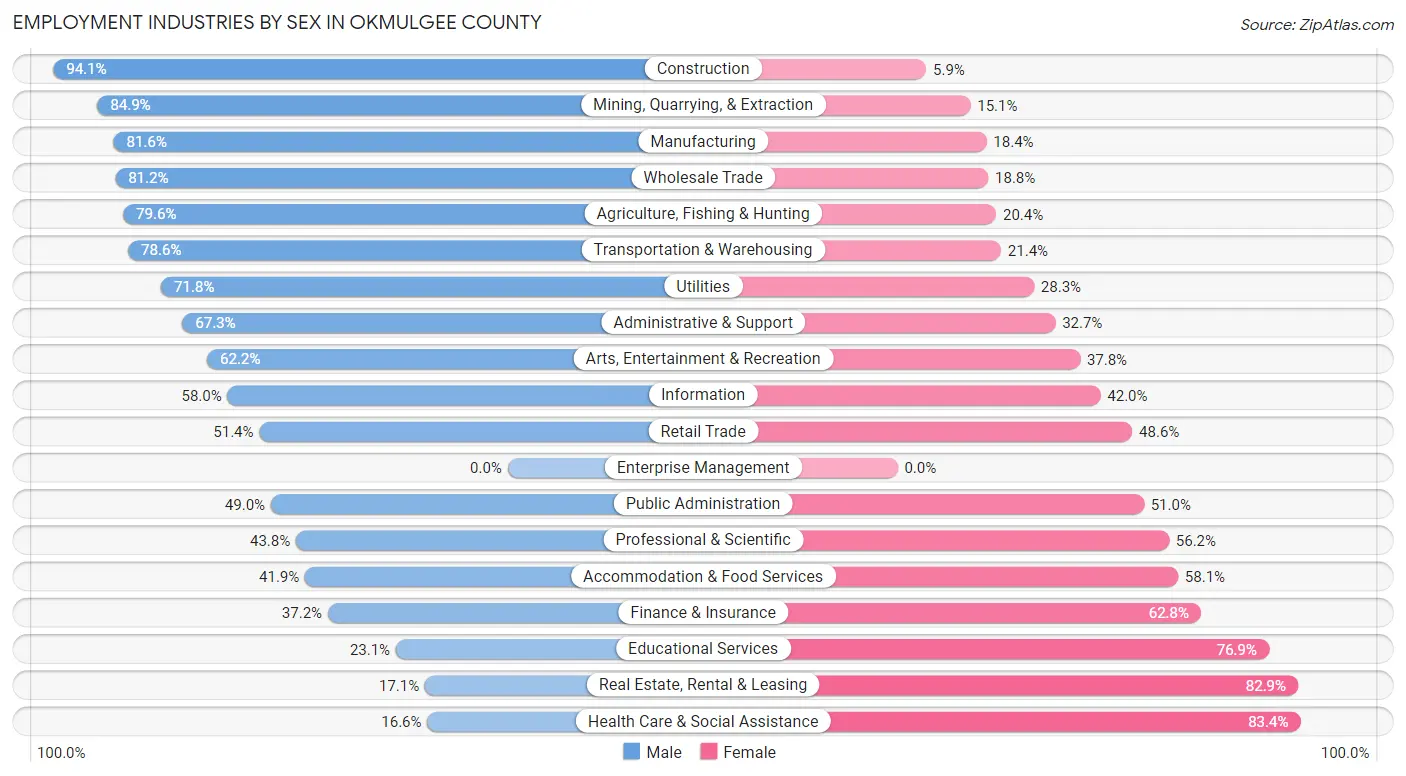
Employment Industries by Sex in Okmulgee County
The Okmulgee County industries that see more men than women are Construction (94.1%), Mining, Quarrying, & Extraction (84.9%), and Manufacturing (81.6%), whereas the industries that tend to have a higher number of women are Health Care & Social Assistance (83.4%), Real Estate, Rental & Leasing (82.9%), and Educational Services (76.9%).
| Industry | Male | Female |
| Agriculture, Fishing & Hunting | 156 (79.6%) | 40 (20.4%) |
| Mining, Quarrying, & Extraction | 169 (84.9%) | 30 (15.1%) |
| Construction | 1,108 (94.1%) | 70 (5.9%) |
| Manufacturing | 1,169 (81.6%) | 264 (18.4%) |
| Wholesale Trade | 251 (81.2%) | 58 (18.8%) |
| Retail Trade | 1,129 (51.4%) | 1,067 (48.6%) |
| Transportation & Warehousing | 587 (78.6%) | 160 (21.4%) |
| Utilities | 160 (71.8%) | 63 (28.2%) |
| Information | 116 (58.0%) | 84 (42.0%) |
| Finance & Insurance | 169 (37.2%) | 285 (62.8%) |
| Real Estate, Rental & Leasing | 19 (17.1%) | 92 (82.9%) |
| Professional & Scientific | 227 (43.8%) | 291 (56.2%) |
| Enterprise Management | 0 (0.0%) | 0 (0.0%) |
| Administrative & Support | 332 (67.3%) | 161 (32.7%) |
| Educational Services | 329 (23.1%) | 1,093 (76.9%) |
| Health Care & Social Assistance | 341 (16.6%) | 1,709 (83.4%) |
| Arts, Entertainment & Recreation | 303 (62.2%) | 184 (37.8%) |
| Accommodation & Food Services | 424 (41.9%) | 587 (58.1%) |
| Public Administration | 553 (49.0%) | 575 (51.0%) |
| Total | 7,862 (52.6%) | 7,094 (47.4%) |
Education in Okmulgee County
School Enrollment in Okmulgee County
The most common levels of schooling among the 8,801 students in Okmulgee County are middle school (2,270 | 25.8%), high school (1,797 | 20.4%), and elementary school (1,775 | 20.2%).
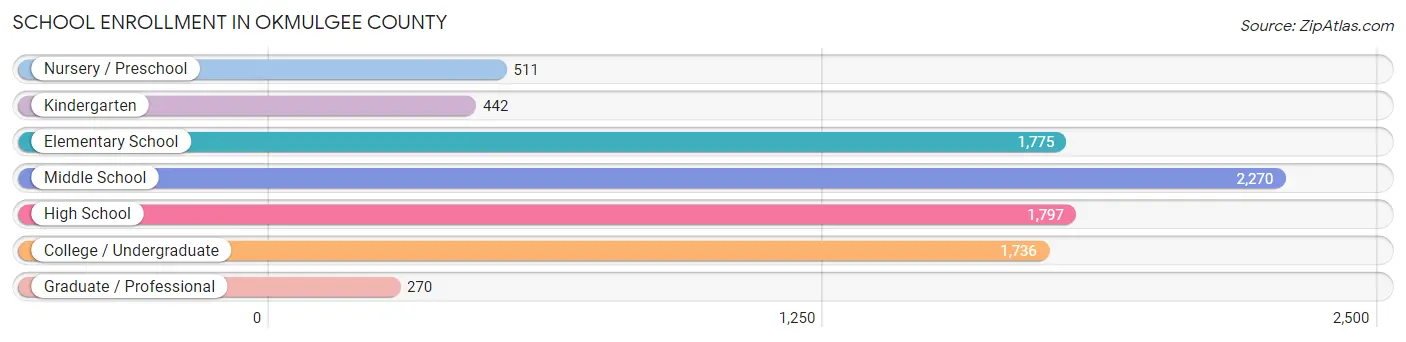
| School Level | # Students | % Students |
| Nursery / Preschool | 511 | 5.8% |
| Kindergarten | 442 | 5.0% |
| Elementary School | 1,775 | 20.2% |
| Middle School | 2,270 | 25.8% |
| High School | 1,797 | 20.4% |
| College / Undergraduate | 1,736 | 19.7% |
| Graduate / Professional | 270 | 3.1% |
| Total | 8,801 | 100.0% |
School Enrollment by Age by Funding Source in Okmulgee County
Out of a total of 8,801 students who are enrolled in schools in Okmulgee County, 959 (10.9%) attend a private institution, while the remaining 7,842 (89.1%) are enrolled in public schools. The age group of 35 years and over has the highest likelihood of being enrolled in private schools, with 115 (26.7% in the age bracket) enrolled. Conversely, the age group of 20 to 24 year olds has the lowest likelihood of being enrolled in a private school, with 604 (95.0% in the age bracket) attending a public institution.
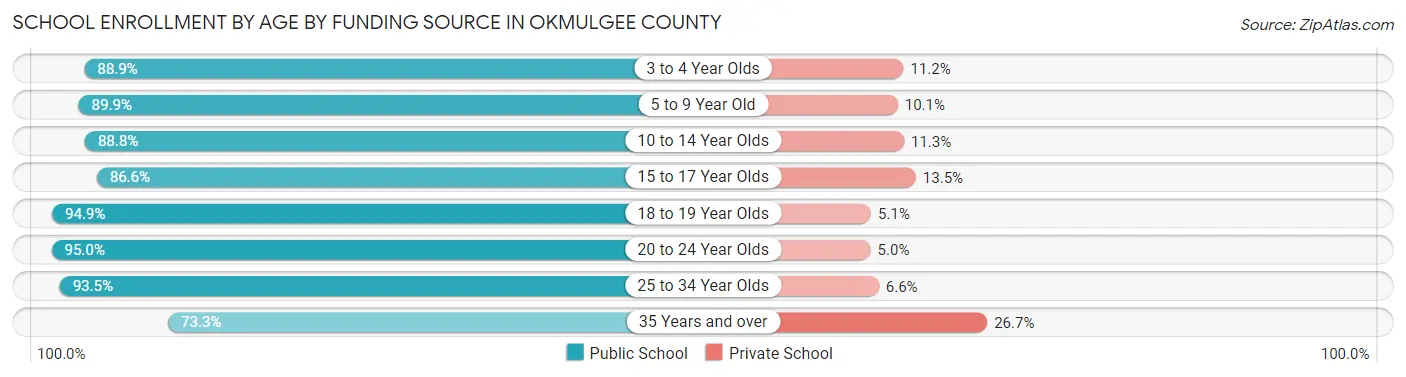
| Age Bracket | Public School | Private School |
| 3 to 4 Year Olds | 271 (88.8%) | 34 (11.2%) |
| 5 to 9 Year Old | 1,856 (89.9%) | 208 (10.1%) |
| 10 to 14 Year Olds | 2,343 (88.7%) | 297 (11.3%) |
| 15 to 17 Year Olds | 1,306 (86.6%) | 203 (13.5%) |
| 18 to 19 Year Olds | 778 (94.9%) | 42 (5.1%) |
| 20 to 24 Year Olds | 604 (95.0%) | 32 (5.0%) |
| 25 to 34 Year Olds | 371 (93.4%) | 26 (6.6%) |
| 35 Years and over | 315 (73.3%) | 115 (26.7%) |
| Total | 7,842 (89.1%) | 959 (10.9%) |
Educational Attainment by Field of Study in Okmulgee County
Education (1,162 | 28.5%), business (774 | 19.0%), arts & humanities (379 | 9.3%), science & technology (370 | 9.1%), and bio, nature & agricultural (213 | 5.2%) are the most common fields of study among 4,073 individuals in Okmulgee County who have obtained a bachelor's degree or higher.
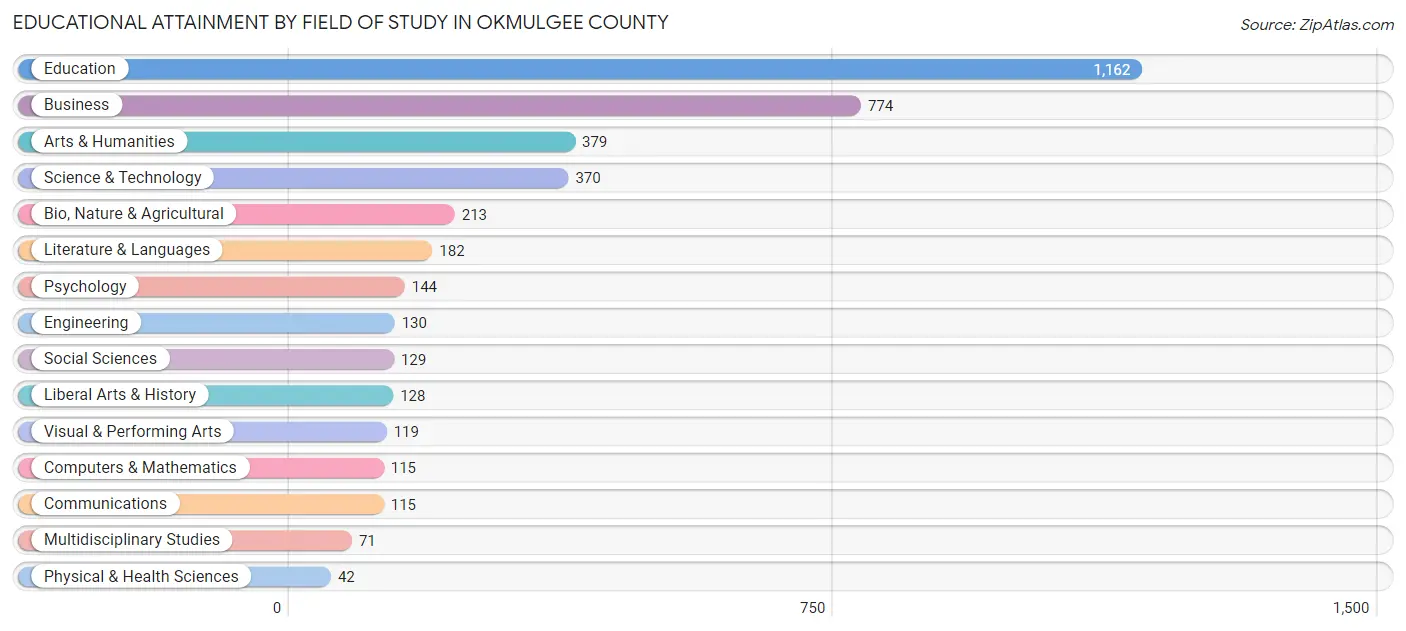
| Field of Study | # Graduates | % Graduates |
| Computers & Mathematics | 115 | 2.8% |
| Bio, Nature & Agricultural | 213 | 5.2% |
| Physical & Health Sciences | 42 | 1.0% |
| Psychology | 144 | 3.5% |
| Social Sciences | 129 | 3.2% |
| Engineering | 130 | 3.2% |
| Multidisciplinary Studies | 71 | 1.7% |
| Science & Technology | 370 | 9.1% |
| Business | 774 | 19.0% |
| Education | 1,162 | 28.5% |
| Literature & Languages | 182 | 4.5% |
| Liberal Arts & History | 128 | 3.1% |
| Visual & Performing Arts | 119 | 2.9% |
| Communications | 115 | 2.8% |
| Arts & Humanities | 379 | 9.3% |
| Total | 4,073 | 100.0% |
Transportation & Commute in Okmulgee County
Vehicle Availability by Sex in Okmulgee County
The most prevalent vehicle ownership categories in Okmulgee County are males with 2 vehicles (2,525, accounting for 33.7%) and females with 2 vehicles (2,205, making up 36.4%).
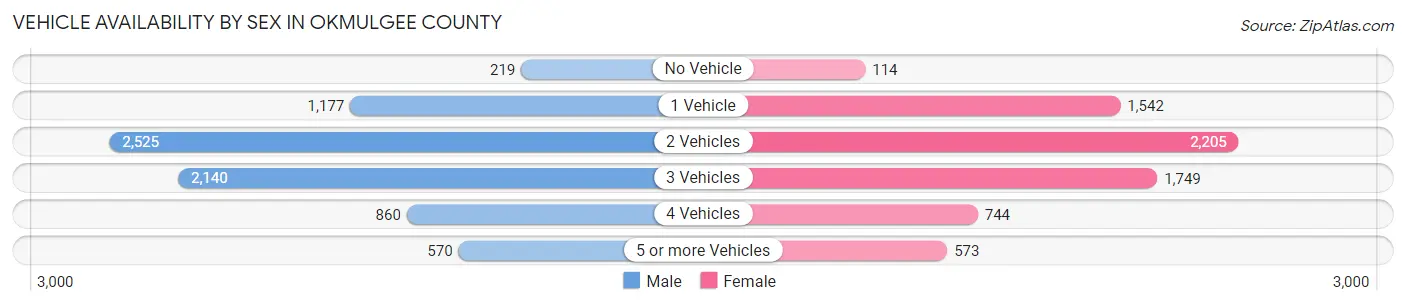
| Vehicles Available | Male | Female |
| No Vehicle | 219 (2.9%) | 114 (1.7%) |
| 1 Vehicle | 1,177 (15.7%) | 1,542 (22.3%) |
| 2 Vehicles | 2,525 (33.7%) | 2,205 (31.8%) |
| 3 Vehicles | 2,140 (28.6%) | 1,749 (25.3%) |
| 4 Vehicles | 860 (11.5%) | 744 (10.7%) |
| 5 or more Vehicles | 570 (7.6%) | 573 (8.3%) |
| Total | 7,491 (100.0%) | 6,927 (100.0%) |
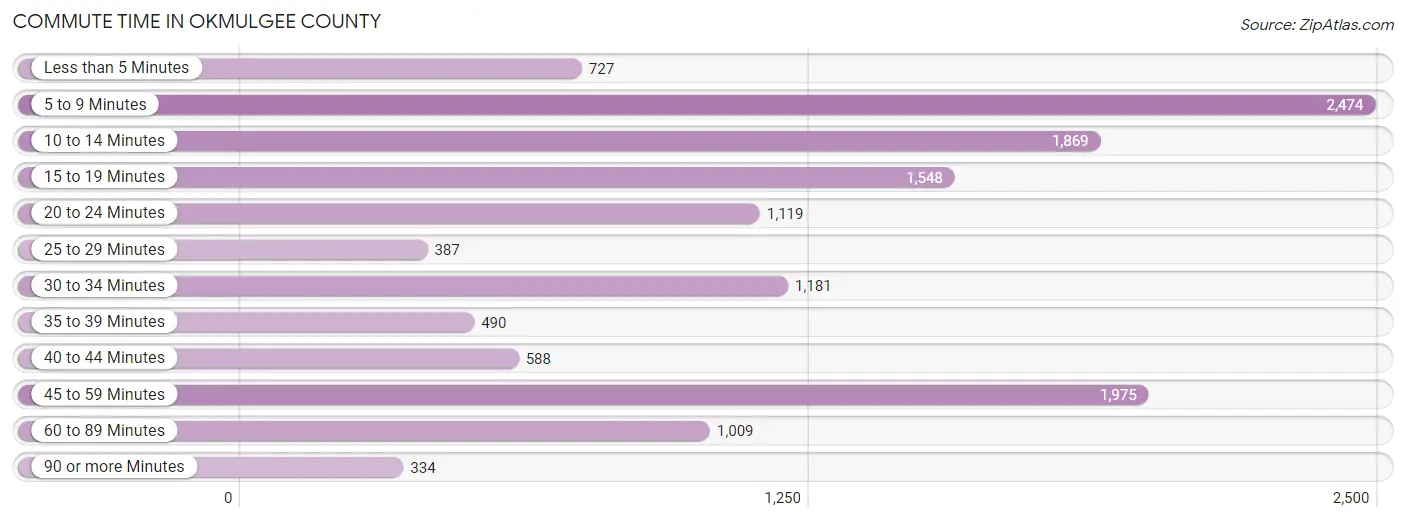
Commute Time in Okmulgee County
The most frequently occuring commute durations in Okmulgee County are 5 to 9 minutes (2,474 commuters, 18.1%), 45 to 59 minutes (1,975 commuters, 14.4%), and 10 to 14 minutes (1,869 commuters, 13.6%).
| Commute Time | # Commuters | % Commuters |
| Less than 5 Minutes | 727 | 5.3% |
| 5 to 9 Minutes | 2,474 | 18.1% |
| 10 to 14 Minutes | 1,869 | 13.6% |
| 15 to 19 Minutes | 1,548 | 11.3% |
| 20 to 24 Minutes | 1,119 | 8.2% |
| 25 to 29 Minutes | 387 | 2.8% |
| 30 to 34 Minutes | 1,181 | 8.6% |
| 35 to 39 Minutes | 490 | 3.6% |
| 40 to 44 Minutes | 588 | 4.3% |
| 45 to 59 Minutes | 1,975 | 14.4% |
| 60 to 89 Minutes | 1,009 | 7.4% |
| 90 or more Minutes | 334 | 2.4% |
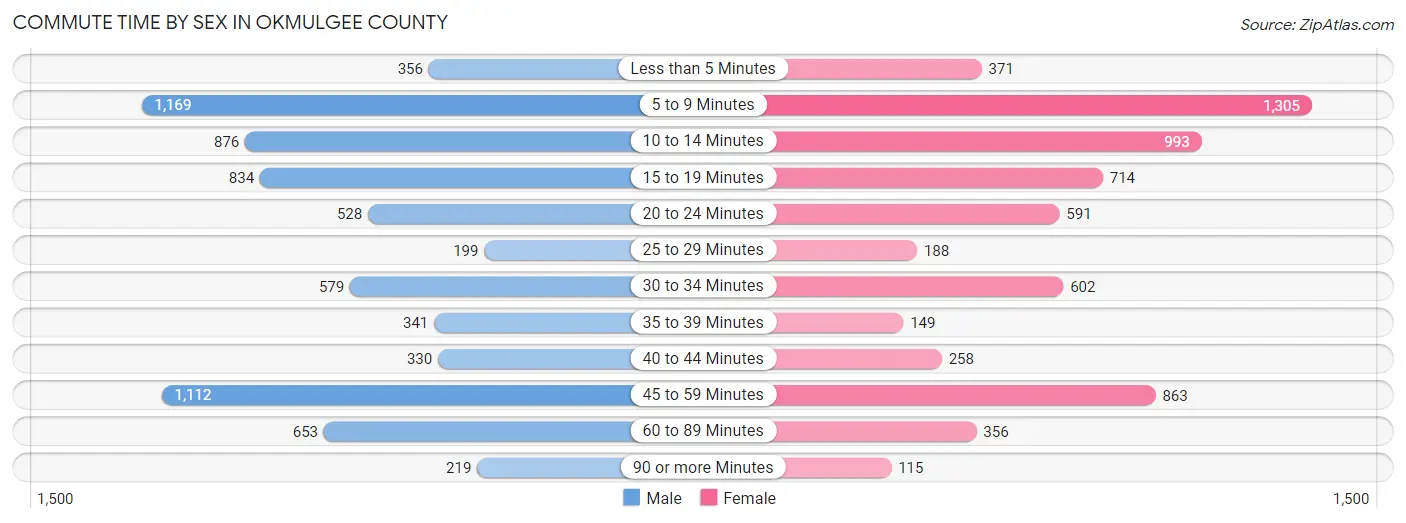
Commute Time by Sex in Okmulgee County
The most common commute times in Okmulgee County are 5 to 9 minutes (1,169 commuters, 16.3%) for males and 5 to 9 minutes (1,305 commuters, 20.1%) for females.
| Commute Time | Male | Female |
| Less than 5 Minutes | 356 (5.0%) | 371 (5.7%) |
| 5 to 9 Minutes | 1,169 (16.3%) | 1,305 (20.1%) |
| 10 to 14 Minutes | 876 (12.2%) | 993 (15.3%) |
| 15 to 19 Minutes | 834 (11.6%) | 714 (11.0%) |
| 20 to 24 Minutes | 528 (7.3%) | 591 (9.1%) |
| 25 to 29 Minutes | 199 (2.8%) | 188 (2.9%) |
| 30 to 34 Minutes | 579 (8.1%) | 602 (9.2%) |
| 35 to 39 Minutes | 341 (4.7%) | 149 (2.3%) |
| 40 to 44 Minutes | 330 (4.6%) | 258 (4.0%) |
| 45 to 59 Minutes | 1,112 (15.4%) | 863 (13.3%) |
| 60 to 89 Minutes | 653 (9.1%) | 356 (5.5%) |
| 90 or more Minutes | 219 (3.0%) | 115 (1.8%) |
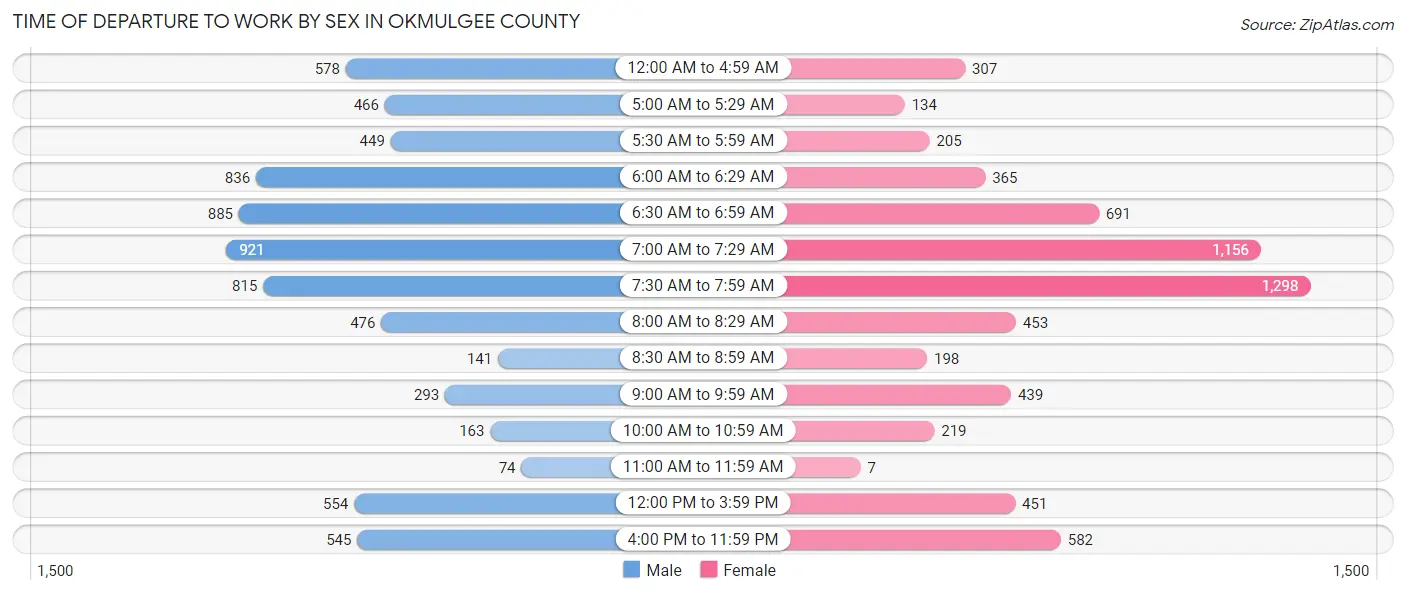
Time of Departure to Work by Sex in Okmulgee County
The most frequent times of departure to work in Okmulgee County are 7:00 AM to 7:29 AM (921, 12.8%) for males and 7:30 AM to 7:59 AM (1,298, 20.0%) for females.
| Time of Departure | Male | Female |
| 12:00 AM to 4:59 AM | 578 (8.0%) | 307 (4.7%) |
| 5:00 AM to 5:29 AM | 466 (6.5%) | 134 (2.1%) |
| 5:30 AM to 5:59 AM | 449 (6.2%) | 205 (3.2%) |
| 6:00 AM to 6:29 AM | 836 (11.6%) | 365 (5.6%) |
| 6:30 AM to 6:59 AM | 885 (12.3%) | 691 (10.6%) |
| 7:00 AM to 7:29 AM | 921 (12.8%) | 1,156 (17.8%) |
| 7:30 AM to 7:59 AM | 815 (11.3%) | 1,298 (20.0%) |
| 8:00 AM to 8:29 AM | 476 (6.6%) | 453 (7.0%) |
| 8:30 AM to 8:59 AM | 141 (2.0%) | 198 (3.0%) |
| 9:00 AM to 9:59 AM | 293 (4.1%) | 439 (6.8%) |
| 10:00 AM to 10:59 AM | 163 (2.3%) | 219 (3.4%) |
| 11:00 AM to 11:59 AM | 74 (1.0%) | 7 (0.1%) |
| 12:00 PM to 3:59 PM | 554 (7.7%) | 451 (6.9%) |
| 4:00 PM to 11:59 PM | 545 (7.6%) | 582 (8.9%) |
| Total | 7,196 (100.0%) | 6,505 (100.0%) |
Housing Occupancy in Okmulgee County
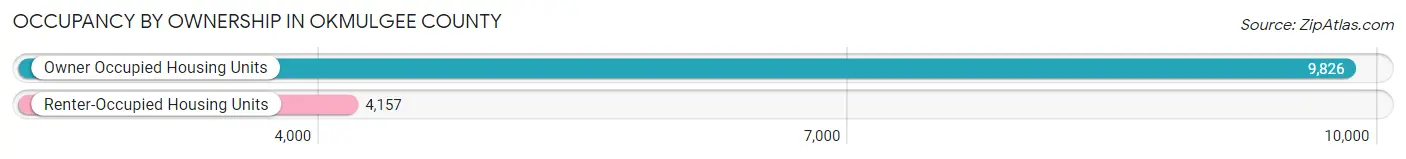
Occupancy by Ownership in Okmulgee County
Of the total 13,983 dwellings in Okmulgee County, owner-occupied units account for 9,826 (70.3%), while renter-occupied units make up 4,157 (29.7%).
| Occupancy | # Housing Units | % Housing Units |
| Owner Occupied Housing Units | 9,826 | 70.3% |
| Renter-Occupied Housing Units | 4,157 | 29.7% |
| Total Occupied Housing Units | 13,983 | 100.0% |
Occupancy by Household Size in Okmulgee County
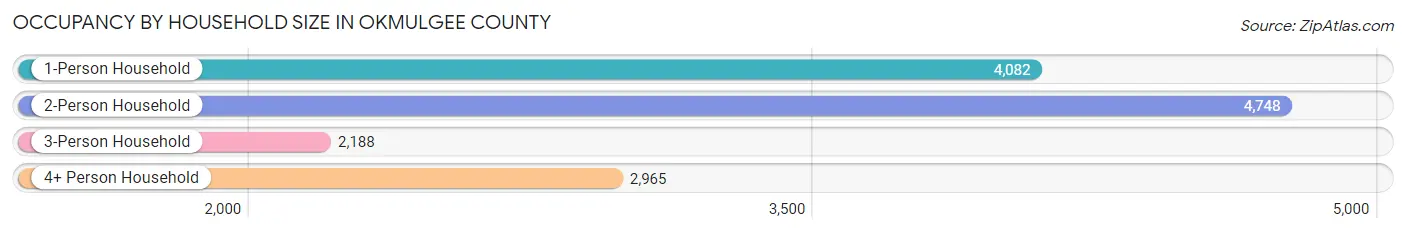
| Household Size | # Housing Units | % Housing Units |
| 1-Person Household | 4,082 | 29.2% |
| 2-Person Household | 4,748 | 34.0% |
| 3-Person Household | 2,188 | 15.7% |
| 4+ Person Household | 2,965 | 21.2% |
| Total Housing Units | 13,983 | 100.0% |
Occupancy by Ownership by Household Size in Okmulgee County
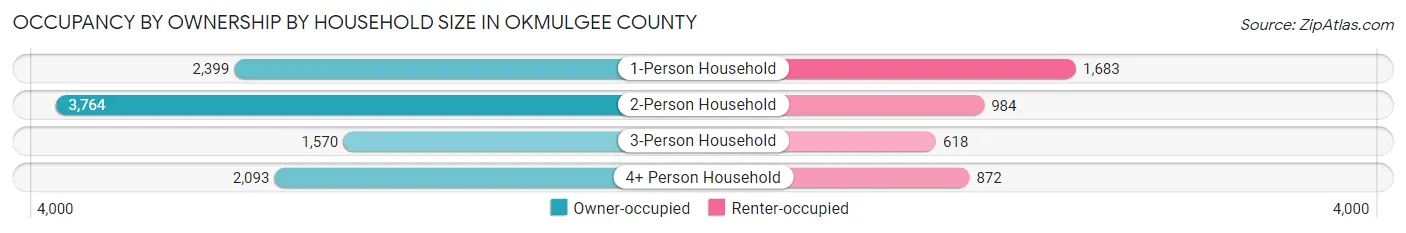
| Household Size | Owner-occupied | Renter-occupied |
| 1-Person Household | 2,399 (58.8%) | 1,683 (41.2%) |
| 2-Person Household | 3,764 (79.3%) | 984 (20.7%) |
| 3-Person Household | 1,570 (71.8%) | 618 (28.2%) |
| 4+ Person Household | 2,093 (70.6%) | 872 (29.4%) |
| Total Housing Units | 9,826 (70.3%) | 4,157 (29.7%) |
Occupancy by Educational Attainment in Okmulgee County
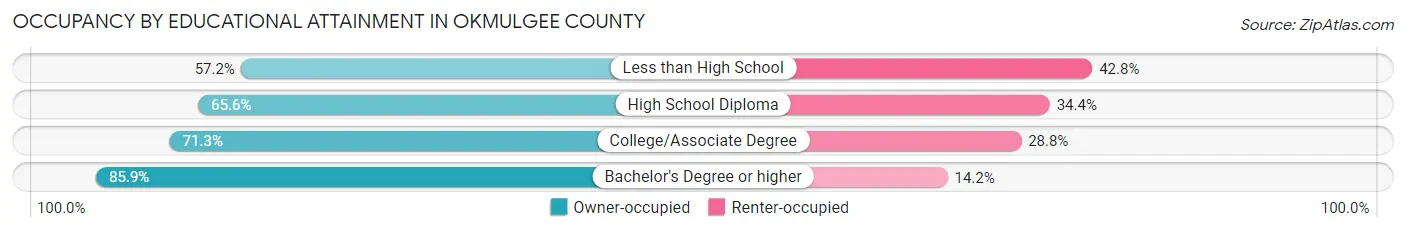
| Household Size | Owner-occupied | Renter-occupied |
| Less than High School | 914 (57.2%) | 685 (42.8%) |
| High School Diploma | 3,014 (65.6%) | 1,581 (34.4%) |
| College/Associate Degree | 3,848 (71.3%) | 1,553 (28.7%) |
| Bachelor's Degree or higher | 2,050 (85.9%) | 338 (14.1%) |
Occupancy by Age of Householder in Okmulgee County
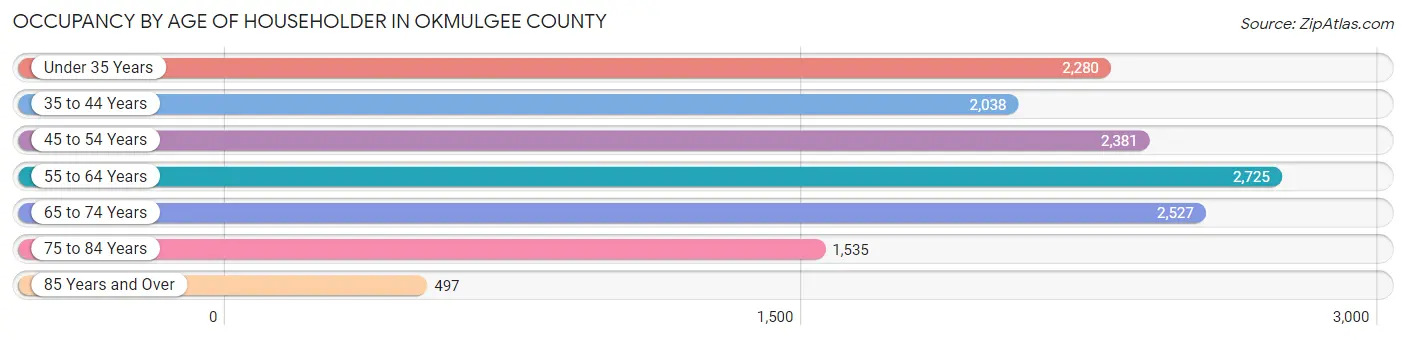
| Age Bracket | # Households | % Households |
| Under 35 Years | 2,280 | 16.3% |
| 35 to 44 Years | 2,038 | 14.6% |
| 45 to 54 Years | 2,381 | 17.0% |
| 55 to 64 Years | 2,725 | 19.5% |
| 65 to 74 Years | 2,527 | 18.1% |
| 75 to 84 Years | 1,535 | 11.0% |
| 85 Years and Over | 497 | 3.5% |
| Total | 13,983 | 100.0% |
Housing Finances in Okmulgee County
Median Income by Occupancy in Okmulgee County
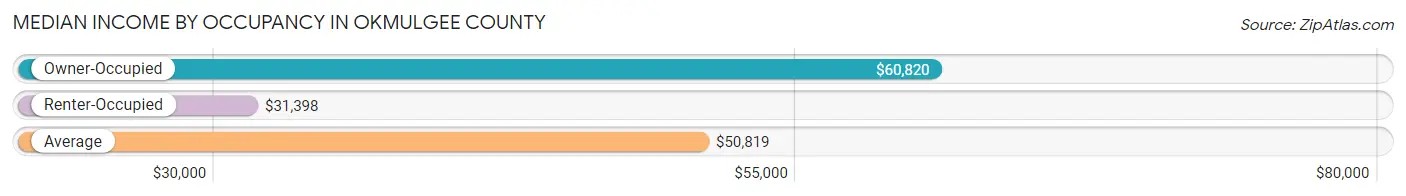
| Occupancy Type | # Households | Median Income |
| Owner-Occupied | 9,826 (70.3%) | $60,820 |
| Renter-Occupied | 4,157 (29.7%) | $31,398 |
| Average | 13,983 (100.0%) | $50,819 |
Occupancy by Householder Income Bracket in Okmulgee County
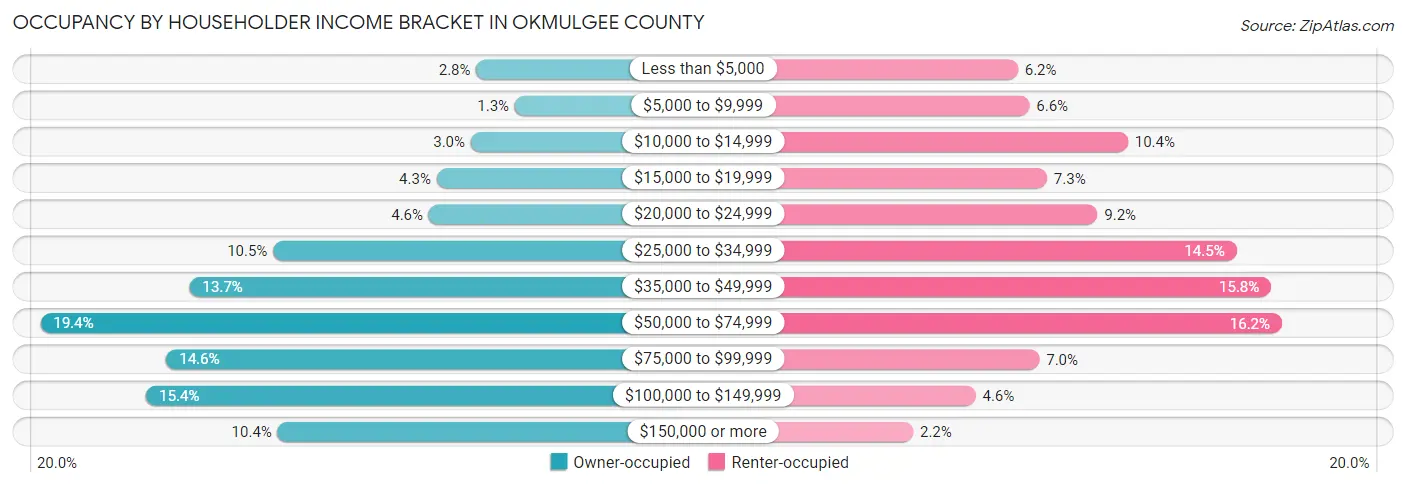
| Income Bracket | Owner-occupied | Renter-occupied |
| Less than $5,000 | 274 (2.8%) | 257 (6.2%) |
| $5,000 to $9,999 | 130 (1.3%) | 275 (6.6%) |
| $10,000 to $14,999 | 295 (3.0%) | 431 (10.4%) |
| $15,000 to $19,999 | 423 (4.3%) | 303 (7.3%) |
| $20,000 to $24,999 | 452 (4.6%) | 383 (9.2%) |
| $25,000 to $34,999 | 1,035 (10.5%) | 603 (14.5%) |
| $35,000 to $49,999 | 1,348 (13.7%) | 658 (15.8%) |
| $50,000 to $74,999 | 1,906 (19.4%) | 675 (16.2%) |
| $75,000 to $99,999 | 1,435 (14.6%) | 291 (7.0%) |
| $100,000 to $149,999 | 1,510 (15.4%) | 190 (4.6%) |
| $150,000 or more | 1,018 (10.4%) | 91 (2.2%) |
| Total | 9,826 (100.0%) | 4,157 (100.0%) |
Monthly Housing Cost Tiers in Okmulgee County
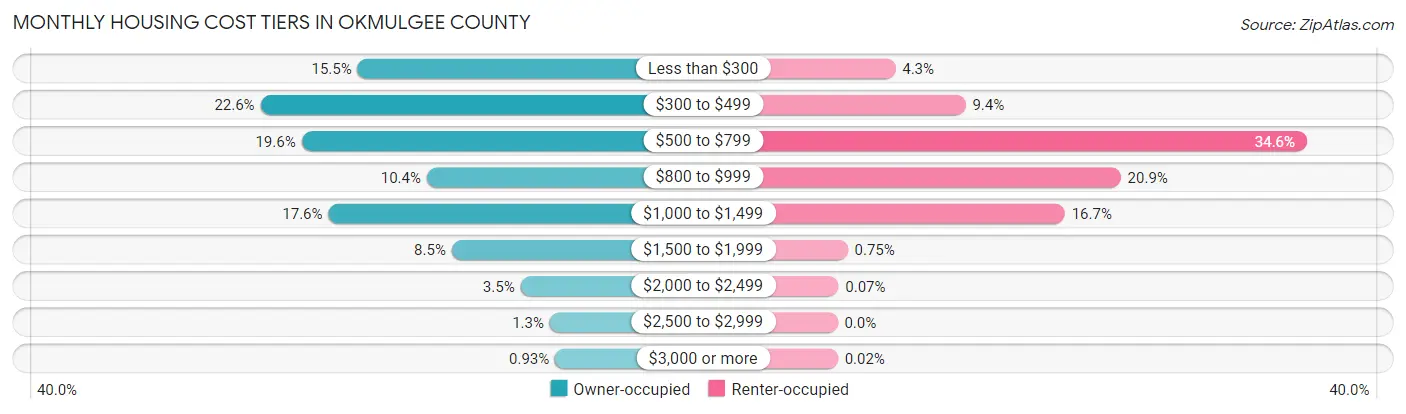
| Monthly Cost | Owner-occupied | Renter-occupied |
| Less than $300 | 1,521 (15.5%) | 177 (4.3%) |
| $300 to $499 | 2,224 (22.6%) | 392 (9.4%) |
| $500 to $799 | 1,927 (19.6%) | 1,437 (34.6%) |
| $800 to $999 | 1,020 (10.4%) | 867 (20.9%) |
| $1,000 to $1,499 | 1,732 (17.6%) | 696 (16.7%) |
| $1,500 to $1,999 | 839 (8.5%) | 31 (0.7%) |
| $2,000 to $2,499 | 342 (3.5%) | 3 (0.1%) |
| $2,500 to $2,999 | 130 (1.3%) | 0 (0.0%) |
| $3,000 or more | 91 (0.9%) | 1 (0.0%) |
| Total | 9,826 (100.0%) | 4,157 (100.0%) |
Physical Housing Characteristics in Okmulgee County
Housing Structures in Okmulgee County
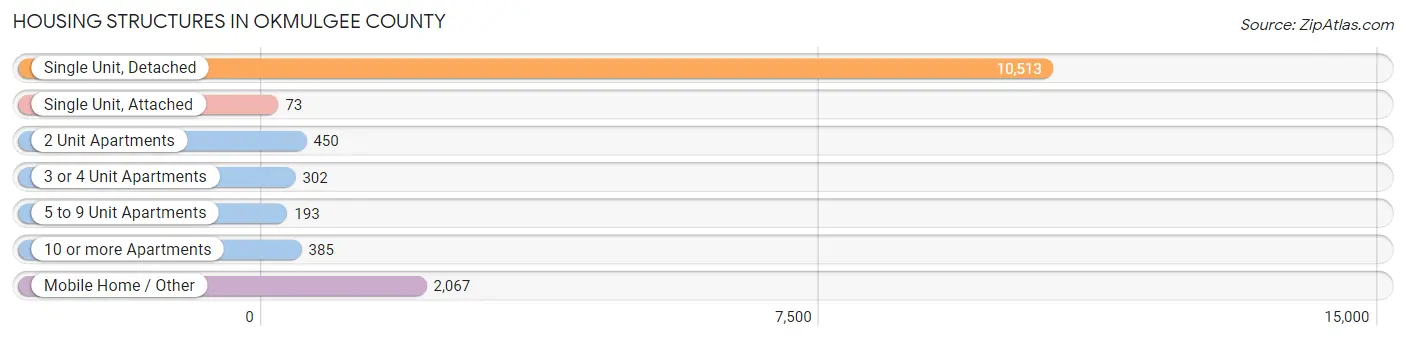
| Structure Type | # Housing Units | % Housing Units |
| Single Unit, Detached | 10,513 | 75.2% |
| Single Unit, Attached | 73 | 0.5% |
| 2 Unit Apartments | 450 | 3.2% |
| 3 or 4 Unit Apartments | 302 | 2.2% |
| 5 to 9 Unit Apartments | 193 | 1.4% |
| 10 or more Apartments | 385 | 2.8% |
| Mobile Home / Other | 2,067 | 14.8% |
| Total | 13,983 | 100.0% |
Housing Structures by Occupancy in Okmulgee County
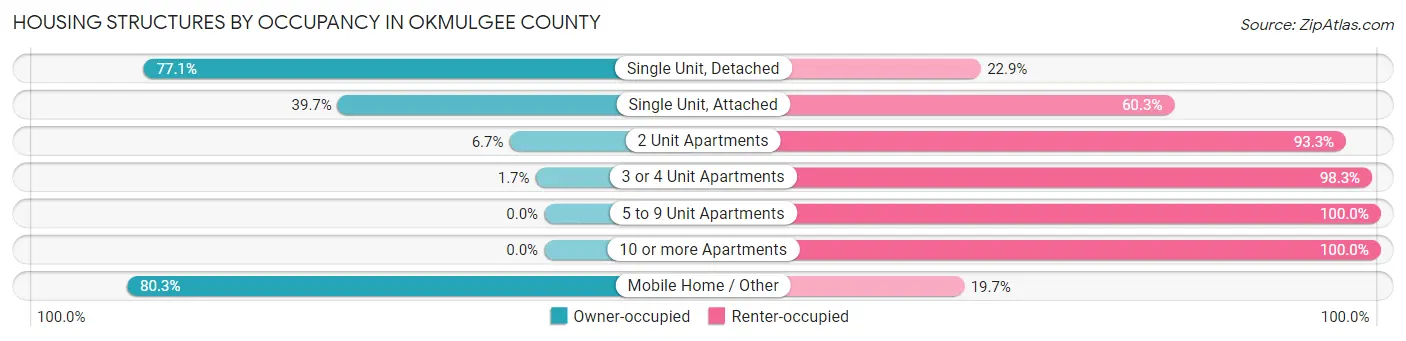
| Structure Type | Owner-occupied | Renter-occupied |
| Single Unit, Detached | 8,103 (77.1%) | 2,410 (22.9%) |
| Single Unit, Attached | 29 (39.7%) | 44 (60.3%) |
| 2 Unit Apartments | 30 (6.7%) | 420 (93.3%) |
| 3 or 4 Unit Apartments | 5 (1.7%) | 297 (98.3%) |
| 5 to 9 Unit Apartments | 0 (0.0%) | 193 (100.0%) |
| 10 or more Apartments | 0 (0.0%) | 385 (100.0%) |
| Mobile Home / Other | 1,659 (80.3%) | 408 (19.7%) |
| Total | 9,826 (70.3%) | 4,157 (29.7%) |
Housing Structures by Number of Rooms in Okmulgee County
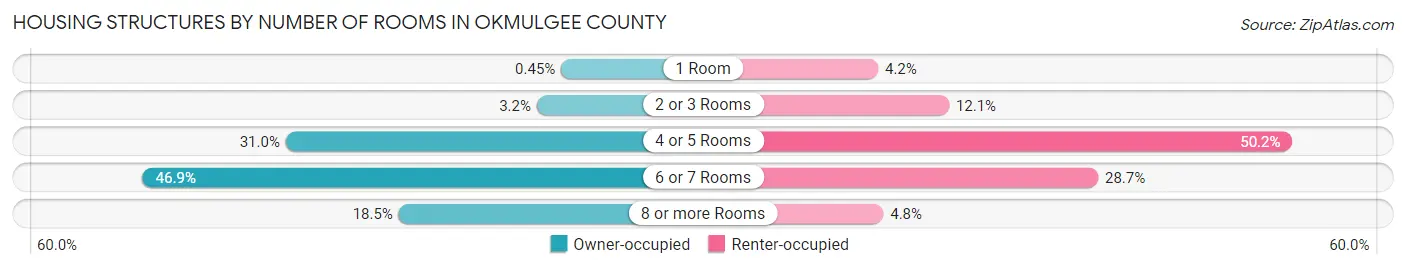
| Number of Rooms | Owner-occupied | Renter-occupied |
| 1 Room | 44 (0.4%) | 176 (4.2%) |
| 2 or 3 Rooms | 310 (3.2%) | 503 (12.1%) |
| 4 or 5 Rooms | 3,048 (31.0%) | 2,087 (50.2%) |
| 6 or 7 Rooms | 4,608 (46.9%) | 1,191 (28.6%) |
| 8 or more Rooms | 1,816 (18.5%) | 200 (4.8%) |
| Total | 9,826 (100.0%) | 4,157 (100.0%) |
Housing Structure by Heating Type in Okmulgee County
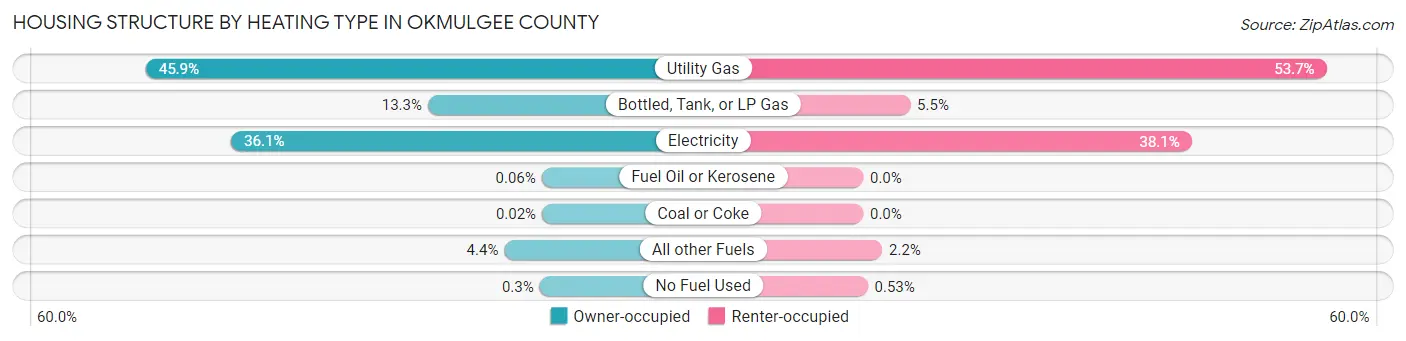
| Heating Type | Owner-occupied | Renter-occupied |
| Utility Gas | 4,514 (45.9%) | 2,233 (53.7%) |
| Bottled, Tank, or LP Gas | 1,302 (13.3%) | 227 (5.5%) |
| Electricity | 3,542 (36.0%) | 1,583 (38.1%) |
| Fuel Oil or Kerosene | 6 (0.1%) | 0 (0.0%) |
| Coal or Coke | 2 (0.0%) | 0 (0.0%) |
| All other Fuels | 431 (4.4%) | 92 (2.2%) |
| No Fuel Used | 29 (0.3%) | 22 (0.5%) |
| Total | 9,826 (100.0%) | 4,157 (100.0%) |
Household Vehicle Usage in Okmulgee County
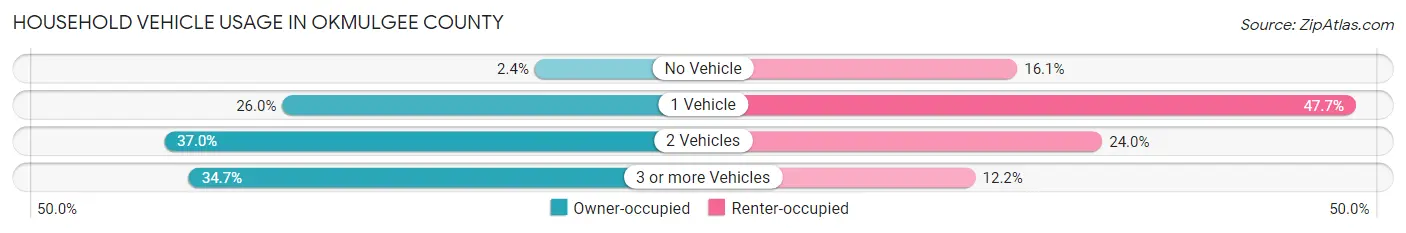
| Vehicles per Household | Owner-occupied | Renter-occupied |
| No Vehicle | 234 (2.4%) | 669 (16.1%) |
| 1 Vehicle | 2,550 (26.0%) | 1,982 (47.7%) |
| 2 Vehicles | 3,635 (37.0%) | 999 (24.0%) |
| 3 or more Vehicles | 3,407 (34.7%) | 507 (12.2%) |
| Total | 9,826 (100.0%) | 4,157 (100.0%) |
Real Estate & Mortgages in Okmulgee County
Real Estate and Mortgage Overview in Okmulgee County
| Characteristic | Without Mortgage | With Mortgage |
| Housing Units | 5,035 | 4,791 |
| Median Property Value | $88,300 | $134,700 |
| Median Household Income | $49,040 | $655 |
| Monthly Housing Costs | $389 | $82 |
| Real Estate Taxes | $522 | $401 |
Property Value by Mortgage Status in Okmulgee County
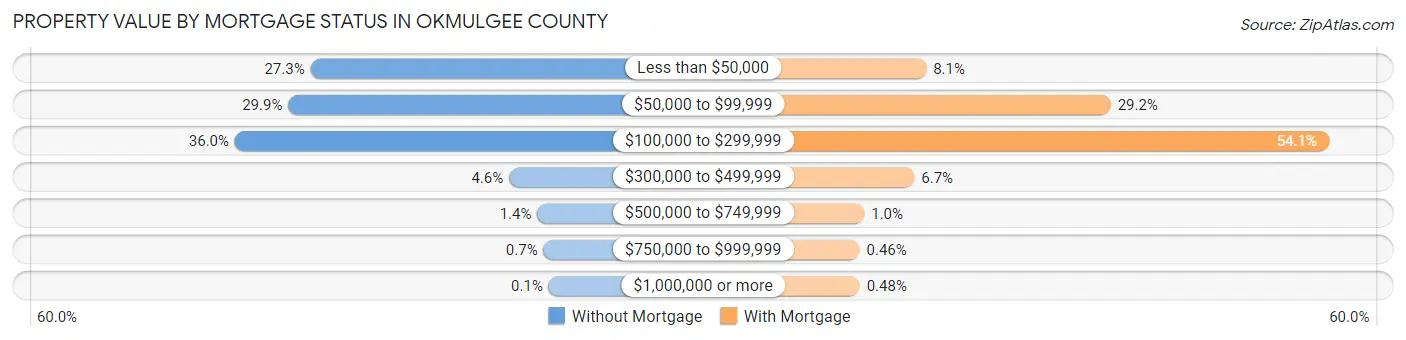
| Property Value | Without Mortgage | With Mortgage |
| Less than $50,000 | 1,376 (27.3%) | 387 (8.1%) |
| $50,000 to $99,999 | 1,504 (29.9%) | 1,397 (29.2%) |
| $100,000 to $299,999 | 1,811 (36.0%) | 2,592 (54.1%) |
| $300,000 to $499,999 | 233 (4.6%) | 322 (6.7%) |
| $500,000 to $749,999 | 71 (1.4%) | 48 (1.0%) |
| $750,000 to $999,999 | 35 (0.7%) | 22 (0.5%) |
| $1,000,000 or more | 5 (0.1%) | 23 (0.5%) |
| Total | 5,035 (100.0%) | 4,791 (100.0%) |
Household Income by Mortgage Status in Okmulgee County
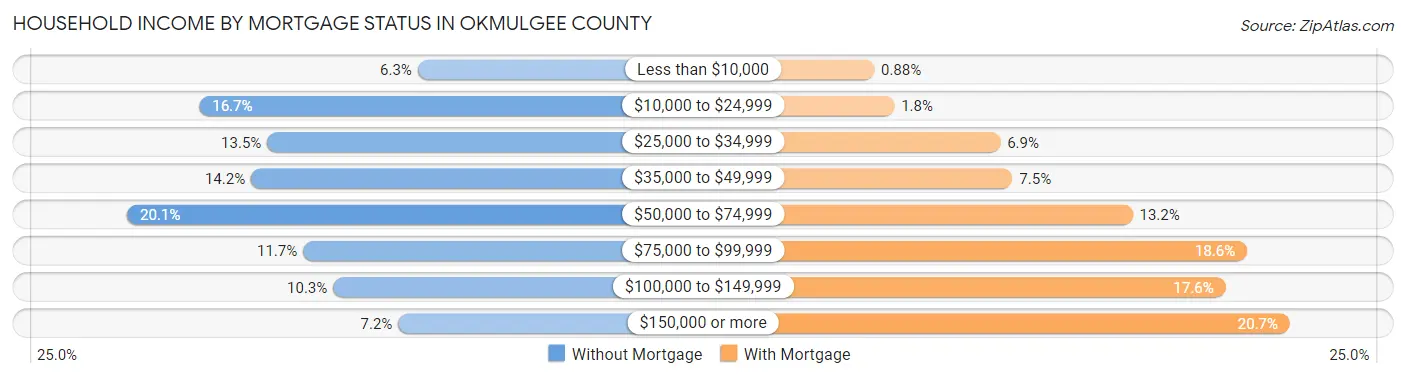
| Household Income | Without Mortgage | With Mortgage |
| Less than $10,000 | 316 (6.3%) | 42 (0.9%) |
| $10,000 to $24,999 | 840 (16.7%) | 88 (1.8%) |
| $25,000 to $34,999 | 677 (13.5%) | 330 (6.9%) |
| $35,000 to $49,999 | 716 (14.2%) | 358 (7.5%) |
| $50,000 to $74,999 | 1,013 (20.1%) | 632 (13.2%) |
| $75,000 to $99,999 | 591 (11.7%) | 893 (18.6%) |
| $100,000 to $149,999 | 519 (10.3%) | 844 (17.6%) |
| $150,000 or more | 363 (7.2%) | 991 (20.7%) |
| Total | 5,035 (100.0%) | 4,791 (100.0%) |
Property Value to Household Income Ratio in Okmulgee County
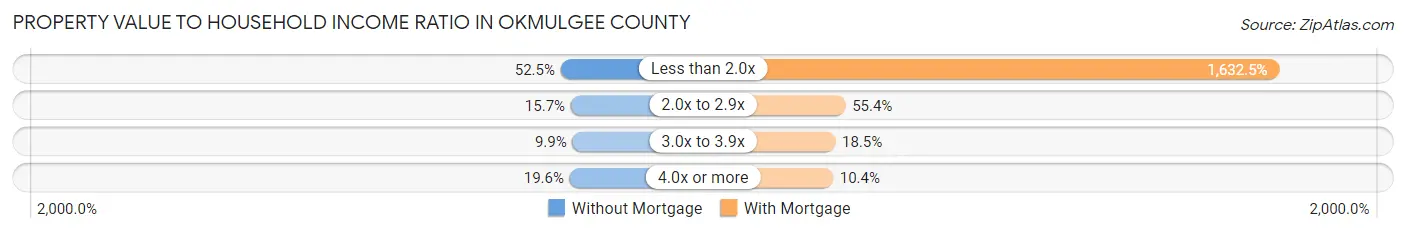
| Value-to-Income Ratio | Without Mortgage | With Mortgage |
| Less than 2.0x | 2,641 (52.4%) | 78,211 (1,632.5%) |
| 2.0x to 2.9x | 792 (15.7%) | 2,655 (55.4%) |
| 3.0x to 3.9x | 496 (9.9%) | 884 (18.4%) |
| 4.0x or more | 987 (19.6%) | 497 (10.4%) |
| Total | 5,035 (100.0%) | 4,791 (100.0%) |
Real Estate Taxes by Mortgage Status in Okmulgee County
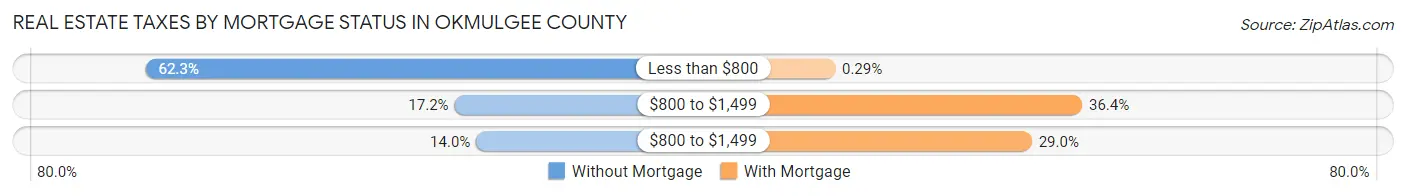
| Property Taxes | Without Mortgage | With Mortgage |
| Less than $800 | 3,138 (62.3%) | 14 (0.3%) |
| $800 to $1,499 | 866 (17.2%) | 1,743 (36.4%) |
| $800 to $1,499 | 706 (14.0%) | 1,391 (29.0%) |
| Total | 5,035 (100.0%) | 4,791 (100.0%) |
Health & Disability in Okmulgee County
Health Insurance Coverage by Age in Okmulgee County
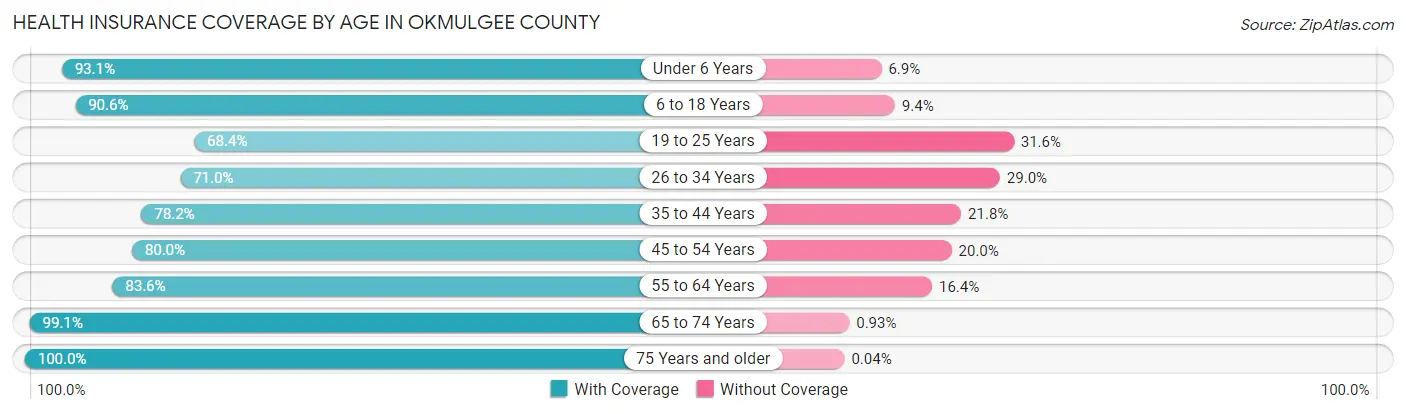
| Age Bracket | With Coverage | Without Coverage |
| Under 6 Years | 2,403 (93.1%) | 179 (6.9%) |
| 6 to 18 Years | 5,938 (90.6%) | 619 (9.4%) |
| 19 to 25 Years | 2,330 (68.4%) | 1,077 (31.6%) |
| 26 to 34 Years | 2,729 (71.0%) | 1,116 (29.0%) |
| 35 to 44 Years | 3,251 (78.2%) | 906 (21.8%) |
| 45 to 54 Years | 3,333 (80.0%) | 834 (20.0%) |
| 55 to 64 Years | 4,036 (83.6%) | 790 (16.4%) |
| 65 to 74 Years | 3,833 (99.1%) | 36 (0.9%) |
| 75 Years and older | 2,801 (100.0%) | 1 (0.0%) |
| Total | 30,654 (84.7%) | 5,558 (15.3%) |
Health Insurance Coverage by Citizenship Status in Okmulgee County
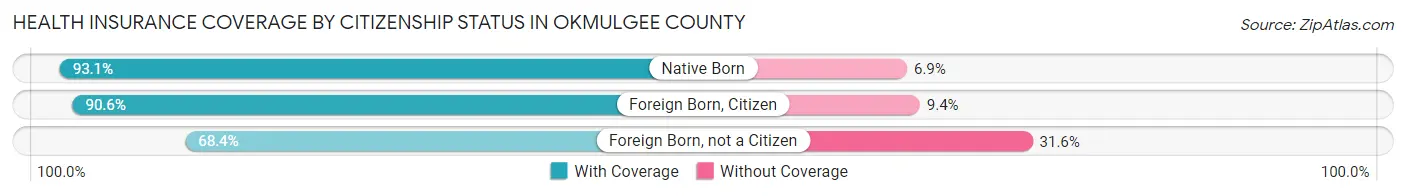
| Citizenship Status | With Coverage | Without Coverage |
| Native Born | 2,403 (93.1%) | 179 (6.9%) |
| Foreign Born, Citizen | 5,938 (90.6%) | 619 (9.4%) |
| Foreign Born, not a Citizen | 2,330 (68.4%) | 1,077 (31.6%) |
Health Insurance Coverage by Household Income in Okmulgee County
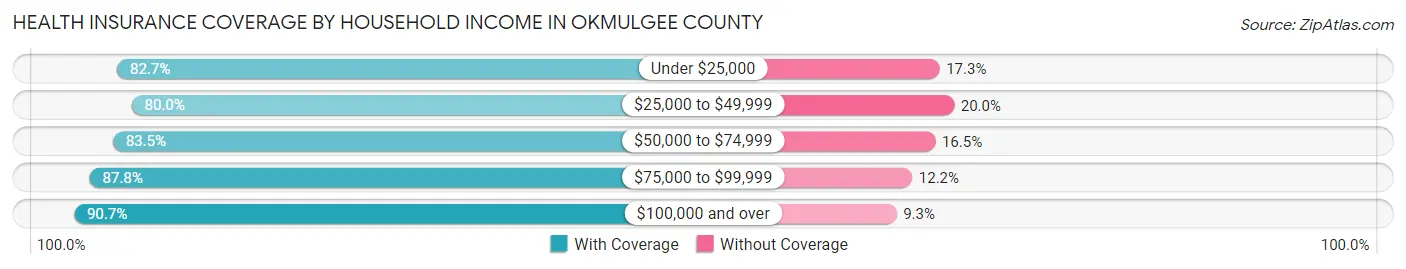
| Household Income | With Coverage | Without Coverage |
| Under $25,000 | 4,687 (82.7%) | 982 (17.3%) |
| $25,000 to $49,999 | 7,005 (80.0%) | 1,756 (20.0%) |
| $50,000 to $74,999 | 5,651 (83.5%) | 1,118 (16.5%) |
| $75,000 to $99,999 | 4,222 (87.8%) | 586 (12.2%) |
| $100,000 and over | 8,463 (90.7%) | 864 (9.3%) |
Public vs Private Health Insurance Coverage by Age in Okmulgee County
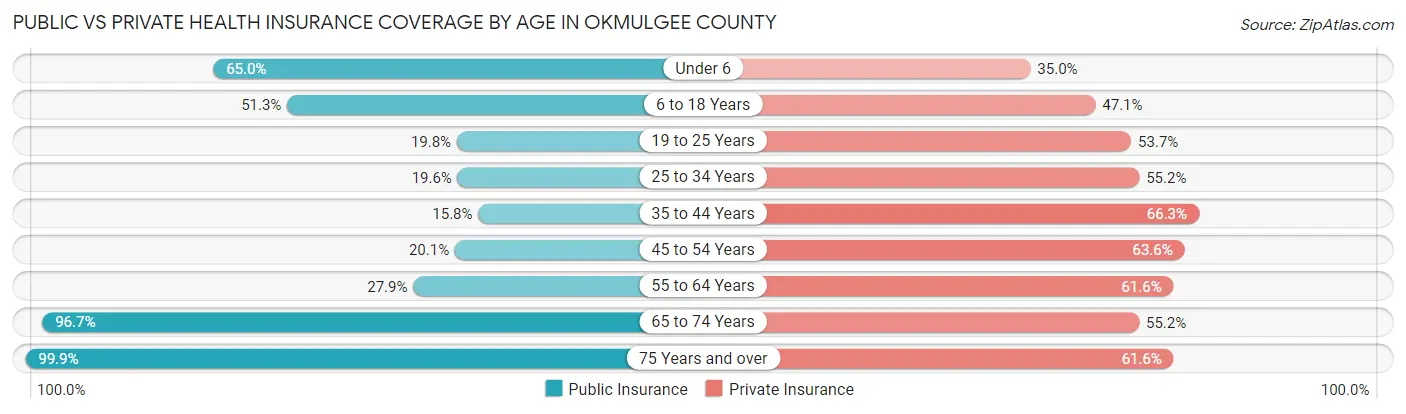
| Age Bracket | Public Insurance | Private Insurance |
| Under 6 | 1,678 (65.0%) | 904 (35.0%) |
| 6 to 18 Years | 3,361 (51.3%) | 3,086 (47.1%) |
| 19 to 25 Years | 673 (19.8%) | 1,830 (53.7%) |
| 25 to 34 Years | 754 (19.6%) | 2,123 (55.2%) |
| 35 to 44 Years | 656 (15.8%) | 2,755 (66.3%) |
| 45 to 54 Years | 838 (20.1%) | 2,651 (63.6%) |
| 55 to 64 Years | 1,344 (27.9%) | 2,971 (61.6%) |
| 65 to 74 Years | 3,742 (96.7%) | 2,135 (55.2%) |
| 75 Years and over | 2,798 (99.9%) | 1,726 (61.6%) |
| Total | 15,844 (43.8%) | 20,181 (55.7%) |
Disability Status by Sex by Age in Okmulgee County
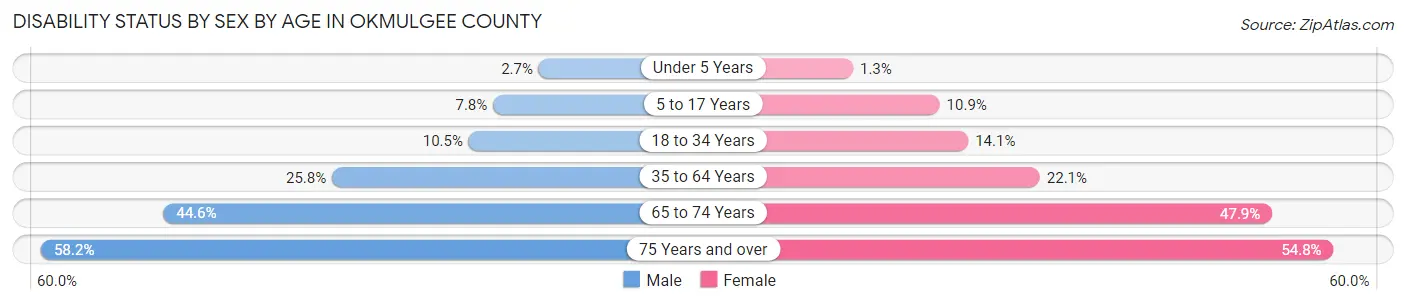
| Age Bracket | Male | Female |
| Under 5 Years | 29 (2.7%) | 13 (1.3%) |
| 5 to 17 Years | 266 (7.8%) | 343 (10.9%) |
| 18 to 34 Years | 426 (10.5%) | 520 (14.1%) |
| 35 to 64 Years | 1,679 (25.8%) | 1,463 (22.1%) |
| 65 to 74 Years | 780 (44.6%) | 1,015 (47.9%) |
| 75 Years and over | 680 (58.2%) | 894 (54.7%) |
Disability Class by Sex by Age in Okmulgee County
Disability Class: Hearing Difficulty
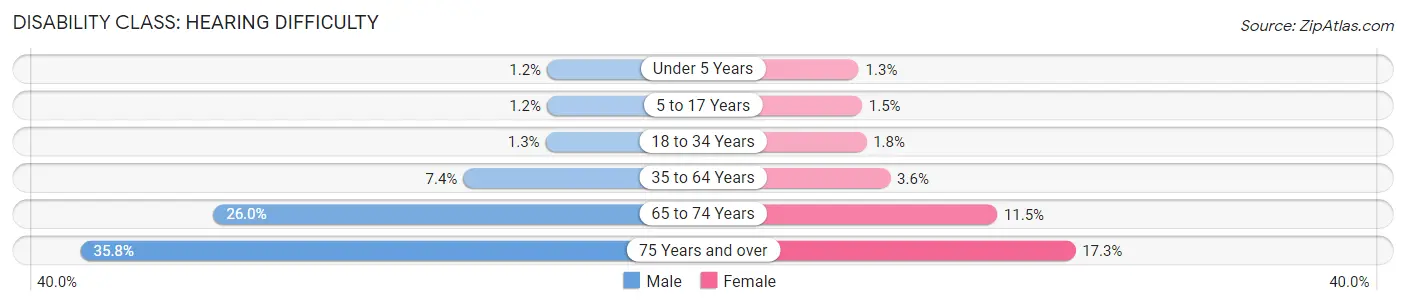
| Age Bracket | Male | Female |
| Under 5 Years | 13 (1.2%) | 13 (1.3%) |
| 5 to 17 Years | 42 (1.2%) | 47 (1.5%) |
| 18 to 34 Years | 54 (1.3%) | 67 (1.8%) |
| 35 to 64 Years | 485 (7.4%) | 238 (3.6%) |
| 65 to 74 Years | 455 (26.0%) | 244 (11.5%) |
| 75 Years and over | 419 (35.8%) | 283 (17.3%) |
Disability Class: Vision Difficulty
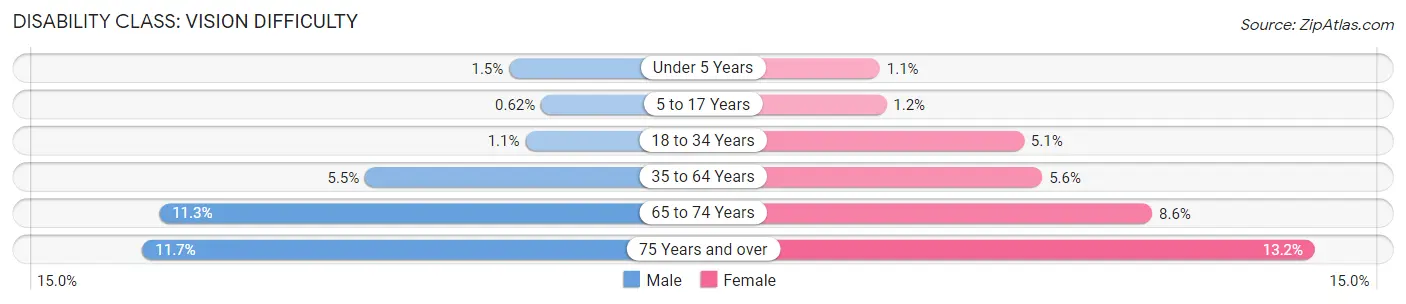
| Age Bracket | Male | Female |
| Under 5 Years | 16 (1.5%) | 11 (1.1%) |
| 5 to 17 Years | 21 (0.6%) | 39 (1.2%) |
| 18 to 34 Years | 43 (1.1%) | 187 (5.1%) |
| 35 to 64 Years | 360 (5.5%) | 370 (5.6%) |
| 65 to 74 Years | 197 (11.3%) | 183 (8.6%) |
| 75 Years and over | 137 (11.7%) | 215 (13.2%) |
Disability Class: Cognitive Difficulty
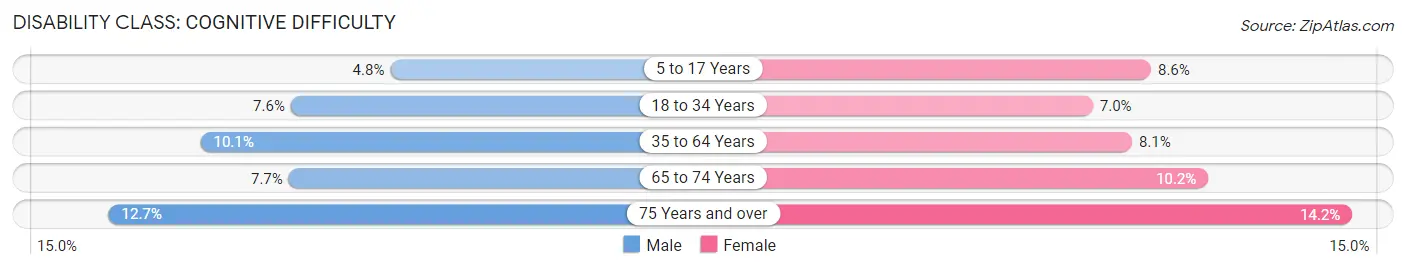
| Age Bracket | Male | Female |
| 5 to 17 Years | 164 (4.8%) | 271 (8.6%) |
| 18 to 34 Years | 307 (7.6%) | 258 (7.0%) |
| 35 to 64 Years | 658 (10.1%) | 536 (8.1%) |
| 65 to 74 Years | 134 (7.6%) | 216 (10.2%) |
| 75 Years and over | 148 (12.7%) | 232 (14.2%) |
Disability Class: Ambulatory Difficulty
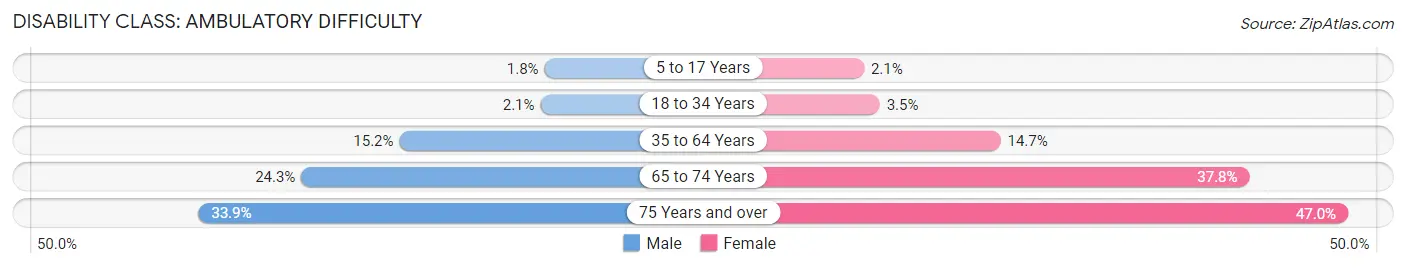
| Age Bracket | Male | Female |
| 5 to 17 Years | 60 (1.8%) | 65 (2.1%) |
| 18 to 34 Years | 86 (2.1%) | 130 (3.5%) |
| 35 to 64 Years | 992 (15.2%) | 977 (14.7%) |
| 65 to 74 Years | 426 (24.3%) | 801 (37.8%) |
| 75 Years and over | 396 (33.9%) | 767 (47.0%) |
Disability Class: Self-Care Difficulty
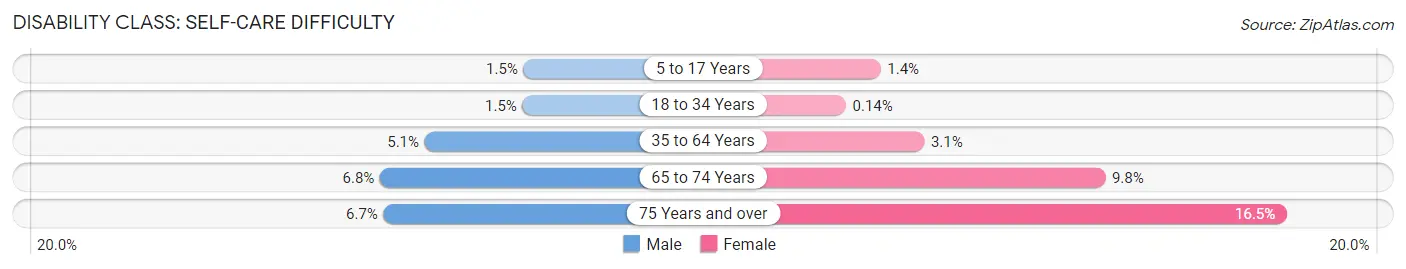
| Age Bracket | Male | Female |
| 5 to 17 Years | 50 (1.5%) | 45 (1.4%) |
| 18 to 34 Years | 61 (1.5%) | 5 (0.1%) |
| 35 to 64 Years | 335 (5.1%) | 202 (3.0%) |
| 65 to 74 Years | 119 (6.8%) | 207 (9.8%) |
| 75 Years and over | 78 (6.7%) | 270 (16.5%) |
Technology Access in Okmulgee County
Computing Device Access in Okmulgee County
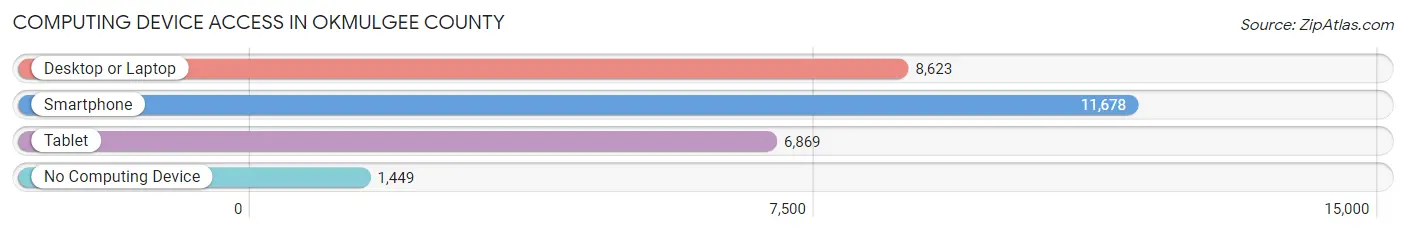
| Device Type | # Households | % Households |
| Desktop or Laptop | 8,623 | 61.7% |
| Smartphone | 11,678 | 83.5% |
| Tablet | 6,869 | 49.1% |
| No Computing Device | 1,449 | 10.4% |
| Total | 13,983 | 100.0% |
Internet Access in Okmulgee County
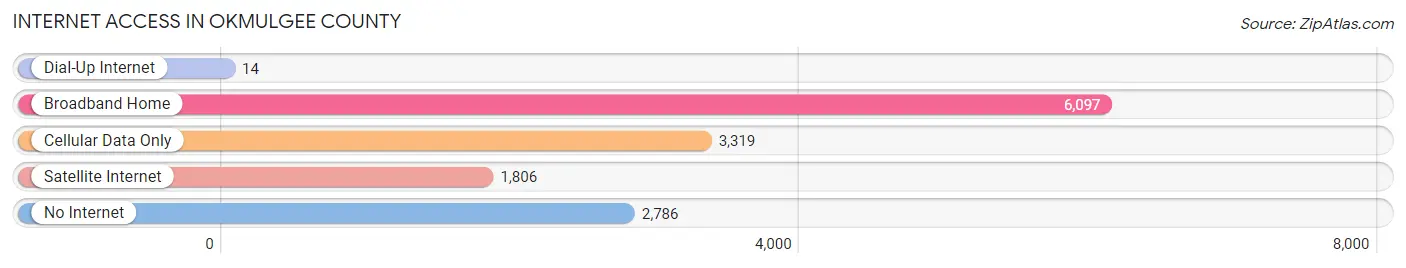
| Internet Type | # Households | % Households |
| Dial-Up Internet | 14 | 0.1% |
| Broadband Home | 6,097 | 43.6% |
| Cellular Data Only | 3,319 | 23.7% |
| Satellite Internet | 1,806 | 12.9% |
| No Internet | 2,786 | 19.9% |
| Total | 13,983 | 100.0% |
Okmulgee County Summary
Okmulgee County is located in the east-central part of Oklahoma, and is part of the Muskogee-McIntosh-Okmulgee tri-county area. The county is bordered by McIntosh County to the north, Okfuskee County to the east, Creek County to the south, and Tulsa County to the west. The county seat is Okmulgee, and the county is named for the Creek Indian word for “boiling waters”, referring to the nearby Okmulgee Creek.
Geography
Okmulgee County covers an area of 745 square miles, and is located in the rolling hills of the Ozark Plateau. The county is drained by the Deep Fork River, which flows through the county from north to south. The county is also home to several small lakes, including Okmulgee Lake, Dripping Springs Lake, and Lake Okmulgee. The county is mostly covered in grassland, with some areas of forest.
Demographics
As of the 2010 census, the population of Okmulgee County was 40,069, making it the fourth most populous county in Oklahoma. The population density was 54 people per square mile. The racial makeup of the county was 68.2% White, 15.2% Native American, 0.7% Asian, 0.5% Black or African American, 0.1% Pacific Islander, and 14.3% from other races. Hispanic or Latino of any race were 4.2% of the population.
The median income for a household in the county was $35,945, and the median income for a family was $41,945. The per capita income for the county was $17,845. About 17.2% of families and 21.2% of the population were below the poverty line, including 28.2% of those under age 18 and 13.2% of those age 65 or over.
Economy
Okmulgee County’s economy is largely based on agriculture, with the county’s main crops being cotton, soybeans, and wheat. The county is also home to several manufacturing companies, including a paper mill, a steel mill, and a glass factory. The county is also home to several oil and gas companies, and is a major producer of oil and natural gas.
History
Okmulgee County was established in 1907, and was named for the nearby Okmulgee Creek. The county was originally part of the Creek Nation, and was home to several Native American tribes, including the Creek, Seminole, and Cherokee. The county was also home to several early settlers, including the French explorer Jean Baptiste Bénard de la Harpe, who explored the area in 1719.
In the late 19th century, the county became a major center for cotton production, and the county seat of Okmulgee was established in 1872. The county was also home to several oil and gas companies, and the county’s economy was largely based on oil and gas production until the mid-20th century.
Today, Okmulgee County is a largely rural county, with a population of just over 40,000. The county is home to several small towns, including Okmulgee, Beggs, Morris, and Dewar. The county is also home to several state parks, including Dripping Springs State Park and Lake Okmulgee State Park.
Common Questions
What is the Total Population of Okmulgee County?
Total Population of Okmulgee County is 36,900.
What is the Total Male Population of Okmulgee County?
Total Male Population of Okmulgee County is 18,390.
What is the Total Female Population of Okmulgee County?
Total Female Population of Okmulgee County is 18,510.
What is the Ratio of Males per 100 Females in Okmulgee County?
There are 99.35 Males per 100 Females in Okmulgee County.
What is the Ratio of Females per 100 Males in Okmulgee County?
There are 100.65 Females per 100 Males in Okmulgee County.
What is the Median Population Age in Okmulgee County?
Median Population Age in Okmulgee County is 39.3 Years.
What is the Average Family Size in Okmulgee County
Average Family Size in Okmulgee County is 3.1 People.
What is the Average Household Size in Okmulgee County
Average Household Size in Okmulgee County is 2.5 People.
What is Per Capita Income in Okmulgee County?
Per Capita income in Okmulgee County is $27,821.
What is the Median Family Income in Okmulgee County?
Median Family Income in Okmulgee County is $62,740.
What is the Median Household income in Okmulgee County?
Median Household Income in Okmulgee County is $50,819.
What is Income or Wage Gap in Okmulgee County?
Income or Wage Gap in Okmulgee County is 33.6%.
Women in Okmulgee County earn 66.4 cents for every dollar earned by a man.
What is Family Income Deficit in Okmulgee County?
Family Income Deficit in Okmulgee County is $9,789.
Families that are below poverty line in Okmulgee County earn $9,789 less on average than the poverty threshold level.
What is Inequality or Gini Index in Okmulgee County?
Inequality or Gini Index in Okmulgee County is 0.47.
How Large is the Labor Force in Okmulgee County?
There are 16,148 People in the Labor Forcein in Okmulgee County.
What is the Percentage of People in the Labor Force in Okmulgee County?
55.2% of People are in the Labor Force in Okmulgee County.
What is the Unemployment Rate in Okmulgee County?
Unemployment Rate in Okmulgee County is 7.2%.