Oklahoma County, OK
Oklahoma County Map
Oklahoma County Overview
795,822
TOTAL POPULATION
391,854
MALE POPULATION
403,968
FEMALE POPULATION
97.00
MALES / 100 FEMALES
103.09
FEMALES / 100 MALES
35.1
MEDIAN AGE
3.1
AVG FAMILY SIZE
2.5
AVG HOUSEHOLD SIZE
$36,987
PER CAPITA INCOME
$78,496
AVG FAMILY INCOME
$62,505
AVG HOUSEHOLD INCOME
26.9%
WAGE / INCOME GAP [ % ]
73.1¢/ $1
WAGE / INCOME GAP [ $ ]
$11,578
FAMILY INCOME DEFICIT
0.49
INEQUALITY / GINI INDEX
406,013
LABOR FORCE [ PEOPLE ]
65.8%
PERCENT IN LABOR FORCE
4.6%
UNEMPLOYMENT RATE
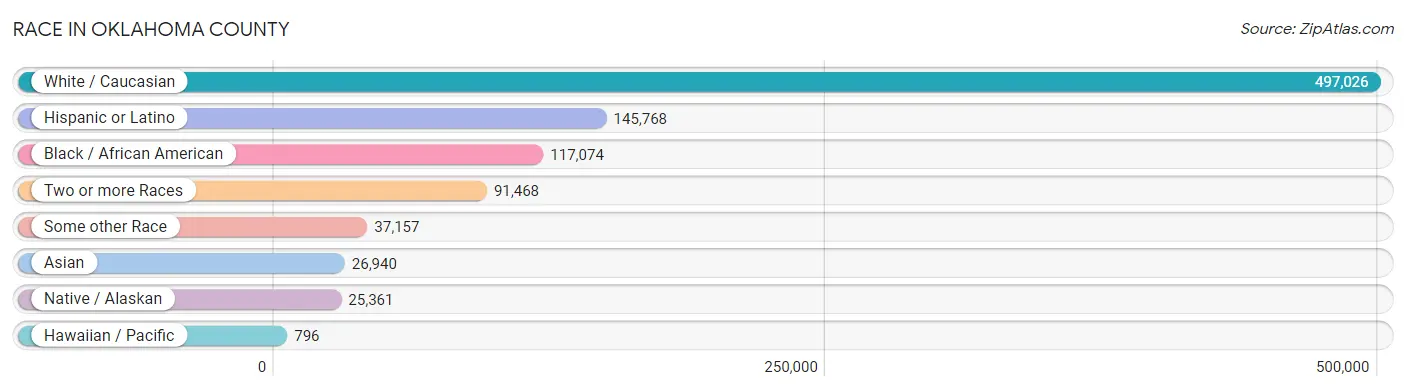
Race in Oklahoma County
The most populous races in Oklahoma County are White / Caucasian (497,026 | 62.5%), Hispanic or Latino (145,768 | 18.3%), and Black / African American (117,074 | 14.7%).
| Race | # Population | % Population |
| Asian | 26,940 | 3.4% |
| Black / African American | 117,074 | 14.7% |
| Hawaiian / Pacific | 796 | 0.1% |
| Hispanic or Latino | 145,768 | 18.3% |
| Native / Alaskan | 25,361 | 3.2% |
| White / Caucasian | 497,026 | 62.5% |
| Two or more Races | 91,468 | 11.5% |
| Some other Race | 37,157 | 4.7% |
| Total | 795,822 | 100.0% |
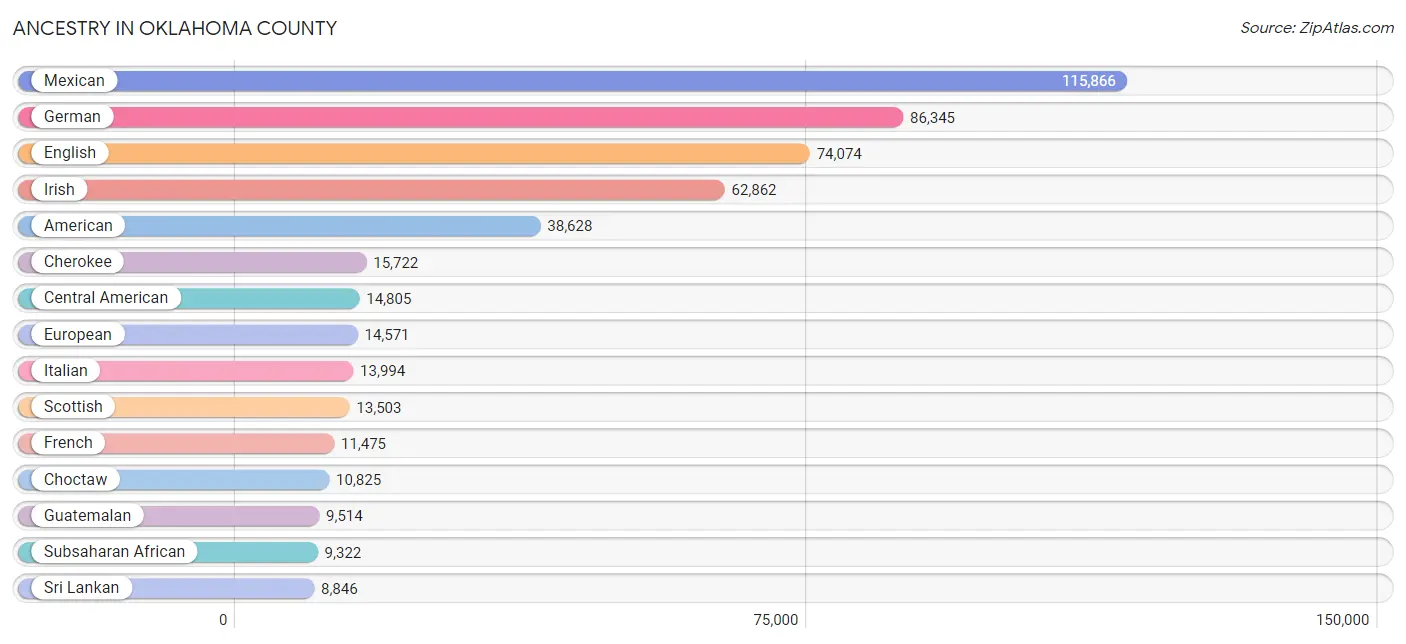
Ancestry in Oklahoma County
The most populous ancestries reported in Oklahoma County are Mexican (115,866 | 14.6%), German (86,345 | 10.8%), English (74,074 | 9.3%), Irish (62,862 | 7.9%), and American (38,628 | 4.9%), together accounting for 47.5% of all Oklahoma County residents.
| Ancestry | # Population | % Population |
| Afghan | 46 | 0.0% |
| African | 4,918 | 0.6% |
| Albanian | 41 | 0.0% |
| Aleut | 6 | 0.0% |
| American | 38,628 | 4.9% |
| Apache | 831 | 0.1% |
| Arab | 4,318 | 0.5% |
| Arapaho | 96 | 0.0% |
| Argentinean | 366 | 0.1% |
| Armenian | 162 | 0.0% |
| Australian | 88 | 0.0% |
| Austrian | 545 | 0.1% |
| Bahamian | 121 | 0.0% |
| Bangladeshi | 469 | 0.1% |
| Barbadian | 5 | 0.0% |
| Basque | 44 | 0.0% |
| Belgian | 194 | 0.0% |
| Bermudan | 41 | 0.0% |
| Bhutanese | 2,876 | 0.4% |
| Blackfeet | 703 | 0.1% |
| Bolivian | 48 | 0.0% |
| Brazilian | 310 | 0.0% |
| British | 5,631 | 0.7% |
| British West Indian | 58 | 0.0% |
| Bulgarian | 216 | 0.0% |
| Burmese | 2,740 | 0.3% |
| Cajun | 518 | 0.1% |
| Cambodian | 18 | 0.0% |
| Canadian | 965 | 0.1% |
| Cape Verdean | 13 | 0.0% |
| Carpatho Rusyn | 10 | 0.0% |
| Celtic | 90 | 0.0% |
| Central American | 14,805 | 1.9% |
| Central American Indian | 553 | 0.1% |
| Cherokee | 15,722 | 2.0% |
| Cheyenne | 617 | 0.1% |
| Chickasaw | 4,732 | 0.6% |
| Chilean | 185 | 0.0% |
| Chinese | 4 | 0.0% |
| Chippewa | 71 | 0.0% |
| Choctaw | 10,825 | 1.4% |
| Colombian | 1,348 | 0.2% |
| Colville | 6 | 0.0% |
| Comanche | 767 | 0.1% |
| Costa Rican | 67 | 0.0% |
| Cree | 23 | 0.0% |
| Creek | 5,042 | 0.6% |
| Croatian | 307 | 0.0% |
| Cuban | 824 | 0.1% |
| Czech | 3,195 | 0.4% |
| Czechoslovakian | 765 | 0.1% |
| Danish | 1,230 | 0.2% |
| Delaware | 503 | 0.1% |
| Dominican | 456 | 0.1% |
| Dutch | 6,790 | 0.9% |
| Dutch West Indian | 880 | 0.1% |
| Eastern European | 1,233 | 0.2% |
| Ecuadorian | 334 | 0.0% |
| Egyptian | 131 | 0.0% |
| English | 74,074 | 9.3% |
| Estonian | 7 | 0.0% |
| Ethiopian | 946 | 0.1% |
| European | 14,571 | 1.8% |
| Fijian | 143 | 0.0% |
| Filipino | 577 | 0.1% |
| Finnish | 497 | 0.1% |
| French | 11,475 | 1.4% |
| French American Indian | 114 | 0.0% |
| French Canadian | 1,381 | 0.2% |
| German | 86,345 | 10.8% |
| German Russian | 31 | 0.0% |
| Ghanaian | 382 | 0.1% |
| Greek | 1,191 | 0.2% |
| Guamanian / Chamorro | 437 | 0.1% |
| Guatemalan | 9,514 | 1.2% |
| Guyanese | 69 | 0.0% |
| Haitian | 261 | 0.0% |
| Honduran | 2,657 | 0.3% |
| Hopi | 47 | 0.0% |
| Hungarian | 1,339 | 0.2% |
| Icelander | 70 | 0.0% |
| Indian (Asian) | 4,324 | 0.5% |
| Indonesian | 810 | 0.1% |
| Inupiat | 25 | 0.0% |
| Iranian | 1,452 | 0.2% |
| Iraqi | 416 | 0.1% |
| Irish | 62,862 | 7.9% |
| Iroquois | 376 | 0.1% |
| Israeli | 181 | 0.0% |
| Italian | 13,994 | 1.8% |
| Jamaican | 464 | 0.1% |
| Japanese | 549 | 0.1% |
| Jordanian | 101 | 0.0% |
| Kenyan | 265 | 0.0% |
| Kiowa | 861 | 0.1% |
| Korean | 3,549 | 0.4% |
| Laotian | 307 | 0.0% |
| Latvian | 37 | 0.0% |
| Lebanese | 1,801 | 0.2% |
| Liberian | 163 | 0.0% |
| Lithuanian | 294 | 0.0% |
| Lumbee | 29 | 0.0% |
| Luxembourger | 22 | 0.0% |
| Macedonian | 8 | 0.0% |
| Malaysian | 836 | 0.1% |
| Marshallese | 80 | 0.0% |
| Menominee | 22 | 0.0% |
| Mexican | 115,866 | 14.6% |
| Mexican American Indian | 2,620 | 0.3% |
| Mongolian | 46 | 0.0% |
| Moroccan | 615 | 0.1% |
| Native Hawaiian | 768 | 0.1% |
| Navajo | 298 | 0.0% |
| New Zealander | 12 | 0.0% |
| Nicaraguan | 400 | 0.1% |
| Nigerian | 1,669 | 0.2% |
| Northern European | 1,111 | 0.1% |
| Norwegian | 5,449 | 0.7% |
| Okinawan | 43 | 0.0% |
| Osage | 795 | 0.1% |
| Ottawa | 34 | 0.0% |
| Paiute | 8 | 0.0% |
| Pakistani | 923 | 0.1% |
| Palestinian | 36 | 0.0% |
| Panamanian | 265 | 0.0% |
| Pennsylvania German | 222 | 0.0% |
| Peruvian | 1,096 | 0.1% |
| Pima | 126 | 0.0% |
| Polish | 6,586 | 0.8% |
| Portuguese | 1,095 | 0.1% |
| Potawatomi | 1,431 | 0.2% |
| Pueblo | 167 | 0.0% |
| Puerto Rican | 3,734 | 0.5% |
| Romanian | 243 | 0.0% |
| Russian | 1,986 | 0.3% |
| Salvadoran | 1,827 | 0.2% |
| Samoan | 133 | 0.0% |
| Scandinavian | 2,845 | 0.4% |
| Scotch-Irish | 6,641 | 0.8% |
| Scottish | 13,503 | 1.7% |
| Seminole | 2,489 | 0.3% |
| Senegalese | 44 | 0.0% |
| Serbian | 101 | 0.0% |
| Sierra Leonean | 40 | 0.0% |
| Sioux | 397 | 0.1% |
| Slavic | 30 | 0.0% |
| Slovak | 357 | 0.0% |
| Slovene | 88 | 0.0% |
| Somali | 116 | 0.0% |
| South African | 212 | 0.0% |
| South American | 4,623 | 0.6% |
| South American Indian | 244 | 0.0% |
| Spaniard | 1,619 | 0.2% |
| Spanish | 1,099 | 0.1% |
| Spanish American | 8 | 0.0% |
| Spanish American Indian | 313 | 0.0% |
| Sri Lankan | 8,846 | 1.1% |
| Subsaharan African | 9,322 | 1.2% |
| Sudanese | 19 | 0.0% |
| Swedish | 4,708 | 0.6% |
| Swiss | 1,744 | 0.2% |
| Syrian | 260 | 0.0% |
| Thai | 6,545 | 0.8% |
| Tlingit-Haida | 30 | 0.0% |
| Tongan | 23 | 0.0% |
| Trinidadian and Tobagonian | 196 | 0.0% |
| Turkish | 188 | 0.0% |
| U.S. Virgin Islander | 34 | 0.0% |
| Ugandan | 18 | 0.0% |
| Ukrainian | 534 | 0.1% |
| Uruguayan | 43 | 0.0% |
| Ute | 27 | 0.0% |
| Venezuelan | 1,178 | 0.2% |
| Vietnamese | 796 | 0.1% |
| Welsh | 3,708 | 0.5% |
| West Indian | 80 | 0.0% |
| Yugoslavian | 92 | 0.0% |
| Zimbabwean | 118 | 0.0% | View All 178 Rows |
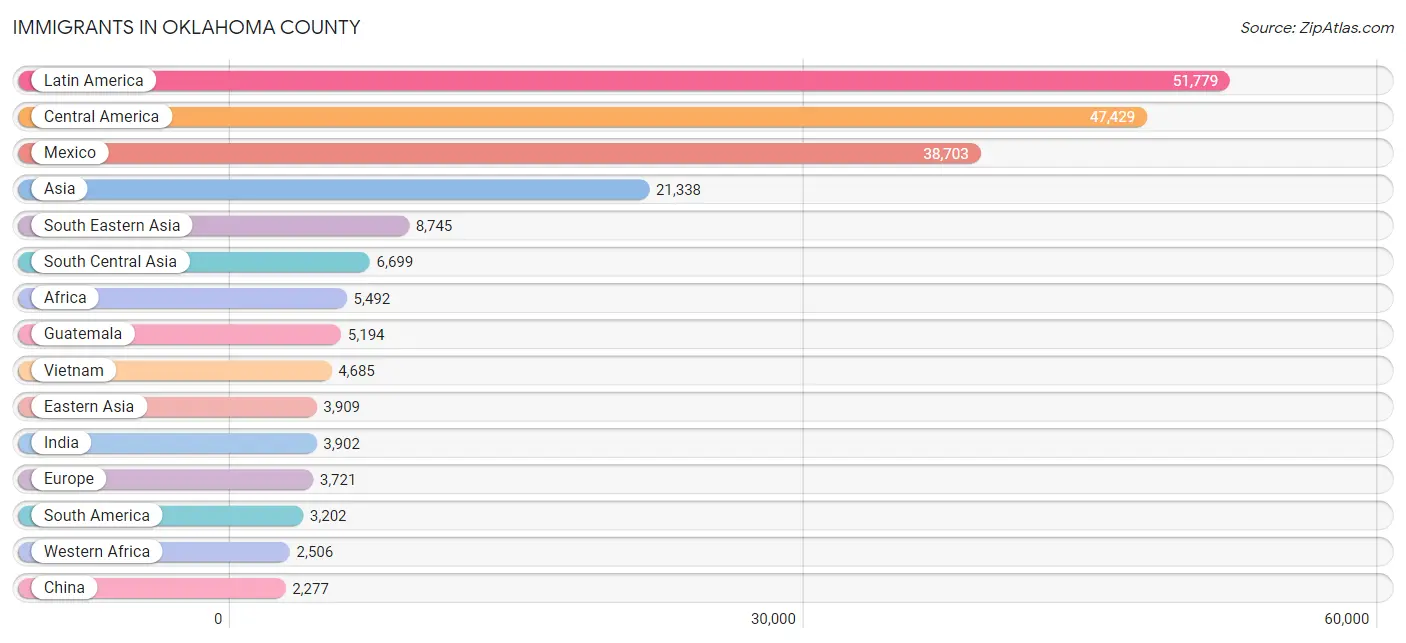
Immigrants in Oklahoma County
The most numerous immigrant groups reported in Oklahoma County came from Latin America (51,779 | 6.5%), Central America (47,429 | 6.0%), Mexico (38,703 | 4.9%), Asia (21,338 | 2.7%), and South Eastern Asia (8,745 | 1.1%), together accounting for 21.1% of all Oklahoma County residents.
| Immigration Origin | # Population | % Population |
| Afghanistan | 22 | 0.0% |
| Africa | 5,492 | 0.7% |
| Argentina | 297 | 0.0% |
| Asia | 21,338 | 2.7% |
| Australia | 27 | 0.0% |
| Austria | 14 | 0.0% |
| Bahamas | 93 | 0.0% |
| Bangladesh | 537 | 0.1% |
| Barbados | 5 | 0.0% |
| Belgium | 1 | 0.0% |
| Bolivia | 21 | 0.0% |
| Bosnia and Herzegovina | 19 | 0.0% |
| Brazil | 304 | 0.0% |
| Bulgaria | 140 | 0.0% |
| Cambodia | 183 | 0.0% |
| Cameroon | 489 | 0.1% |
| Canada | 1,594 | 0.2% |
| Caribbean | 1,148 | 0.1% |
| Central America | 47,429 | 6.0% |
| Chile | 125 | 0.0% |
| China | 2,277 | 0.3% |
| Colombia | 723 | 0.1% |
| Costa Rica | 18 | 0.0% |
| Croatia | 6 | 0.0% |
| Cuba | 290 | 0.0% |
| Czechoslovakia | 37 | 0.0% |
| Denmark | 10 | 0.0% |
| Dominican Republic | 187 | 0.0% |
| Eastern Africa | 1,525 | 0.2% |
| Eastern Asia | 3,909 | 0.5% |
| Eastern Europe | 890 | 0.1% |
| Ecuador | 197 | 0.0% |
| Egypt | 32 | 0.0% |
| El Salvador | 1,257 | 0.2% |
| England | 533 | 0.1% |
| Eritrea | 238 | 0.0% |
| Ethiopia | 458 | 0.1% |
| Europe | 3,721 | 0.5% |
| Fiji | 7 | 0.0% |
| France | 59 | 0.0% |
| Germany | 1,097 | 0.1% |
| Ghana | 621 | 0.1% |
| Greece | 36 | 0.0% |
| Grenada | 37 | 0.0% |
| Guatemala | 5,194 | 0.6% |
| Guyana | 57 | 0.0% |
| Haiti | 42 | 0.0% |
| Honduras | 1,860 | 0.2% |
| Hong Kong | 77 | 0.0% |
| Hungary | 9 | 0.0% |
| India | 3,902 | 0.5% |
| Indonesia | 232 | 0.0% |
| Iran | 920 | 0.1% |
| Iraq | 380 | 0.1% |
| Ireland | 24 | 0.0% |
| Israel | 111 | 0.0% |
| Italy | 181 | 0.0% |
| Jamaica | 219 | 0.0% |
| Japan | 558 | 0.1% |
| Jordan | 73 | 0.0% |
| Kazakhstan | 152 | 0.0% |
| Kenya | 518 | 0.1% |
| Korea | 1,059 | 0.1% |
| Kuwait | 219 | 0.0% |
| Laos | 528 | 0.1% |
| Latin America | 51,779 | 6.5% |
| Latvia | 7 | 0.0% |
| Lebanon | 113 | 0.0% |
| Liberia | 174 | 0.0% |
| Malaysia | 236 | 0.0% |
| Mexico | 38,703 | 4.9% |
| Micronesia | 12 | 0.0% |
| Middle Africa | 561 | 0.1% |
| Morocco | 309 | 0.0% |
| Nepal | 241 | 0.0% |
| Netherlands | 12 | 0.0% |
| Nicaragua | 300 | 0.0% |
| Nigeria | 1,257 | 0.2% |
| Northern Africa | 412 | 0.1% |
| Northern Europe | 1,025 | 0.1% |
| Norway | 9 | 0.0% |
| Oceania | 185 | 0.0% |
| Pakistan | 836 | 0.1% |
| Panama | 97 | 0.0% |
| Peru | 554 | 0.1% |
| Philippines | 1,432 | 0.2% |
| Poland | 119 | 0.0% |
| Portugal | 316 | 0.0% |
| Romania | 148 | 0.0% |
| Russia | 337 | 0.0% |
| Saudi Arabia | 430 | 0.1% |
| Scotland | 125 | 0.0% |
| Senegal | 112 | 0.0% |
| Serbia | 6 | 0.0% |
| Sierra Leone | 40 | 0.0% |
| Singapore | 50 | 0.0% |
| Somalia | 80 | 0.0% |
| South Africa | 76 | 0.0% |
| South America | 3,202 | 0.4% |
| South Central Asia | 6,699 | 0.8% |
| South Eastern Asia | 8,745 | 1.1% |
| Southern Europe | 613 | 0.1% |
| Spain | 80 | 0.0% |
| Sri Lanka | 74 | 0.0% |
| Sudan | 43 | 0.0% |
| Sweden | 64 | 0.0% |
| Syria | 251 | 0.0% |
| Taiwan | 635 | 0.1% |
| Thailand | 784 | 0.1% |
| Trinidad and Tobago | 147 | 0.0% |
| Turkey | 163 | 0.0% |
| Uganda | 8 | 0.0% |
| Ukraine | 58 | 0.0% |
| Uzbekistan | 15 | 0.0% |
| Venezuela | 924 | 0.1% |
| Vietnam | 4,685 | 0.6% |
| Western Africa | 2,506 | 0.3% |
| Western Asia | 1,788 | 0.2% |
| Western Europe | 1,183 | 0.2% |
| Yemen | 4 | 0.0% |
| Zaire | 72 | 0.0% |
| Zimbabwe | 140 | 0.0% | View All 122 Rows |
Sex and Age in Oklahoma County
Sex and Age in Oklahoma County
The most populous age groups in Oklahoma County are 25 to 29 Years (30,314 | 7.7%) for men and 25 to 29 Years (30,283 | 7.5%) for women.
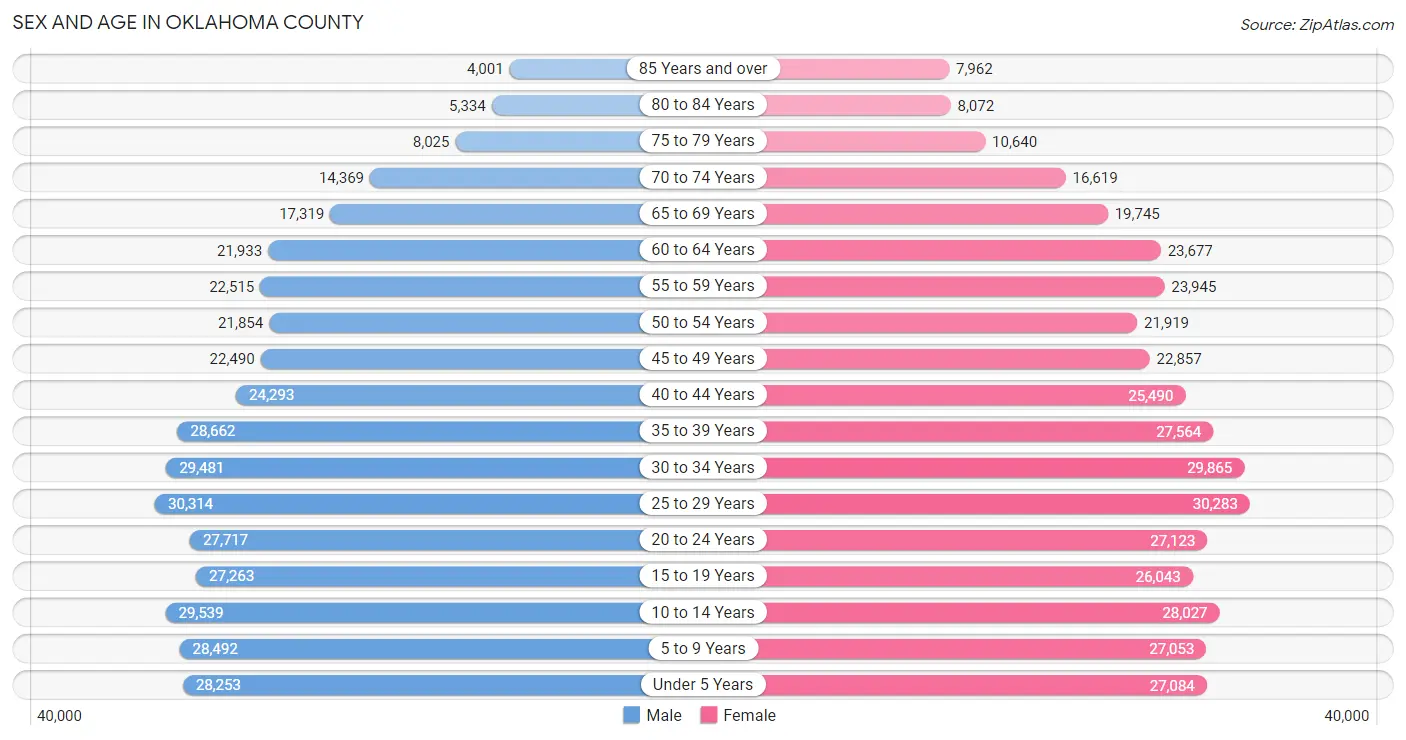
| Age Bracket | Male | Female |
| Under 5 Years | 28,253 (7.2%) | 27,084 (6.7%) |
| 5 to 9 Years | 28,492 (7.3%) | 27,053 (6.7%) |
| 10 to 14 Years | 29,539 (7.5%) | 28,027 (6.9%) |
| 15 to 19 Years | 27,263 (7.0%) | 26,043 (6.5%) |
| 20 to 24 Years | 27,717 (7.1%) | 27,123 (6.7%) |
| 25 to 29 Years | 30,314 (7.7%) | 30,283 (7.5%) |
| 30 to 34 Years | 29,481 (7.5%) | 29,865 (7.4%) |
| 35 to 39 Years | 28,662 (7.3%) | 27,564 (6.8%) |
| 40 to 44 Years | 24,293 (6.2%) | 25,490 (6.3%) |
| 45 to 49 Years | 22,490 (5.7%) | 22,857 (5.7%) |
| 50 to 54 Years | 21,854 (5.6%) | 21,919 (5.4%) |
| 55 to 59 Years | 22,515 (5.8%) | 23,945 (5.9%) |
| 60 to 64 Years | 21,933 (5.6%) | 23,677 (5.9%) |
| 65 to 69 Years | 17,319 (4.4%) | 19,745 (4.9%) |
| 70 to 74 Years | 14,369 (3.7%) | 16,619 (4.1%) |
| 75 to 79 Years | 8,025 (2.1%) | 10,640 (2.6%) |
| 80 to 84 Years | 5,334 (1.4%) | 8,072 (2.0%) |
| 85 Years and over | 4,001 (1.0%) | 7,962 (2.0%) |
| Total | 391,854 (100.0%) | 403,968 (100.0%) |
Families and Households in Oklahoma County
Median Family Size in Oklahoma County
The median family size in Oklahoma County is 3.13 persons per family, with married-couple families (135,342 | 69.4%) accounting for the largest median family size of 3.18 persons per family. On the other hand, single male/father families (16,471 | 8.4%) represent the smallest median family size with 2.89 persons per family.
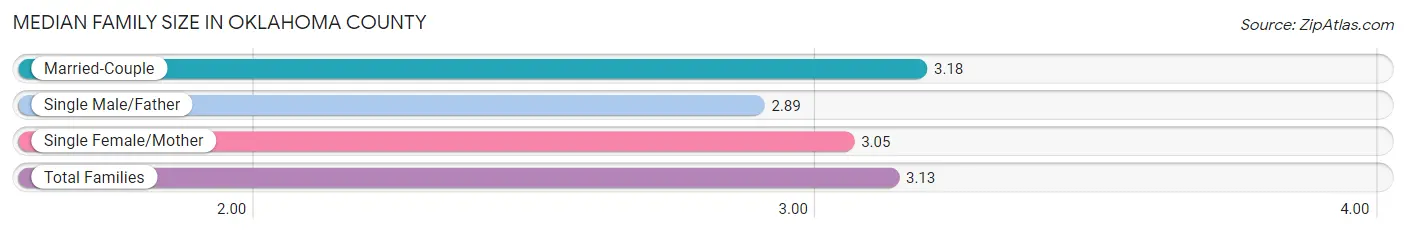
| Family Type | # Families | Family Size |
| Married-Couple | 135,342 (69.4%) | 3.18 |
| Single Male/Father | 16,471 (8.4%) | 2.89 |
| Single Female/Mother | 43,227 (22.2%) | 3.05 |
| Total Families | 195,040 (100.0%) | 3.13 |
Median Household Size in Oklahoma County
The median household size in Oklahoma County is 2.45 persons per household, with single male/father households (16,471 | 5.2%) accounting for the largest median household size of 3.26 persons per household. non-family households (123,172 | 38.7%) represent the smallest median household size with 1.23 persons per household.
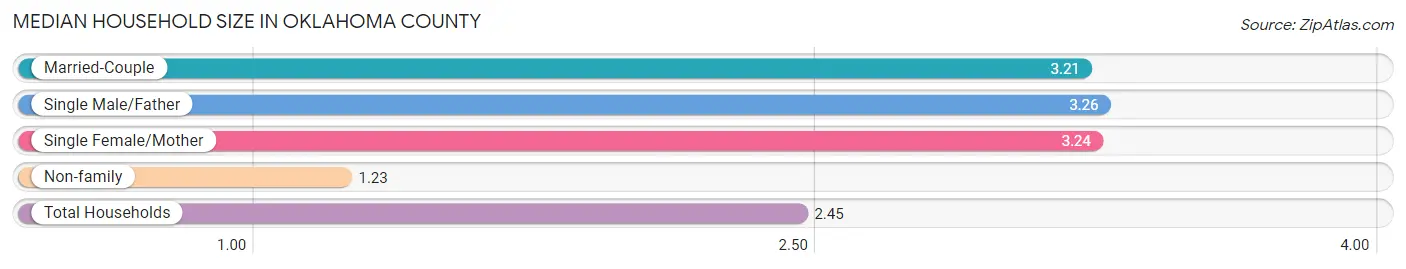
| Household Type | # Households | Household Size |
| Married-Couple | 135,342 (42.5%) | 3.21 |
| Single Male/Father | 16,471 (5.2%) | 3.26 |
| Single Female/Mother | 43,227 (13.6%) | 3.24 |
| Non-family | 123,172 (38.7%) | 1.23 |
| Total Households | 318,212 (100.0%) | 2.45 |
Household Size by Marriage Status in Oklahoma County
Out of a total of 318,212 households in Oklahoma County, 195,040 (61.3%) are family households, while 123,172 (38.7%) are nonfamily households. The most numerous type of family households are 2-person households, comprising 84,308, and the most common type of nonfamily households are 1-person households, comprising 100,456.
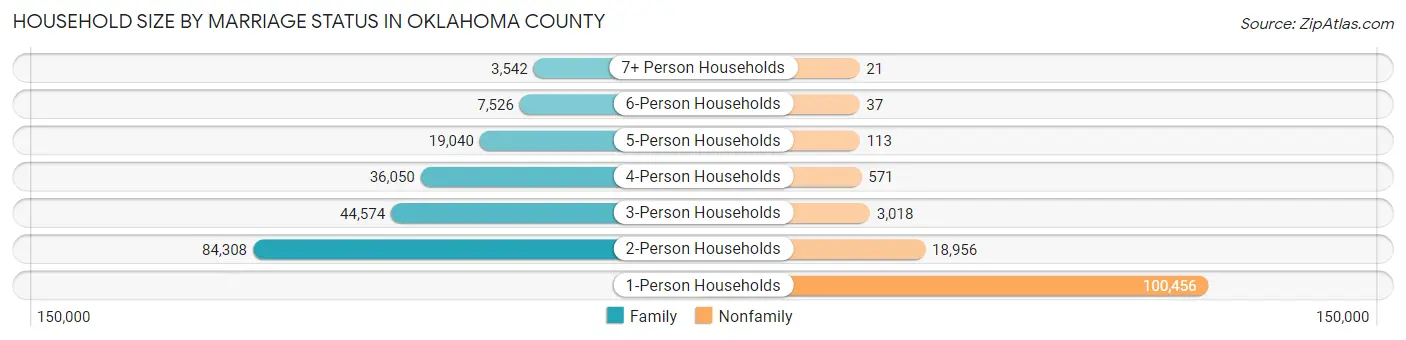
| Household Size | Family Households | Nonfamily Households |
| 1-Person Households | - | 100,456 (31.6%) |
| 2-Person Households | 84,308 (26.5%) | 18,956 (6.0%) |
| 3-Person Households | 44,574 (14.0%) | 3,018 (0.9%) |
| 4-Person Households | 36,050 (11.3%) | 571 (0.2%) |
| 5-Person Households | 19,040 (6.0%) | 113 (0.0%) |
| 6-Person Households | 7,526 (2.4%) | 37 (0.0%) |
| 7+ Person Households | 3,542 (1.1%) | 21 (0.0%) |
| Total | 195,040 (61.3%) | 123,172 (38.7%) |
Female Fertility in Oklahoma County
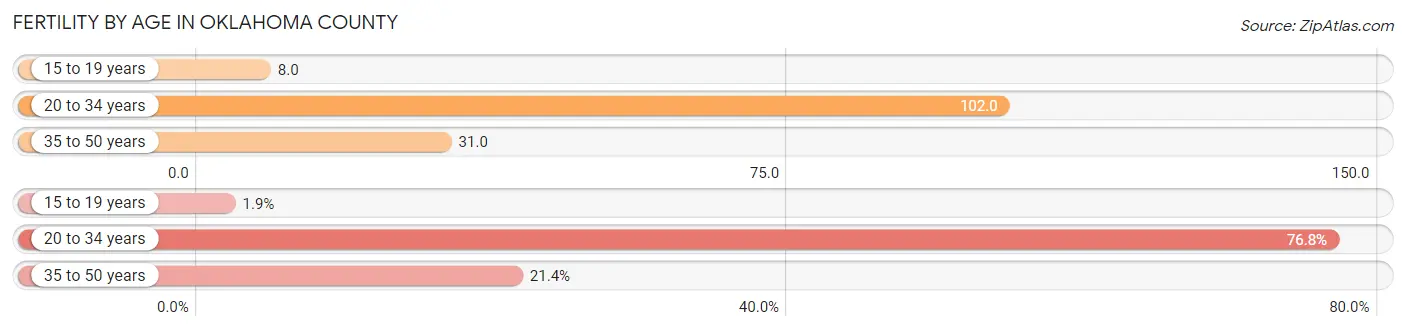
Fertility by Age in Oklahoma County
Average fertility rate in Oklahoma County is 60.0 births per 1,000 women. Women in the age bracket of 20 to 34 years have the highest fertility rate with 102.0 births per 1,000 women. Women in the age bracket of 20 to 34 years acount for 76.7% of all women with births.
| Age Bracket | Women with Births | Births / 1,000 Women |
| 15 to 19 years | 217 (1.9%) | 8.0 |
| 20 to 34 years | 8,892 (76.7%) | 102.0 |
| 35 to 50 years | 2,476 (21.4%) | 31.0 |
| Total | 11,585 (100.0%) | 60.0 |
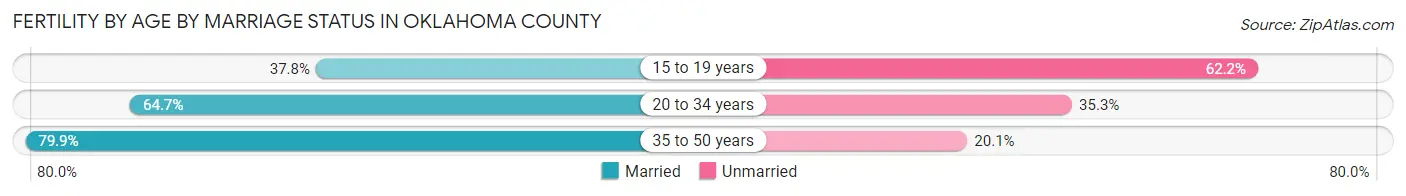
Fertility by Age by Marriage Status in Oklahoma County
67.5% of women with births (11,585) in Oklahoma County are married. The highest percentage of unmarried women with births falls into 15 to 19 years age bracket with 62.2% of them unmarried at the time of birth, while the lowest percentage of unmarried women with births belong to 35 to 50 years age bracket with 20.1% of them unmarried.
| Age Bracket | Married | Unmarried |
| 15 to 19 years | 82 (37.8%) | 135 (62.2%) |
| 20 to 34 years | 5,753 (64.7%) | 3,139 (35.3%) |
| 35 to 50 years | 1,978 (79.9%) | 498 (20.1%) |
| Total | 7,820 (67.5%) | 3,765 (32.5%) |
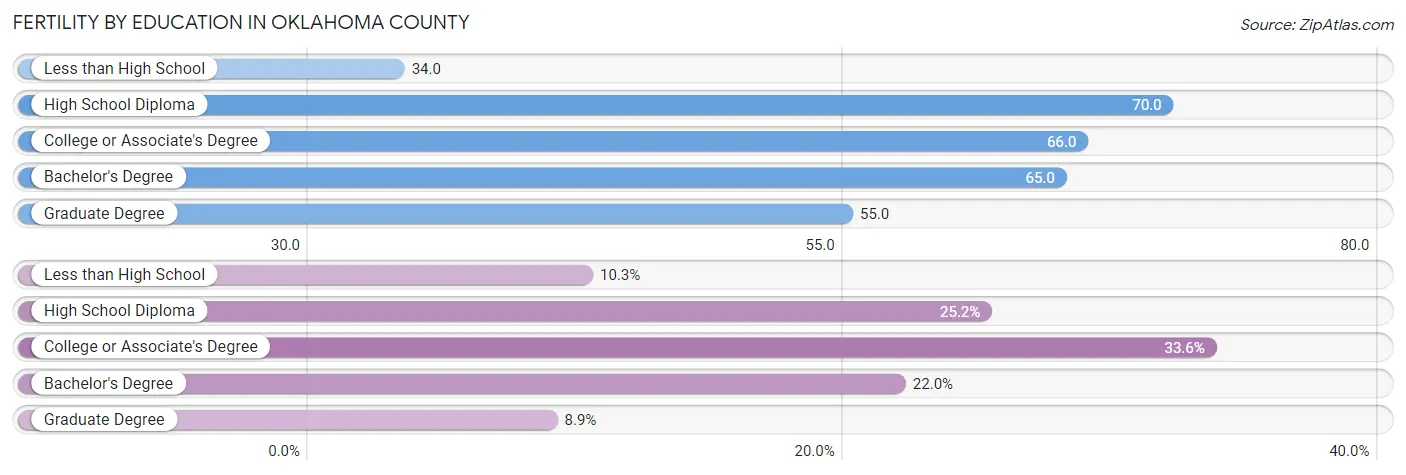
Fertility by Education in Oklahoma County
Average fertility rate in Oklahoma County is 60.0 births per 1,000 women. Women with the education attainment of high school diploma have the highest fertility rate of 70.0 births per 1,000 women, while women with the education attainment of less than high school have the lowest fertility at 34.0 births per 1,000 women. Women with the education attainment of college or associate's degree represent 33.6% of all women with births.
| Educational Attainment | Women with Births | Births / 1,000 Women |
| Less than High School | 1,189 (10.3%) | 34.0 |
| High School Diploma | 2,920 (25.2%) | 70.0 |
| College or Associate's Degree | 3,895 (33.6%) | 66.0 |
| Bachelor's Degree | 2,546 (22.0%) | 65.0 |
| Graduate Degree | 1,035 (8.9%) | 55.0 |
| Total | 11,585 (100.0%) | 60.0 |
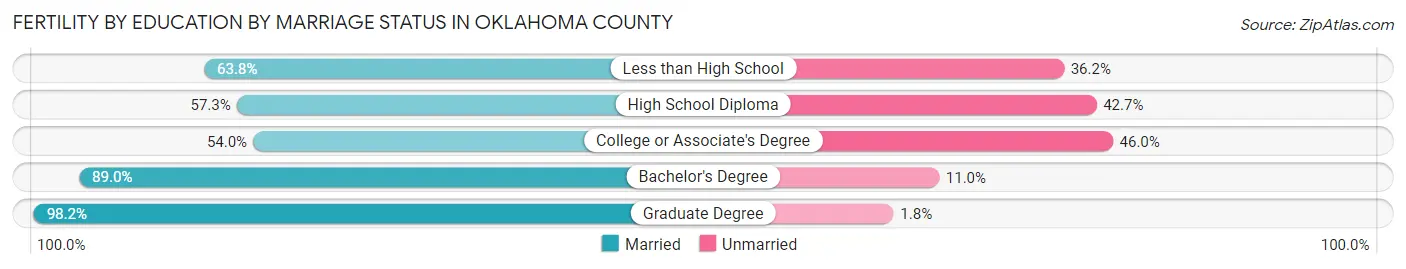
Fertility by Education by Marriage Status in Oklahoma County
32.5% of women with births in Oklahoma County are unmarried. Women with the educational attainment of graduate degree are most likely to be married with 98.2% of them married at childbirth, while women with the educational attainment of college or associate's degree are least likely to be married with 46.0% of them unmarried at childbirth.
| Educational Attainment | Married | Unmarried |
| Less than High School | 759 (63.8%) | 430 (36.2%) |
| High School Diploma | 1,673 (57.3%) | 1,247 (42.7%) |
| College or Associate's Degree | 2,103 (54.0%) | 1,792 (46.0%) |
| Bachelor's Degree | 2,266 (89.0%) | 280 (11.0%) |
| Graduate Degree | 1,016 (98.2%) | 19 (1.8%) |
| Total | 7,820 (67.5%) | 3,765 (32.5%) |
Income in Oklahoma County
Income Overview in Oklahoma County
Per Capita Income in Oklahoma County is $36,987, while median incomes of families and households are $78,496 and $62,505 respectively.
| Characteristic | Number | Measure |
| Per Capita Income | 795,822 | $36,987 |
| Median Family Income | 195,040 | $78,496 |
| Mean Family Income | 195,040 | $109,955 |
| Median Household Income | 318,212 | $62,505 |
| Mean Household Income | 318,212 | $90,810 |
| Income Deficit | 195,040 | $11,578 |
| Wage / Income Gap (%) | 795,822 | 26.88% |
| Wage / Income Gap ($) | 795,822 | 73.12¢ per $1 |
| Gini / Inequality Index | 795,822 | 0.49 |
Earnings by Sex in Oklahoma County
Average Earnings in Oklahoma County are $38,621, $44,716 for men and $32,698 for women, a difference of 26.9%.
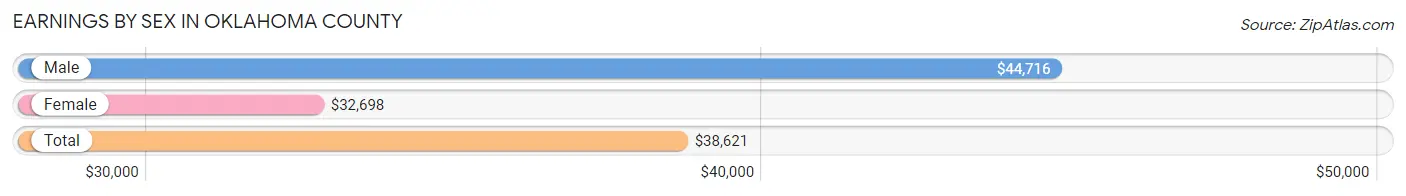
| Sex | Number | Average Earnings |
| Male | 222,054 (52.9%) | $44,716 |
| Female | 197,631 (47.1%) | $32,698 |
| Total | 419,685 (100.0%) | $38,621 |
Earnings by Sex by Income Bracket in Oklahoma County
The most common earnings brackets in Oklahoma County are $100,000+ for men (35,743 | 16.1%) and $25,000 to $29,999 for women (14,925 | 7.5%).
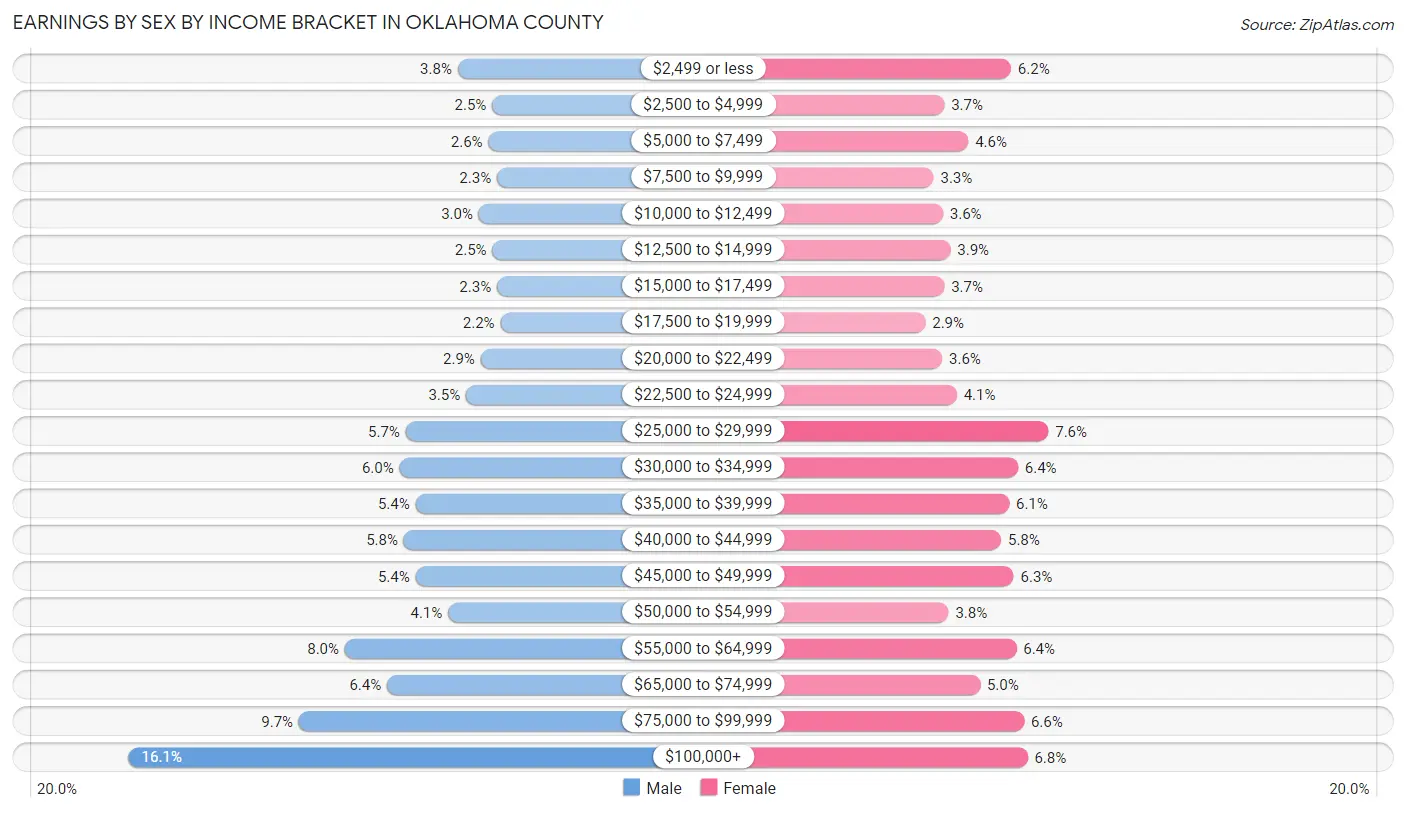
| Income | Male | Female |
| $2,499 or less | 8,376 (3.8%) | 12,145 (6.1%) |
| $2,500 to $4,999 | 5,508 (2.5%) | 7,223 (3.6%) |
| $5,000 to $7,499 | 5,808 (2.6%) | 8,996 (4.5%) |
| $7,500 to $9,999 | 5,104 (2.3%) | 6,423 (3.3%) |
| $10,000 to $12,499 | 6,613 (3.0%) | 7,119 (3.6%) |
| $12,500 to $14,999 | 5,493 (2.5%) | 7,664 (3.9%) |
| $15,000 to $17,499 | 5,107 (2.3%) | 7,208 (3.6%) |
| $17,500 to $19,999 | 4,827 (2.2%) | 5,812 (2.9%) |
| $20,000 to $22,499 | 6,465 (2.9%) | 7,064 (3.6%) |
| $22,500 to $24,999 | 7,675 (3.5%) | 8,152 (4.1%) |
| $25,000 to $29,999 | 12,702 (5.7%) | 14,925 (7.5%) |
| $30,000 to $34,999 | 13,207 (5.9%) | 12,669 (6.4%) |
| $35,000 to $39,999 | 11,890 (5.3%) | 12,017 (6.1%) |
| $40,000 to $44,999 | 12,868 (5.8%) | 11,417 (5.8%) |
| $45,000 to $49,999 | 11,890 (5.3%) | 12,348 (6.2%) |
| $50,000 to $54,999 | 9,168 (4.1%) | 7,533 (3.8%) |
| $55,000 to $64,999 | 17,773 (8.0%) | 12,558 (6.4%) |
| $65,000 to $74,999 | 14,246 (6.4%) | 9,860 (5.0%) |
| $75,000 to $99,999 | 21,591 (9.7%) | 13,117 (6.6%) |
| $100,000+ | 35,743 (16.1%) | 13,381 (6.8%) |
| Total | 222,054 (100.0%) | 197,631 (100.0%) |
Earnings by Sex by Educational Attainment in Oklahoma County
Average earnings in Oklahoma County are $50,995 for men and $37,620 for women, a difference of 26.2%. Men with an educational attainment of graduate degree enjoy the highest average annual earnings of $95,567, while those with less than high school education earn the least with $34,096. Women with an educational attainment of graduate degree earn the most with the average annual earnings of $63,334, while those with less than high school education have the smallest earnings of $21,474.
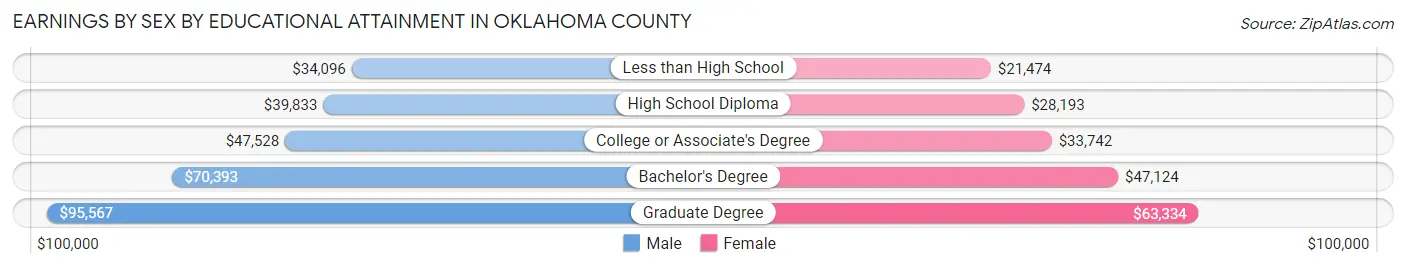
| Educational Attainment | Male Income | Female Income |
| Less than High School | $34,096 | $21,474 |
| High School Diploma | $39,833 | $28,193 |
| College or Associate's Degree | $47,528 | $33,742 |
| Bachelor's Degree | $70,393 | $47,124 |
| Graduate Degree | $95,567 | $63,334 |
| Total | $50,995 | $37,620 |
Family Income in Oklahoma County
Family Income Brackets in Oklahoma County
According to the Oklahoma County family income data, there are 34,327 families falling into the $100,000 to $149,999 income range, which is the most common income bracket and makes up 17.6% of all families. Conversely, the $10,000 to $14,999 income bracket is the least frequent group with only 5,071 families (2.6%) belonging to this category.
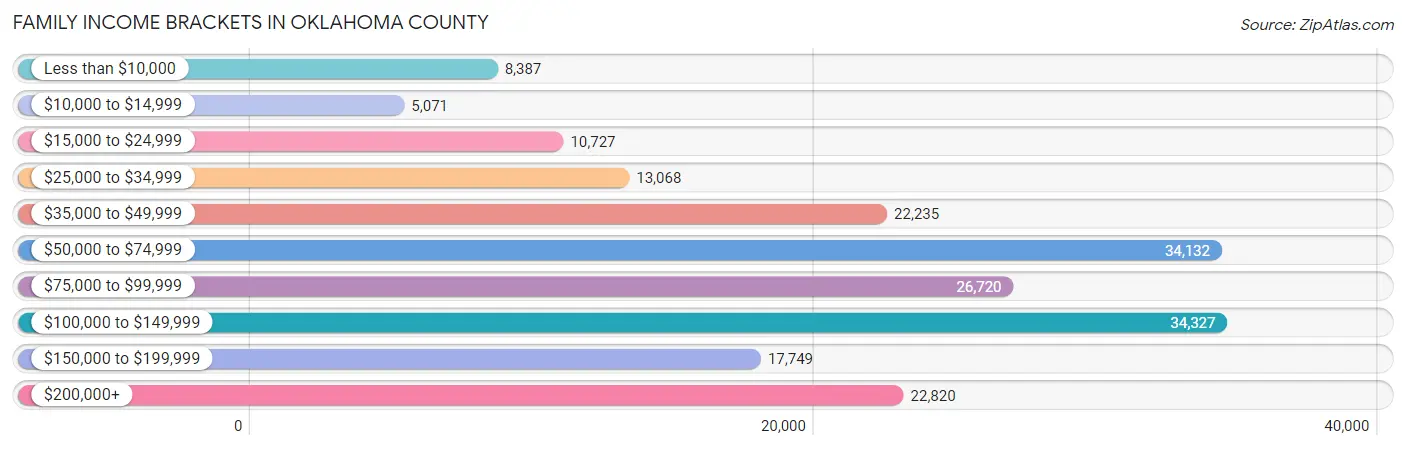
| Income Bracket | # Families | % Families |
| Less than $10,000 | 8,387 | 4.3% |
| $10,000 to $14,999 | 5,071 | 2.6% |
| $15,000 to $24,999 | 10,727 | 5.5% |
| $25,000 to $34,999 | 13,068 | 6.7% |
| $35,000 to $49,999 | 22,235 | 11.4% |
| $50,000 to $74,999 | 34,132 | 17.5% |
| $75,000 to $99,999 | 26,720 | 13.7% |
| $100,000 to $149,999 | 34,327 | 17.6% |
| $150,000 to $199,999 | 17,749 | 9.1% |
| $200,000+ | 22,820 | 11.7% |
Family Income by Famaliy Size in Oklahoma County
6-person families (6,579 | 3.4%) account for the highest median family income in Oklahoma County with $90,657 per family, while 2-person families (91,198 | 46.8%) have the highest median income of $36,782 per family member.
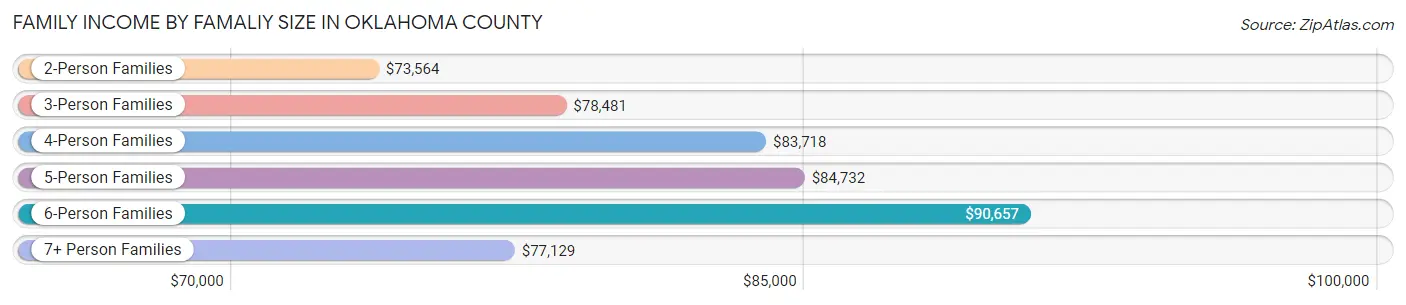
| Income Bracket | # Families | Median Income |
| 2-Person Families | 91,198 (46.8%) | $73,564 |
| 3-Person Families | 41,997 (21.5%) | $78,481 |
| 4-Person Families | 35,204 (18.0%) | $83,718 |
| 5-Person Families | 17,130 (8.8%) | $84,732 |
| 6-Person Families | 6,579 (3.4%) | $90,657 |
| 7+ Person Families | 2,932 (1.5%) | $77,129 |
| Total | 195,040 (100.0%) | $78,496 |
Family Income by Number of Earners in Oklahoma County
The median family income in Oklahoma County is $78,496, with families comprising 3+ earners (18,370) having the highest median family income of $121,873, while families with no earners (26,128) have the lowest median family income of $42,332, accounting for 9.4% and 13.4% of families, respectively.
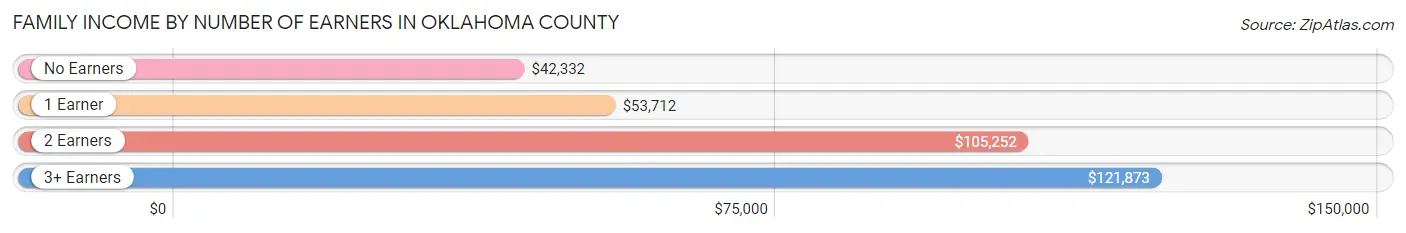
| Number of Earners | # Families | Median Income |
| No Earners | 26,128 (13.4%) | $42,332 |
| 1 Earner | 69,345 (35.5%) | $53,712 |
| 2 Earners | 81,197 (41.6%) | $105,252 |
| 3+ Earners | 18,370 (9.4%) | $121,873 |
| Total | 195,040 (100.0%) | $78,496 |
Household Income in Oklahoma County
Household Income Brackets in Oklahoma County
With 56,960 households falling in the category, the $50,000 to $74,999 income range is the most frequent in Oklahoma County, accounting for 17.9% of all households. In contrast, only 14,001 households (4.4%) fall into the $10,000 to $14,999 income bracket, making it the least populous group.
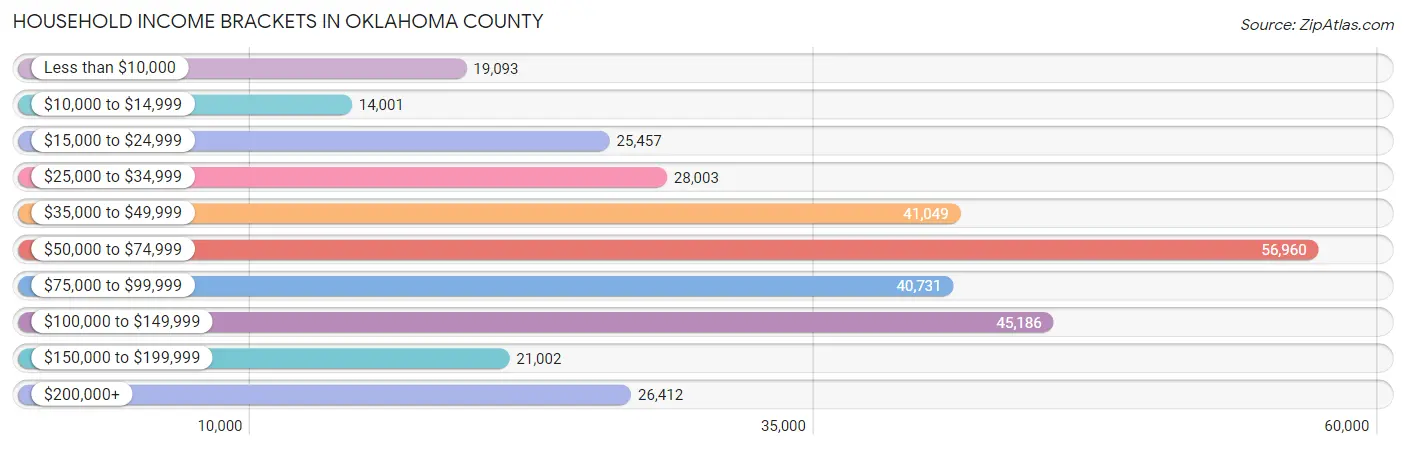
| Income Bracket | # Households | % Households |
| Less than $10,000 | 19,093 | 6.0% |
| $10,000 to $14,999 | 14,001 | 4.4% |
| $15,000 to $24,999 | 25,457 | 8.0% |
| $25,000 to $34,999 | 28,003 | 8.8% |
| $35,000 to $49,999 | 41,049 | 12.9% |
| $50,000 to $74,999 | 56,960 | 17.9% |
| $75,000 to $99,999 | 40,731 | 12.8% |
| $100,000 to $149,999 | 45,186 | 14.2% |
| $150,000 to $199,999 | 21,002 | 6.6% |
| $200,000+ | 26,412 | 8.3% |
Household Income by Householder Age in Oklahoma County
The median household income in Oklahoma County is $62,505, with the highest median household income of $72,826 found in the 45 to 64 years age bracket for the primary householder. A total of 105,942 households (33.3%) fall into this category. Meanwhile, the 15 to 24 years age bracket for the primary householder has the lowest median household income of $37,239, with 17,781 households (5.6%) in this group.
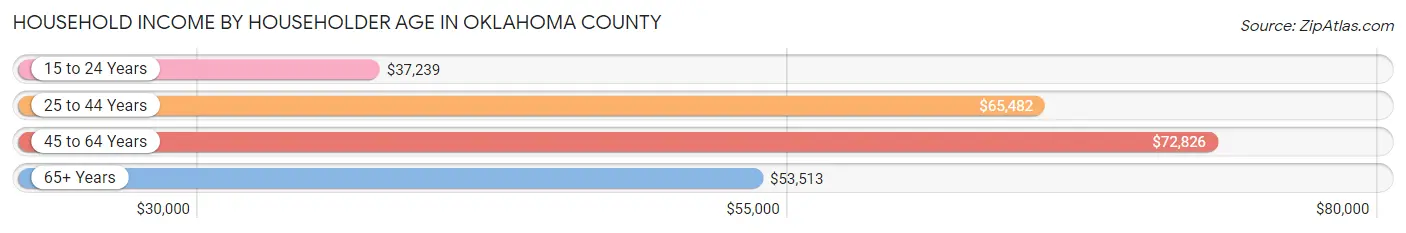
| Income Bracket | # Households | Median Income |
| 15 to 24 Years | 17,781 (5.6%) | $37,239 |
| 25 to 44 Years | 120,404 (37.8%) | $65,482 |
| 45 to 64 Years | 105,942 (33.3%) | $72,826 |
| 65+ Years | 74,085 (23.3%) | $53,513 |
| Total | 318,212 (100.0%) | $62,505 |
Poverty in Oklahoma County
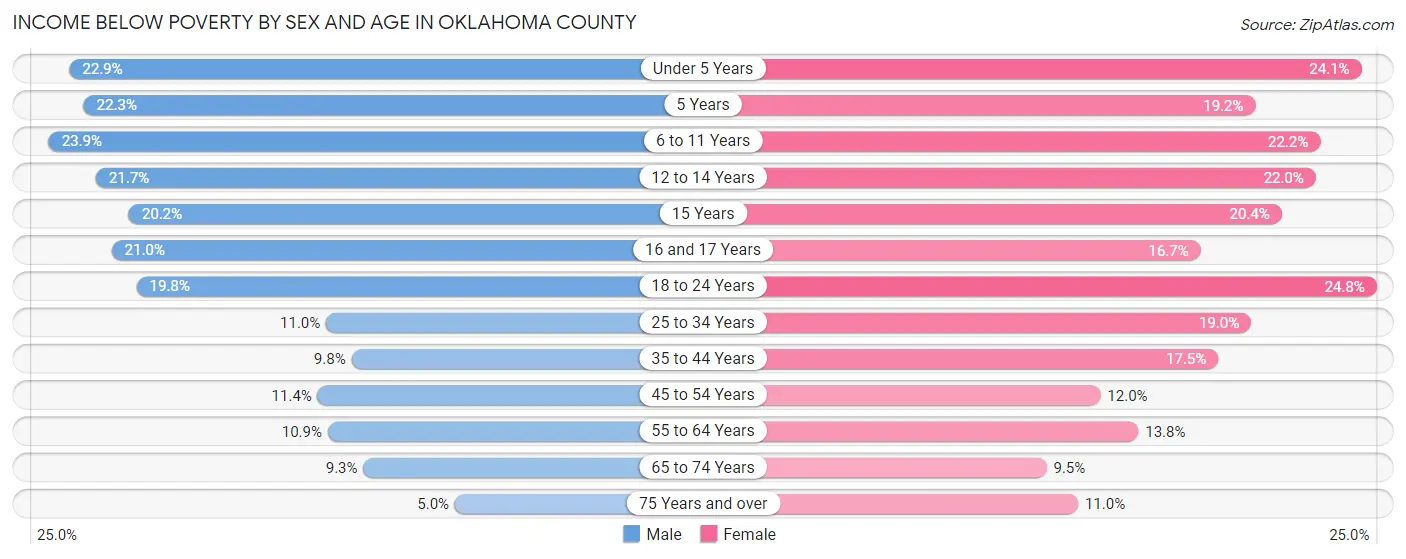
Income Below Poverty by Sex and Age in Oklahoma County
With 14.4% poverty level for males and 17.2% for females among the residents of Oklahoma County, 6 to 11 year old males and 18 to 24 year old females are the most vulnerable to poverty, with 8,198 males (23.9%) and 8,555 females (24.8%) in their respective age groups living below the poverty level.
| Age Bracket | Male | Female |
| Under 5 Years | 6,351 (22.9%) | 6,470 (24.1%) |
| 5 Years | 1,286 (22.3%) | 1,092 (19.2%) |
| 6 to 11 Years | 8,198 (23.9%) | 7,192 (22.2%) |
| 12 to 14 Years | 3,689 (21.7%) | 3,511 (22.0%) |
| 15 Years | 1,077 (20.2%) | 1,017 (20.4%) |
| 16 and 17 Years | 2,360 (21.0%) | 1,794 (16.7%) |
| 18 to 24 Years | 6,860 (19.8%) | 8,555 (24.8%) |
| 25 to 34 Years | 6,463 (11.0%) | 11,369 (19.0%) |
| 35 to 44 Years | 5,126 (9.8%) | 9,239 (17.5%) |
| 45 to 54 Years | 4,993 (11.4%) | 5,351 (12.0%) |
| 55 to 64 Years | 4,817 (10.9%) | 6,499 (13.8%) |
| 65 to 74 Years | 2,900 (9.3%) | 3,394 (9.5%) |
| 75 Years and over | 850 (5.0%) | 2,790 (11.0%) |
| Total | 54,970 (14.4%) | 68,273 (17.2%) |
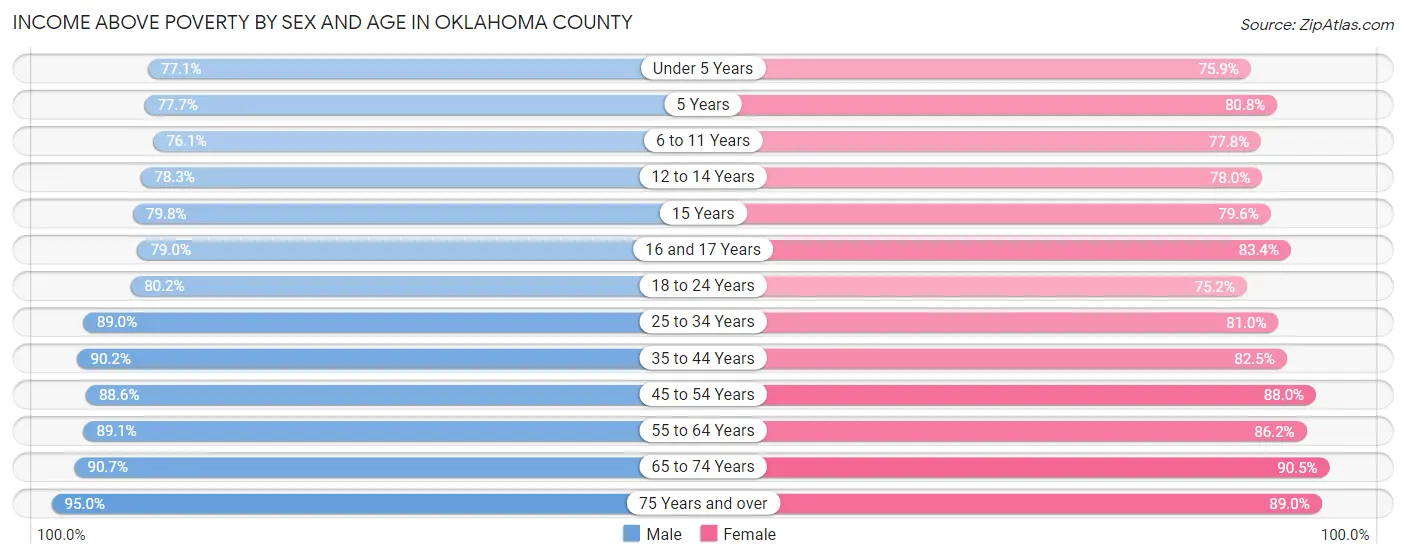
Income Above Poverty by Sex and Age in Oklahoma County
According to the poverty statistics in Oklahoma County, males aged 75 years and over and females aged 65 to 74 years are the age groups that are most secure financially, with 95.0% of males and 90.5% of females in these age groups living above the poverty line.
| Age Bracket | Male | Female |
| Under 5 Years | 21,354 (77.1%) | 20,360 (75.9%) |
| 5 Years | 4,490 (77.7%) | 4,598 (80.8%) |
| 6 to 11 Years | 26,136 (76.1%) | 25,217 (77.8%) |
| 12 to 14 Years | 13,320 (78.3%) | 12,456 (78.0%) |
| 15 Years | 4,265 (79.8%) | 3,965 (79.6%) |
| 16 and 17 Years | 8,897 (79.0%) | 8,982 (83.4%) |
| 18 to 24 Years | 27,781 (80.2%) | 25,920 (75.2%) |
| 25 to 34 Years | 52,221 (89.0%) | 48,511 (81.0%) |
| 35 to 44 Years | 47,010 (90.2%) | 43,691 (82.5%) |
| 45 to 54 Years | 38,812 (88.6%) | 39,251 (88.0%) |
| 55 to 64 Years | 39,235 (89.1%) | 40,728 (86.2%) |
| 65 to 74 Years | 28,345 (90.7%) | 32,346 (90.5%) |
| 75 Years and over | 16,036 (95.0%) | 22,670 (89.0%) |
| Total | 327,902 (85.6%) | 328,695 (82.8%) |
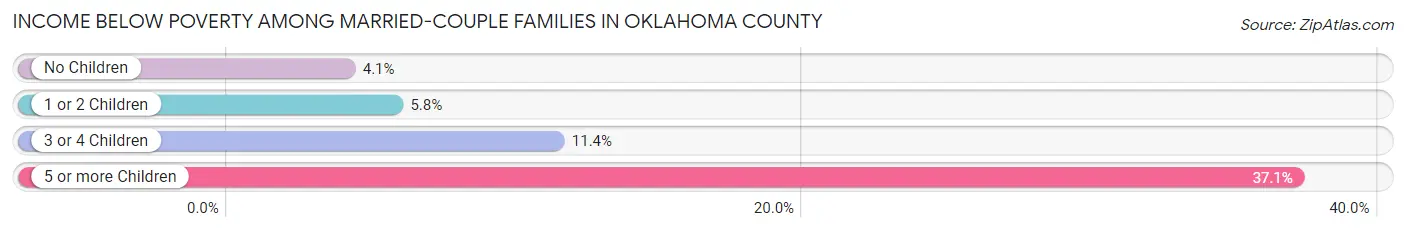
Income Below Poverty Among Married-Couple Families in Oklahoma County
The poverty statistics for married-couple families in Oklahoma County show that 5.7% or 7,650 of the total 135,342 families live below the poverty line. Families with 5 or more children have the highest poverty rate of 37.1%, comprising of 436 families. On the other hand, families with no children have the lowest poverty rate of 4.1%, which includes 3,118 families.
| Children | Above Poverty | Below Poverty |
| No Children | 72,994 (95.9%) | 3,118 (4.1%) |
| 1 or 2 Children | 42,073 (94.2%) | 2,570 (5.8%) |
| 3 or 4 Children | 11,887 (88.6%) | 1,526 (11.4%) |
| 5 or more Children | 738 (62.9%) | 436 (37.1%) |
| Total | 127,692 (94.4%) | 7,650 (5.7%) |
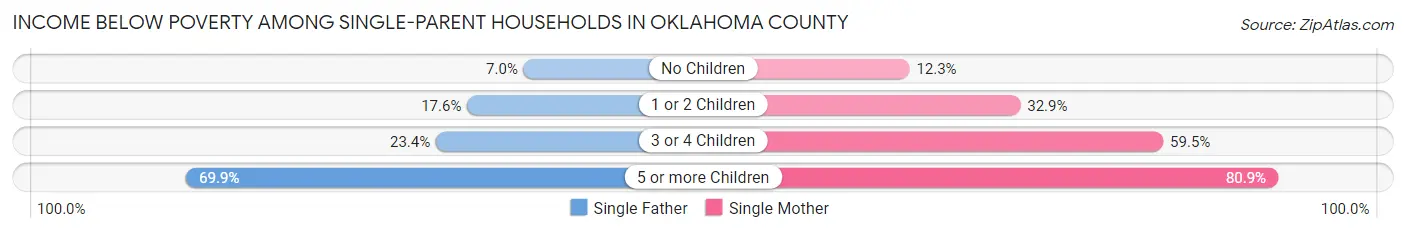
Income Below Poverty Among Single-Parent Households in Oklahoma County
According to the poverty data in Oklahoma County, 14.0% or 2,302 single-father households and 30.7% or 13,278 single-mother households are living below the poverty line. Among single-father households, those with 5 or more children have the highest poverty rate, with 93 households (69.9%) experiencing poverty. Likewise, among single-mother households, those with 5 or more children have the highest poverty rate, with 554 households (80.9%) falling below the poverty line.
| Children | Single Father | Single Mother |
| No Children | 505 (7.0%) | 1,745 (12.2%) |
| 1 or 2 Children | 1,314 (17.5%) | 7,251 (32.9%) |
| 3 or 4 Children | 390 (23.4%) | 3,728 (59.5%) |
| 5 or more Children | 93 (69.9%) | 554 (80.9%) |
| Total | 2,302 (14.0%) | 13,278 (30.7%) |
Income Below Poverty Among Married-Couple vs Single-Parent Households in Oklahoma County
The poverty data for Oklahoma County shows that 7,650 of the married-couple family households (5.7%) and 15,580 of the single-parent households (26.1%) are living below the poverty level. Within the married-couple family households, those with 5 or more children have the highest poverty rate, with 436 households (37.1%) falling below the poverty line. Among the single-parent households, those with 5 or more children have the highest poverty rate, with 647 household (79.1%) living below poverty.
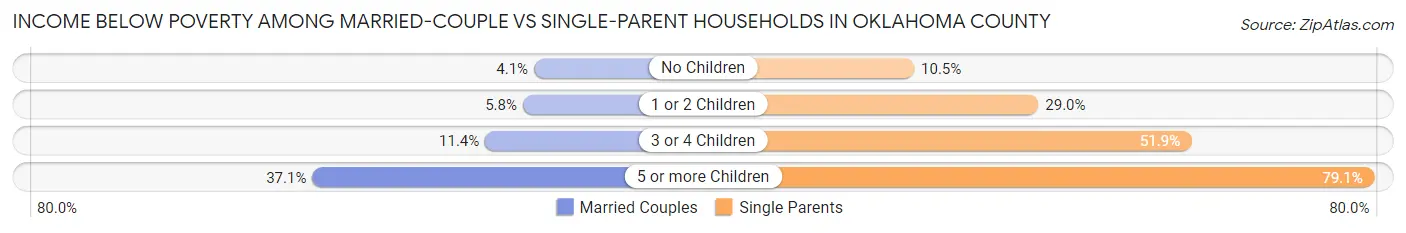
| Children | Married-Couple Families | Single-Parent Households |
| No Children | 3,118 (4.1%) | 2,250 (10.5%) |
| 1 or 2 Children | 2,570 (5.8%) | 8,565 (29.0%) |
| 3 or 4 Children | 1,526 (11.4%) | 4,118 (51.9%) |
| 5 or more Children | 436 (37.1%) | 647 (79.1%) |
| Total | 7,650 (5.7%) | 15,580 (26.1%) |
Employment Characteristics in Oklahoma County
Employment by Class of Employer in Oklahoma County
Among the 381,419 employed individuals in Oklahoma County, private company employees (245,257 | 64.3%), not-for-profit organizations (28,414 | 7.4%), and federal government employees (25,910 | 6.8%) make up the most common classes of employment.
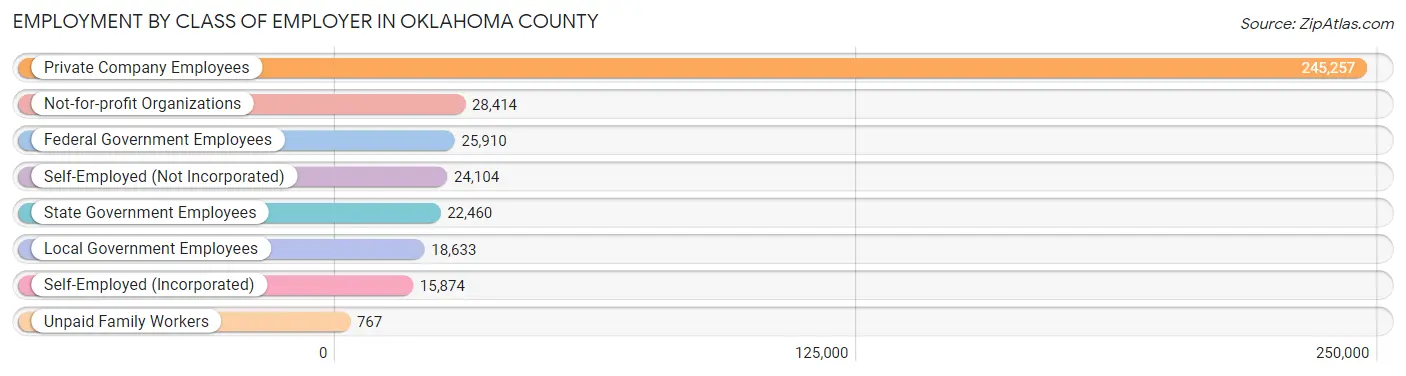
| Employer Class | # Employees | % Employees |
| Private Company Employees | 245,257 | 64.3% |
| Self-Employed (Incorporated) | 15,874 | 4.2% |
| Self-Employed (Not Incorporated) | 24,104 | 6.3% |
| Not-for-profit Organizations | 28,414 | 7.4% |
| Local Government Employees | 18,633 | 4.9% |
| State Government Employees | 22,460 | 5.9% |
| Federal Government Employees | 25,910 | 6.8% |
| Unpaid Family Workers | 767 | 0.2% |
| Total | 381,419 | 100.0% |
Employment Status by Age in Oklahoma County
According to the labor force statistics for Oklahoma County, out of the total population over 16 years of age (617,041), 65.8% or 406,013 individuals are in the labor force, with 4.6% or 18,677 of them unemployed. The age group with the highest labor force participation rate is 25 to 29 years, with 83.2% or 50,417 individuals in the labor force. Within the labor force, the 16 to 19 years age range has the highest percentage of unemployed individuals, with 13.6% or 2,449 of them being unemployed.
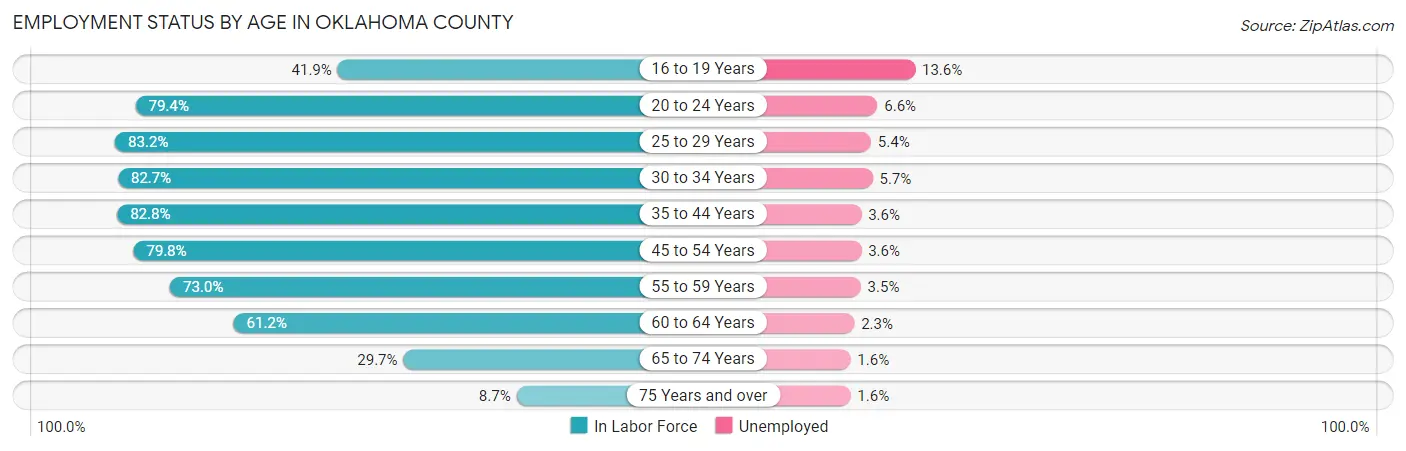
| Age Bracket | In Labor Force | Unemployed |
| 16 to 19 Years | 18,006 (41.9%) | 2,449 (13.6%) |
| 20 to 24 Years | 43,543 (79.4%) | 2,874 (6.6%) |
| 25 to 29 Years | 50,417 (83.2%) | 2,723 (5.4%) |
| 30 to 34 Years | 49,079 (82.7%) | 2,798 (5.7%) |
| 35 to 44 Years | 87,775 (82.8%) | 3,160 (3.6%) |
| 45 to 54 Years | 71,118 (79.8%) | 2,560 (3.6%) |
| 55 to 59 Years | 33,916 (73.0%) | 1,187 (3.5%) |
| 60 to 64 Years | 27,913 (61.2%) | 642 (2.3%) |
| 65 to 74 Years | 20,211 (29.7%) | 323 (1.6%) |
| 75 Years and over | 3,831 (8.7%) | 61 (1.6%) |
| Total | 406,013 (65.8%) | 18,677 (4.6%) |
Employment Status by Educational Attainment in Oklahoma County
According to labor force statistics for Oklahoma County, 78.7% of individuals (320,421) out of the total population between 25 and 64 years of age (407,142) are in the labor force, with 4.1% or 13,137 of them being unemployed. The group with the highest labor force participation rate are those with the educational attainment of bachelor's degree or higher, with 87.1% or 121,943 individuals in the labor force. Within the labor force, individuals with high school diploma education have the highest percentage of unemployment, with 6.9% or 4,856 of them being unemployed.
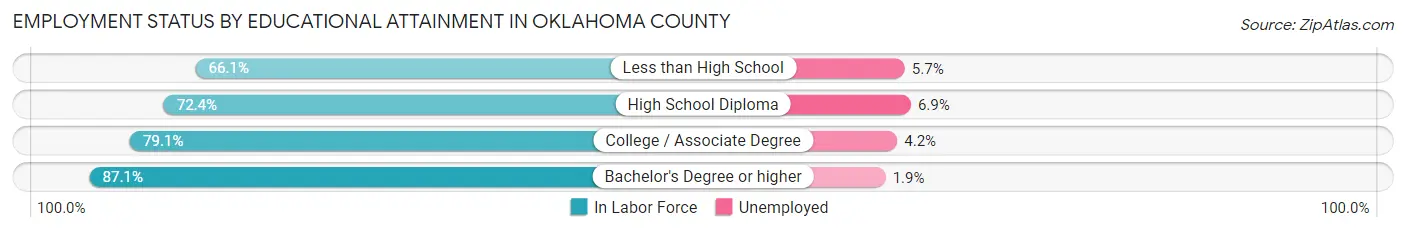
| Educational Attainment | In Labor Force | Unemployed |
| Less than High School | 32,608 (66.1%) | 2,812 (5.7%) |
| High School Diploma | 70,375 (72.4%) | 6,707 (6.9%) |
| College / Associate Degree | 95,398 (79.1%) | 5,065 (4.2%) |
| Bachelor's Degree or higher | 121,943 (87.1%) | 2,660 (1.9%) |
| Total | 320,421 (78.7%) | 16,693 (4.1%) |
Employment Occupations by Sex in Oklahoma County
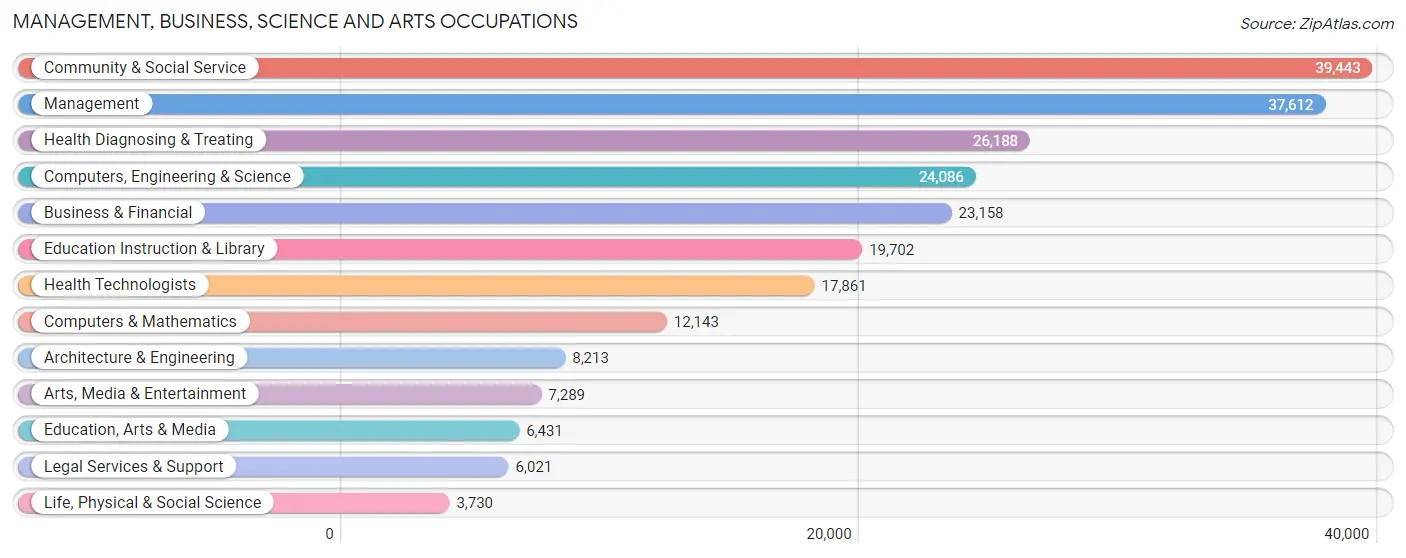
Management, Business, Science and Arts Occupations
The most common Management, Business, Science and Arts occupations in Oklahoma County are Community & Social Service (39,443 | 10.3%), Management (37,612 | 9.9%), Health Diagnosing & Treating (26,188 | 6.9%), Computers, Engineering & Science (24,086 | 6.3%), and Business & Financial (23,158 | 6.1%).
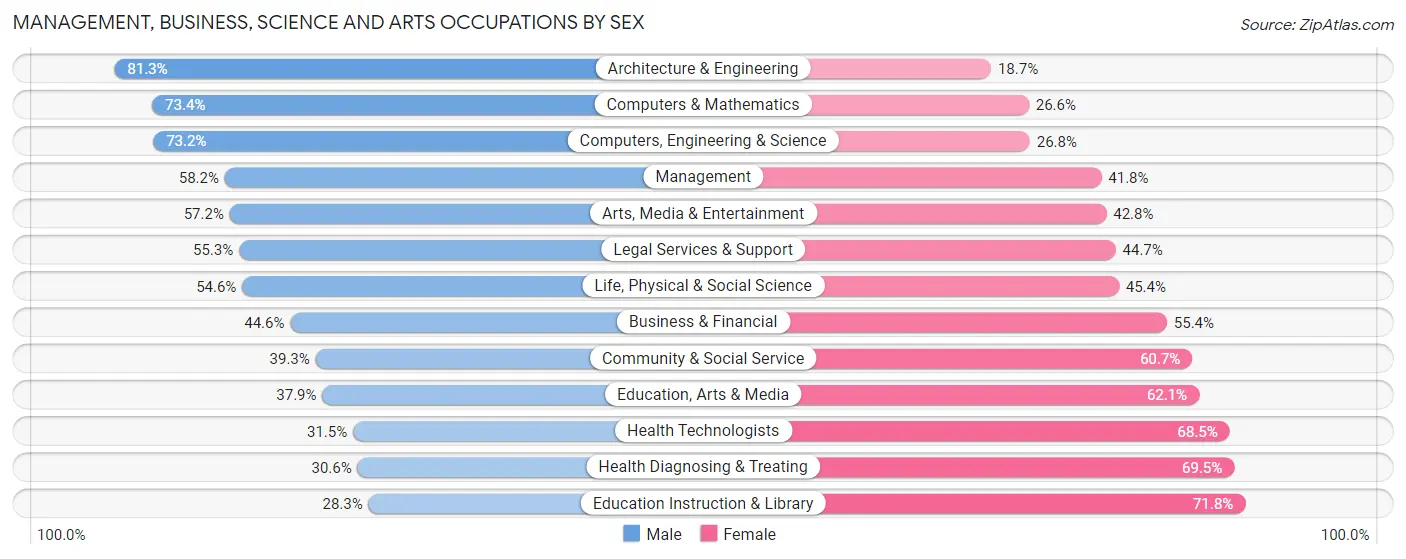
Management, Business, Science and Arts Occupations by Sex
Within the Management, Business, Science and Arts occupations in Oklahoma County, the most male-oriented occupations are Architecture & Engineering (81.3%), Computers & Mathematics (73.4%), and Computers, Engineering & Science (73.2%), while the most female-oriented occupations are Education Instruction & Library (71.8%), Health Diagnosing & Treating (69.5%), and Health Technologists (68.5%).
| Occupation | Male | Female |
| Management | 21,906 (58.2%) | 15,706 (41.8%) |
| Business & Financial | 10,321 (44.6%) | 12,837 (55.4%) |
| Computers, Engineering & Science | 17,623 (73.2%) | 6,463 (26.8%) |
| Computers & Mathematics | 8,911 (73.4%) | 3,232 (26.6%) |
| Architecture & Engineering | 6,675 (81.3%) | 1,538 (18.7%) |
| Life, Physical & Social Science | 2,037 (54.6%) | 1,693 (45.4%) |
| Community & Social Service | 15,500 (39.3%) | 23,943 (60.7%) |
| Education, Arts & Media | 2,437 (37.9%) | 3,994 (62.1%) |
| Legal Services & Support | 3,327 (55.3%) | 2,694 (44.7%) |
| Education Instruction & Library | 5,566 (28.2%) | 14,136 (71.8%) |
| Arts, Media & Entertainment | 4,170 (57.2%) | 3,119 (42.8%) |
| Health Diagnosing & Treating | 8,001 (30.5%) | 18,187 (69.5%) |
| Health Technologists | 5,625 (31.5%) | 12,236 (68.5%) |
| Total (Category) | 73,351 (48.7%) | 77,136 (51.3%) |
| Total (Overall) | 202,352 (53.0%) | 179,523 (47.0%) |
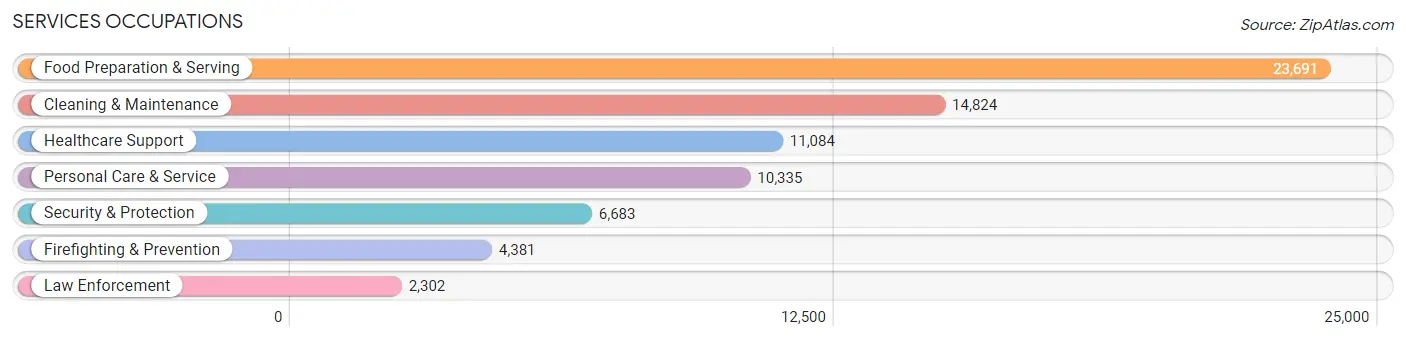
Services Occupations
The most common Services occupations in Oklahoma County are Food Preparation & Serving (23,691 | 6.2%), Cleaning & Maintenance (14,824 | 3.9%), Healthcare Support (11,084 | 2.9%), Personal Care & Service (10,335 | 2.7%), and Security & Protection (6,683 | 1.8%).
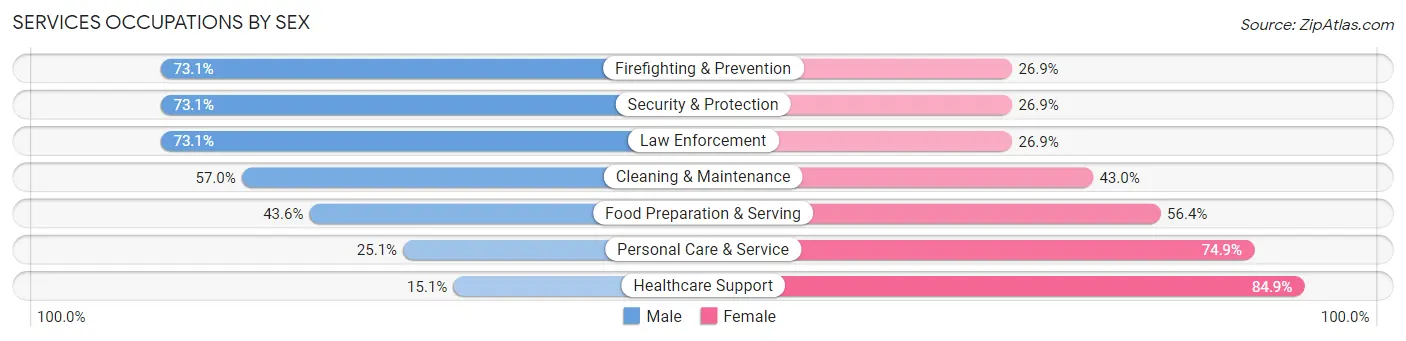
Services Occupations by Sex
Within the Services occupations in Oklahoma County, the most male-oriented occupations are Firefighting & Prevention (73.1%), Security & Protection (73.1%), and Law Enforcement (73.1%), while the most female-oriented occupations are Healthcare Support (84.9%), Personal Care & Service (74.9%), and Food Preparation & Serving (56.4%).
| Occupation | Male | Female |
| Healthcare Support | 1,678 (15.1%) | 9,406 (84.9%) |
| Security & Protection | 4,884 (73.1%) | 1,799 (26.9%) |
| Firefighting & Prevention | 3,202 (73.1%) | 1,179 (26.9%) |
| Law Enforcement | 1,682 (73.1%) | 620 (26.9%) |
| Food Preparation & Serving | 10,338 (43.6%) | 13,353 (56.4%) |
| Cleaning & Maintenance | 8,456 (57.0%) | 6,368 (43.0%) |
| Personal Care & Service | 2,593 (25.1%) | 7,742 (74.9%) |
| Total (Category) | 27,949 (41.9%) | 38,668 (58.1%) |
| Total (Overall) | 202,352 (53.0%) | 179,523 (47.0%) |
Sales and Office Occupations
The most common Sales and Office occupations in Oklahoma County are Office & Administration (43,939 | 11.5%), and Sales & Related (37,603 | 9.9%).

Sales and Office Occupations by Sex
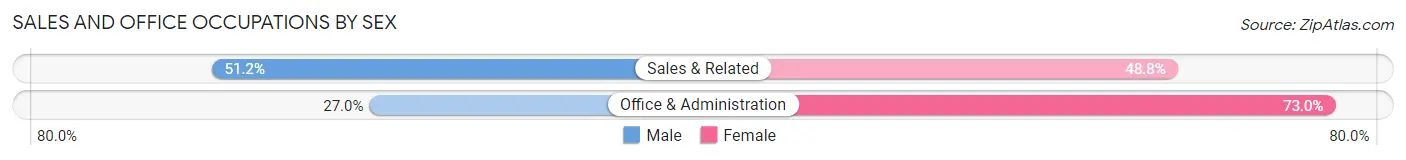
| Occupation | Male | Female |
| Sales & Related | 19,263 (51.2%) | 18,340 (48.8%) |
| Office & Administration | 11,852 (27.0%) | 32,087 (73.0%) |
| Total (Category) | 31,115 (38.2%) | 50,427 (61.8%) |
| Total (Overall) | 202,352 (53.0%) | 179,523 (47.0%) |
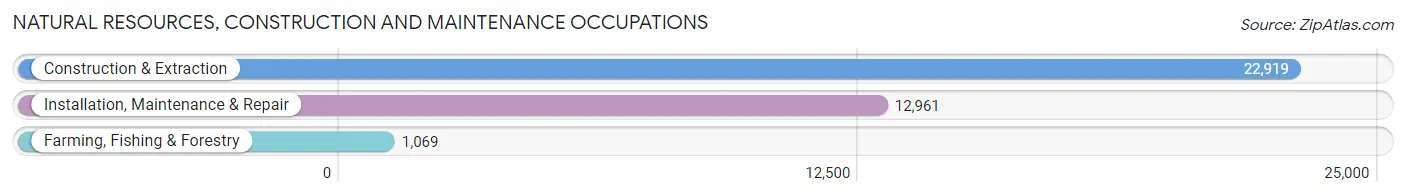
Natural Resources, Construction and Maintenance Occupations
The most common Natural Resources, Construction and Maintenance occupations in Oklahoma County are Construction & Extraction (22,919 | 6.0%), Installation, Maintenance & Repair (12,961 | 3.4%), and Farming, Fishing & Forestry (1,069 | 0.3%).
Natural Resources, Construction and Maintenance Occupations by Sex
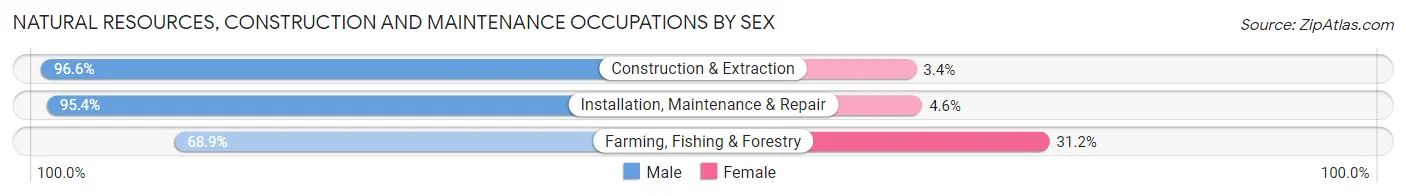
| Occupation | Male | Female |
| Farming, Fishing & Forestry | 736 (68.9%) | 333 (31.1%) |
| Construction & Extraction | 22,134 (96.6%) | 785 (3.4%) |
| Installation, Maintenance & Repair | 12,359 (95.4%) | 602 (4.6%) |
| Total (Category) | 35,229 (95.3%) | 1,720 (4.7%) |
| Total (Overall) | 202,352 (53.0%) | 179,523 (47.0%) |
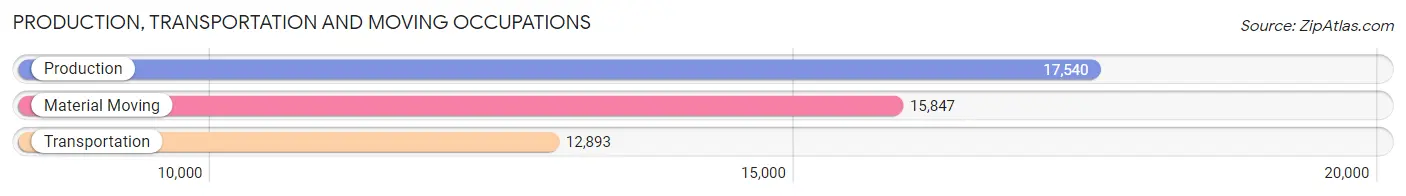
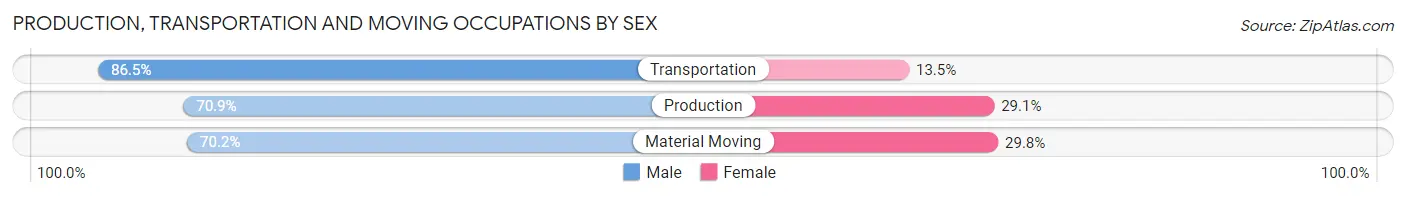
Production, Transportation and Moving Occupations
The most common Production, Transportation and Moving occupations in Oklahoma County are Production (17,540 | 4.6%), Material Moving (15,847 | 4.2%), and Transportation (12,893 | 3.4%).
Production, Transportation and Moving Occupations by Sex
| Occupation | Male | Female |
| Production | 12,433 (70.9%) | 5,107 (29.1%) |
| Transportation | 11,155 (86.5%) | 1,738 (13.5%) |
| Material Moving | 11,120 (70.2%) | 4,727 (29.8%) |
| Total (Category) | 34,708 (75.0%) | 11,572 (25.0%) |
| Total (Overall) | 202,352 (53.0%) | 179,523 (47.0%) |
Employment Industries by Sex in Oklahoma County
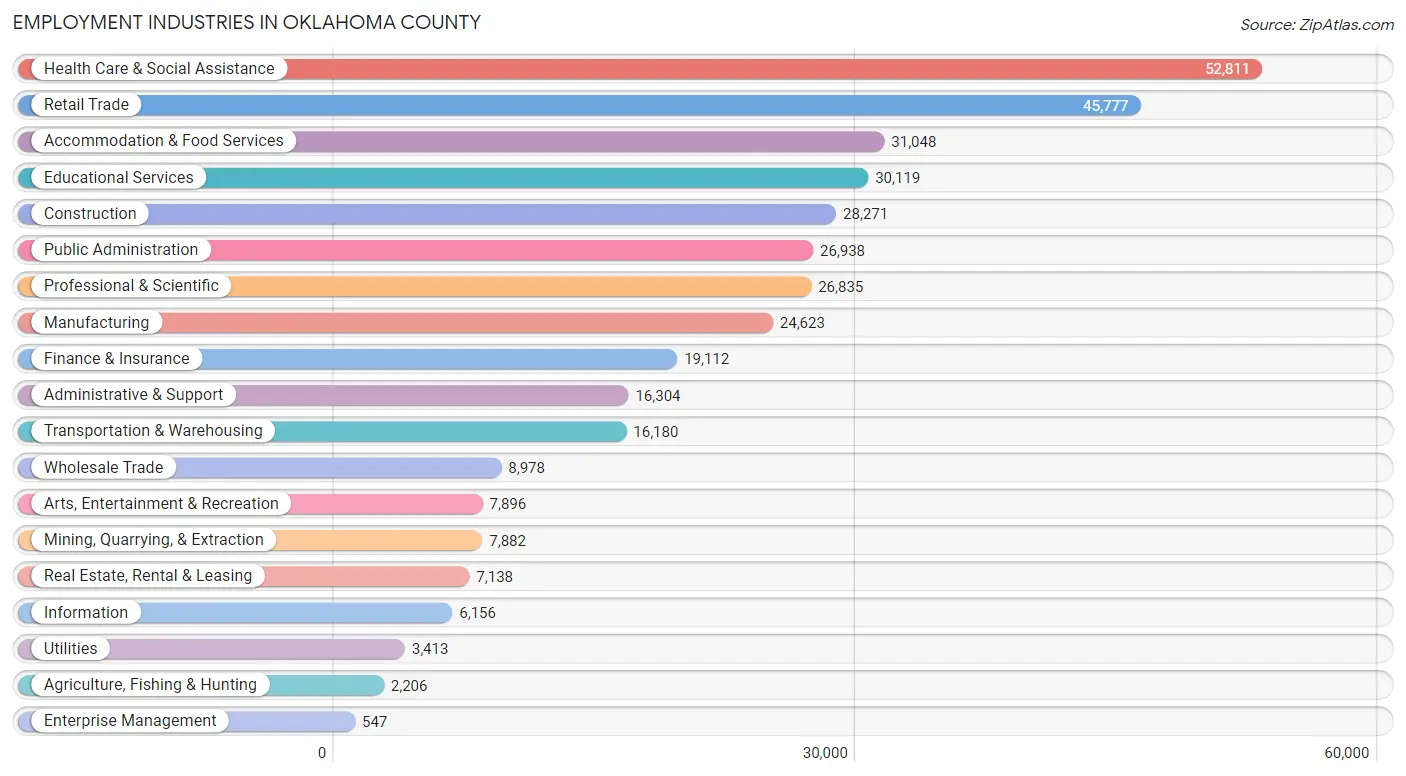
Employment Industries in Oklahoma County
The major employment industries in Oklahoma County include Health Care & Social Assistance (52,811 | 13.8%), Retail Trade (45,777 | 12.0%), Accommodation & Food Services (31,048 | 8.1%), Educational Services (30,119 | 7.9%), and Construction (28,271 | 7.4%).
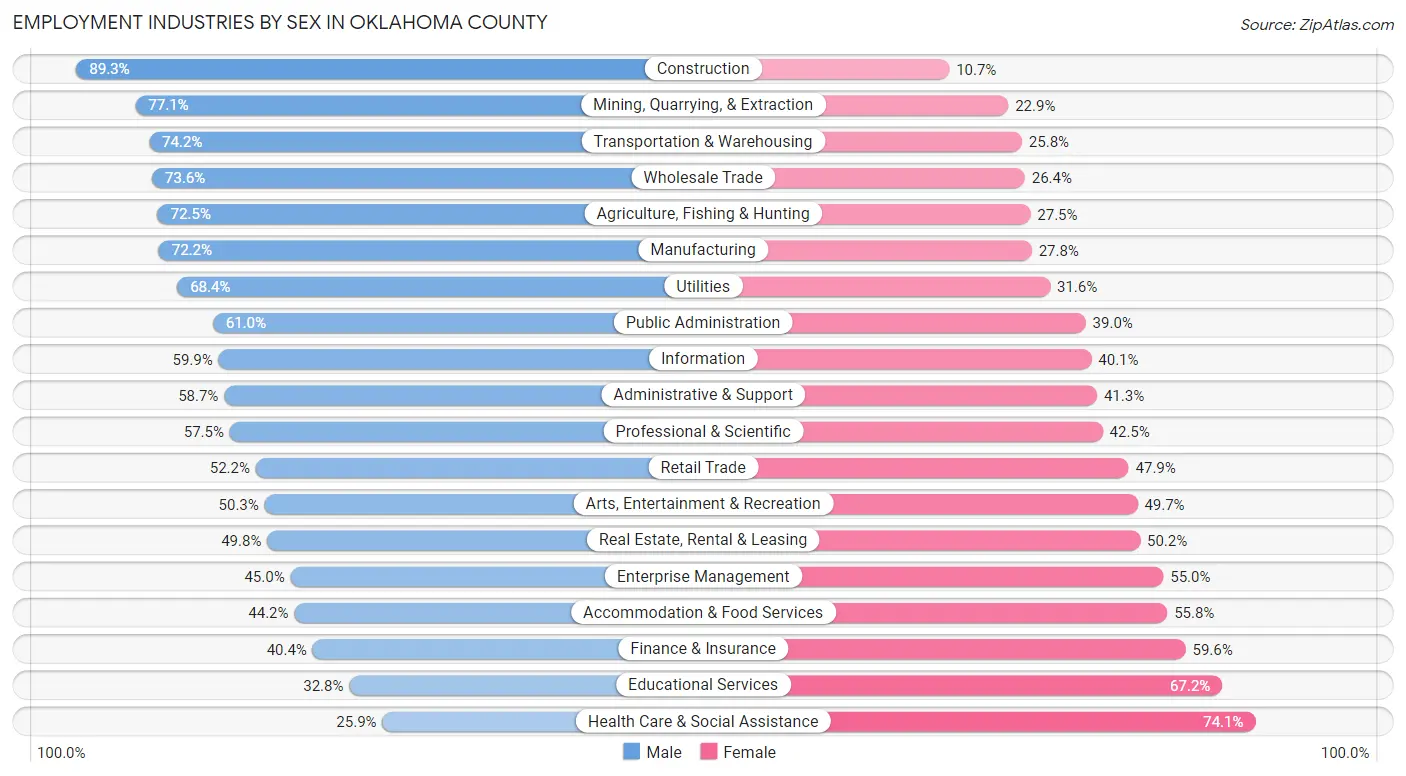
Employment Industries by Sex in Oklahoma County
The Oklahoma County industries that see more men than women are Construction (89.3%), Mining, Quarrying, & Extraction (77.1%), and Transportation & Warehousing (74.2%), whereas the industries that tend to have a higher number of women are Health Care & Social Assistance (74.1%), Educational Services (67.2%), and Finance & Insurance (59.6%).
| Industry | Male | Female |
| Agriculture, Fishing & Hunting | 1,599 (72.5%) | 607 (27.5%) |
| Mining, Quarrying, & Extraction | 6,074 (77.1%) | 1,808 (22.9%) |
| Construction | 25,241 (89.3%) | 3,030 (10.7%) |
| Manufacturing | 17,780 (72.2%) | 6,843 (27.8%) |
| Wholesale Trade | 6,611 (73.6%) | 2,367 (26.4%) |
| Retail Trade | 23,872 (52.1%) | 21,905 (47.8%) |
| Transportation & Warehousing | 12,010 (74.2%) | 4,170 (25.8%) |
| Utilities | 2,335 (68.4%) | 1,078 (31.6%) |
| Information | 3,685 (59.9%) | 2,471 (40.1%) |
| Finance & Insurance | 7,716 (40.4%) | 11,396 (59.6%) |
| Real Estate, Rental & Leasing | 3,553 (49.8%) | 3,585 (50.2%) |
| Professional & Scientific | 15,438 (57.5%) | 11,397 (42.5%) |
| Enterprise Management | 246 (45.0%) | 301 (55.0%) |
| Administrative & Support | 9,569 (58.7%) | 6,735 (41.3%) |
| Educational Services | 9,875 (32.8%) | 20,244 (67.2%) |
| Health Care & Social Assistance | 13,700 (25.9%) | 39,111 (74.1%) |
| Arts, Entertainment & Recreation | 3,973 (50.3%) | 3,923 (49.7%) |
| Accommodation & Food Services | 13,712 (44.2%) | 17,336 (55.8%) |
| Public Administration | 16,443 (61.0%) | 10,495 (39.0%) |
| Total | 202,352 (53.0%) | 179,523 (47.0%) |
Education in Oklahoma County
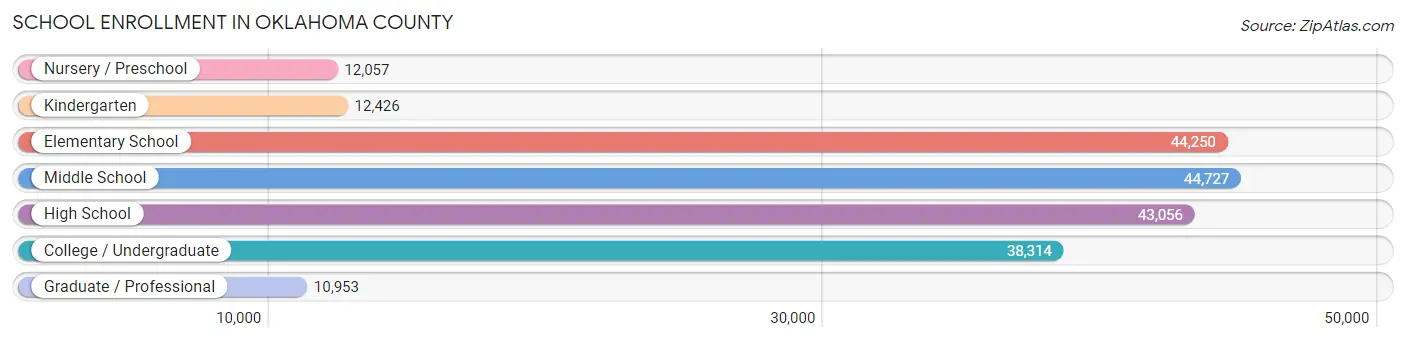
School Enrollment in Oklahoma County
The most common levels of schooling among the 205,783 students in Oklahoma County are middle school (44,727 | 21.7%), elementary school (44,250 | 21.5%), and high school (43,056 | 20.9%).
| School Level | # Students | % Students |
| Nursery / Preschool | 12,057 | 5.9% |
| Kindergarten | 12,426 | 6.0% |
| Elementary School | 44,250 | 21.5% |
| Middle School | 44,727 | 21.7% |
| High School | 43,056 | 20.9% |
| College / Undergraduate | 38,314 | 18.6% |
| Graduate / Professional | 10,953 | 5.3% |
| Total | 205,783 | 100.0% |
School Enrollment by Age by Funding Source in Oklahoma County
Out of a total of 205,783 students who are enrolled in schools in Oklahoma County, 34,572 (16.8%) attend a private institution, while the remaining 171,211 (83.2%) are enrolled in public schools. The age group of 3 to 4 year olds has the highest likelihood of being enrolled in private schools, with 2,937 (33.8% in the age bracket) enrolled. Conversely, the age group of 10 to 14 year olds has the lowest likelihood of being enrolled in a private school, with 49,132 (87.1% in the age bracket) attending a public institution.
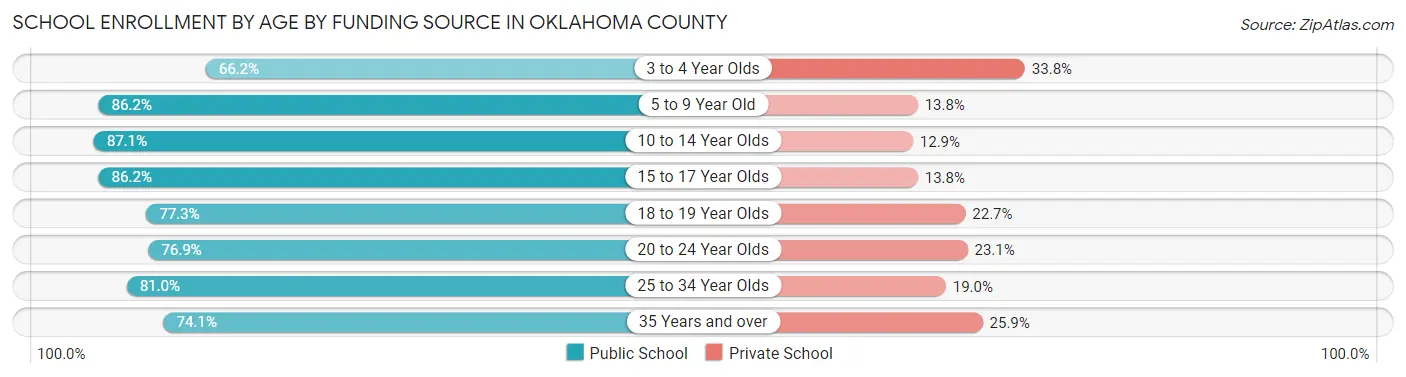
| Age Bracket | Public School | Private School |
| 3 to 4 Year Olds | 5,762 (66.2%) | 2,937 (33.8%) |
| 5 to 9 Year Old | 45,472 (86.2%) | 7,272 (13.8%) |
| 10 to 14 Year Olds | 49,132 (87.1%) | 7,270 (12.9%) |
| 15 to 17 Year Olds | 26,959 (86.2%) | 4,317 (13.8%) |
| 18 to 19 Year Olds | 10,446 (77.3%) | 3,062 (22.7%) |
| 20 to 24 Year Olds | 14,562 (76.9%) | 4,368 (23.1%) |
| 25 to 34 Year Olds | 11,626 (81.0%) | 2,731 (19.0%) |
| 35 Years and over | 7,313 (74.1%) | 2,554 (25.9%) |
| Total | 171,211 (83.2%) | 34,572 (16.8%) |
Educational Attainment by Field of Study in Oklahoma County
Business (45,835 | 23.8%), education (23,423 | 12.2%), science & technology (19,385 | 10.1%), bio, nature & agricultural (13,280 | 6.9%), and arts & humanities (12,852 | 6.7%) are the most common fields of study among 192,598 individuals in Oklahoma County who have obtained a bachelor's degree or higher.
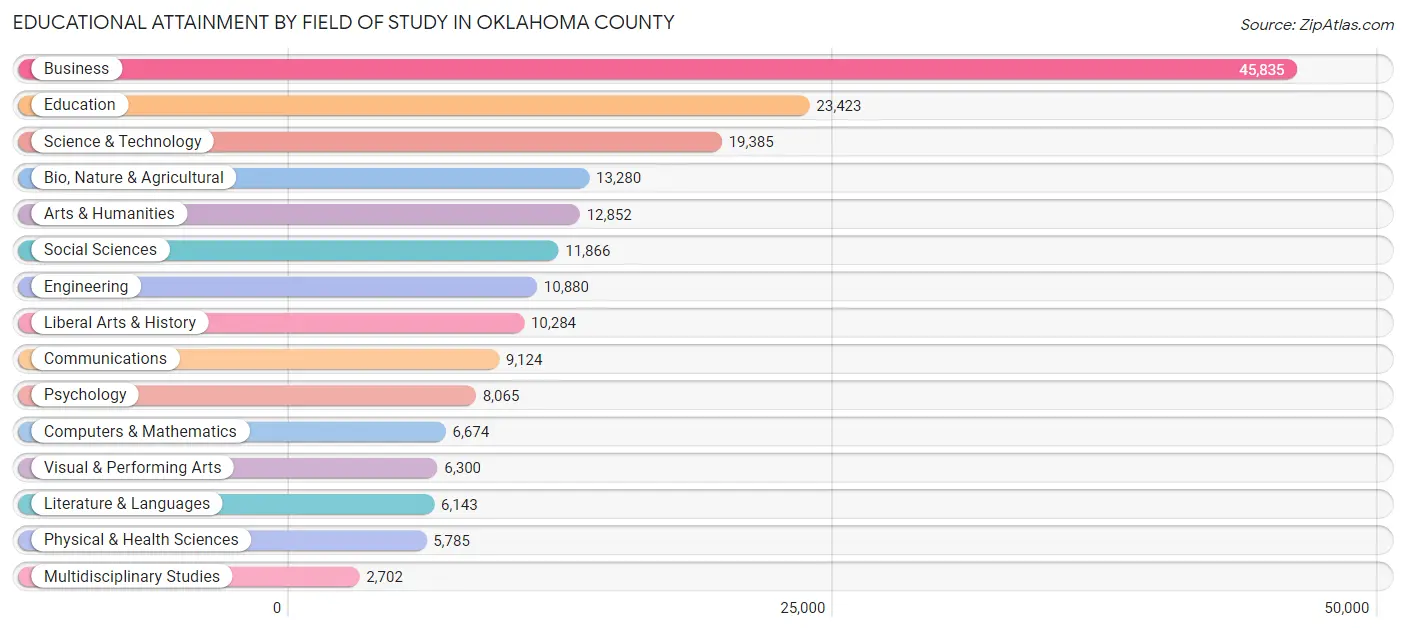
| Field of Study | # Graduates | % Graduates |
| Computers & Mathematics | 6,674 | 3.5% |
| Bio, Nature & Agricultural | 13,280 | 6.9% |
| Physical & Health Sciences | 5,785 | 3.0% |
| Psychology | 8,065 | 4.2% |
| Social Sciences | 11,866 | 6.2% |
| Engineering | 10,880 | 5.7% |
| Multidisciplinary Studies | 2,702 | 1.4% |
| Science & Technology | 19,385 | 10.1% |
| Business | 45,835 | 23.8% |
| Education | 23,423 | 12.2% |
| Literature & Languages | 6,143 | 3.2% |
| Liberal Arts & History | 10,284 | 5.3% |
| Visual & Performing Arts | 6,300 | 3.3% |
| Communications | 9,124 | 4.7% |
| Arts & Humanities | 12,852 | 6.7% |
| Total | 192,598 | 100.0% |
Transportation & Commute in Oklahoma County
Vehicle Availability by Sex in Oklahoma County
The most prevalent vehicle ownership categories in Oklahoma County are males with 2 vehicles (92,171, accounting for 45.6%) and females with 2 vehicles (74,593, making up 52.5%).
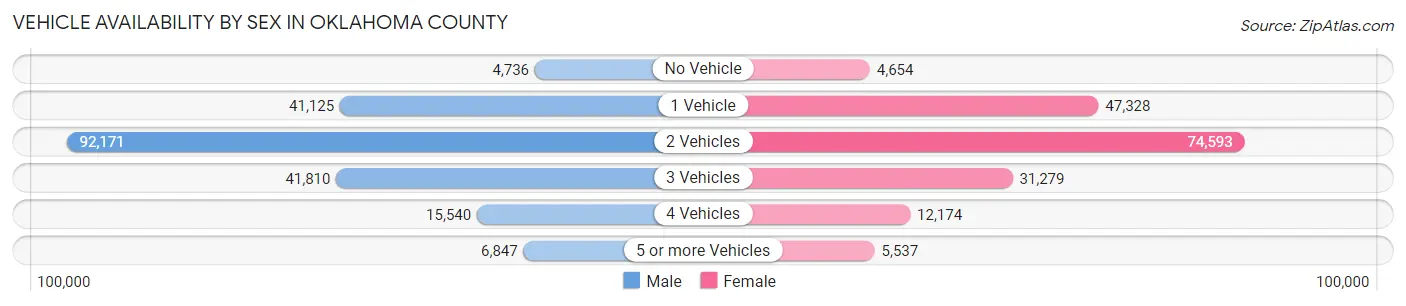
| Vehicles Available | Male | Female |
| No Vehicle | 4,736 (2.3%) | 4,654 (2.6%) |
| 1 Vehicle | 41,125 (20.3%) | 47,328 (27.0%) |
| 2 Vehicles | 92,171 (45.6%) | 74,593 (42.5%) |
| 3 Vehicles | 41,810 (20.7%) | 31,279 (17.8%) |
| 4 Vehicles | 15,540 (7.7%) | 12,174 (6.9%) |
| 5 or more Vehicles | 6,847 (3.4%) | 5,537 (3.2%) |
| Total | 202,229 (100.0%) | 175,565 (100.0%) |
Commute Time in Oklahoma County
The most frequently occuring commute durations in Oklahoma County are 15 to 19 minutes (69,843 commuters, 20.0%), 20 to 24 minutes (68,607 commuters, 19.6%), and 10 to 14 minutes (52,481 commuters, 15.0%).
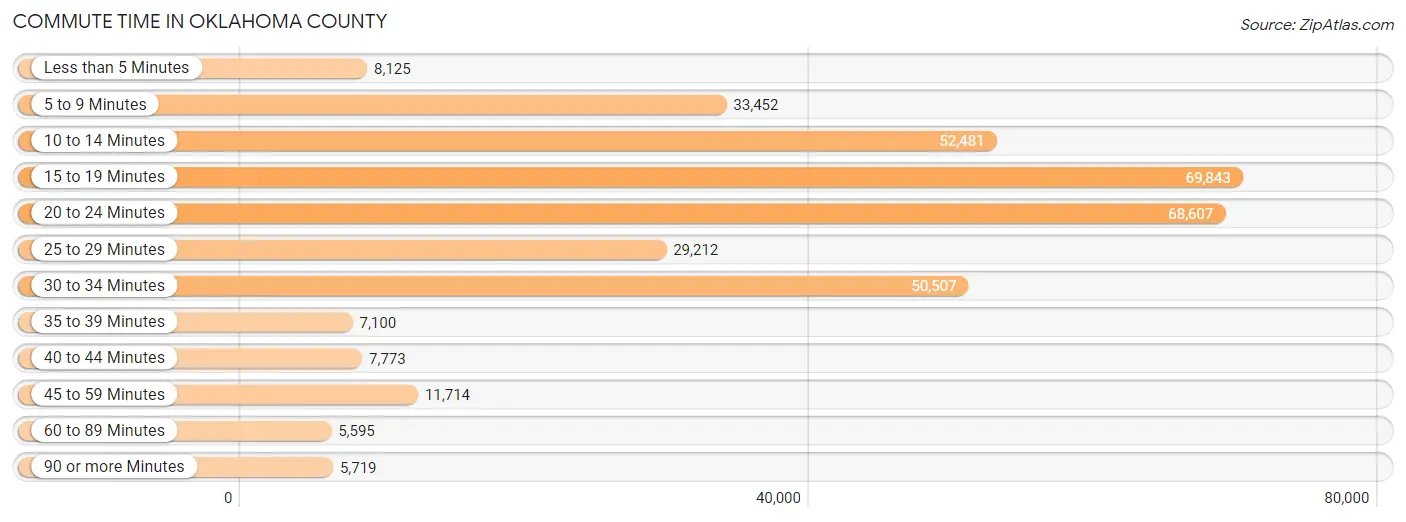
| Commute Time | # Commuters | % Commuters |
| Less than 5 Minutes | 8,125 | 2.3% |
| 5 to 9 Minutes | 33,452 | 9.6% |
| 10 to 14 Minutes | 52,481 | 15.0% |
| 15 to 19 Minutes | 69,843 | 20.0% |
| 20 to 24 Minutes | 68,607 | 19.6% |
| 25 to 29 Minutes | 29,212 | 8.3% |
| 30 to 34 Minutes | 50,507 | 14.4% |
| 35 to 39 Minutes | 7,100 | 2.0% |
| 40 to 44 Minutes | 7,773 | 2.2% |
| 45 to 59 Minutes | 11,714 | 3.4% |
| 60 to 89 Minutes | 5,595 | 1.6% |
| 90 or more Minutes | 5,719 | 1.6% |
Commute Time by Sex in Oklahoma County
The most common commute times in Oklahoma County are 15 to 19 minutes (36,945 commuters, 19.5%) for males and 15 to 19 minutes (32,898 commuters, 20.5%) for females.
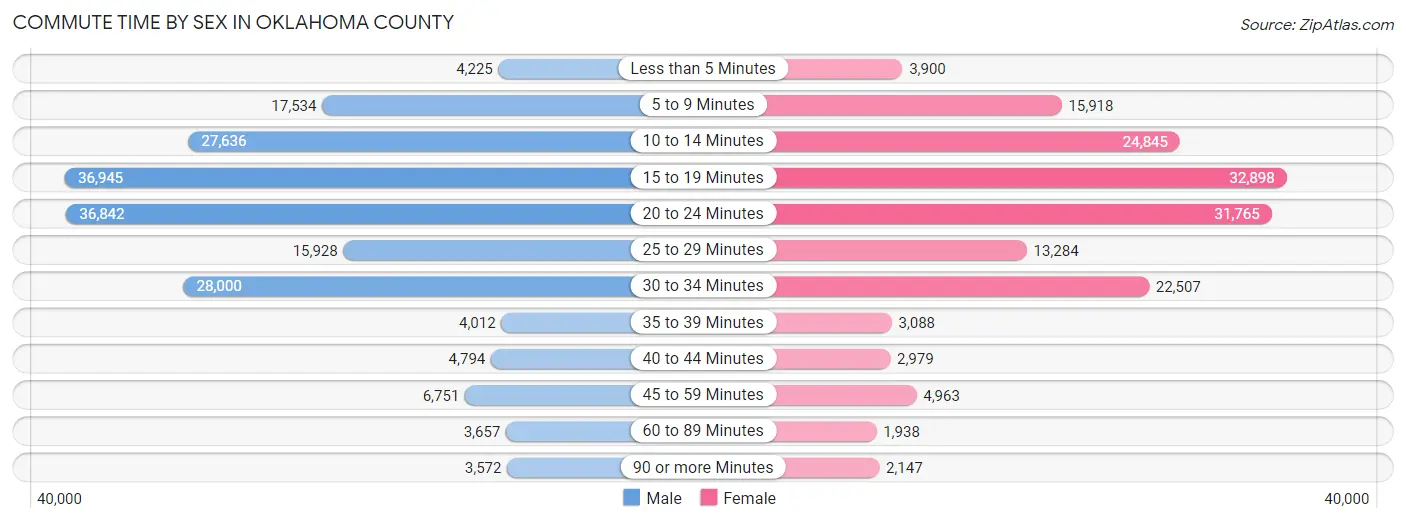
| Commute Time | Male | Female |
| Less than 5 Minutes | 4,225 (2.2%) | 3,900 (2.4%) |
| 5 to 9 Minutes | 17,534 (9.2%) | 15,918 (9.9%) |
| 10 to 14 Minutes | 27,636 (14.5%) | 24,845 (15.5%) |
| 15 to 19 Minutes | 36,945 (19.5%) | 32,898 (20.5%) |
| 20 to 24 Minutes | 36,842 (19.4%) | 31,765 (19.8%) |
| 25 to 29 Minutes | 15,928 (8.4%) | 13,284 (8.3%) |
| 30 to 34 Minutes | 28,000 (14.7%) | 22,507 (14.1%) |
| 35 to 39 Minutes | 4,012 (2.1%) | 3,088 (1.9%) |
| 40 to 44 Minutes | 4,794 (2.5%) | 2,979 (1.9%) |
| 45 to 59 Minutes | 6,751 (3.6%) | 4,963 (3.1%) |
| 60 to 89 Minutes | 3,657 (1.9%) | 1,938 (1.2%) |
| 90 or more Minutes | 3,572 (1.9%) | 2,147 (1.3%) |
Time of Departure to Work by Sex in Oklahoma County
The most frequent times of departure to work in Oklahoma County are 7:00 AM to 7:29 AM (27,188, 14.3%) for males and 7:00 AM to 7:29 AM (25,368, 15.8%) for females.
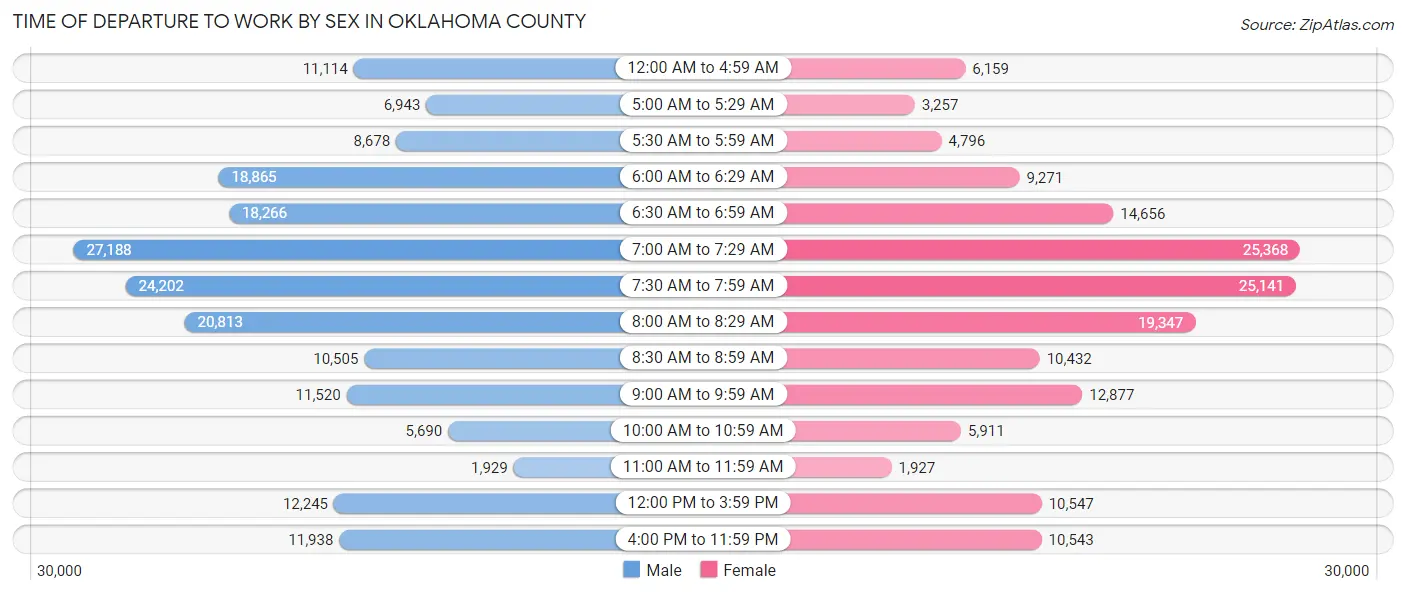
| Time of Departure | Male | Female |
| 12:00 AM to 4:59 AM | 11,114 (5.9%) | 6,159 (3.8%) |
| 5:00 AM to 5:29 AM | 6,943 (3.7%) | 3,257 (2.0%) |
| 5:30 AM to 5:59 AM | 8,678 (4.6%) | 4,796 (3.0%) |
| 6:00 AM to 6:29 AM | 18,865 (9.9%) | 9,271 (5.8%) |
| 6:30 AM to 6:59 AM | 18,266 (9.6%) | 14,656 (9.1%) |
| 7:00 AM to 7:29 AM | 27,188 (14.3%) | 25,368 (15.8%) |
| 7:30 AM to 7:59 AM | 24,202 (12.7%) | 25,141 (15.7%) |
| 8:00 AM to 8:29 AM | 20,813 (11.0%) | 19,347 (12.1%) |
| 8:30 AM to 8:59 AM | 10,505 (5.5%) | 10,432 (6.5%) |
| 9:00 AM to 9:59 AM | 11,520 (6.1%) | 12,877 (8.0%) |
| 10:00 AM to 10:59 AM | 5,690 (3.0%) | 5,911 (3.7%) |
| 11:00 AM to 11:59 AM | 1,929 (1.0%) | 1,927 (1.2%) |
| 12:00 PM to 3:59 PM | 12,245 (6.5%) | 10,547 (6.6%) |
| 4:00 PM to 11:59 PM | 11,938 (6.3%) | 10,543 (6.6%) |
| Total | 189,896 (100.0%) | 160,232 (100.0%) |
Housing Occupancy in Oklahoma County
Occupancy by Ownership in Oklahoma County
Of the total 318,212 dwellings in Oklahoma County, owner-occupied units account for 187,328 (58.9%), while renter-occupied units make up 130,884 (41.1%).
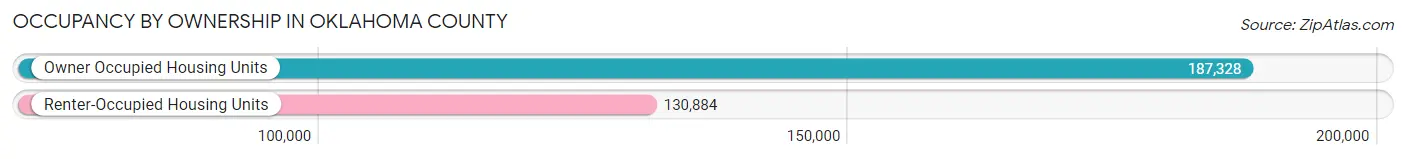
| Occupancy | # Housing Units | % Housing Units |
| Owner Occupied Housing Units | 187,328 | 58.9% |
| Renter-Occupied Housing Units | 130,884 | 41.1% |
| Total Occupied Housing Units | 318,212 | 100.0% |
Occupancy by Household Size in Oklahoma County
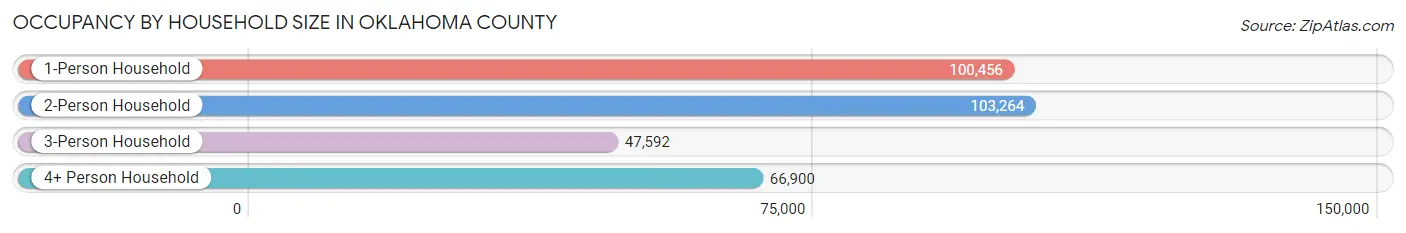
| Household Size | # Housing Units | % Housing Units |
| 1-Person Household | 100,456 | 31.6% |
| 2-Person Household | 103,264 | 32.5% |
| 3-Person Household | 47,592 | 15.0% |
| 4+ Person Household | 66,900 | 21.0% |
| Total Housing Units | 318,212 | 100.0% |
Occupancy by Ownership by Household Size in Oklahoma County
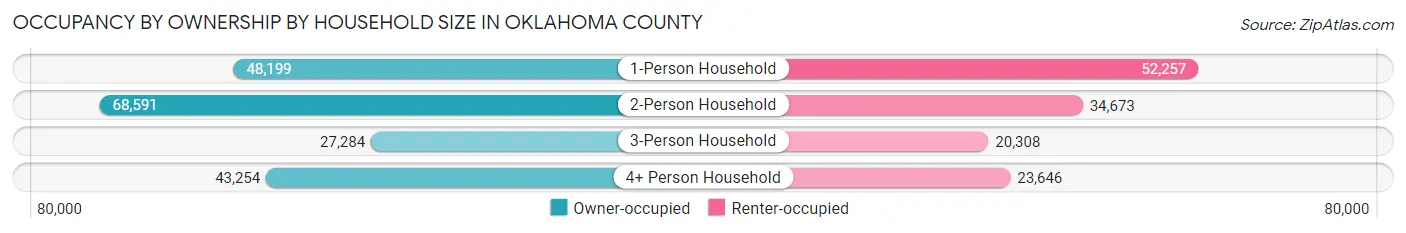
| Household Size | Owner-occupied | Renter-occupied |
| 1-Person Household | 48,199 (48.0%) | 52,257 (52.0%) |
| 2-Person Household | 68,591 (66.4%) | 34,673 (33.6%) |
| 3-Person Household | 27,284 (57.3%) | 20,308 (42.7%) |
| 4+ Person Household | 43,254 (64.6%) | 23,646 (35.3%) |
| Total Housing Units | 187,328 (58.9%) | 130,884 (41.1%) |
Occupancy by Educational Attainment in Oklahoma County
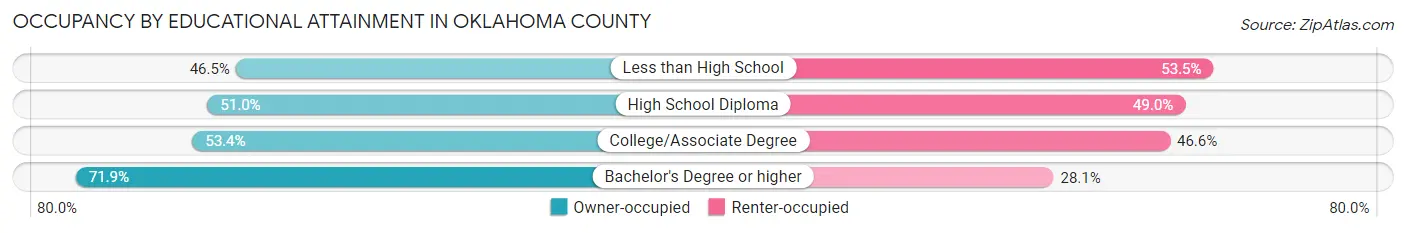
| Household Size | Owner-occupied | Renter-occupied |
| Less than High School | 14,297 (46.5%) | 16,438 (53.5%) |
| High School Diploma | 35,731 (51.0%) | 34,334 (49.0%) |
| College/Associate Degree | 54,774 (53.4%) | 47,819 (46.6%) |
| Bachelor's Degree or higher | 82,526 (71.9%) | 32,293 (28.1%) |
Occupancy by Age of Householder in Oklahoma County
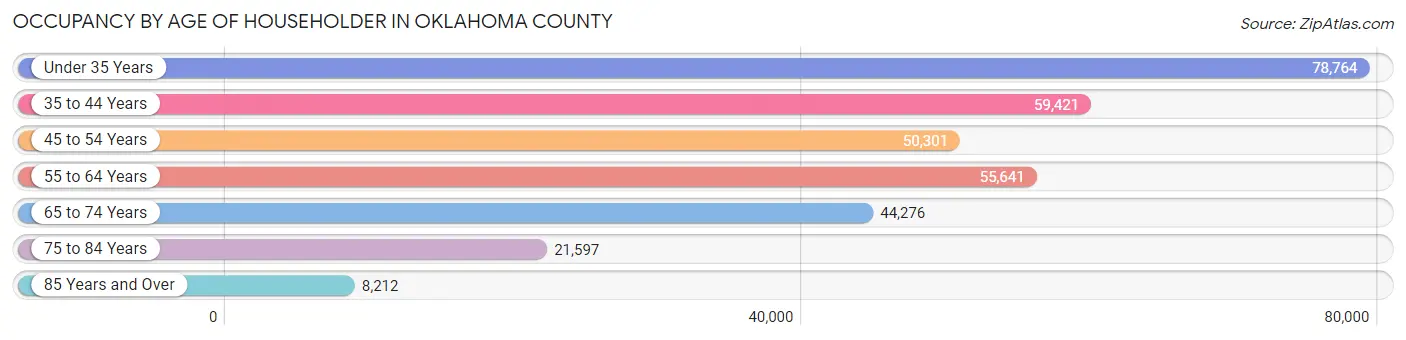
| Age Bracket | # Households | % Households |
| Under 35 Years | 78,764 | 24.7% |
| 35 to 44 Years | 59,421 | 18.7% |
| 45 to 54 Years | 50,301 | 15.8% |
| 55 to 64 Years | 55,641 | 17.5% |
| 65 to 74 Years | 44,276 | 13.9% |
| 75 to 84 Years | 21,597 | 6.8% |
| 85 Years and Over | 8,212 | 2.6% |
| Total | 318,212 | 100.0% |
Housing Finances in Oklahoma County
Median Income by Occupancy in Oklahoma County
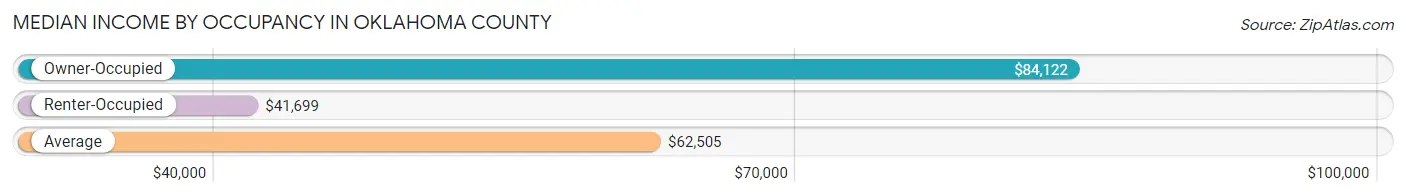
| Occupancy Type | # Households | Median Income |
| Owner-Occupied | 187,328 (58.9%) | $84,122 |
| Renter-Occupied | 130,884 (41.1%) | $41,699 |
| Average | 318,212 (100.0%) | $62,505 |
Occupancy by Householder Income Bracket in Oklahoma County
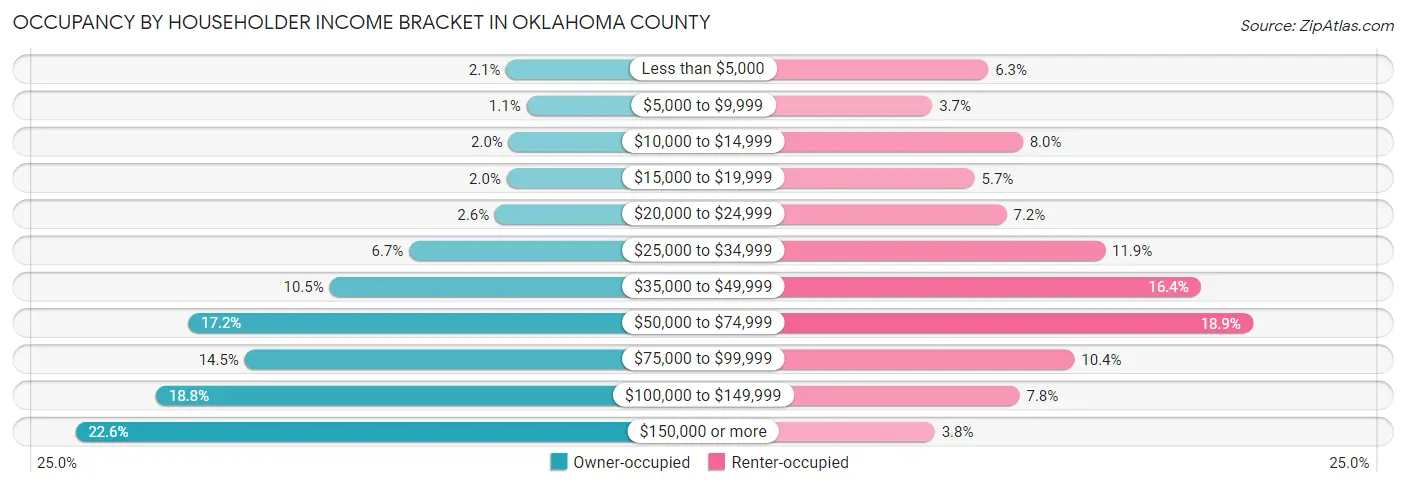
| Income Bracket | Owner-occupied | Renter-occupied |
| Less than $5,000 | 3,866 (2.1%) | 8,274 (6.3%) |
| $5,000 to $9,999 | 2,069 (1.1%) | 4,782 (3.6%) |
| $10,000 to $14,999 | 3,653 (1.9%) | 10,413 (8.0%) |
| $15,000 to $19,999 | 3,826 (2.0%) | 7,417 (5.7%) |
| $20,000 to $24,999 | 4,875 (2.6%) | 9,410 (7.2%) |
| $25,000 to $34,999 | 12,524 (6.7%) | 15,544 (11.9%) |
| $35,000 to $49,999 | 19,634 (10.5%) | 21,504 (16.4%) |
| $50,000 to $74,999 | 32,252 (17.2%) | 24,752 (18.9%) |
| $75,000 to $99,999 | 27,201 (14.5%) | 13,633 (10.4%) |
| $100,000 to $149,999 | 35,119 (18.8%) | 10,225 (7.8%) |
| $150,000 or more | 42,309 (22.6%) | 4,930 (3.8%) |
| Total | 187,328 (100.0%) | 130,884 (100.0%) |
Monthly Housing Cost Tiers in Oklahoma County
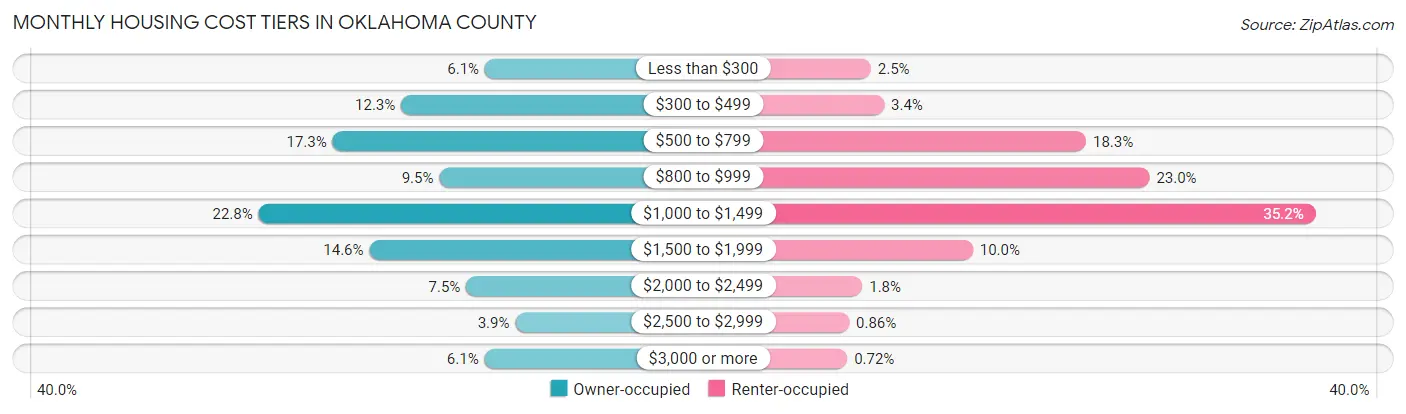
| Monthly Cost | Owner-occupied | Renter-occupied |
| Less than $300 | 11,428 (6.1%) | 3,215 (2.5%) |
| $300 to $499 | 22,981 (12.3%) | 4,503 (3.4%) |
| $500 to $799 | 32,442 (17.3%) | 23,969 (18.3%) |
| $800 to $999 | 17,722 (9.5%) | 30,076 (23.0%) |
| $1,000 to $1,499 | 42,657 (22.8%) | 46,080 (35.2%) |
| $1,500 to $1,999 | 27,376 (14.6%) | 13,047 (10.0%) |
| $2,000 to $2,499 | 14,007 (7.5%) | 2,401 (1.8%) |
| $2,500 to $2,999 | 7,239 (3.9%) | 1,127 (0.9%) |
| $3,000 or more | 11,476 (6.1%) | 936 (0.7%) |
| Total | 187,328 (100.0%) | 130,884 (100.0%) |
Physical Housing Characteristics in Oklahoma County
Housing Structures in Oklahoma County
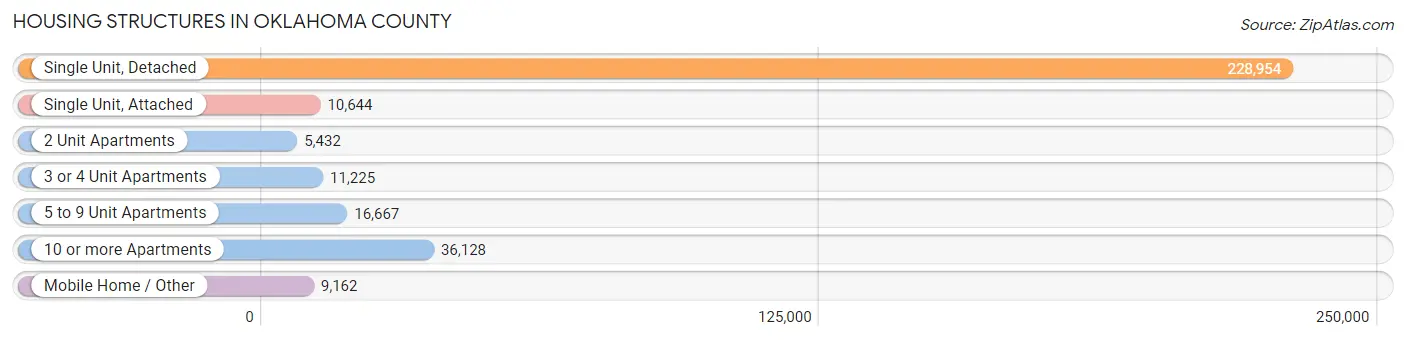
| Structure Type | # Housing Units | % Housing Units |
| Single Unit, Detached | 228,954 | 72.0% |
| Single Unit, Attached | 10,644 | 3.3% |
| 2 Unit Apartments | 5,432 | 1.7% |
| 3 or 4 Unit Apartments | 11,225 | 3.5% |
| 5 to 9 Unit Apartments | 16,667 | 5.2% |
| 10 or more Apartments | 36,128 | 11.4% |
| Mobile Home / Other | 9,162 | 2.9% |
| Total | 318,212 | 100.0% |
Housing Structures by Occupancy in Oklahoma County
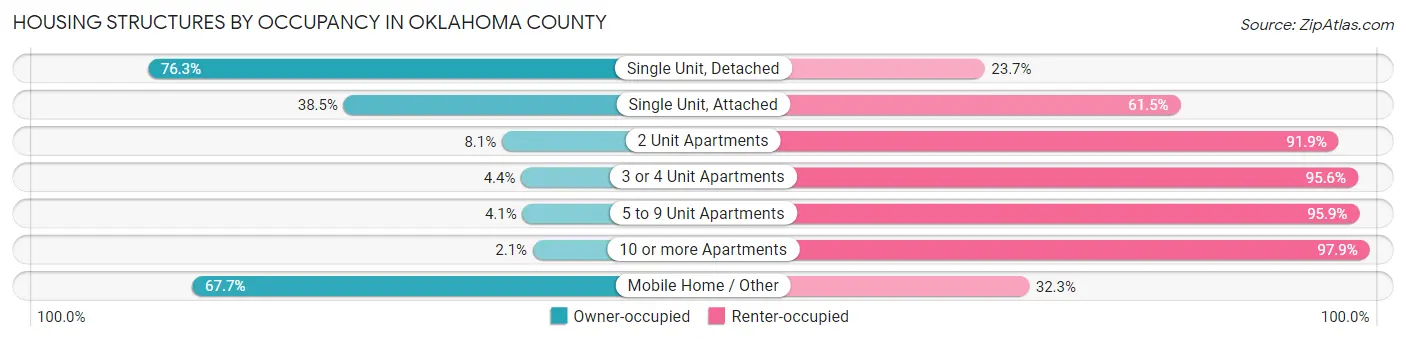
| Structure Type | Owner-occupied | Renter-occupied |
| Single Unit, Detached | 174,635 (76.3%) | 54,319 (23.7%) |
| Single Unit, Attached | 4,102 (38.5%) | 6,542 (61.5%) |
| 2 Unit Apartments | 439 (8.1%) | 4,993 (91.9%) |
| 3 or 4 Unit Apartments | 491 (4.4%) | 10,734 (95.6%) |
| 5 to 9 Unit Apartments | 687 (4.1%) | 15,980 (95.9%) |
| 10 or more Apartments | 769 (2.1%) | 35,359 (97.9%) |
| Mobile Home / Other | 6,205 (67.7%) | 2,957 (32.3%) |
| Total | 187,328 (58.9%) | 130,884 (41.1%) |
Housing Structures by Number of Rooms in Oklahoma County
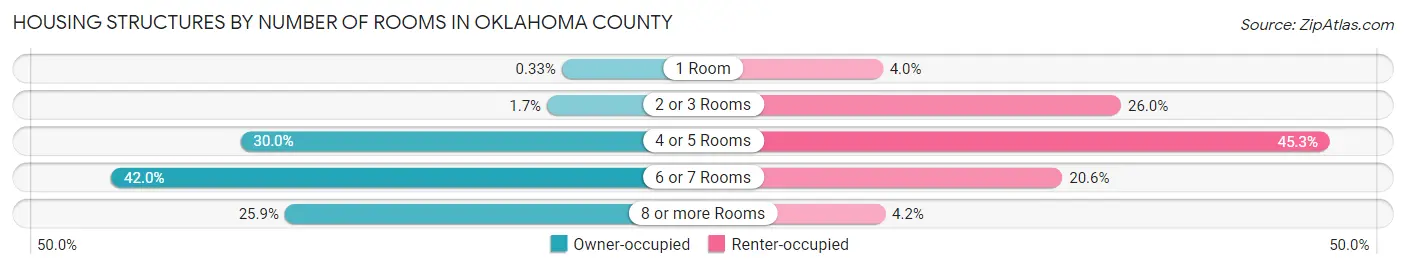
| Number of Rooms | Owner-occupied | Renter-occupied |
| 1 Room | 627 (0.3%) | 5,179 (4.0%) |
| 2 or 3 Rooms | 3,157 (1.7%) | 34,025 (26.0%) |
| 4 or 5 Rooms | 56,282 (30.0%) | 59,285 (45.3%) |
| 6 or 7 Rooms | 78,660 (42.0%) | 26,928 (20.6%) |
| 8 or more Rooms | 48,602 (25.9%) | 5,467 (4.2%) |
| Total | 187,328 (100.0%) | 130,884 (100.0%) |
Housing Structure by Heating Type in Oklahoma County
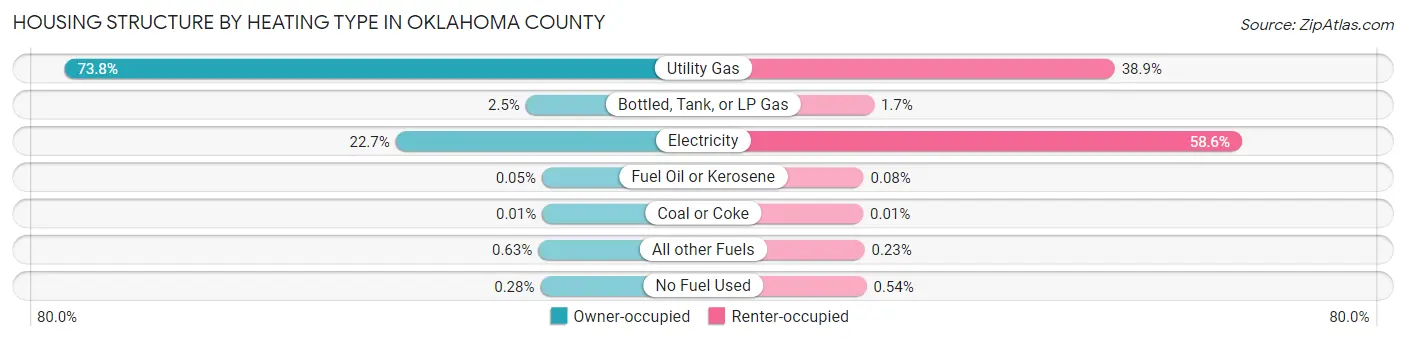
| Heating Type | Owner-occupied | Renter-occupied |
| Utility Gas | 138,298 (73.8%) | 50,921 (38.9%) |
| Bottled, Tank, or LP Gas | 4,750 (2.5%) | 2,208 (1.7%) |
| Electricity | 42,451 (22.7%) | 76,629 (58.6%) |
| Fuel Oil or Kerosene | 96 (0.1%) | 102 (0.1%) |
| Coal or Coke | 28 (0.0%) | 19 (0.0%) |
| All other Fuels | 1,184 (0.6%) | 296 (0.2%) |
| No Fuel Used | 521 (0.3%) | 709 (0.5%) |
| Total | 187,328 (100.0%) | 130,884 (100.0%) |
Household Vehicle Usage in Oklahoma County
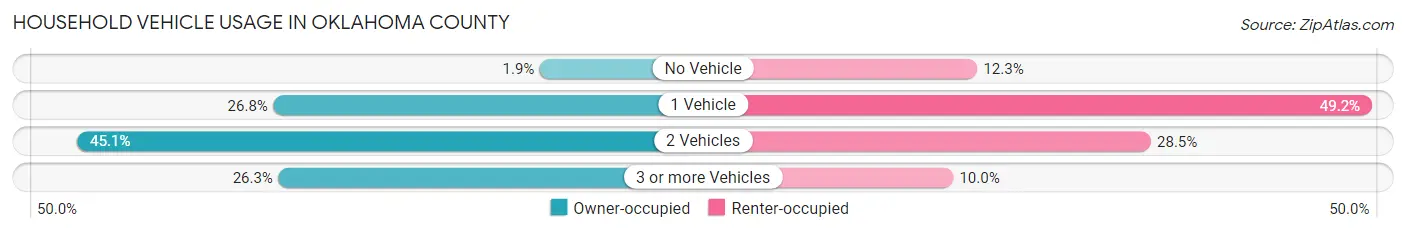
| Vehicles per Household | Owner-occupied | Renter-occupied |
| No Vehicle | 3,502 (1.9%) | 16,073 (12.3%) |
| 1 Vehicle | 50,108 (26.8%) | 64,379 (49.2%) |
| 2 Vehicles | 84,494 (45.1%) | 37,290 (28.5%) |
| 3 or more Vehicles | 49,224 (26.3%) | 13,142 (10.0%) |
| Total | 187,328 (100.0%) | 130,884 (100.0%) |
Real Estate & Mortgages in Oklahoma County
Real Estate and Mortgage Overview in Oklahoma County
| Characteristic | Without Mortgage | With Mortgage |
| Housing Units | 76,496 | 110,832 |
| Median Property Value | $163,900 | $206,500 |
| Median Household Income | $64,376 | $29,943 |
| Monthly Housing Costs | $541 | $11,130 |
| Real Estate Taxes | $1,554 | $4,974 |
Property Value by Mortgage Status in Oklahoma County
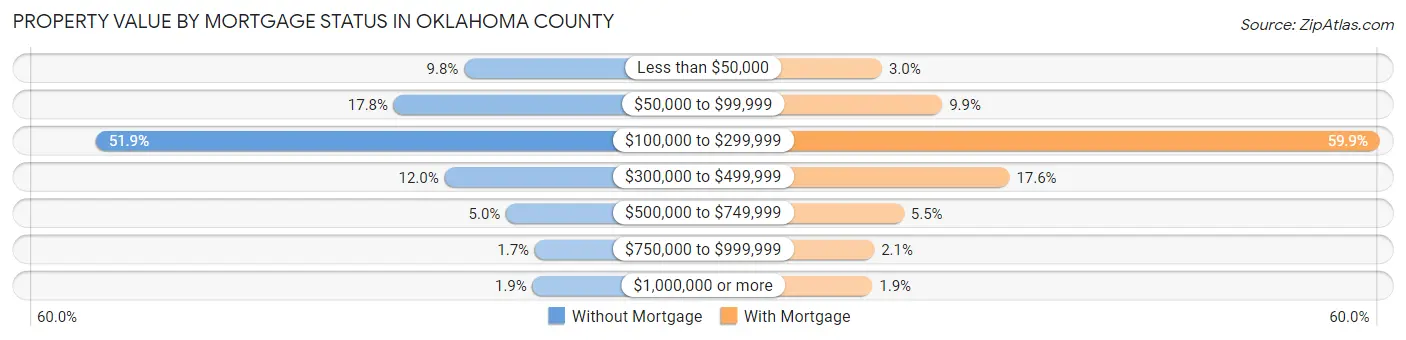
| Property Value | Without Mortgage | With Mortgage |
| Less than $50,000 | 7,466 (9.8%) | 3,344 (3.0%) |
| $50,000 to $99,999 | 13,613 (17.8%) | 10,986 (9.9%) |
| $100,000 to $299,999 | 39,669 (51.9%) | 66,394 (59.9%) |
| $300,000 to $499,999 | 9,187 (12.0%) | 19,500 (17.6%) |
| $500,000 to $749,999 | 3,795 (5.0%) | 6,117 (5.5%) |
| $750,000 to $999,999 | 1,284 (1.7%) | 2,366 (2.1%) |
| $1,000,000 or more | 1,482 (1.9%) | 2,125 (1.9%) |
| Total | 76,496 (100.0%) | 110,832 (100.0%) |
Household Income by Mortgage Status in Oklahoma County
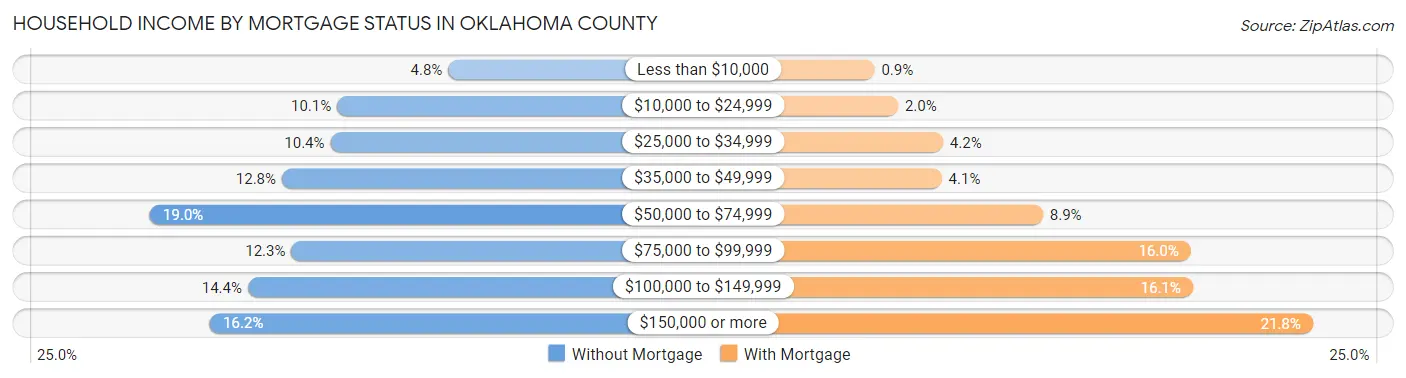
| Household Income | Without Mortgage | With Mortgage |
| Less than $10,000 | 3,695 (4.8%) | 1,001 (0.9%) |
| $10,000 to $24,999 | 7,741 (10.1%) | 2,240 (2.0%) |
| $25,000 to $34,999 | 7,984 (10.4%) | 4,613 (4.2%) |
| $35,000 to $49,999 | 9,752 (12.8%) | 4,540 (4.1%) |
| $50,000 to $74,999 | 14,558 (19.0%) | 9,882 (8.9%) |
| $75,000 to $99,999 | 9,406 (12.3%) | 17,694 (16.0%) |
| $100,000 to $149,999 | 10,994 (14.4%) | 17,795 (16.1%) |
| $150,000 or more | 12,366 (16.2%) | 24,125 (21.8%) |
| Total | 76,496 (100.0%) | 110,832 (100.0%) |
Property Value to Household Income Ratio in Oklahoma County
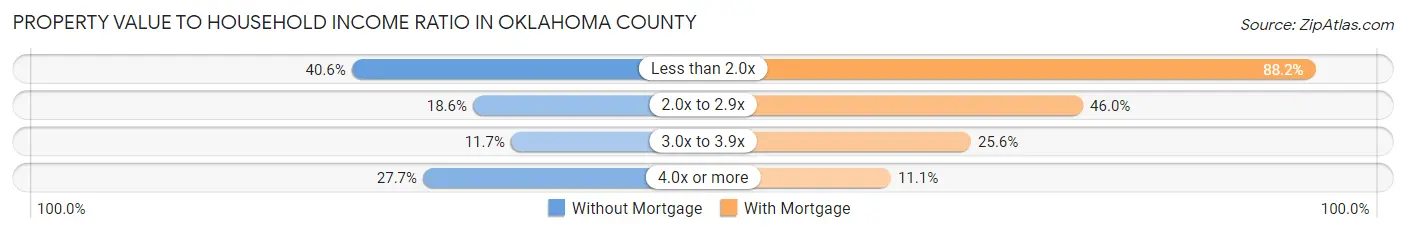
| Value-to-Income Ratio | Without Mortgage | With Mortgage |
| Less than 2.0x | 31,073 (40.6%) | 97,704 (88.2%) |
| 2.0x to 2.9x | 14,225 (18.6%) | 50,968 (46.0%) |
| 3.0x to 3.9x | 8,960 (11.7%) | 28,412 (25.6%) |
| 4.0x or more | 21,170 (27.7%) | 12,292 (11.1%) |
| Total | 76,496 (100.0%) | 110,832 (100.0%) |
Real Estate Taxes by Mortgage Status in Oklahoma County
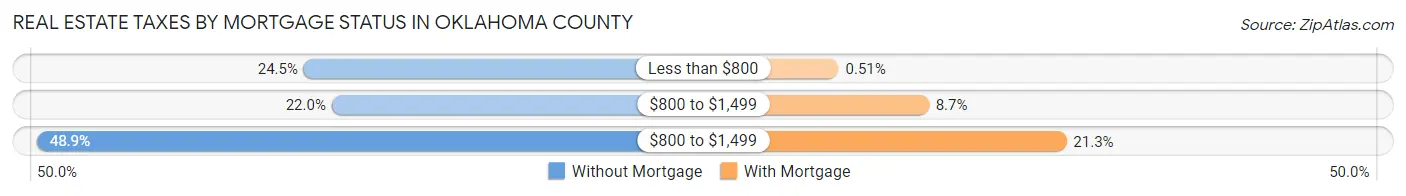
| Property Taxes | Without Mortgage | With Mortgage |
| Less than $800 | 18,740 (24.5%) | 564 (0.5%) |
| $800 to $1,499 | 16,789 (22.0%) | 9,689 (8.7%) |
| $800 to $1,499 | 37,388 (48.9%) | 23,623 (21.3%) |
| Total | 76,496 (100.0%) | 110,832 (100.0%) |
Health & Disability in Oklahoma County
Health Insurance Coverage by Age in Oklahoma County
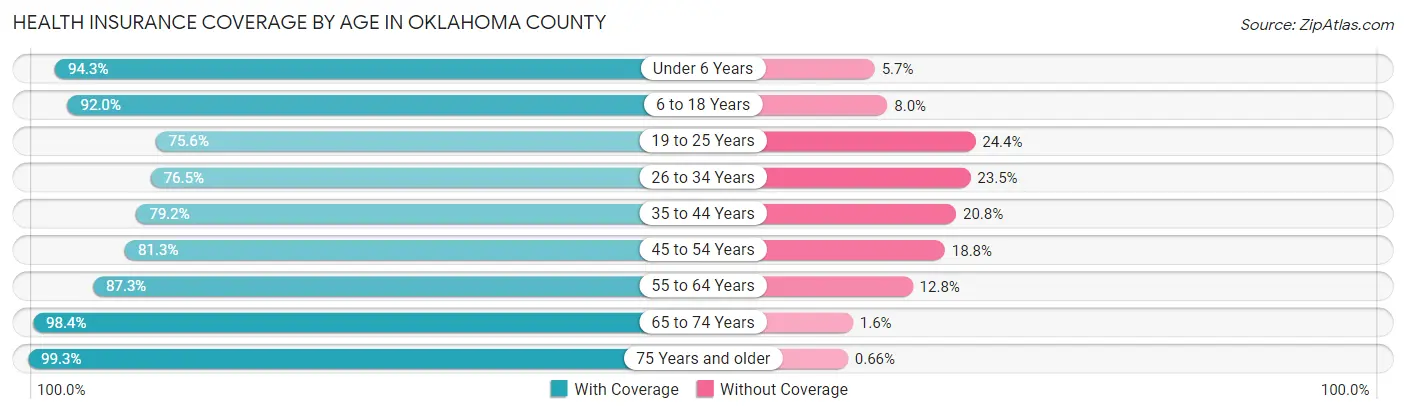
| Age Bracket | With Coverage | Without Coverage |
| Under 6 Years | 63,177 (94.3%) | 3,806 (5.7%) |
| 6 to 18 Years | 132,717 (92.0%) | 11,581 (8.0%) |
| 19 to 25 Years | 56,603 (75.6%) | 18,296 (24.4%) |
| 26 to 34 Years | 79,894 (76.5%) | 24,564 (23.5%) |
| 35 to 44 Years | 82,299 (79.2%) | 21,670 (20.8%) |
| 45 to 54 Years | 71,627 (81.2%) | 16,524 (18.8%) |
| 55 to 64 Years | 79,582 (87.3%) | 11,627 (12.8%) |
| 65 to 74 Years | 65,922 (98.4%) | 1,063 (1.6%) |
| 75 Years and older | 42,068 (99.3%) | 278 (0.7%) |
| Total | 673,889 (86.0%) | 109,409 (14.0%) |
Health Insurance Coverage by Citizenship Status in Oklahoma County
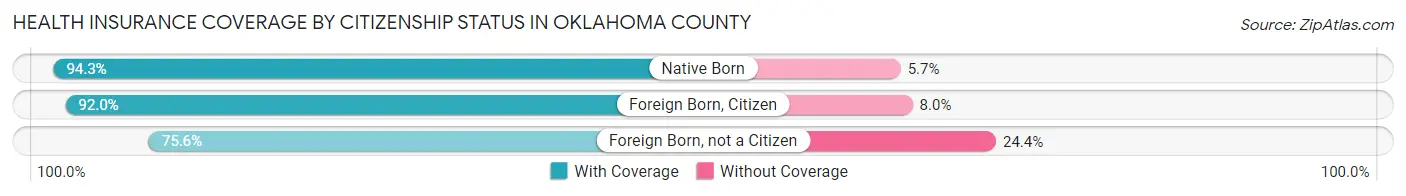
| Citizenship Status | With Coverage | Without Coverage |
| Native Born | 63,177 (94.3%) | 3,806 (5.7%) |
| Foreign Born, Citizen | 132,717 (92.0%) | 11,581 (8.0%) |
| Foreign Born, not a Citizen | 56,603 (75.6%) | 18,296 (24.4%) |
Health Insurance Coverage by Household Income in Oklahoma County
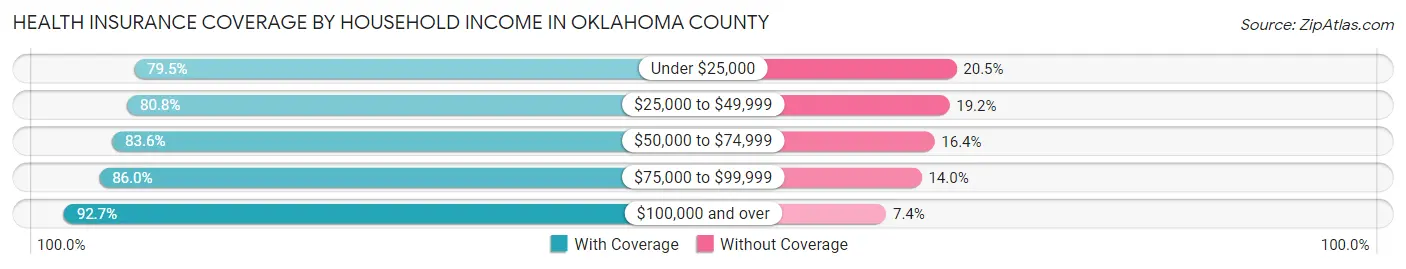
| Household Income | With Coverage | Without Coverage |
| Under $25,000 | 83,934 (79.5%) | 21,683 (20.5%) |
| $25,000 to $49,999 | 119,807 (80.8%) | 28,489 (19.2%) |
| $50,000 to $74,999 | 116,587 (83.6%) | 22,881 (16.4%) |
| $75,000 to $99,999 | 93,934 (86.0%) | 15,274 (14.0%) |
| $100,000 and over | 253,193 (92.6%) | 20,083 (7.3%) |
Public vs Private Health Insurance Coverage by Age in Oklahoma County
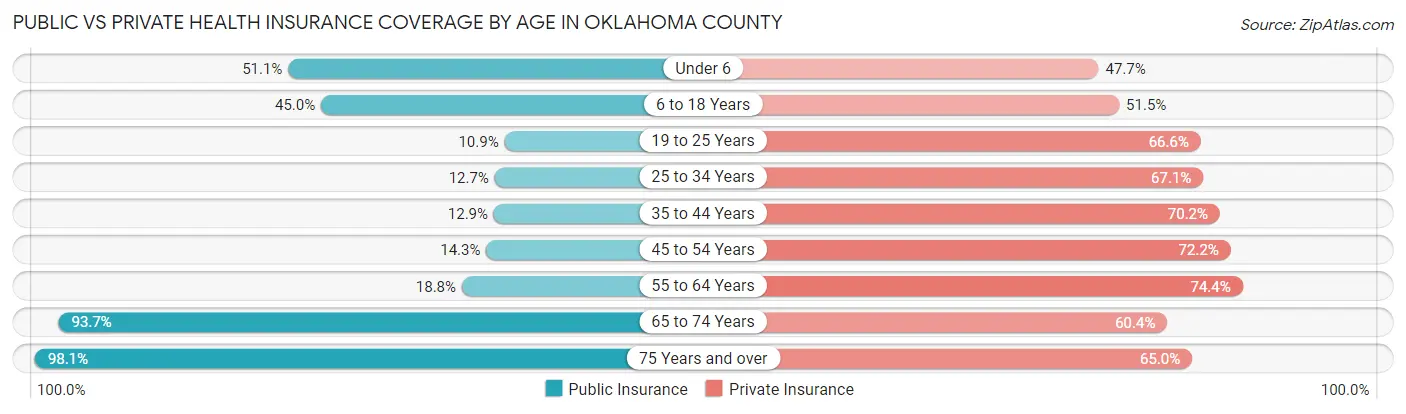
| Age Bracket | Public Insurance | Private Insurance |
| Under 6 | 34,210 (51.1%) | 31,926 (47.7%) |
| 6 to 18 Years | 64,893 (45.0%) | 74,290 (51.5%) |
| 19 to 25 Years | 8,184 (10.9%) | 49,898 (66.6%) |
| 25 to 34 Years | 13,304 (12.7%) | 70,063 (67.1%) |
| 35 to 44 Years | 13,408 (12.9%) | 72,956 (70.2%) |
| 45 to 54 Years | 12,605 (14.3%) | 63,619 (72.2%) |
| 55 to 64 Years | 17,182 (18.8%) | 67,837 (74.4%) |
| 65 to 74 Years | 62,770 (93.7%) | 40,462 (60.4%) |
| 75 Years and over | 41,537 (98.1%) | 27,531 (65.0%) |
| Total | 268,093 (34.2%) | 498,582 (63.6%) |
Disability Status by Sex by Age in Oklahoma County
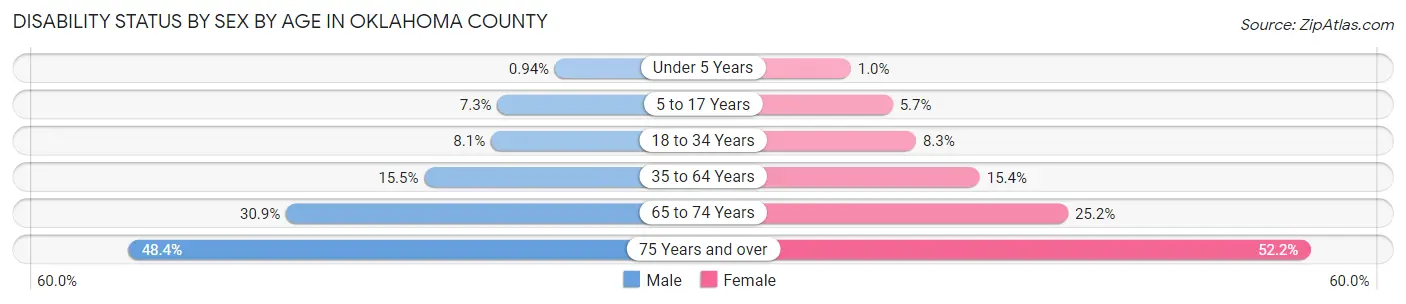
| Age Bracket | Male | Female |
| Under 5 Years | 265 (0.9%) | 271 (1.0%) |
| 5 to 17 Years | 5,471 (7.3%) | 4,020 (5.7%) |
| 18 to 34 Years | 7,530 (8.1%) | 7,961 (8.3%) |
| 35 to 64 Years | 21,481 (15.5%) | 22,231 (15.4%) |
| 65 to 74 Years | 9,647 (30.9%) | 9,006 (25.2%) |
| 75 Years and over | 8,172 (48.4%) | 13,281 (52.2%) |
Disability Class by Sex by Age in Oklahoma County
Disability Class: Hearing Difficulty
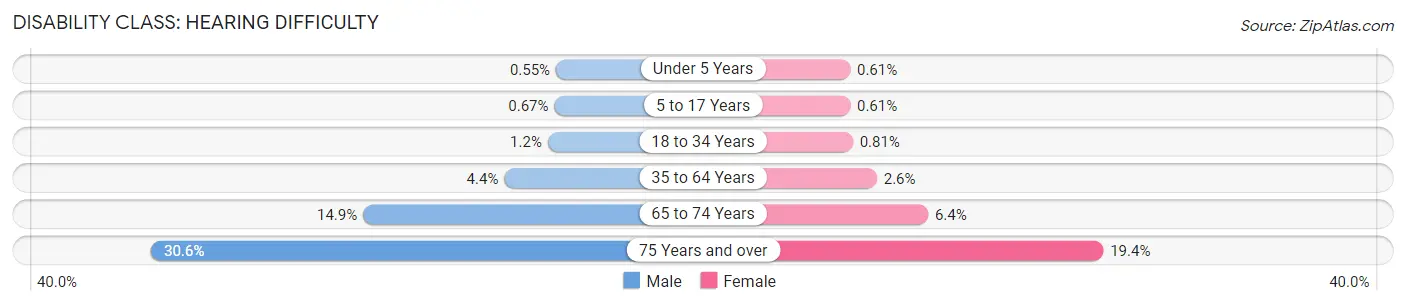
| Age Bracket | Male | Female |
| Under 5 Years | 155 (0.5%) | 166 (0.6%) |
| 5 to 17 Years | 501 (0.7%) | 430 (0.6%) |
| 18 to 34 Years | 1,084 (1.2%) | 784 (0.8%) |
| 35 to 64 Years | 6,083 (4.4%) | 3,753 (2.6%) |
| 65 to 74 Years | 4,646 (14.9%) | 2,287 (6.4%) |
| 75 Years and over | 5,169 (30.6%) | 4,941 (19.4%) |
Disability Class: Vision Difficulty
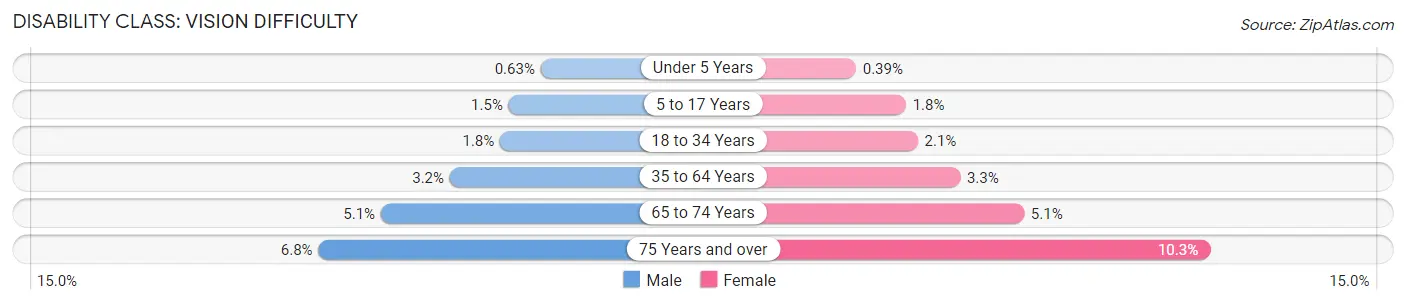
| Age Bracket | Male | Female |
| Under 5 Years | 178 (0.6%) | 105 (0.4%) |
| 5 to 17 Years | 1,133 (1.5%) | 1,262 (1.8%) |
| 18 to 34 Years | 1,645 (1.8%) | 2,038 (2.1%) |
| 35 to 64 Years | 4,389 (3.2%) | 4,764 (3.3%) |
| 65 to 74 Years | 1,588 (5.1%) | 1,811 (5.1%) |
| 75 Years and over | 1,151 (6.8%) | 2,610 (10.2%) |
Disability Class: Cognitive Difficulty
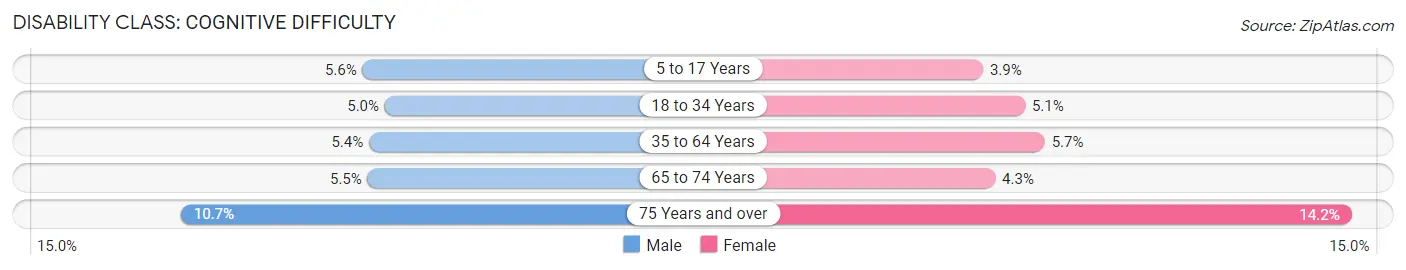
| Age Bracket | Male | Female |
| 5 to 17 Years | 4,168 (5.6%) | 2,783 (3.9%) |
| 18 to 34 Years | 4,647 (5.0%) | 4,918 (5.1%) |
| 35 to 64 Years | 7,500 (5.4%) | 8,177 (5.7%) |
| 65 to 74 Years | 1,702 (5.4%) | 1,527 (4.3%) |
| 75 Years and over | 1,799 (10.6%) | 3,612 (14.2%) |
Disability Class: Ambulatory Difficulty
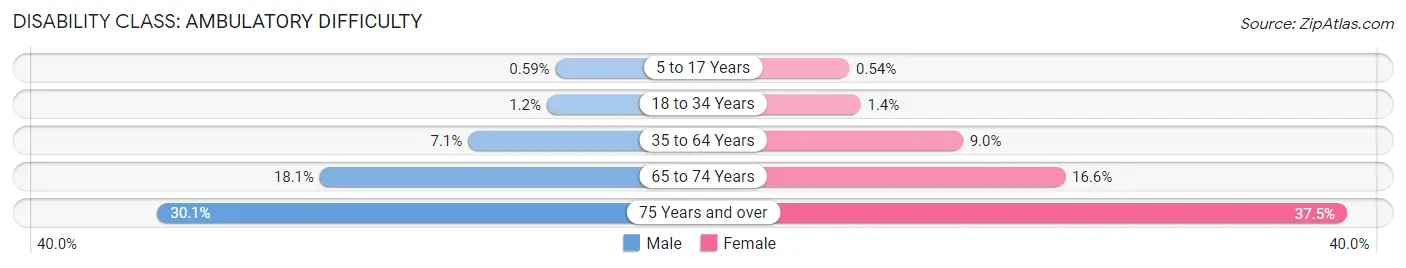
| Age Bracket | Male | Female |
| 5 to 17 Years | 439 (0.6%) | 380 (0.5%) |
| 18 to 34 Years | 1,151 (1.2%) | 1,342 (1.4%) |
| 35 to 64 Years | 9,813 (7.1%) | 12,983 (9.0%) |
| 65 to 74 Years | 5,650 (18.1%) | 5,926 (16.6%) |
| 75 Years and over | 5,089 (30.1%) | 9,548 (37.5%) |
Disability Class: Self-Care Difficulty
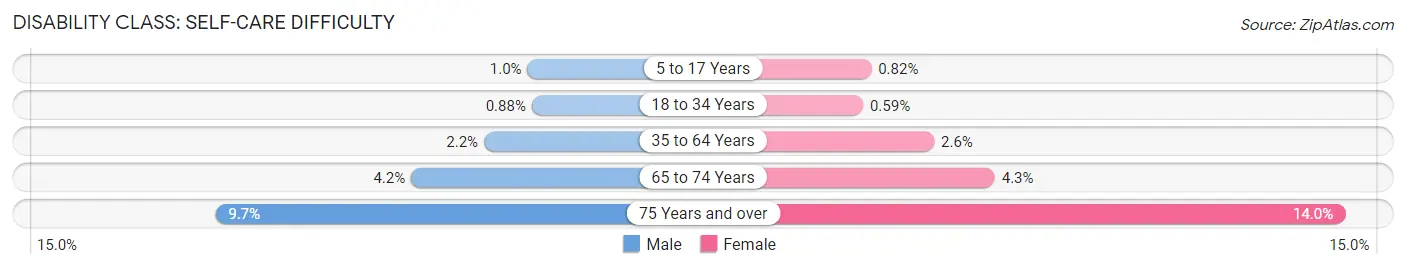
| Age Bracket | Male | Female |
| 5 to 17 Years | 746 (1.0%) | 580 (0.8%) |
| 18 to 34 Years | 823 (0.9%) | 572 (0.6%) |
| 35 to 64 Years | 3,065 (2.2%) | 3,712 (2.6%) |
| 65 to 74 Years | 1,326 (4.2%) | 1,524 (4.3%) |
| 75 Years and over | 1,636 (9.7%) | 3,568 (14.0%) |
Technology Access in Oklahoma County
Computing Device Access in Oklahoma County
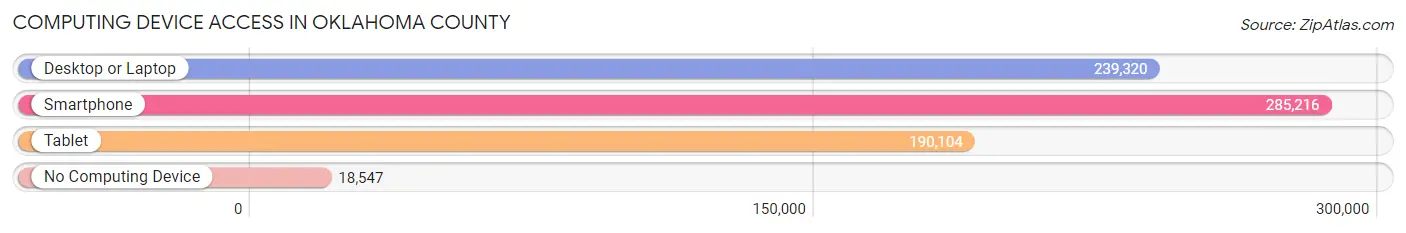
| Device Type | # Households | % Households |
| Desktop or Laptop | 239,320 | 75.2% |
| Smartphone | 285,216 | 89.6% |
| Tablet | 190,104 | 59.7% |
| No Computing Device | 18,547 | 5.8% |
| Total | 318,212 | 100.0% |
Internet Access in Oklahoma County
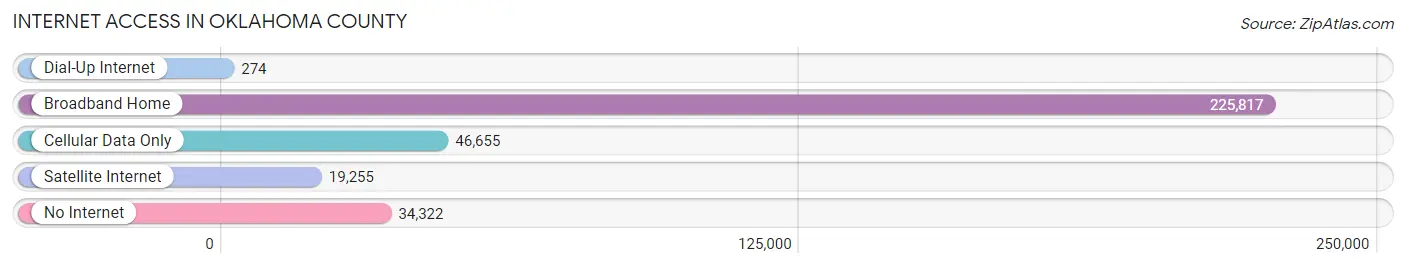
| Internet Type | # Households | % Households |
| Dial-Up Internet | 274 | 0.1% |
| Broadband Home | 225,817 | 71.0% |
| Cellular Data Only | 46,655 | 14.7% |
| Satellite Internet | 19,255 | 6.0% |
| No Internet | 34,322 | 10.8% |
| Total | 318,212 | 100.0% |
Oklahoma County Summary
Oklahoma County is located in the central part of the state of Oklahoma and is the most populous county in the state. It is bordered by Canadian, Cleveland, Logan, and Oklahoma counties. The county seat is Oklahoma City, which is also the state capital.
History
Oklahoma County was created in 1890, when the Unassigned Lands were opened for settlement. The county was named for the Choctaw Nation, which had been relocated to the area in the 1830s. The county was originally part of the larger Oklahoma Territory, which was created in 1890.
In 1907, Oklahoma County was split into two parts, with the eastern portion becoming Oklahoma City. The city was incorporated in 1910 and became the state capital in 1912.
Geography
Oklahoma County covers an area of 718 square miles and is located in the central part of the state. It is bordered by Canadian, Cleveland, Logan, and Oklahoma counties. The county is mostly flat, with some rolling hills in the western part. The county is drained by the North Canadian River and its tributaries.
The county has a humid subtropical climate, with hot summers and mild winters. The average annual temperature is 63°F, and the average annual precipitation is 36 inches.
Economy
Oklahoma County is home to a diverse economy. The county is home to several major industries, including oil and gas, manufacturing, finance, and healthcare. The county is also home to several major employers, including Tinker Air Force Base, the University of Oklahoma, and the Oklahoma City Thunder NBA team.
The county has a strong agricultural sector, with crops such as wheat, corn, and soybeans being grown in the area. The county is also home to several large livestock operations, including cattle, hogs, and poultry.
Demographics
As of the 2010 census, Oklahoma County had a population of 718,633. The population was spread out, with 24.3% under the age of 18, 10.2% from 18 to 24, 28.2% from 25 to 44, 24.3% from 45 to 64, and 12.9% who were 65 years of age or older. The median age was 35.4 years.
The racial makeup of the county was 68.2% White, 15.2% African American, 5.7% Native American, 4.2% Asian, 0.2% Pacific Islander, 3.3% from other races, and 3.2% from two or more races. Hispanic or Latino of any race were 8.7% of the population.
The median income for a household in the county was $48,927, and the median income for a family was $58,945. The per capita income for the county was $25,845. About 11.2% of families and 14.7% of the population were below the poverty line, including 20.2% of those under age 18 and 8.2% of those age 65 or over.
Common Questions
What is the Total Population of Oklahoma County?
Total Population of Oklahoma County is 795,822.
What is the Total Male Population of Oklahoma County?
Total Male Population of Oklahoma County is 391,854.
What is the Total Female Population of Oklahoma County?
Total Female Population of Oklahoma County is 403,968.
What is the Ratio of Males per 100 Females in Oklahoma County?
There are 97.00 Males per 100 Females in Oklahoma County.
What is the Ratio of Females per 100 Males in Oklahoma County?
There are 103.09 Females per 100 Males in Oklahoma County.
What is the Median Population Age in Oklahoma County?
Median Population Age in Oklahoma County is 35.1 Years.
What is the Average Family Size in Oklahoma County
Average Family Size in Oklahoma County is 3.1 People.
What is the Average Household Size in Oklahoma County
Average Household Size in Oklahoma County is 2.5 People.
What is Per Capita Income in Oklahoma County?
Per Capita income in Oklahoma County is $36,987.
What is the Median Family Income in Oklahoma County?
Median Family Income in Oklahoma County is $78,496.
What is the Median Household income in Oklahoma County?
Median Household Income in Oklahoma County is $62,505.
What is Income or Wage Gap in Oklahoma County?
Income or Wage Gap in Oklahoma County is 26.9%.
Women in Oklahoma County earn 73.1 cents for every dollar earned by a man.
What is Family Income Deficit in Oklahoma County?
Family Income Deficit in Oklahoma County is $11,578.
Families that are below poverty line in Oklahoma County earn $11,578 less on average than the poverty threshold level.
What is Inequality or Gini Index in Oklahoma County?
Inequality or Gini Index in Oklahoma County is 0.49.
How Large is the Labor Force in Oklahoma County?
There are 406,013 People in the Labor Forcein in Oklahoma County.
What is the Percentage of People in the Labor Force in Oklahoma County?
65.8% of People are in the Labor Force in Oklahoma County.
What is the Unemployment Rate in Oklahoma County?
Unemployment Rate in Oklahoma County is 4.6%.