Nowata County, OK
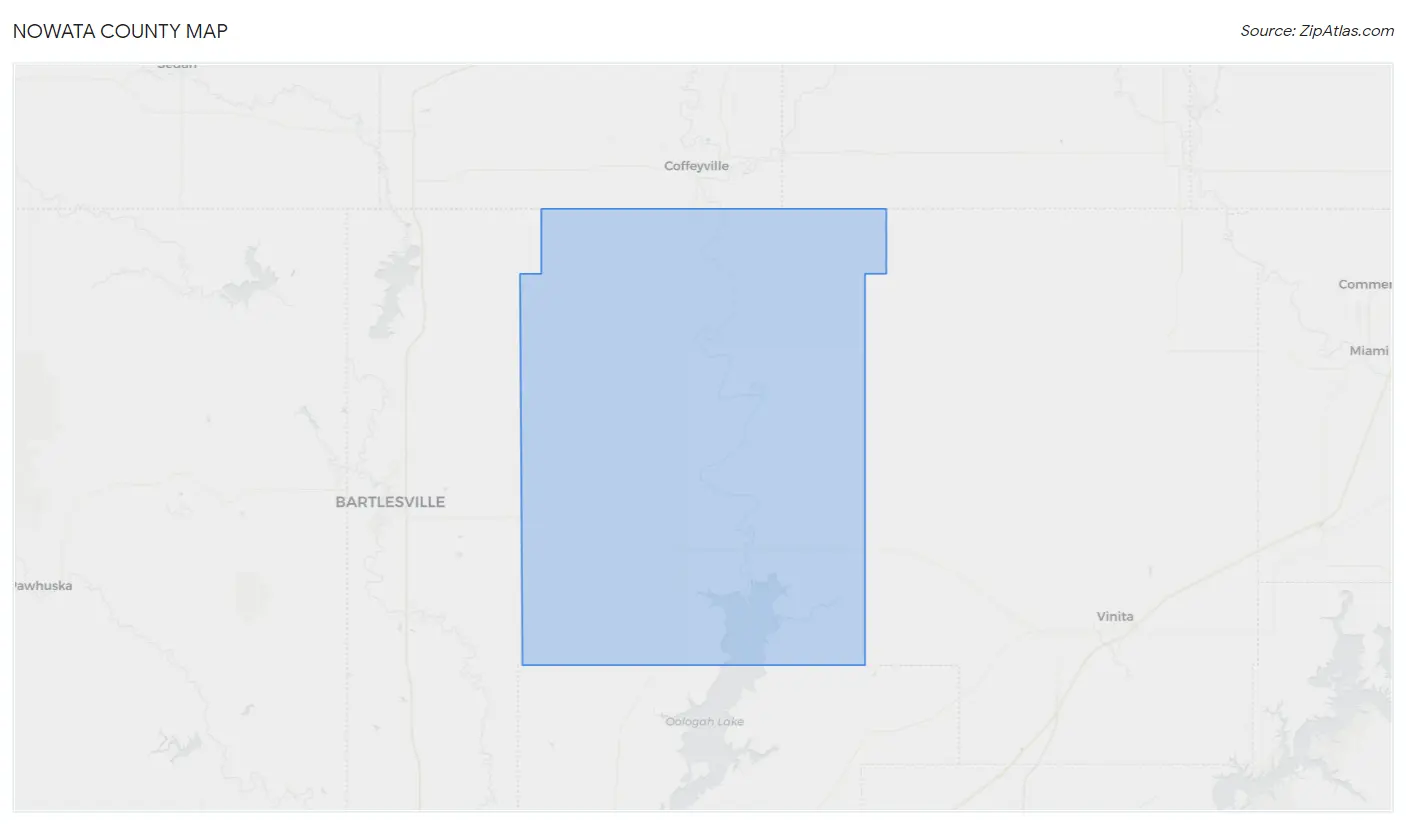
Nowata County Map
Nowata County Overview
9,460
TOTAL POPULATION
4,678
MALE POPULATION
4,782
FEMALE POPULATION
97.83
MALES / 100 FEMALES
102.22
FEMALES / 100 MALES
42.1
MEDIAN AGE
3.0
AVG FAMILY SIZE
2.5
AVG HOUSEHOLD SIZE
$29,851
PER CAPITA INCOME
$61,860
AVG FAMILY INCOME
$50,960
AVG HOUSEHOLD INCOME
39.1%
WAGE / INCOME GAP [ % ]
60.9¢/ $1
WAGE / INCOME GAP [ $ ]
$11,532
FAMILY INCOME DEFICIT
0.45
INEQUALITY / GINI INDEX
4,174
LABOR FORCE [ PEOPLE ]
55.2%
PERCENT IN LABOR FORCE
4.3%
UNEMPLOYMENT RATE
Nowata County Area Codes
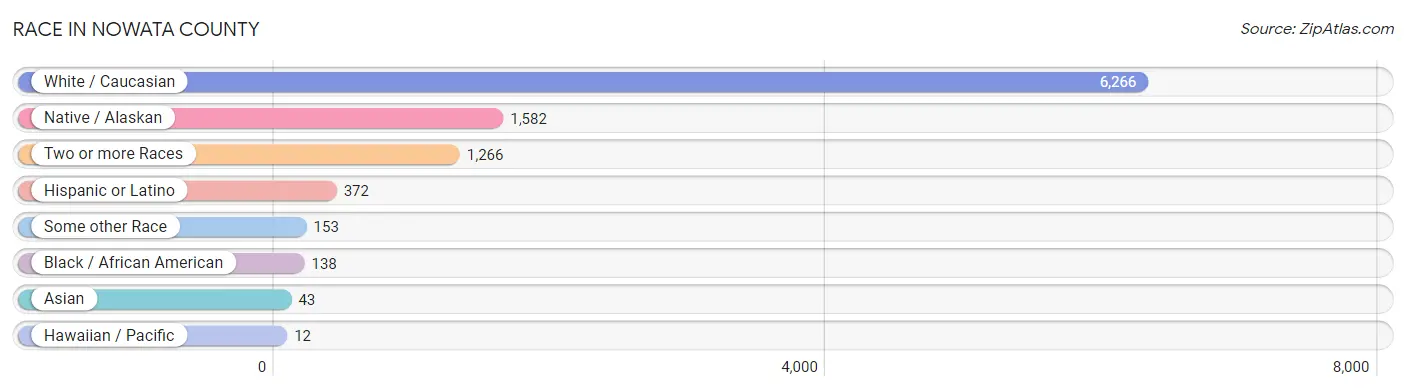
Race in Nowata County
The most populous races in Nowata County are White / Caucasian (6,266 | 66.2%), Native / Alaskan (1,582 | 16.7%), and Two or more Races (1,266 | 13.4%).
| Race | # Population | % Population |
| Asian | 43 | 0.4% |
| Black / African American | 138 | 1.5% |
| Hawaiian / Pacific | 12 | 0.1% |
| Hispanic or Latino | 372 | 3.9% |
| Native / Alaskan | 1,582 | 16.7% |
| White / Caucasian | 6,266 | 66.2% |
| Two or more Races | 1,266 | 13.4% |
| Some other Race | 153 | 1.6% |
| Total | 9,460 | 100.0% |
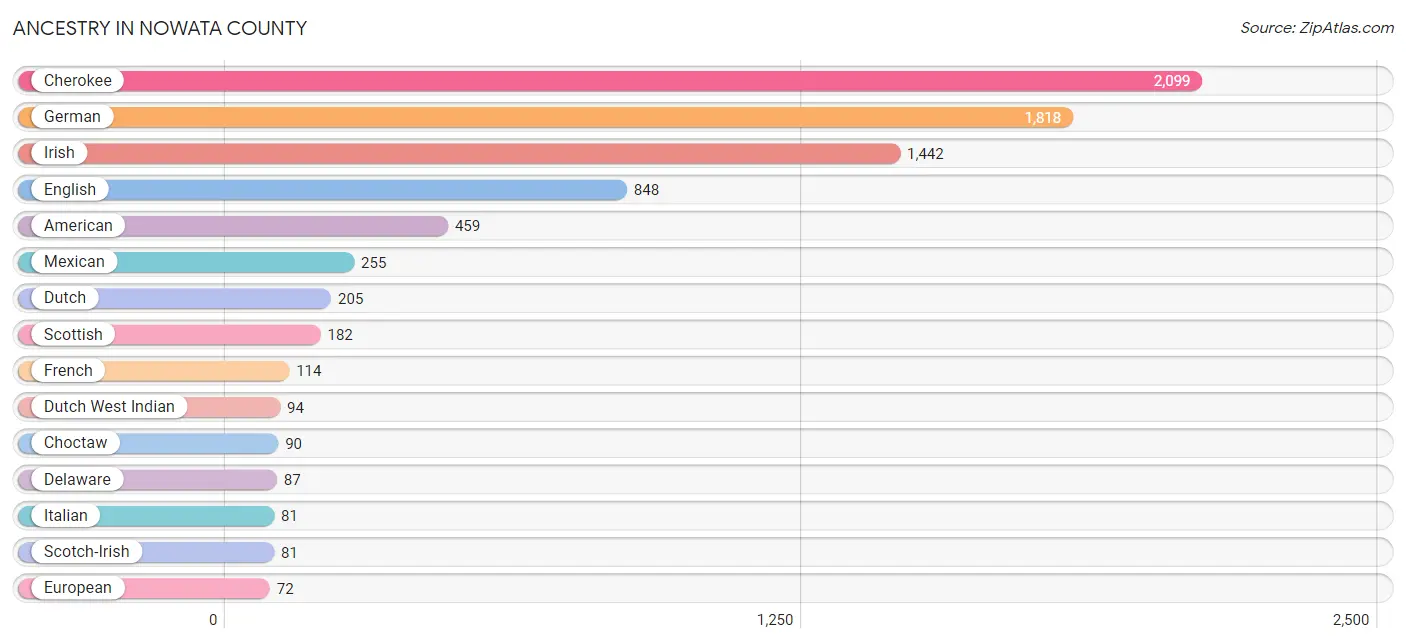
Ancestry in Nowata County
The most populous ancestries reported in Nowata County are Cherokee (2,099 | 22.2%), German (1,818 | 19.2%), Irish (1,442 | 15.2%), English (848 | 9.0%), and American (459 | 4.9%), together accounting for 70.5% of all Nowata County residents.
| Ancestry | # Population | % Population |
| American | 459 | 4.9% |
| Apache | 14 | 0.2% |
| Arab | 6 | 0.1% |
| Austrian | 8 | 0.1% |
| Bhutanese | 42 | 0.4% |
| Blackfeet | 10 | 0.1% |
| British | 13 | 0.1% |
| Bulgarian | 2 | 0.0% |
| Burmese | 5 | 0.1% |
| Canadian | 11 | 0.1% |
| Central American | 55 | 0.6% |
| Cherokee | 2,099 | 22.2% |
| Cheyenne | 9 | 0.1% |
| Chickasaw | 28 | 0.3% |
| Choctaw | 90 | 0.9% |
| Colombian | 8 | 0.1% |
| Creek | 65 | 0.7% |
| Croatian | 5 | 0.1% |
| Czech | 35 | 0.4% |
| Danish | 36 | 0.4% |
| Delaware | 87 | 0.9% |
| Dutch | 205 | 2.2% |
| Dutch West Indian | 94 | 1.0% |
| Eastern European | 24 | 0.3% |
| English | 848 | 9.0% |
| European | 72 | 0.8% |
| French | 114 | 1.2% |
| French Canadian | 13 | 0.1% |
| German | 1,818 | 19.2% |
| Greek | 2 | 0.0% |
| Guatemalan | 45 | 0.5% |
| Hungarian | 9 | 0.1% |
| Icelander | 5 | 0.1% |
| Irish | 1,442 | 15.2% |
| Italian | 81 | 0.9% |
| Kiowa | 44 | 0.5% |
| Korean | 6 | 0.1% |
| Macedonian | 12 | 0.1% |
| Malaysian | 3 | 0.0% |
| Mexican | 255 | 2.7% |
| Moroccan | 6 | 0.1% |
| Native Hawaiian | 50 | 0.5% |
| Northern European | 11 | 0.1% |
| Norwegian | 31 | 0.3% |
| Osage | 9 | 0.1% |
| Ottawa | 3 | 0.0% |
| Pakistani | 12 | 0.1% |
| Pennsylvania German | 4 | 0.0% |
| Polish | 60 | 0.6% |
| Portuguese | 9 | 0.1% |
| Potawatomi | 3 | 0.0% |
| Puerto Rican | 17 | 0.2% |
| Romanian | 10 | 0.1% |
| Russian | 11 | 0.1% |
| Salvadoran | 10 | 0.1% |
| Scandinavian | 6 | 0.1% |
| Scotch-Irish | 81 | 0.9% |
| Scottish | 182 | 1.9% |
| Seminole | 26 | 0.3% |
| Sioux | 20 | 0.2% |
| South American | 8 | 0.1% |
| Sri Lankan | 29 | 0.3% |
| Swedish | 61 | 0.6% |
| Swiss | 4 | 0.0% |
| Welsh | 36 | 0.4% | View All 65 Rows |
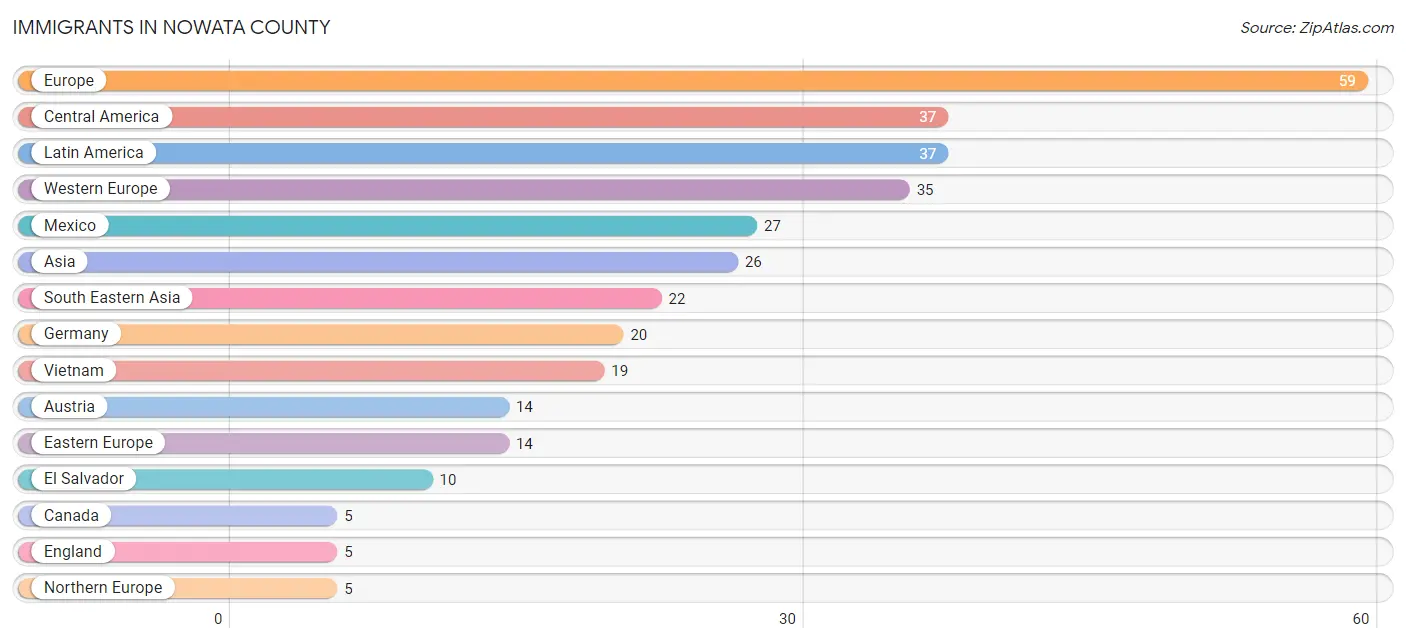
Immigrants in Nowata County
The most numerous immigrant groups reported in Nowata County came from Europe (59 | 0.6%), Central America (37 | 0.4%), Latin America (37 | 0.4%), Western Europe (35 | 0.4%), and Mexico (27 | 0.3%), together accounting for 2.1% of all Nowata County residents.
| Immigration Origin | # Population | % Population |
| Africa | 1 | 0.0% |
| Asia | 26 | 0.3% |
| Austria | 14 | 0.2% |
| Bulgaria | 2 | 0.0% |
| Canada | 5 | 0.1% |
| Central America | 37 | 0.4% |
| Eastern Asia | 4 | 0.0% |
| Eastern Europe | 14 | 0.2% |
| El Salvador | 10 | 0.1% |
| England | 5 | 0.1% |
| Europe | 59 | 0.6% |
| Germany | 20 | 0.2% |
| Japan | 3 | 0.0% |
| Korea | 1 | 0.0% |
| Latin America | 37 | 0.4% |
| Mexico | 27 | 0.3% |
| Micronesia | 3 | 0.0% |
| Morocco | 1 | 0.0% |
| Netherlands | 1 | 0.0% |
| Northern Africa | 1 | 0.0% |
| Northern Europe | 5 | 0.1% |
| Oceania | 3 | 0.0% |
| Philippines | 3 | 0.0% |
| South Eastern Asia | 22 | 0.2% |
| Southern Europe | 5 | 0.1% |
| Spain | 5 | 0.1% |
| Vietnam | 19 | 0.2% |
| Western Europe | 35 | 0.4% | View All 28 Rows |
Sex and Age in Nowata County
Sex and Age in Nowata County
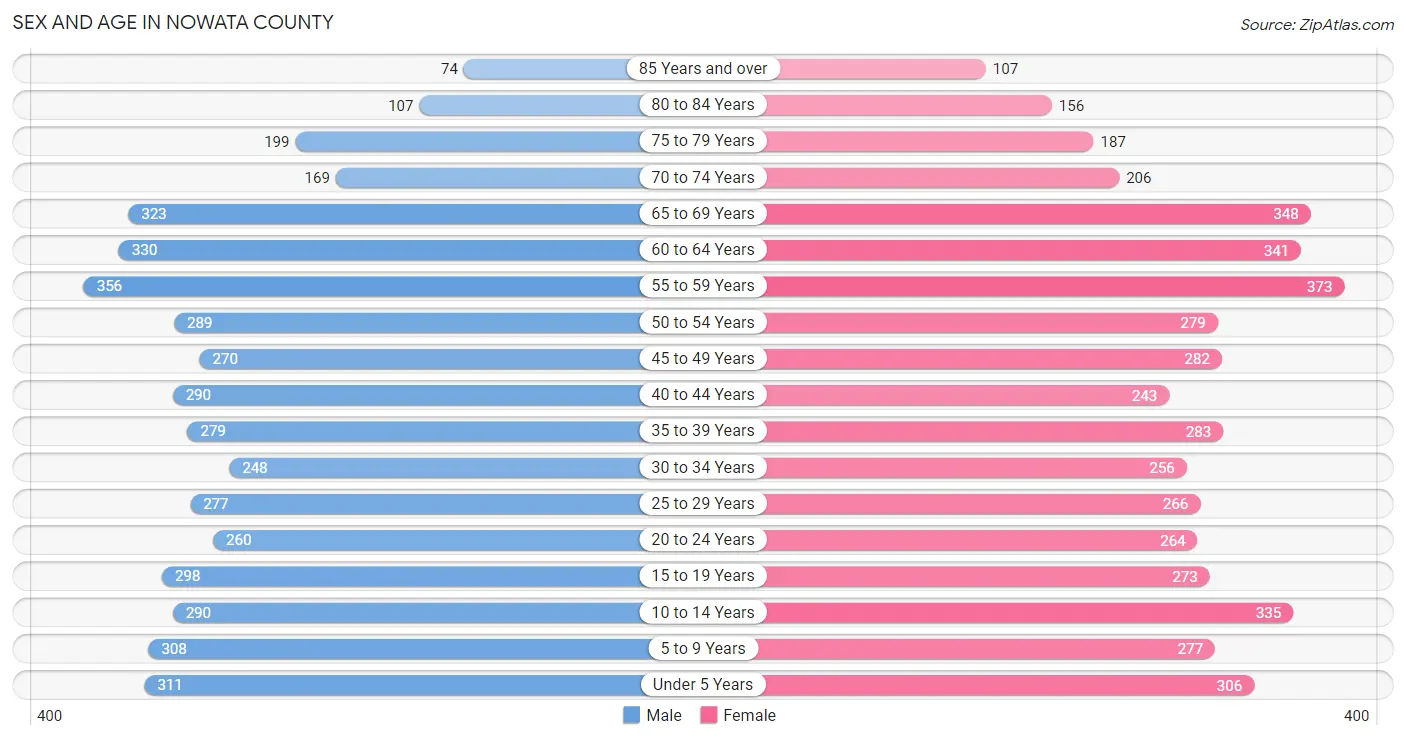
The most populous age groups in Nowata County are 55 to 59 Years (356 | 7.6%) for men and 55 to 59 Years (373 | 7.8%) for women.
| Age Bracket | Male | Female |
| Under 5 Years | 311 (6.7%) | 306 (6.4%) |
| 5 to 9 Years | 308 (6.6%) | 277 (5.8%) |
| 10 to 14 Years | 290 (6.2%) | 335 (7.0%) |
| 15 to 19 Years | 298 (6.4%) | 273 (5.7%) |
| 20 to 24 Years | 260 (5.6%) | 264 (5.5%) |
| 25 to 29 Years | 277 (5.9%) | 266 (5.6%) |
| 30 to 34 Years | 248 (5.3%) | 256 (5.3%) |
| 35 to 39 Years | 279 (6.0%) | 283 (5.9%) |
| 40 to 44 Years | 290 (6.2%) | 243 (5.1%) |
| 45 to 49 Years | 270 (5.8%) | 282 (5.9%) |
| 50 to 54 Years | 289 (6.2%) | 279 (5.8%) |
| 55 to 59 Years | 356 (7.6%) | 373 (7.8%) |
| 60 to 64 Years | 330 (7.0%) | 341 (7.1%) |
| 65 to 69 Years | 323 (6.9%) | 348 (7.3%) |
| 70 to 74 Years | 169 (3.6%) | 206 (4.3%) |
| 75 to 79 Years | 199 (4.3%) | 187 (3.9%) |
| 80 to 84 Years | 107 (2.3%) | 156 (3.3%) |
| 85 Years and over | 74 (1.6%) | 107 (2.2%) |
| Total | 4,678 (100.0%) | 4,782 (100.0%) |
Families and Households in Nowata County
Median Family Size in Nowata County
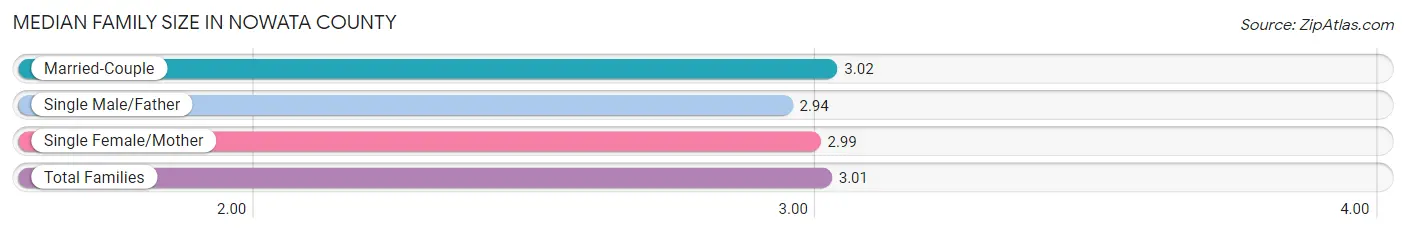
The median family size in Nowata County is 3.01 persons per family, with married-couple families (1,949 | 76.5%) accounting for the largest median family size of 3.02 persons per family. On the other hand, single male/father families (197 | 7.7%) represent the smallest median family size with 2.94 persons per family.
| Family Type | # Families | Family Size |
| Married-Couple | 1,949 (76.5%) | 3.02 |
| Single Male/Father | 197 (7.7%) | 2.94 |
| Single Female/Mother | 401 (15.7%) | 2.99 |
| Total Families | 2,547 (100.0%) | 3.01 |
Median Household Size in Nowata County
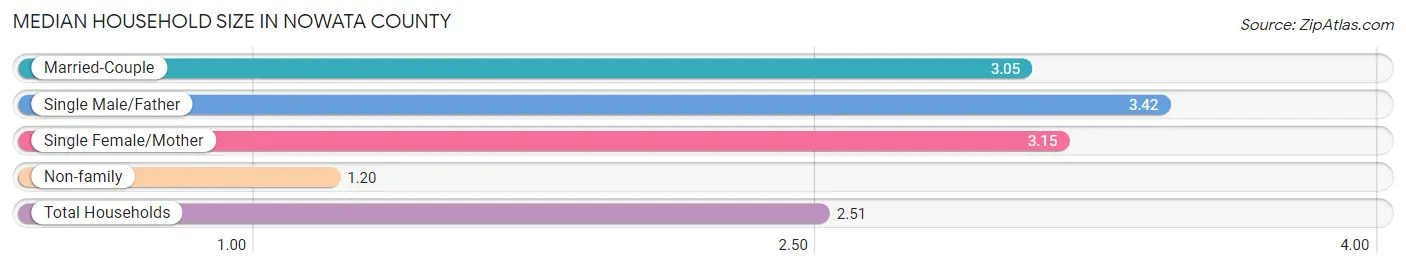
The median household size in Nowata County is 2.51 persons per household, with single male/father households (197 | 5.3%) accounting for the largest median household size of 3.42 persons per household. non-family households (1,154 | 31.2%) represent the smallest median household size with 1.20 persons per household.
| Household Type | # Households | Household Size |
| Married-Couple | 1,949 (52.7%) | 3.05 |
| Single Male/Father | 197 (5.3%) | 3.42 |
| Single Female/Mother | 401 (10.8%) | 3.15 |
| Non-family | 1,154 (31.2%) | 1.20 |
| Total Households | 3,701 (100.0%) | 2.51 |
Household Size by Marriage Status in Nowata County
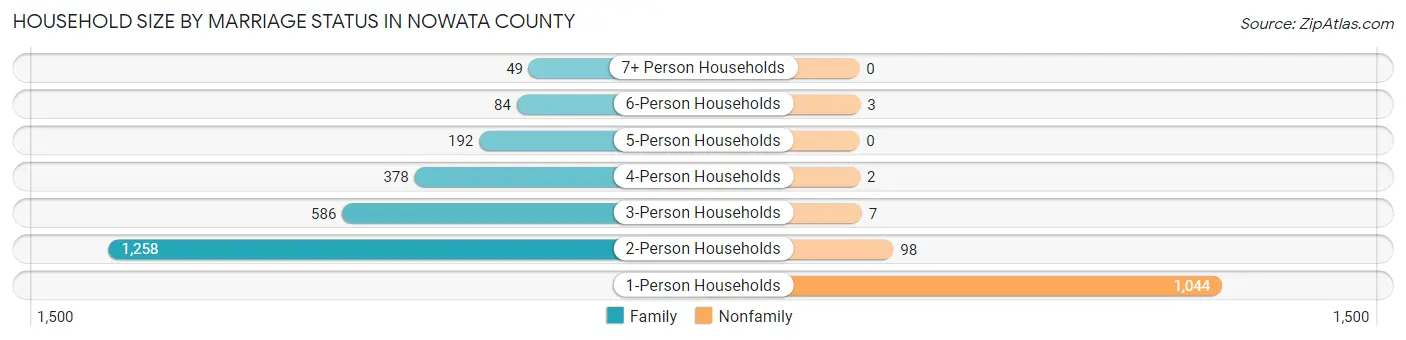
Out of a total of 3,701 households in Nowata County, 2,547 (68.8%) are family households, while 1,154 (31.2%) are nonfamily households. The most numerous type of family households are 2-person households, comprising 1,258, and the most common type of nonfamily households are 1-person households, comprising 1,044.
| Household Size | Family Households | Nonfamily Households |
| 1-Person Households | - | 1,044 (28.2%) |
| 2-Person Households | 1,258 (34.0%) | 98 (2.6%) |
| 3-Person Households | 586 (15.8%) | 7 (0.2%) |
| 4-Person Households | 378 (10.2%) | 2 (0.1%) |
| 5-Person Households | 192 (5.2%) | 0 (0.0%) |
| 6-Person Households | 84 (2.3%) | 3 (0.1%) |
| 7+ Person Households | 49 (1.3%) | 0 (0.0%) |
| Total | 2,547 (68.8%) | 1,154 (31.2%) |
Female Fertility in Nowata County
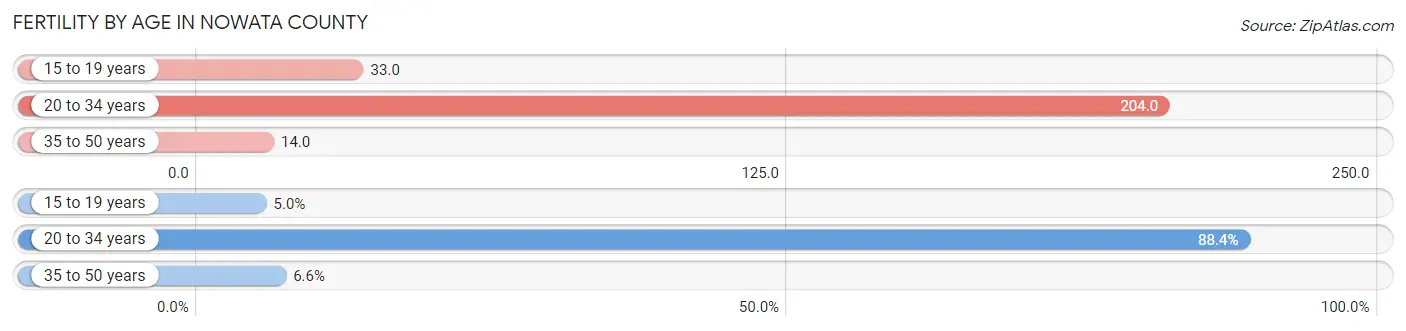
Fertility by Age in Nowata County
Average fertility rate in Nowata County is 95.0 births per 1,000 women. Women in the age bracket of 20 to 34 years have the highest fertility rate with 204.0 births per 1,000 women. Women in the age bracket of 20 to 34 years acount for 88.4% of all women with births.
| Age Bracket | Women with Births | Births / 1,000 Women |
| 15 to 19 years | 9 (5.0%) | 33.0 |
| 20 to 34 years | 160 (88.4%) | 204.0 |
| 35 to 50 years | 12 (6.6%) | 14.0 |
| Total | 181 (100.0%) | 95.0 |
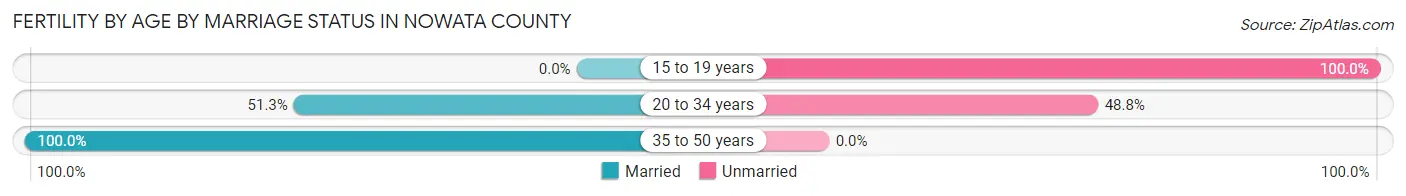
Fertility by Age by Marriage Status in Nowata County
51.9% of women with births (181) in Nowata County are married. The highest percentage of unmarried women with births falls into 15 to 19 years age bracket with 100.0% of them unmarried at the time of birth, while the lowest percentage of unmarried women with births belong to 35 to 50 years age bracket with 0.0% of them unmarried.
| Age Bracket | Married | Unmarried |
| 15 to 19 years | 0 (0.0%) | 9 (100.0%) |
| 20 to 34 years | 82 (51.2%) | 78 (48.7%) |
| 35 to 50 years | 12 (100.0%) | 0 (0.0%) |
| Total | 94 (51.9%) | 87 (48.1%) |
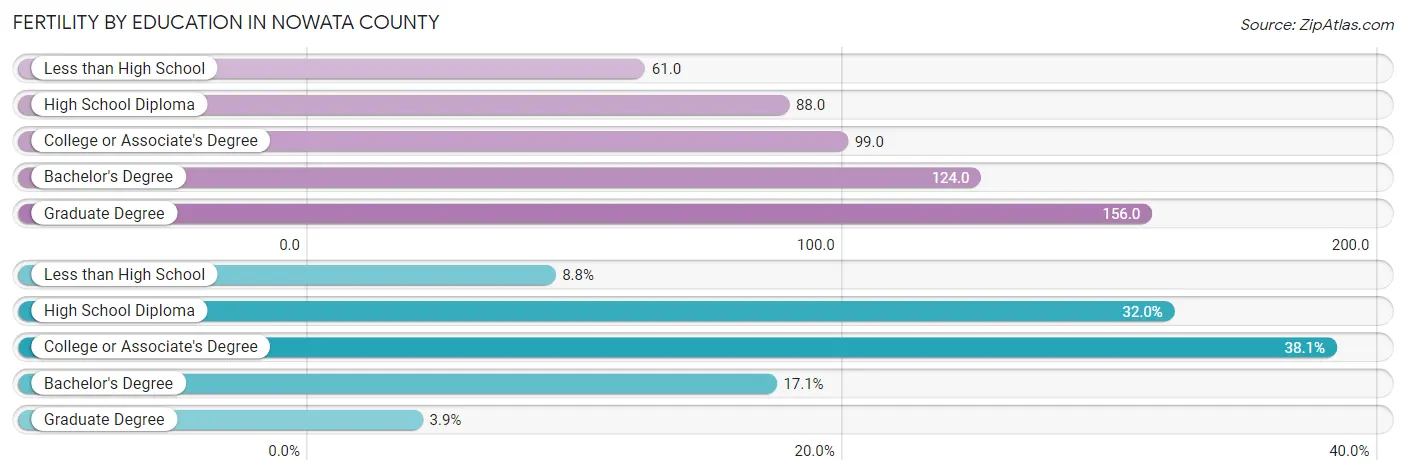
Fertility by Education in Nowata County
Average fertility rate in Nowata County is 95.0 births per 1,000 women. Women with the education attainment of graduate degree have the highest fertility rate of 156.0 births per 1,000 women, while women with the education attainment of less than high school have the lowest fertility at 61.0 births per 1,000 women. Women with the education attainment of college or associate's degree represent 38.1% of all women with births.
| Educational Attainment | Women with Births | Births / 1,000 Women |
| Less than High School | 16 (8.8%) | 61.0 |
| High School Diploma | 58 (32.0%) | 88.0 |
| College or Associate's Degree | 69 (38.1%) | 99.0 |
| Bachelor's Degree | 31 (17.1%) | 124.0 |
| Graduate Degree | 7 (3.9%) | 156.0 |
| Total | 181 (100.0%) | 95.0 |
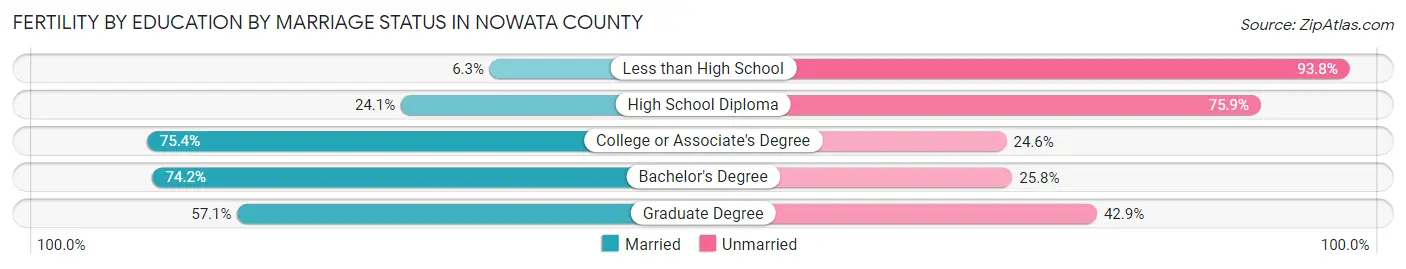
Fertility by Education by Marriage Status in Nowata County
48.1% of women with births in Nowata County are unmarried. Women with the educational attainment of college or associate's degree are most likely to be married with 75.4% of them married at childbirth, while women with the educational attainment of less than high school are least likely to be married with 93.8% of them unmarried at childbirth.
| Educational Attainment | Married | Unmarried |
| Less than High School | 1 (6.2%) | 15 (93.8%) |
| High School Diploma | 14 (24.1%) | 44 (75.9%) |
| College or Associate's Degree | 52 (75.4%) | 17 (24.6%) |
| Bachelor's Degree | 23 (74.2%) | 8 (25.8%) |
| Graduate Degree | 4 (57.1%) | 3 (42.9%) |
| Total | 94 (51.9%) | 87 (48.1%) |
Income in Nowata County
Income Overview in Nowata County
Per Capita Income in Nowata County is $29,851, while median incomes of families and households are $61,860 and $50,960 respectively.
| Characteristic | Number | Measure |
| Per Capita Income | 9,460 | $29,851 |
| Median Family Income | 2,547 | $61,860 |
| Mean Family Income | 2,547 | $82,201 |
| Median Household Income | 3,701 | $50,960 |
| Mean Household Income | 3,701 | $71,019 |
| Income Deficit | 2,547 | $11,532 |
| Wage / Income Gap (%) | 9,460 | 39.14% |
| Wage / Income Gap ($) | 9,460 | 60.86¢ per $1 |
| Gini / Inequality Index | 9,460 | 0.45 |
Earnings by Sex in Nowata County
Average Earnings in Nowata County are $35,031, $45,675 for men and $27,796 for women, a difference of 39.1%.

| Sex | Number | Average Earnings |
| Male | 2,381 (54.5%) | $45,675 |
| Female | 1,989 (45.5%) | $27,796 |
| Total | 4,370 (100.0%) | $35,031 |
Earnings by Sex by Income Bracket in Nowata County
The most common earnings brackets in Nowata County are $100,000+ for men (364 | 15.3%) and $25,000 to $29,999 for women (187 | 9.4%).
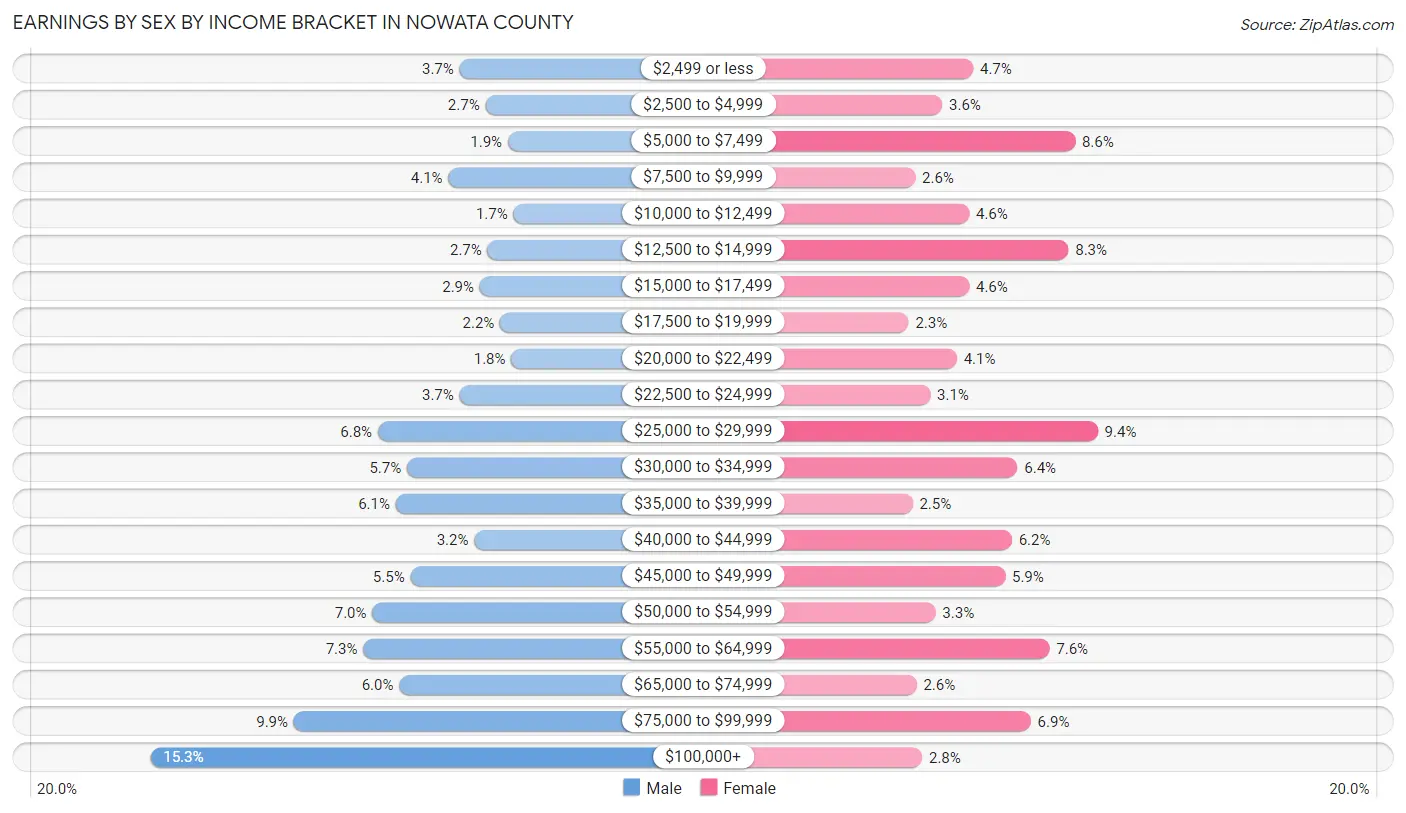
| Income | Male | Female |
| $2,499 or less | 88 (3.7%) | 94 (4.7%) |
| $2,500 to $4,999 | 65 (2.7%) | 71 (3.6%) |
| $5,000 to $7,499 | 45 (1.9%) | 170 (8.6%) |
| $7,500 to $9,999 | 98 (4.1%) | 51 (2.6%) |
| $10,000 to $12,499 | 40 (1.7%) | 91 (4.6%) |
| $12,500 to $14,999 | 63 (2.6%) | 165 (8.3%) |
| $15,000 to $17,499 | 70 (2.9%) | 91 (4.6%) |
| $17,500 to $19,999 | 52 (2.2%) | 46 (2.3%) |
| $20,000 to $22,499 | 42 (1.8%) | 82 (4.1%) |
| $22,500 to $24,999 | 88 (3.7%) | 62 (3.1%) |
| $25,000 to $29,999 | 161 (6.8%) | 187 (9.4%) |
| $30,000 to $34,999 | 135 (5.7%) | 127 (6.4%) |
| $35,000 to $39,999 | 145 (6.1%) | 49 (2.5%) |
| $40,000 to $44,999 | 75 (3.2%) | 123 (6.2%) |
| $45,000 to $49,999 | 132 (5.5%) | 118 (5.9%) |
| $50,000 to $54,999 | 166 (7.0%) | 66 (3.3%) |
| $55,000 to $64,999 | 174 (7.3%) | 151 (7.6%) |
| $65,000 to $74,999 | 142 (6.0%) | 52 (2.6%) |
| $75,000 to $99,999 | 236 (9.9%) | 137 (6.9%) |
| $100,000+ | 364 (15.3%) | 56 (2.8%) |
| Total | 2,381 (100.0%) | 1,989 (100.0%) |
Earnings by Sex by Educational Attainment in Nowata County
Average earnings in Nowata County are $50,307 for men and $30,489 for women, a difference of 39.4%. Men with an educational attainment of graduate degree enjoy the highest average annual earnings of $175,577, while those with less than high school education earn the least with $34,559. Women with an educational attainment of graduate degree earn the most with the average annual earnings of $63,182, while those with less than high school education have the smallest earnings of $15,000.
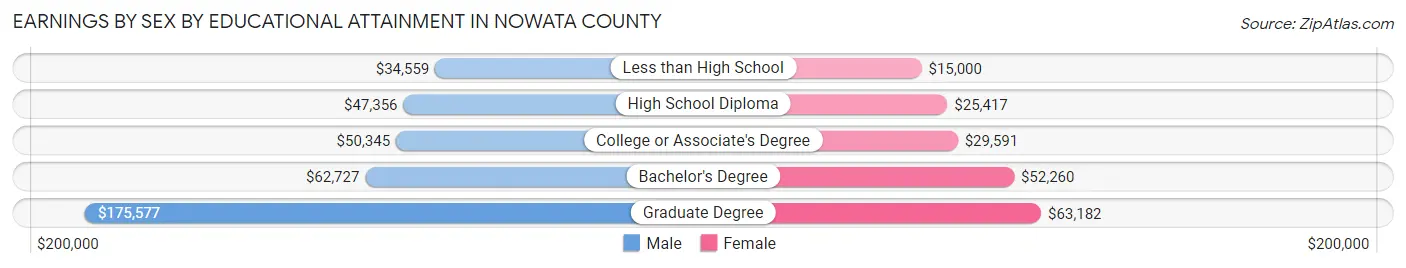
| Educational Attainment | Male Income | Female Income |
| Less than High School | $34,559 | $15,000 |
| High School Diploma | $47,356 | $25,417 |
| College or Associate's Degree | $50,345 | $29,591 |
| Bachelor's Degree | $62,727 | $52,260 |
| Graduate Degree | $175,577 | $63,182 |
| Total | $50,307 | $30,489 |
Family Income in Nowata County
Family Income Brackets in Nowata County
According to the Nowata County family income data, there are 494 families falling into the $50,000 to $74,999 income range, which is the most common income bracket and makes up 19.4% of all families. Conversely, the $10,000 to $14,999 income bracket is the least frequent group with only 56 families (2.2%) belonging to this category.

| Income Bracket | # Families | % Families |
| Less than $10,000 | 89 | 3.5% |
| $10,000 to $14,999 | 56 | 2.2% |
| $15,000 to $24,999 | 201 | 7.9% |
| $25,000 to $34,999 | 214 | 8.4% |
| $35,000 to $49,999 | 492 | 19.3% |
| $50,000 to $74,999 | 494 | 19.4% |
| $75,000 to $99,999 | 326 | 12.8% |
| $100,000 to $149,999 | 374 | 14.7% |
| $150,000 to $199,999 | 160 | 6.3% |
| $200,000+ | 143 | 5.6% |
Family Income by Famaliy Size in Nowata County
5-person families (178 | 7.0%) account for the highest median family income in Nowata County with $78,750 per family, while 2-person families (1,314 | 51.6%) have the highest median income of $27,308 per family member.
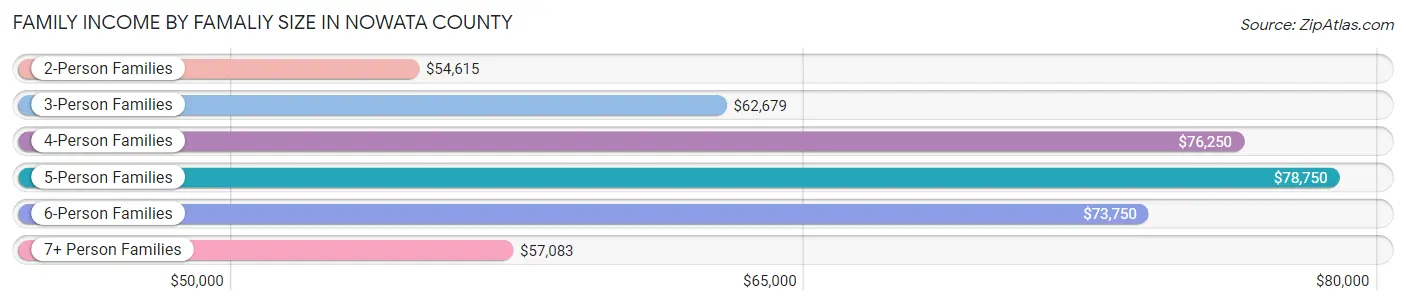
| Income Bracket | # Families | Median Income |
| 2-Person Families | 1,314 (51.6%) | $54,615 |
| 3-Person Families | 585 (23.0%) | $62,679 |
| 4-Person Families | 353 (13.9%) | $76,250 |
| 5-Person Families | 178 (7.0%) | $78,750 |
| 6-Person Families | 79 (3.1%) | $73,750 |
| 7+ Person Families | 38 (1.5%) | $57,083 |
| Total | 2,547 (100.0%) | $61,860 |
Family Income by Number of Earners in Nowata County
The median family income in Nowata County is $61,860, with families comprising 3+ earners (162) having the highest median family income of $143,750, while families with no earners (563) have the lowest median family income of $41,350, accounting for 6.4% and 22.1% of families, respectively.
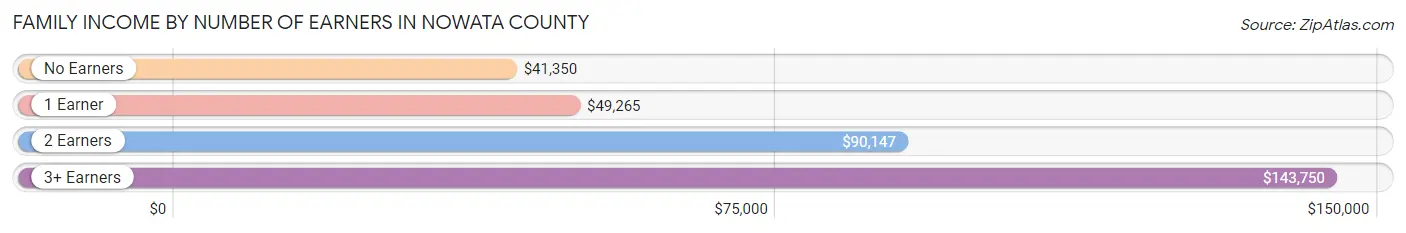
| Number of Earners | # Families | Median Income |
| No Earners | 563 (22.1%) | $41,350 |
| 1 Earner | 902 (35.4%) | $49,265 |
| 2 Earners | 920 (36.1%) | $90,147 |
| 3+ Earners | 162 (6.4%) | $143,750 |
| Total | 2,547 (100.0%) | $61,860 |
Household Income in Nowata County
Household Income Brackets in Nowata County
With 611 households falling in the category, the $50,000 to $74,999 income range is the most frequent in Nowata County, accounting for 16.5% of all households. In contrast, only 144 households (3.9%) fall into the $200,000+ income bracket, making it the least populous group.
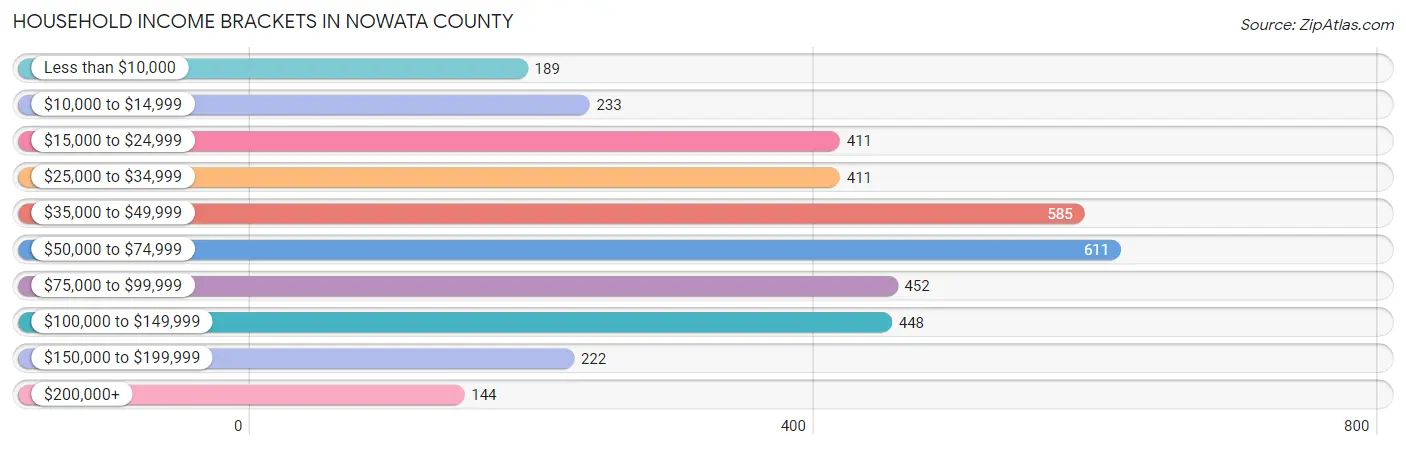
| Income Bracket | # Households | % Households |
| Less than $10,000 | 189 | 5.1% |
| $10,000 to $14,999 | 233 | 6.3% |
| $15,000 to $24,999 | 411 | 11.1% |
| $25,000 to $34,999 | 411 | 11.1% |
| $35,000 to $49,999 | 585 | 15.8% |
| $50,000 to $74,999 | 611 | 16.5% |
| $75,000 to $99,999 | 452 | 12.2% |
| $100,000 to $149,999 | 448 | 12.1% |
| $150,000 to $199,999 | 222 | 6.0% |
| $200,000+ | 144 | 3.9% |
Household Income by Householder Age in Nowata County
The median household income in Nowata County is $50,960, with the highest median household income of $63,264 found in the 25 to 44 years age bracket for the primary householder. A total of 1,009 households (27.3%) fall into this category. Meanwhile, the 15 to 24 years age bracket for the primary householder has the lowest median household income of $28,750, with 159 households (4.3%) in this group.

| Income Bracket | # Households | Median Income |
| 15 to 24 Years | 159 (4.3%) | $28,750 |
| 25 to 44 Years | 1,009 (27.3%) | $63,264 |
| 45 to 64 Years | 1,361 (36.8%) | $60,417 |
| 65+ Years | 1,172 (31.7%) | $41,838 |
| Total | 3,701 (100.0%) | $50,960 |
Poverty in Nowata County
Income Below Poverty by Sex and Age in Nowata County
With 13.9% poverty level for males and 18.0% for females among the residents of Nowata County, under 5 year old males and 16 and 17 year old females are the most vulnerable to poverty, with 89 males (28.6%) and 49 females (37.1%) in their respective age groups living below the poverty level.
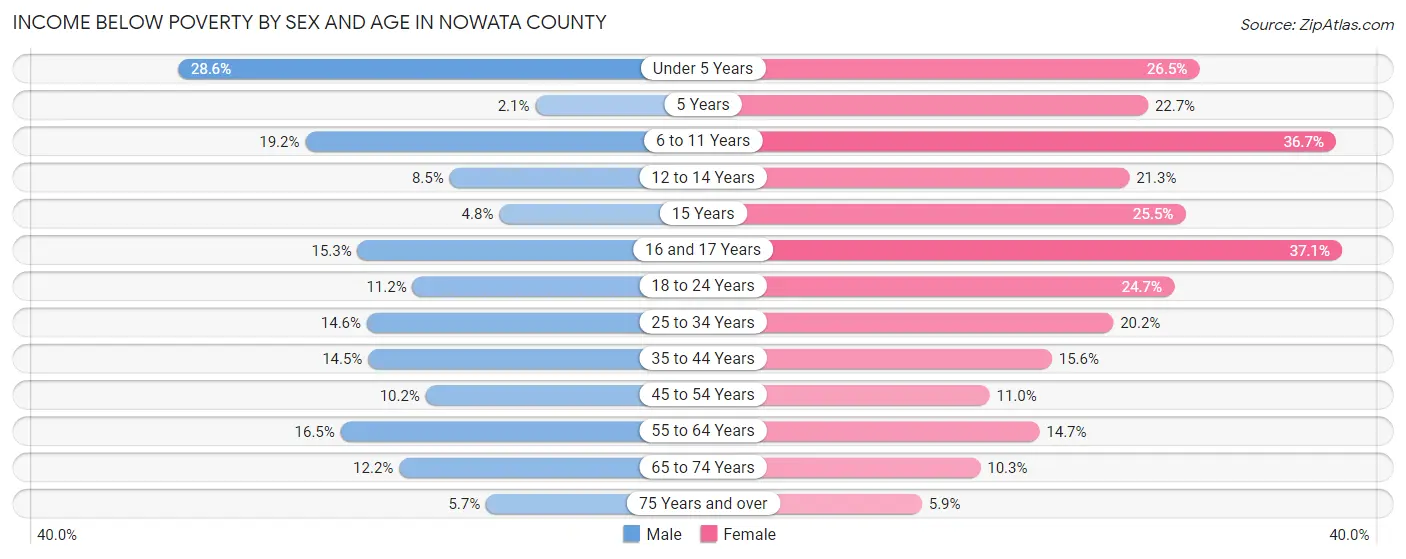
| Age Bracket | Male | Female |
| Under 5 Years | 89 (28.6%) | 78 (26.5%) |
| 5 Years | 2 (2.1%) | 5 (22.7%) |
| 6 to 11 Years | 64 (19.2%) | 143 (36.7%) |
| 12 to 14 Years | 12 (8.5%) | 35 (21.3%) |
| 15 Years | 1 (4.8%) | 13 (25.5%) |
| 16 and 17 Years | 22 (15.3%) | 49 (37.1%) |
| 18 to 24 Years | 44 (11.2%) | 87 (24.6%) |
| 25 to 34 Years | 75 (14.6%) | 105 (20.2%) |
| 35 to 44 Years | 81 (14.5%) | 82 (15.6%) |
| 45 to 54 Years | 56 (10.2%) | 61 (11.0%) |
| 55 to 64 Years | 112 (16.5%) | 103 (14.7%) |
| 65 to 74 Years | 59 (12.2%) | 56 (10.3%) |
| 75 Years and over | 21 (5.7%) | 25 (5.9%) |
| Total | 638 (13.9%) | 842 (18.0%) |
Income Above Poverty by Sex and Age in Nowata County
According to the poverty statistics in Nowata County, males aged 5 years and females aged 75 years and over are the age groups that are most secure financially, with 97.9% of males and 94.1% of females in these age groups living above the poverty line.
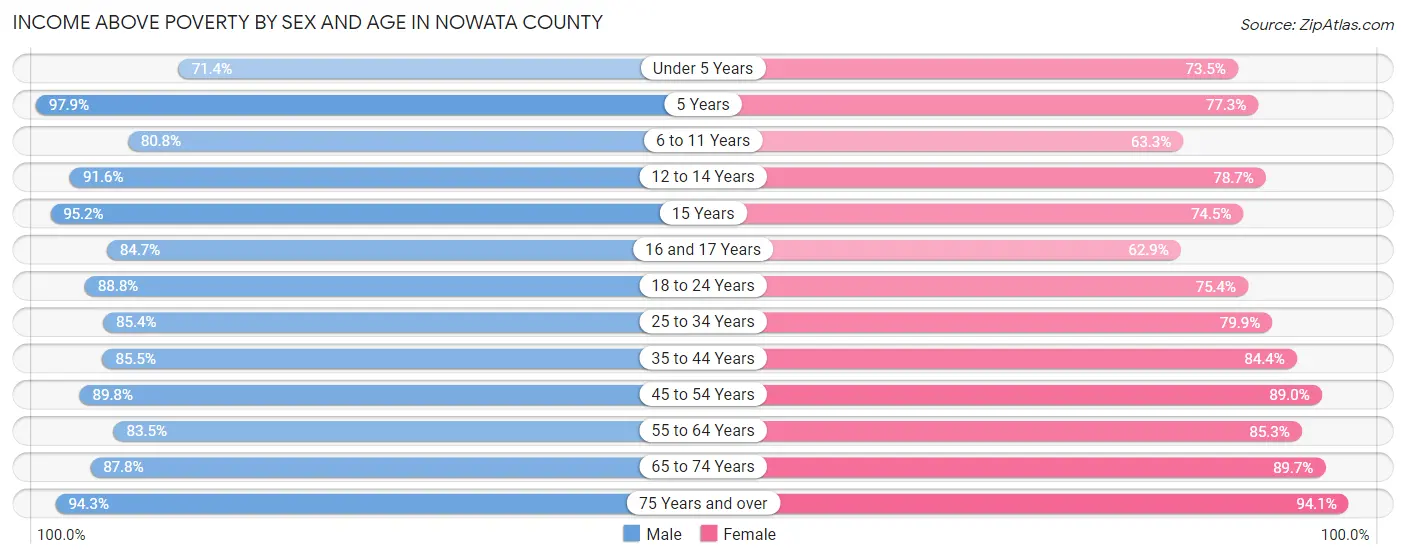
| Age Bracket | Male | Female |
| Under 5 Years | 222 (71.4%) | 216 (73.5%) |
| 5 Years | 94 (97.9%) | 17 (77.3%) |
| 6 to 11 Years | 270 (80.8%) | 247 (63.3%) |
| 12 to 14 Years | 130 (91.5%) | 129 (78.7%) |
| 15 Years | 20 (95.2%) | 38 (74.5%) |
| 16 and 17 Years | 122 (84.7%) | 83 (62.9%) |
| 18 to 24 Years | 349 (88.8%) | 266 (75.3%) |
| 25 to 34 Years | 439 (85.4%) | 416 (79.8%) |
| 35 to 44 Years | 478 (85.5%) | 444 (84.4%) |
| 45 to 54 Years | 492 (89.8%) | 495 (89.0%) |
| 55 to 64 Years | 565 (83.5%) | 599 (85.3%) |
| 65 to 74 Years | 425 (87.8%) | 489 (89.7%) |
| 75 Years and over | 345 (94.3%) | 396 (94.1%) |
| Total | 3,951 (86.1%) | 3,835 (82.0%) |
Income Below Poverty Among Married-Couple Families in Nowata County
The poverty statistics for married-couple families in Nowata County show that 7.0% or 136 of the total 1,949 families live below the poverty line. Families with 5 or more children have the highest poverty rate of 85.7%, comprising of 12 families. On the other hand, families with no children have the lowest poverty rate of 2.6%, which includes 31 families.
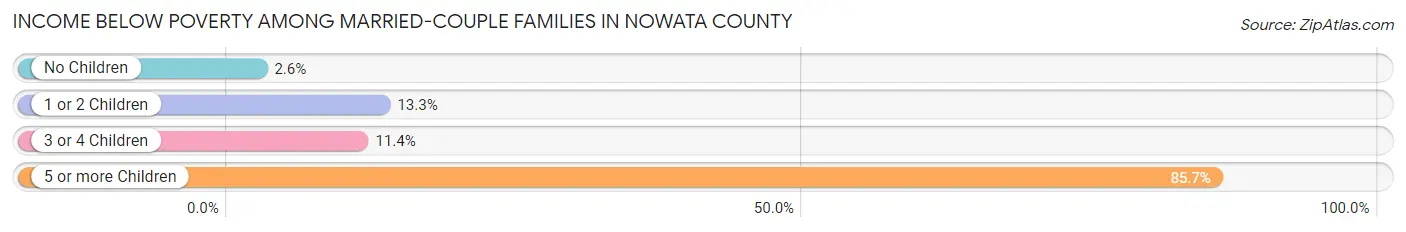
| Children | Above Poverty | Below Poverty |
| No Children | 1,178 (97.4%) | 31 (2.6%) |
| 1 or 2 Children | 477 (86.7%) | 73 (13.3%) |
| 3 or 4 Children | 156 (88.6%) | 20 (11.4%) |
| 5 or more Children | 2 (14.3%) | 12 (85.7%) |
| Total | 1,813 (93.0%) | 136 (7.0%) |
Income Below Poverty Among Single-Parent Households in Nowata County
According to the poverty data in Nowata County, 17.3% or 34 single-father households and 30.7% or 123 single-mother households are living below the poverty line. Among single-father households, those with 1 or 2 children have the highest poverty rate, with 21 households (23.9%) experiencing poverty. Likewise, among single-mother households, those with 5 or more children have the highest poverty rate, with 7 households (100.0%) falling below the poverty line.
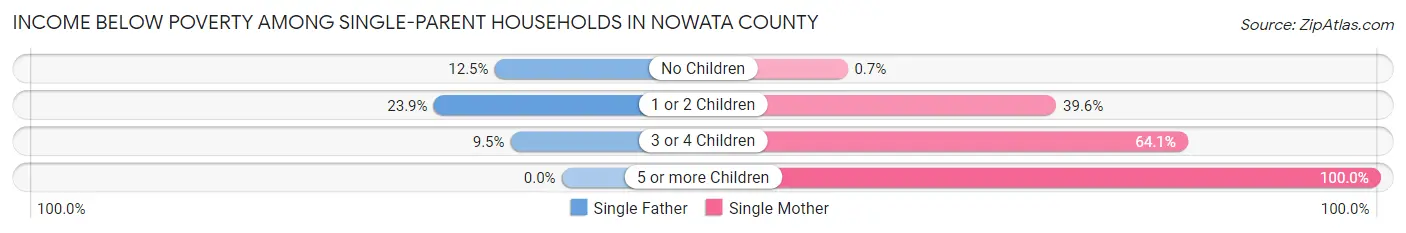
| Children | Single Father | Single Mother |
| No Children | 11 (12.5%) | 1 (0.7%) |
| 1 or 2 Children | 21 (23.9%) | 74 (39.6%) |
| 3 or 4 Children | 2 (9.5%) | 41 (64.1%) |
| 5 or more Children | 0 (0.0%) | 7 (100.0%) |
| Total | 34 (17.3%) | 123 (30.7%) |
Income Below Poverty Among Married-Couple vs Single-Parent Households in Nowata County
The poverty data for Nowata County shows that 136 of the married-couple family households (7.0%) and 157 of the single-parent households (26.3%) are living below the poverty level. Within the married-couple family households, those with 5 or more children have the highest poverty rate, with 12 households (85.7%) falling below the poverty line. Among the single-parent households, those with 5 or more children have the highest poverty rate, with 7 household (100.0%) living below poverty.
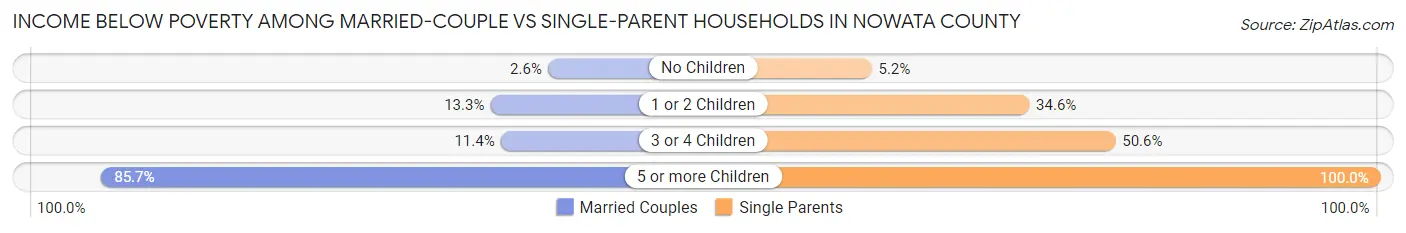
| Children | Married-Couple Families | Single-Parent Households |
| No Children | 31 (2.6%) | 12 (5.2%) |
| 1 or 2 Children | 73 (13.3%) | 95 (34.5%) |
| 3 or 4 Children | 20 (11.4%) | 43 (50.6%) |
| 5 or more Children | 12 (85.7%) | 7 (100.0%) |
| Total | 136 (7.0%) | 157 (26.3%) |
Employment Characteristics in Nowata County
Employment by Class of Employer in Nowata County
Among the 3,905 employed individuals in Nowata County, private company employees (2,641 | 67.6%), self-employed (not incorporated) (402 | 10.3%), and not-for-profit organizations (279 | 7.1%) make up the most common classes of employment.
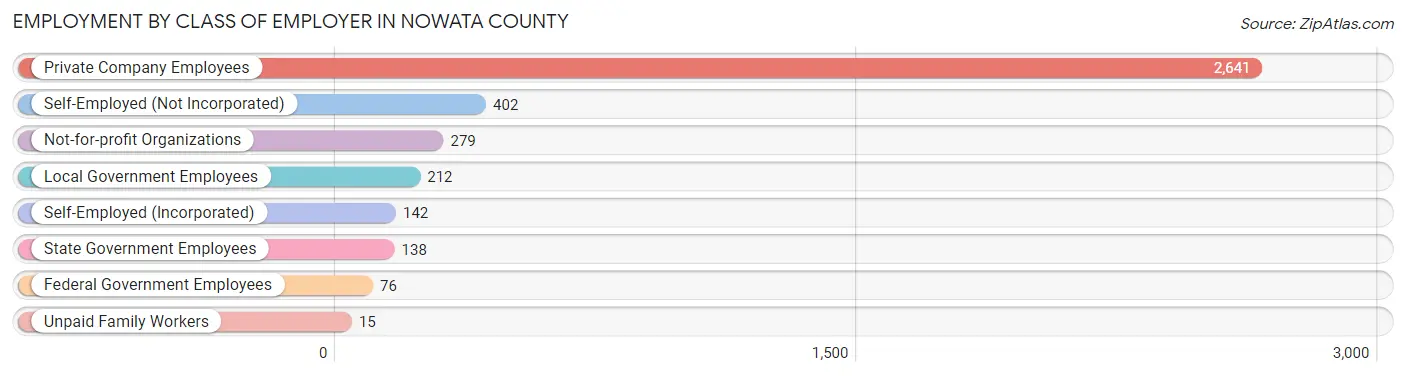
| Employer Class | # Employees | % Employees |
| Private Company Employees | 2,641 | 67.6% |
| Self-Employed (Incorporated) | 142 | 3.6% |
| Self-Employed (Not Incorporated) | 402 | 10.3% |
| Not-for-profit Organizations | 279 | 7.1% |
| Local Government Employees | 212 | 5.4% |
| State Government Employees | 138 | 3.5% |
| Federal Government Employees | 76 | 1.9% |
| Unpaid Family Workers | 15 | 0.4% |
| Total | 3,905 | 100.0% |
Employment Status by Age in Nowata County
According to the labor force statistics for Nowata County, out of the total population over 16 years of age (7,561), 55.2% or 4,174 individuals are in the labor force, with 4.3% or 179 of them unemployed. The age group with the highest labor force participation rate is 35 to 44 years, with 81.6% or 894 individuals in the labor force. Within the labor force, the 16 to 19 years age range has the highest percentage of unemployed individuals, with 12.9% or 18 of them being unemployed.
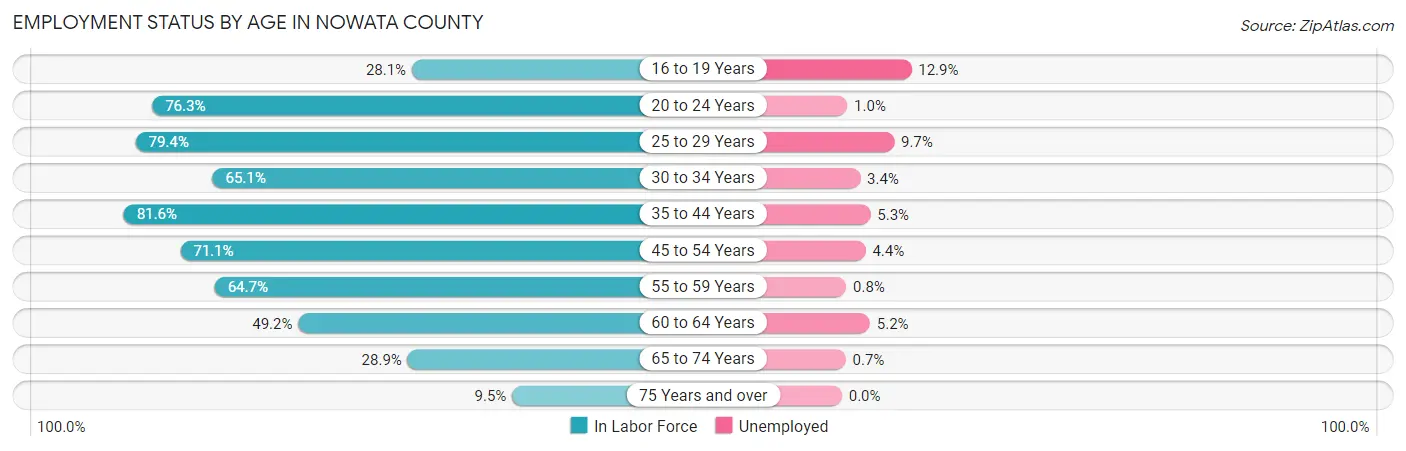
| Age Bracket | In Labor Force | Unemployed |
| 16 to 19 Years | 140 (28.1%) | 18 (12.9%) |
| 20 to 24 Years | 400 (76.3%) | 4 (1.0%) |
| 25 to 29 Years | 431 (79.4%) | 42 (9.7%) |
| 30 to 34 Years | 328 (65.1%) | 11 (3.4%) |
| 35 to 44 Years | 894 (81.6%) | 47 (5.3%) |
| 45 to 54 Years | 796 (71.1%) | 35 (4.4%) |
| 55 to 59 Years | 472 (64.7%) | 4 (0.8%) |
| 60 to 64 Years | 330 (49.2%) | 17 (5.2%) |
| 65 to 74 Years | 302 (28.9%) | 2 (0.7%) |
| 75 Years and over | 79 (9.5%) | 0 (0.0%) |
| Total | 4,174 (55.2%) | 179 (4.3%) |
Employment Status by Educational Attainment in Nowata County
According to labor force statistics for Nowata County, 69.7% of individuals (3,249) out of the total population between 25 and 64 years of age (4,662) are in the labor force, with 4.8% or 156 of them being unemployed. The group with the highest labor force participation rate are those with the educational attainment of bachelor's degree or higher, with 77.5% or 580 individuals in the labor force. Within the labor force, individuals with college / associate degree education have the highest percentage of unemployment, with 6.2% or 65 of them being unemployed.
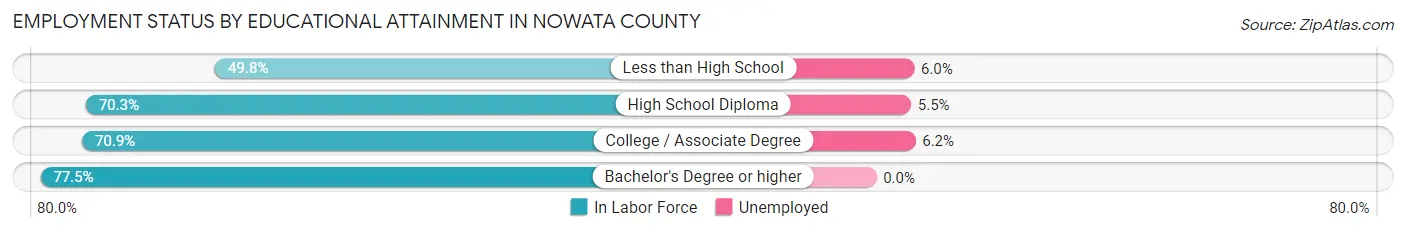
| Educational Attainment | In Labor Force | Unemployed |
| Less than High School | 218 (49.8%) | 26 (6.0%) |
| High School Diploma | 1,408 (70.3%) | 110 (5.5%) |
| College / Associate Degree | 1,044 (70.9%) | 91 (6.2%) |
| Bachelor's Degree or higher | 580 (77.5%) | 0 (0.0%) |
| Total | 3,249 (69.7%) | 224 (4.8%) |
Employment Occupations by Sex in Nowata County
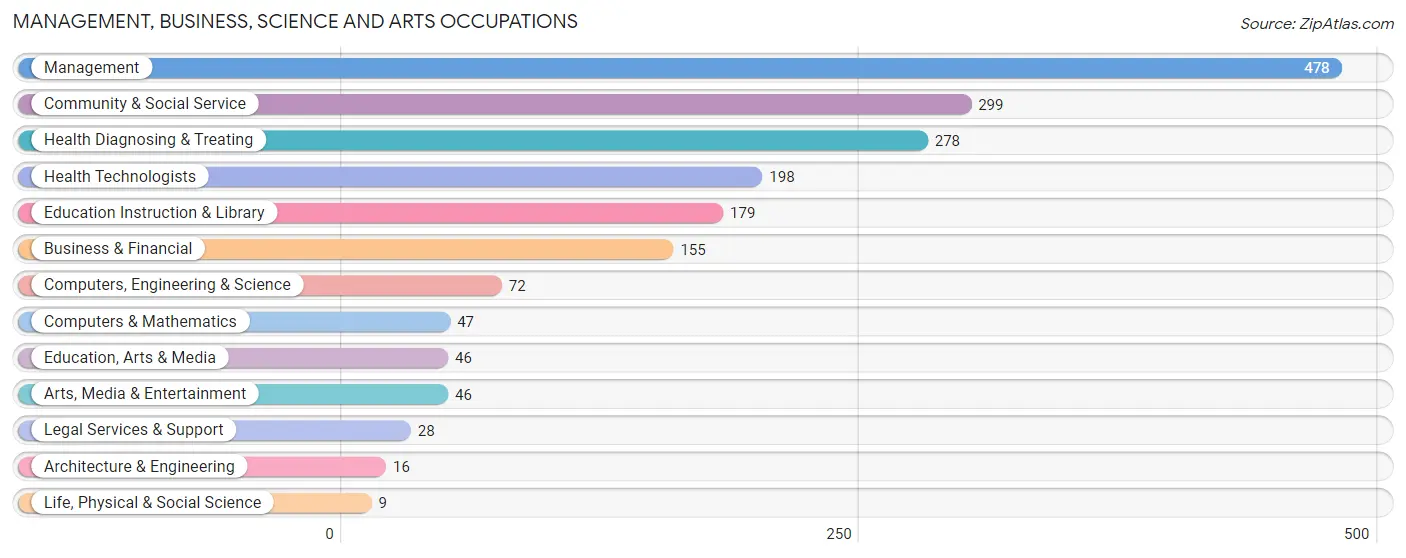
Management, Business, Science and Arts Occupations
The most common Management, Business, Science and Arts occupations in Nowata County are Management (478 | 12.0%), Community & Social Service (299 | 7.5%), Health Diagnosing & Treating (278 | 7.0%), Health Technologists (198 | 5.0%), and Education Instruction & Library (179 | 4.5%).
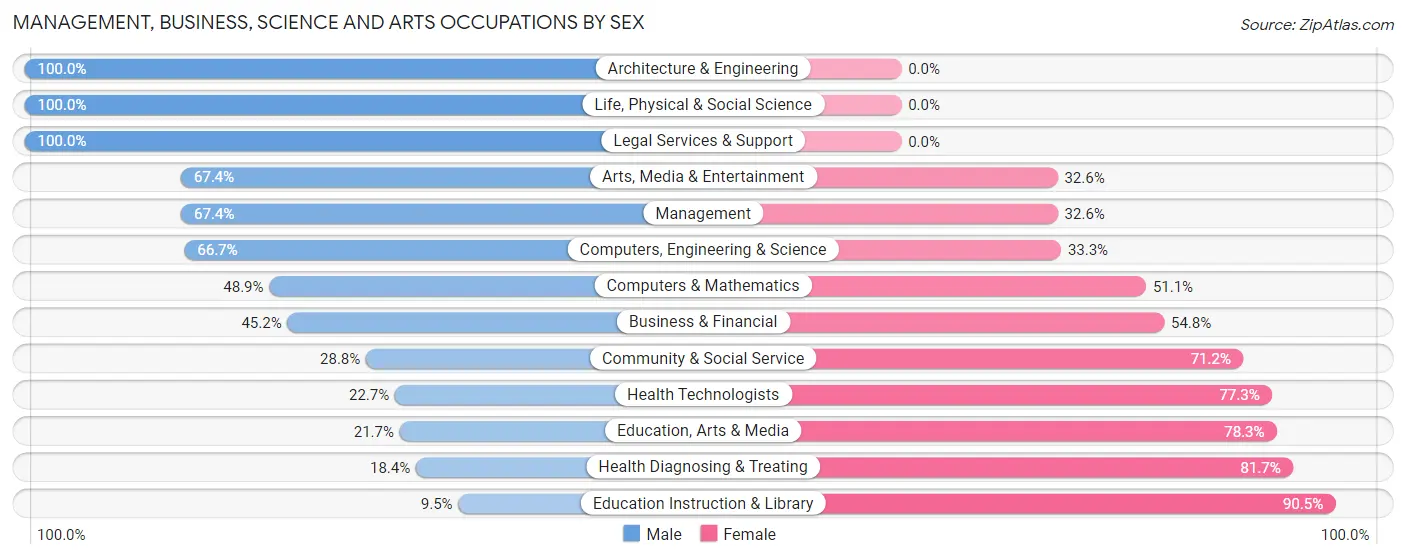
Management, Business, Science and Arts Occupations by Sex
Within the Management, Business, Science and Arts occupations in Nowata County, the most male-oriented occupations are Architecture & Engineering (100.0%), Life, Physical & Social Science (100.0%), and Legal Services & Support (100.0%), while the most female-oriented occupations are Education Instruction & Library (90.5%), Health Diagnosing & Treating (81.7%), and Education, Arts & Media (78.3%).
| Occupation | Male | Female |
| Management | 322 (67.4%) | 156 (32.6%) |
| Business & Financial | 70 (45.2%) | 85 (54.8%) |
| Computers, Engineering & Science | 48 (66.7%) | 24 (33.3%) |
| Computers & Mathematics | 23 (48.9%) | 24 (51.1%) |
| Architecture & Engineering | 16 (100.0%) | 0 (0.0%) |
| Life, Physical & Social Science | 9 (100.0%) | 0 (0.0%) |
| Community & Social Service | 86 (28.8%) | 213 (71.2%) |
| Education, Arts & Media | 10 (21.7%) | 36 (78.3%) |
| Legal Services & Support | 28 (100.0%) | 0 (0.0%) |
| Education Instruction & Library | 17 (9.5%) | 162 (90.5%) |
| Arts, Media & Entertainment | 31 (67.4%) | 15 (32.6%) |
| Health Diagnosing & Treating | 51 (18.3%) | 227 (81.7%) |
| Health Technologists | 45 (22.7%) | 153 (77.3%) |
| Total (Category) | 577 (45.0%) | 705 (55.0%) |
| Total (Overall) | 2,153 (54.0%) | 1,837 (46.0%) |
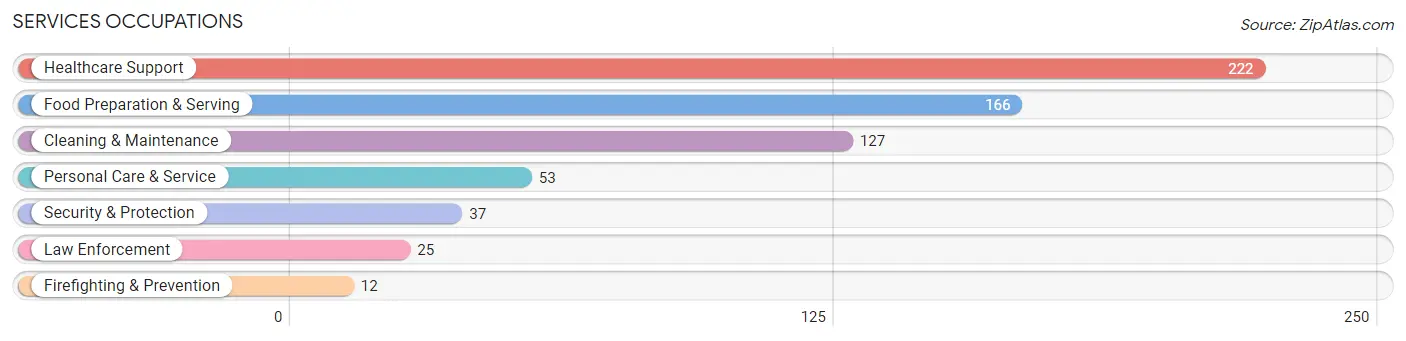
Services Occupations
The most common Services occupations in Nowata County are Healthcare Support (222 | 5.6%), Food Preparation & Serving (166 | 4.2%), Cleaning & Maintenance (127 | 3.2%), Personal Care & Service (53 | 1.3%), and Security & Protection (37 | 0.9%).
Services Occupations by Sex
Within the Services occupations in Nowata County, the most male-oriented occupations are Firefighting & Prevention (100.0%), Security & Protection (70.3%), and Cleaning & Maintenance (62.2%), while the most female-oriented occupations are Personal Care & Service (84.9%), Healthcare Support (76.6%), and Food Preparation & Serving (68.1%).
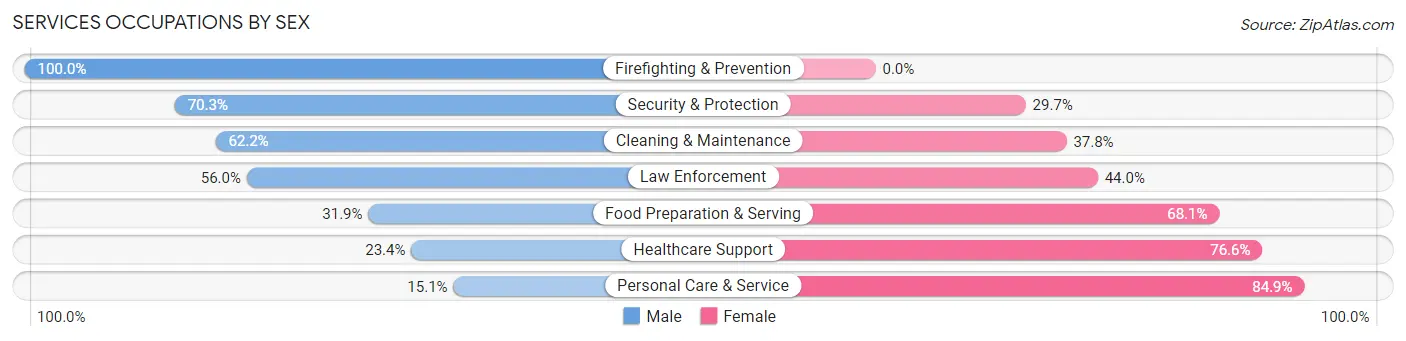
| Occupation | Male | Female |
| Healthcare Support | 52 (23.4%) | 170 (76.6%) |
| Security & Protection | 26 (70.3%) | 11 (29.7%) |
| Firefighting & Prevention | 12 (100.0%) | 0 (0.0%) |
| Law Enforcement | 14 (56.0%) | 11 (44.0%) |
| Food Preparation & Serving | 53 (31.9%) | 113 (68.1%) |
| Cleaning & Maintenance | 79 (62.2%) | 48 (37.8%) |
| Personal Care & Service | 8 (15.1%) | 45 (84.9%) |
| Total (Category) | 218 (36.0%) | 387 (64.0%) |
| Total (Overall) | 2,153 (54.0%) | 1,837 (46.0%) |
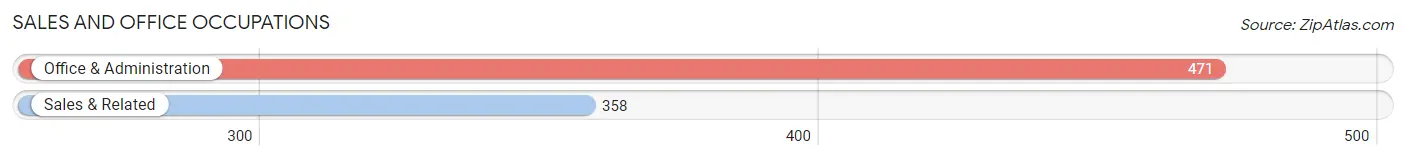
Sales and Office Occupations
The most common Sales and Office occupations in Nowata County are Office & Administration (471 | 11.8%), and Sales & Related (358 | 9.0%).
Sales and Office Occupations by Sex

| Occupation | Male | Female |
| Sales & Related | 114 (31.8%) | 244 (68.2%) |
| Office & Administration | 83 (17.6%) | 388 (82.4%) |
| Total (Category) | 197 (23.8%) | 632 (76.2%) |
| Total (Overall) | 2,153 (54.0%) | 1,837 (46.0%) |
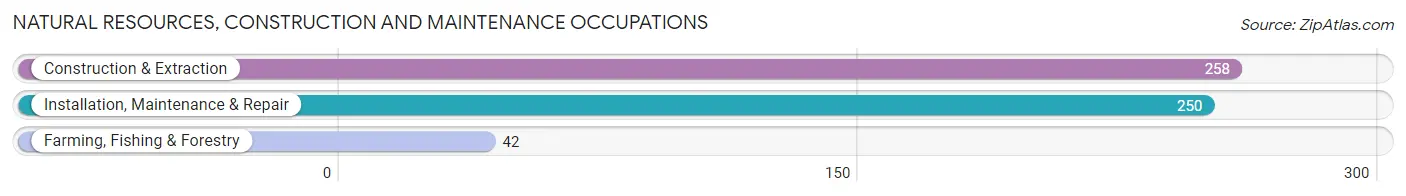
Natural Resources, Construction and Maintenance Occupations
The most common Natural Resources, Construction and Maintenance occupations in Nowata County are Construction & Extraction (258 | 6.5%), Installation, Maintenance & Repair (250 | 6.3%), and Farming, Fishing & Forestry (42 | 1.1%).
Natural Resources, Construction and Maintenance Occupations by Sex
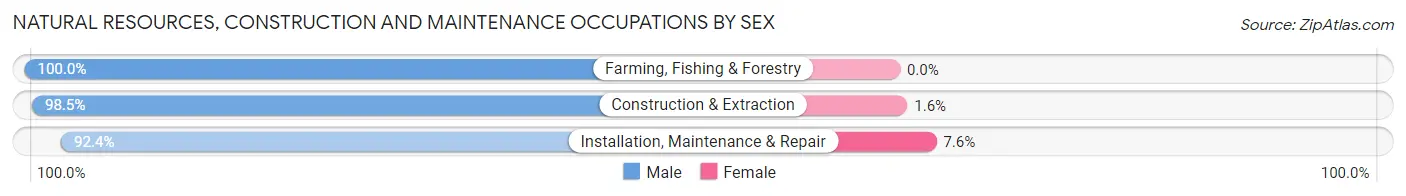
| Occupation | Male | Female |
| Farming, Fishing & Forestry | 42 (100.0%) | 0 (0.0%) |
| Construction & Extraction | 254 (98.5%) | 4 (1.5%) |
| Installation, Maintenance & Repair | 231 (92.4%) | 19 (7.6%) |
| Total (Category) | 527 (95.8%) | 23 (4.2%) |
| Total (Overall) | 2,153 (54.0%) | 1,837 (46.0%) |
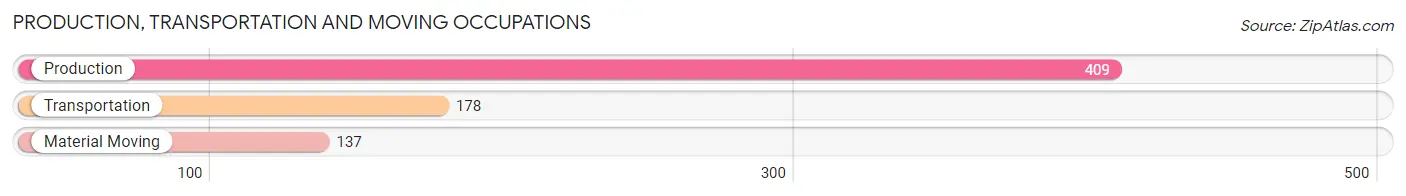
Production, Transportation and Moving Occupations
The most common Production, Transportation and Moving occupations in Nowata County are Production (409 | 10.2%), Transportation (178 | 4.5%), and Material Moving (137 | 3.4%).
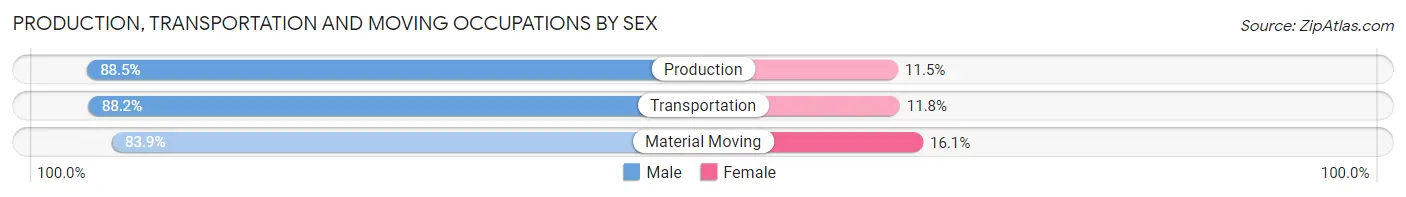
Production, Transportation and Moving Occupations by Sex
| Occupation | Male | Female |
| Production | 362 (88.5%) | 47 (11.5%) |
| Transportation | 157 (88.2%) | 21 (11.8%) |
| Material Moving | 115 (83.9%) | 22 (16.1%) |
| Total (Category) | 634 (87.6%) | 90 (12.4%) |
| Total (Overall) | 2,153 (54.0%) | 1,837 (46.0%) |
Employment Industries by Sex in Nowata County
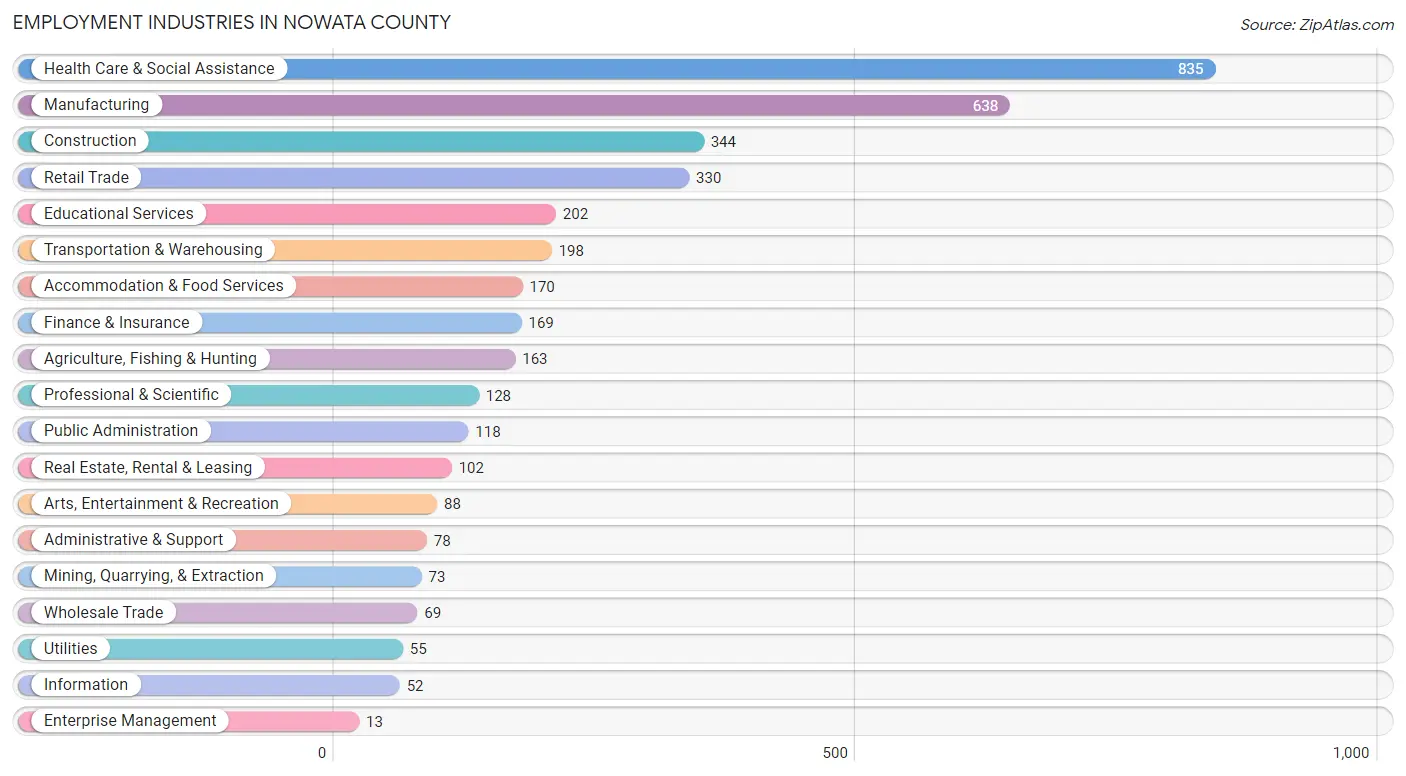
Employment Industries in Nowata County
The major employment industries in Nowata County include Health Care & Social Assistance (835 | 20.9%), Manufacturing (638 | 16.0%), Construction (344 | 8.6%), Retail Trade (330 | 8.3%), and Educational Services (202 | 5.1%).
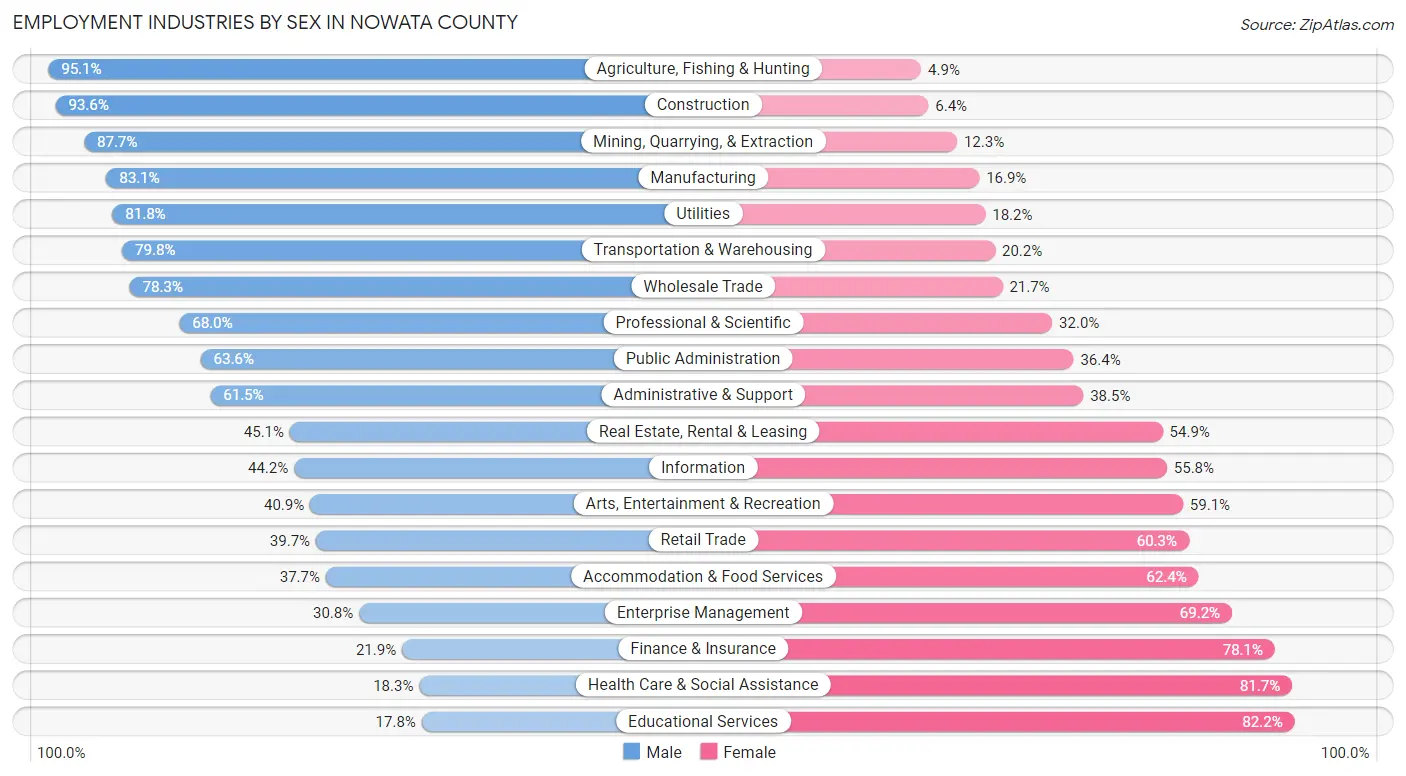
Employment Industries by Sex in Nowata County
The Nowata County industries that see more men than women are Agriculture, Fishing & Hunting (95.1%), Construction (93.6%), and Mining, Quarrying, & Extraction (87.7%), whereas the industries that tend to have a higher number of women are Educational Services (82.2%), Health Care & Social Assistance (81.7%), and Finance & Insurance (78.1%).
| Industry | Male | Female |
| Agriculture, Fishing & Hunting | 155 (95.1%) | 8 (4.9%) |
| Mining, Quarrying, & Extraction | 64 (87.7%) | 9 (12.3%) |
| Construction | 322 (93.6%) | 22 (6.4%) |
| Manufacturing | 530 (83.1%) | 108 (16.9%) |
| Wholesale Trade | 54 (78.3%) | 15 (21.7%) |
| Retail Trade | 131 (39.7%) | 199 (60.3%) |
| Transportation & Warehousing | 158 (79.8%) | 40 (20.2%) |
| Utilities | 45 (81.8%) | 10 (18.2%) |
| Information | 23 (44.2%) | 29 (55.8%) |
| Finance & Insurance | 37 (21.9%) | 132 (78.1%) |
| Real Estate, Rental & Leasing | 46 (45.1%) | 56 (54.9%) |
| Professional & Scientific | 87 (68.0%) | 41 (32.0%) |
| Enterprise Management | 4 (30.8%) | 9 (69.2%) |
| Administrative & Support | 48 (61.5%) | 30 (38.5%) |
| Educational Services | 36 (17.8%) | 166 (82.2%) |
| Health Care & Social Assistance | 153 (18.3%) | 682 (81.7%) |
| Arts, Entertainment & Recreation | 36 (40.9%) | 52 (59.1%) |
| Accommodation & Food Services | 64 (37.7%) | 106 (62.4%) |
| Public Administration | 75 (63.6%) | 43 (36.4%) |
| Total | 2,153 (54.0%) | 1,837 (46.0%) |
Education in Nowata County
School Enrollment in Nowata County
The most common levels of schooling among the 1,843 students in Nowata County are middle school (488 | 26.5%), elementary school (482 | 26.2%), and high school (398 | 21.6%).
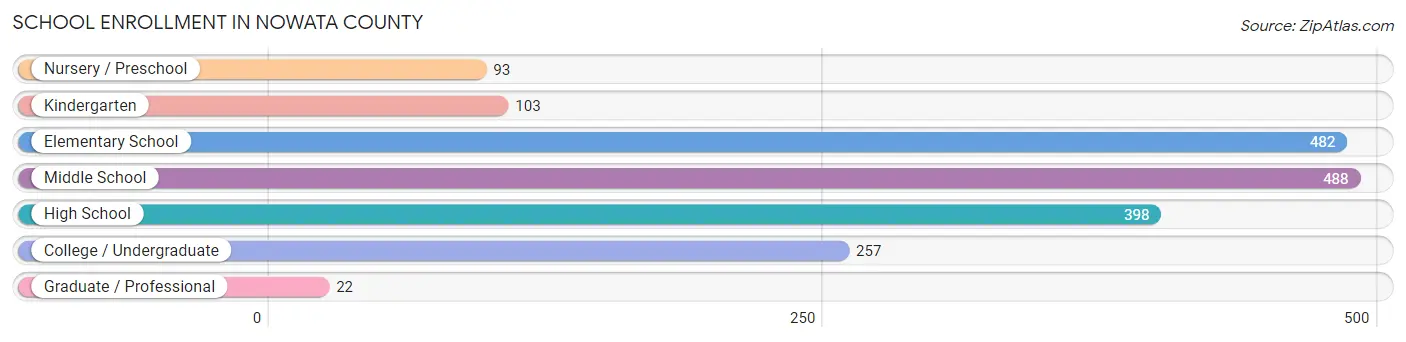
| School Level | # Students | % Students |
| Nursery / Preschool | 93 | 5.1% |
| Kindergarten | 103 | 5.6% |
| Elementary School | 482 | 26.2% |
| Middle School | 488 | 26.5% |
| High School | 398 | 21.6% |
| College / Undergraduate | 257 | 13.9% |
| Graduate / Professional | 22 | 1.2% |
| Total | 1,843 | 100.0% |
School Enrollment by Age by Funding Source in Nowata County
Out of a total of 1,843 students who are enrolled in schools in Nowata County, 133 (7.2%) attend a private institution, while the remaining 1,710 (92.8%) are enrolled in public schools. The age group of 25 to 34 year olds has the highest likelihood of being enrolled in private schools, with 5 (19.2% in the age bracket) enrolled. Conversely, the age group of 20 to 24 year olds has the lowest likelihood of being enrolled in a private school, with 152 (100.0% in the age bracket) attending a public institution.
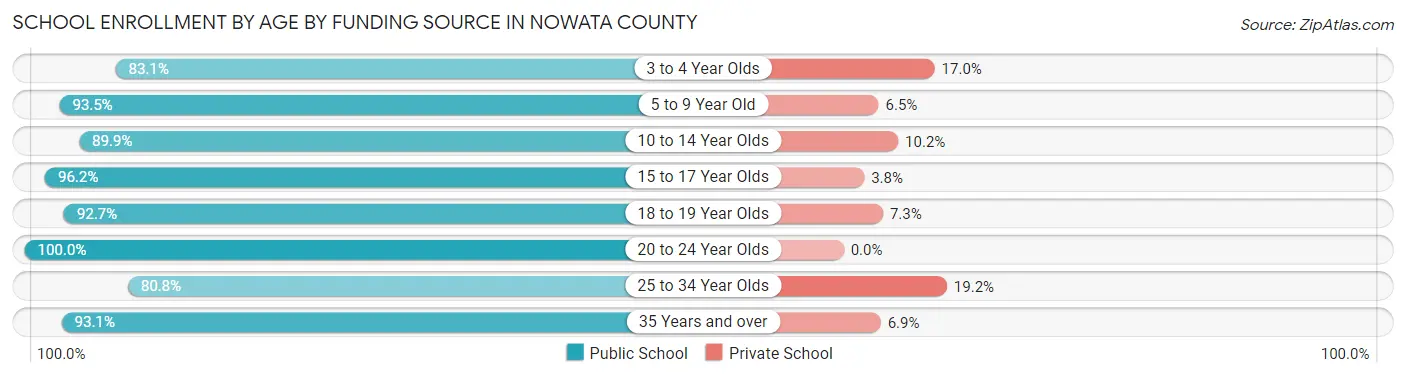
| Age Bracket | Public School | Private School |
| 3 to 4 Year Olds | 49 (83.1%) | 10 (17.0%) |
| 5 to 9 Year Old | 489 (93.5%) | 34 (6.5%) |
| 10 to 14 Year Olds | 531 (89.8%) | 60 (10.2%) |
| 15 to 17 Year Olds | 327 (96.2%) | 13 (3.8%) |
| 18 to 19 Year Olds | 114 (92.7%) | 9 (7.3%) |
| 20 to 24 Year Olds | 152 (100.0%) | 0 (0.0%) |
| 25 to 34 Year Olds | 21 (80.8%) | 5 (19.2%) |
| 35 Years and over | 27 (93.1%) | 2 (6.9%) |
| Total | 1,710 (92.8%) | 133 (7.2%) |
Educational Attainment by Field of Study in Nowata County
Business (292 | 25.7%), education (251 | 22.1%), science & technology (138 | 12.2%), bio, nature & agricultural (120 | 10.6%), and arts & humanities (82 | 7.2%) are the most common fields of study among 1,135 individuals in Nowata County who have obtained a bachelor's degree or higher.
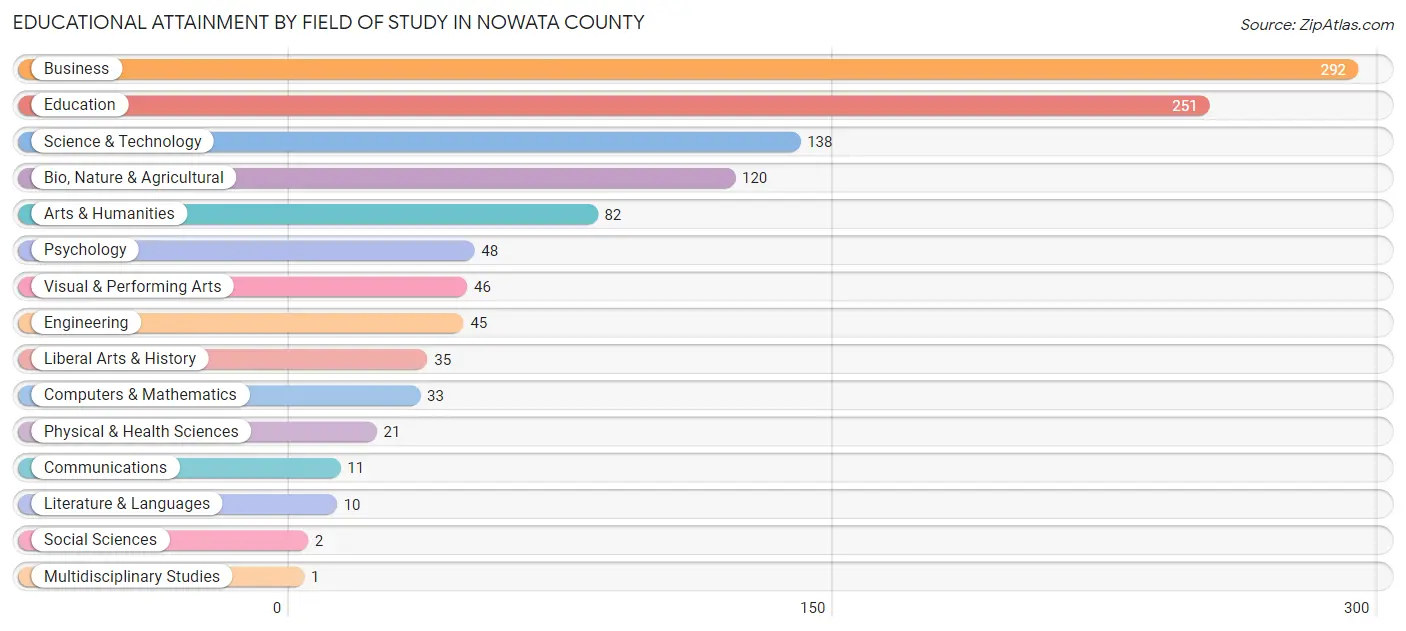
| Field of Study | # Graduates | % Graduates |
| Computers & Mathematics | 33 | 2.9% |
| Bio, Nature & Agricultural | 120 | 10.6% |
| Physical & Health Sciences | 21 | 1.8% |
| Psychology | 48 | 4.2% |
| Social Sciences | 2 | 0.2% |
| Engineering | 45 | 4.0% |
| Multidisciplinary Studies | 1 | 0.1% |
| Science & Technology | 138 | 12.2% |
| Business | 292 | 25.7% |
| Education | 251 | 22.1% |
| Literature & Languages | 10 | 0.9% |
| Liberal Arts & History | 35 | 3.1% |
| Visual & Performing Arts | 46 | 4.1% |
| Communications | 11 | 1.0% |
| Arts & Humanities | 82 | 7.2% |
| Total | 1,135 | 100.0% |
Transportation & Commute in Nowata County
Vehicle Availability by Sex in Nowata County
The most prevalent vehicle ownership categories in Nowata County are males with 2 vehicles (771, accounting for 36.7%) and females with 2 vehicles (604, making up 43.3%).
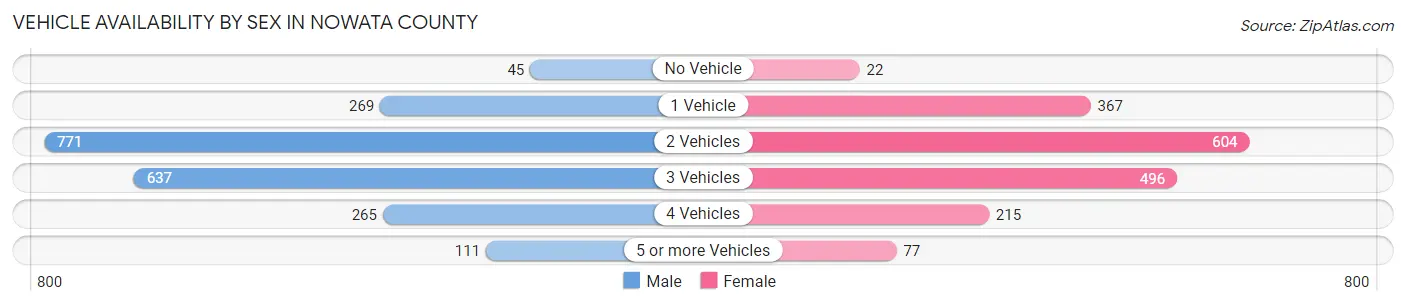
| Vehicles Available | Male | Female |
| No Vehicle | 45 (2.1%) | 22 (1.2%) |
| 1 Vehicle | 269 (12.8%) | 367 (20.6%) |
| 2 Vehicles | 771 (36.7%) | 604 (33.9%) |
| 3 Vehicles | 637 (30.4%) | 496 (27.9%) |
| 4 Vehicles | 265 (12.6%) | 215 (12.1%) |
| 5 or more Vehicles | 111 (5.3%) | 77 (4.3%) |
| Total | 2,098 (100.0%) | 1,781 (100.0%) |
Commute Time in Nowata County
The most frequently occuring commute durations in Nowata County are 30 to 34 minutes (588 commuters, 16.6%), 5 to 9 minutes (516 commuters, 14.6%), and 10 to 14 minutes (439 commuters, 12.4%).
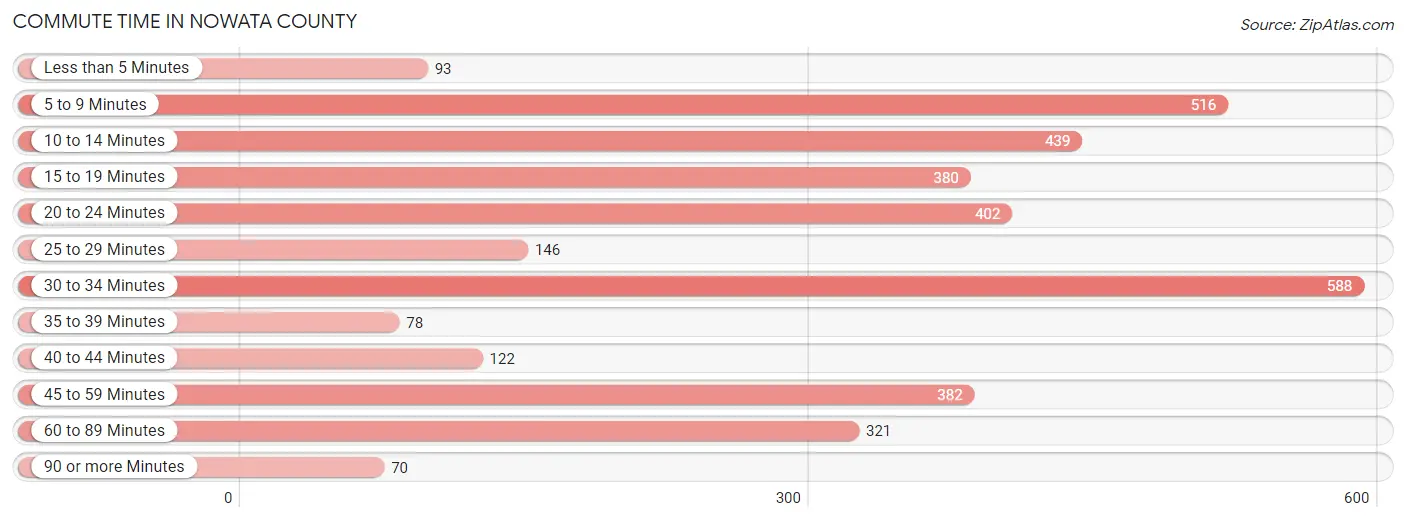
| Commute Time | # Commuters | % Commuters |
| Less than 5 Minutes | 93 | 2.6% |
| 5 to 9 Minutes | 516 | 14.6% |
| 10 to 14 Minutes | 439 | 12.4% |
| 15 to 19 Minutes | 380 | 10.7% |
| 20 to 24 Minutes | 402 | 11.4% |
| 25 to 29 Minutes | 146 | 4.1% |
| 30 to 34 Minutes | 588 | 16.6% |
| 35 to 39 Minutes | 78 | 2.2% |
| 40 to 44 Minutes | 122 | 3.5% |
| 45 to 59 Minutes | 382 | 10.8% |
| 60 to 89 Minutes | 321 | 9.1% |
| 90 or more Minutes | 70 | 2.0% |
Commute Time by Sex in Nowata County
The most common commute times in Nowata County are 60 to 89 minutes (257 commuters, 13.4%) for males and 30 to 34 minutes (332 commuters, 20.5%) for females.
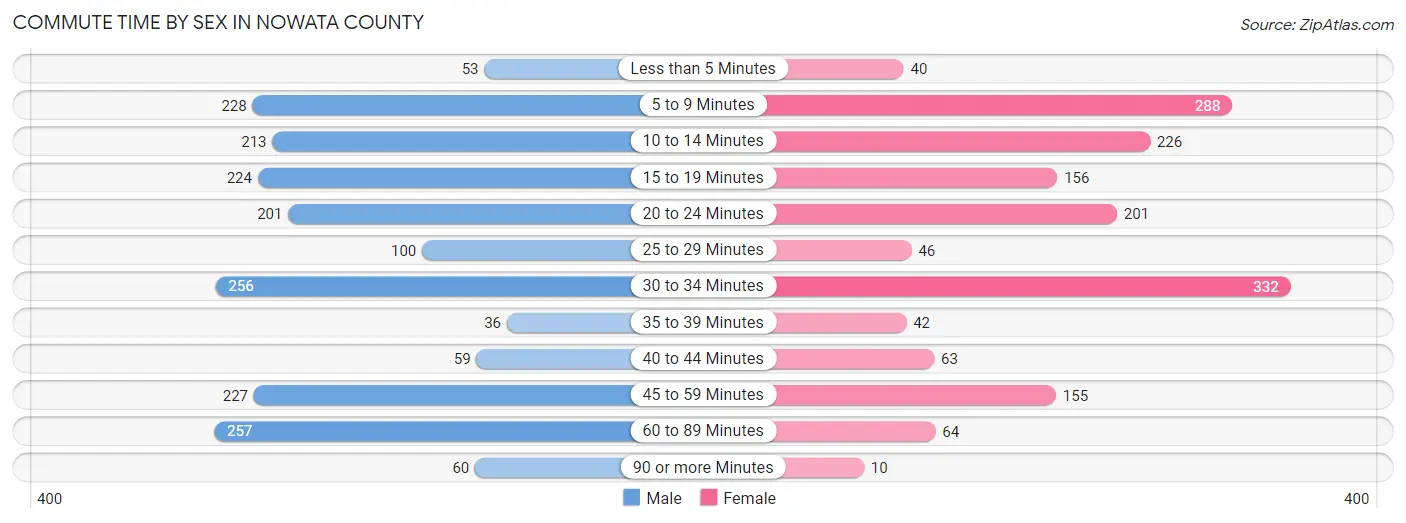
| Commute Time | Male | Female |
| Less than 5 Minutes | 53 (2.8%) | 40 (2.5%) |
| 5 to 9 Minutes | 228 (11.9%) | 288 (17.7%) |
| 10 to 14 Minutes | 213 (11.1%) | 226 (13.9%) |
| 15 to 19 Minutes | 224 (11.7%) | 156 (9.6%) |
| 20 to 24 Minutes | 201 (10.5%) | 201 (12.4%) |
| 25 to 29 Minutes | 100 (5.2%) | 46 (2.8%) |
| 30 to 34 Minutes | 256 (13.4%) | 332 (20.5%) |
| 35 to 39 Minutes | 36 (1.9%) | 42 (2.6%) |
| 40 to 44 Minutes | 59 (3.1%) | 63 (3.9%) |
| 45 to 59 Minutes | 227 (11.9%) | 155 (9.6%) |
| 60 to 89 Minutes | 257 (13.4%) | 64 (3.9%) |
| 90 or more Minutes | 60 (3.1%) | 10 (0.6%) |
Time of Departure to Work by Sex in Nowata County
The most frequent times of departure to work in Nowata County are 6:00 AM to 6:29 AM (320, 16.7%) for males and 7:30 AM to 7:59 AM (302, 18.6%) for females.
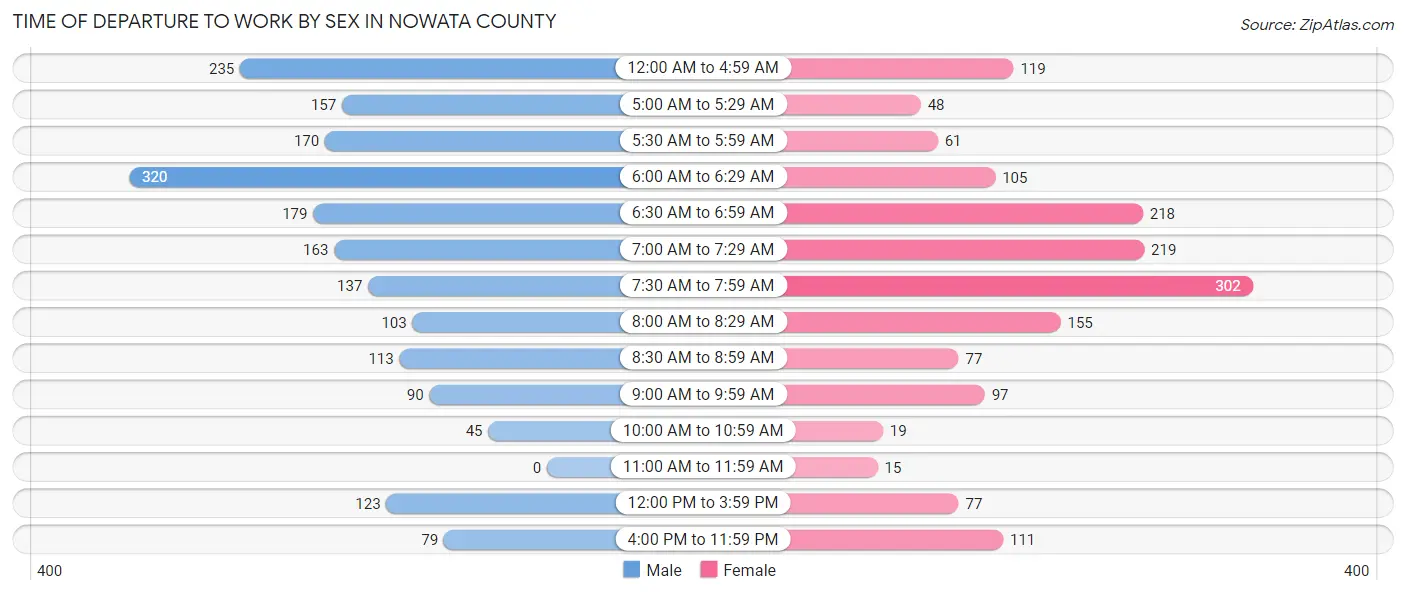
| Time of Departure | Male | Female |
| 12:00 AM to 4:59 AM | 235 (12.3%) | 119 (7.3%) |
| 5:00 AM to 5:29 AM | 157 (8.2%) | 48 (3.0%) |
| 5:30 AM to 5:59 AM | 170 (8.9%) | 61 (3.8%) |
| 6:00 AM to 6:29 AM | 320 (16.7%) | 105 (6.5%) |
| 6:30 AM to 6:59 AM | 179 (9.3%) | 218 (13.4%) |
| 7:00 AM to 7:29 AM | 163 (8.5%) | 219 (13.5%) |
| 7:30 AM to 7:59 AM | 137 (7.2%) | 302 (18.6%) |
| 8:00 AM to 8:29 AM | 103 (5.4%) | 155 (9.6%) |
| 8:30 AM to 8:59 AM | 113 (5.9%) | 77 (4.7%) |
| 9:00 AM to 9:59 AM | 90 (4.7%) | 97 (6.0%) |
| 10:00 AM to 10:59 AM | 45 (2.4%) | 19 (1.2%) |
| 11:00 AM to 11:59 AM | 0 (0.0%) | 15 (0.9%) |
| 12:00 PM to 3:59 PM | 123 (6.4%) | 77 (4.7%) |
| 4:00 PM to 11:59 PM | 79 (4.1%) | 111 (6.8%) |
| Total | 1,914 (100.0%) | 1,623 (100.0%) |
Housing Occupancy in Nowata County
Occupancy by Ownership in Nowata County
Of the total 3,701 dwellings in Nowata County, owner-occupied units account for 2,661 (71.9%), while renter-occupied units make up 1,040 (28.1%).
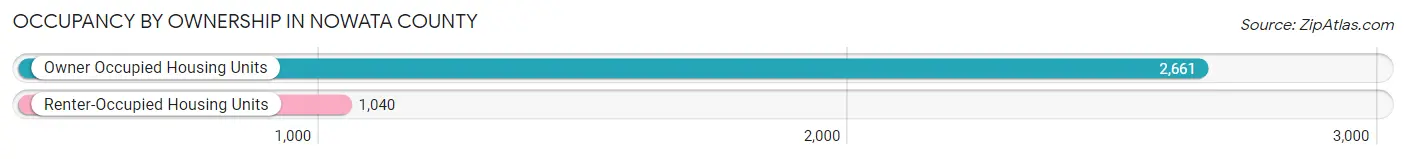
| Occupancy | # Housing Units | % Housing Units |
| Owner Occupied Housing Units | 2,661 | 71.9% |
| Renter-Occupied Housing Units | 1,040 | 28.1% |
| Total Occupied Housing Units | 3,701 | 100.0% |
Occupancy by Household Size in Nowata County
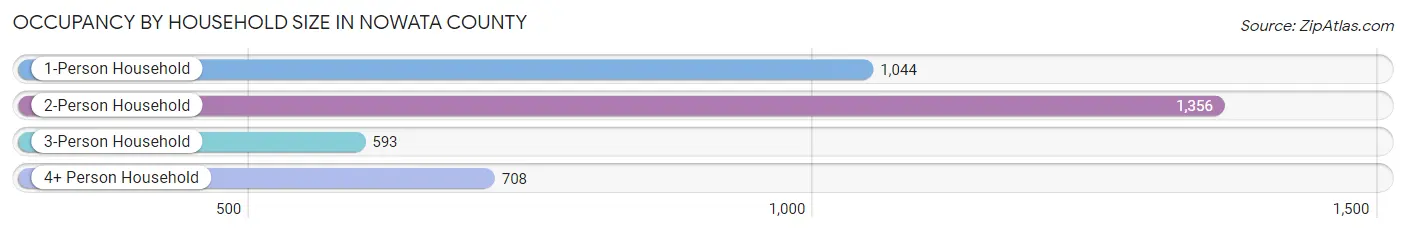
| Household Size | # Housing Units | % Housing Units |
| 1-Person Household | 1,044 | 28.2% |
| 2-Person Household | 1,356 | 36.6% |
| 3-Person Household | 593 | 16.0% |
| 4+ Person Household | 708 | 19.1% |
| Total Housing Units | 3,701 | 100.0% |
Occupancy by Ownership by Household Size in Nowata County
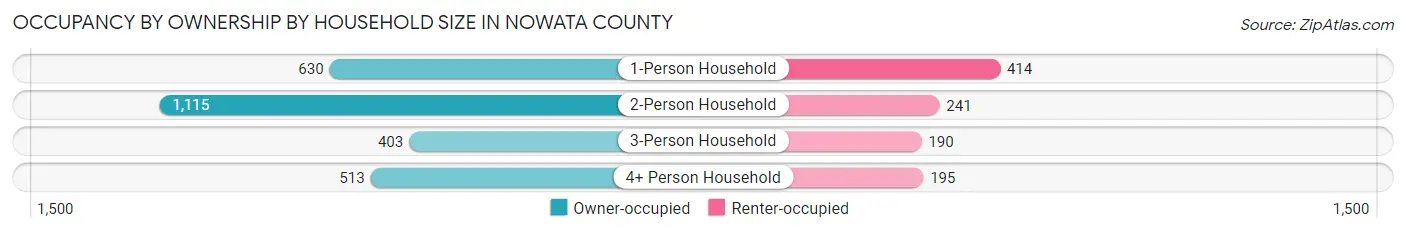
| Household Size | Owner-occupied | Renter-occupied |
| 1-Person Household | 630 (60.3%) | 414 (39.7%) |
| 2-Person Household | 1,115 (82.2%) | 241 (17.8%) |
| 3-Person Household | 403 (68.0%) | 190 (32.0%) |
| 4+ Person Household | 513 (72.5%) | 195 (27.5%) |
| Total Housing Units | 2,661 (71.9%) | 1,040 (28.1%) |
Occupancy by Educational Attainment in Nowata County
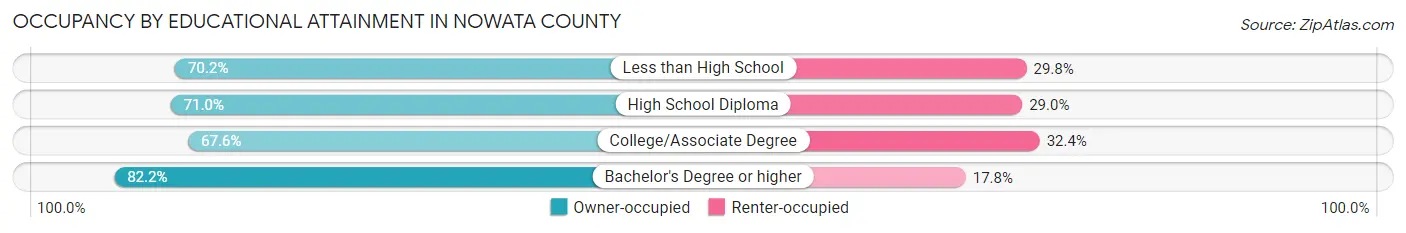
| Household Size | Owner-occupied | Renter-occupied |
| Less than High School | 240 (70.2%) | 102 (29.8%) |
| High School Diploma | 1,050 (71.0%) | 428 (29.0%) |
| College/Associate Degree | 811 (67.6%) | 389 (32.4%) |
| Bachelor's Degree or higher | 560 (82.2%) | 121 (17.8%) |
Occupancy by Age of Householder in Nowata County

| Age Bracket | # Households | % Households |
| Under 35 Years | 619 | 16.7% |
| 35 to 44 Years | 549 | 14.8% |
| 45 to 54 Years | 572 | 15.5% |
| 55 to 64 Years | 789 | 21.3% |
| 65 to 74 Years | 622 | 16.8% |
| 75 to 84 Years | 453 | 12.2% |
| 85 Years and Over | 97 | 2.6% |
| Total | 3,701 | 100.0% |
Housing Finances in Nowata County
Median Income by Occupancy in Nowata County
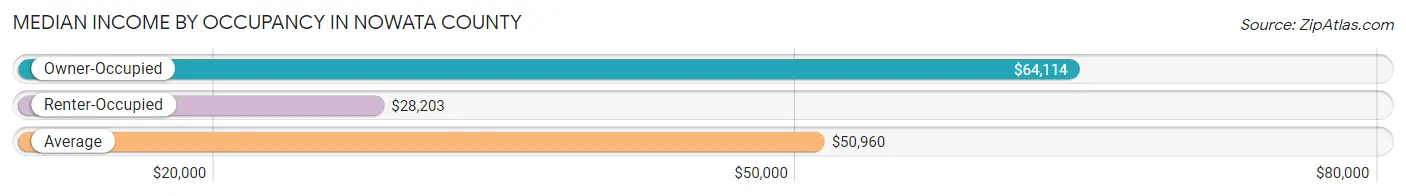
| Occupancy Type | # Households | Median Income |
| Owner-Occupied | 2,661 (71.9%) | $64,114 |
| Renter-Occupied | 1,040 (28.1%) | $28,203 |
| Average | 3,701 (100.0%) | $50,960 |
Occupancy by Householder Income Bracket in Nowata County

| Income Bracket | Owner-occupied | Renter-occupied |
| Less than $5,000 | 35 (1.3%) | 96 (9.2%) |
| $5,000 to $9,999 | 15 (0.6%) | 44 (4.2%) |
| $10,000 to $14,999 | 119 (4.5%) | 113 (10.9%) |
| $15,000 to $19,999 | 105 (4.0%) | 80 (7.7%) |
| $20,000 to $24,999 | 119 (4.5%) | 106 (10.2%) |
| $25,000 to $34,999 | 220 (8.3%) | 191 (18.4%) |
| $35,000 to $49,999 | 473 (17.8%) | 113 (10.9%) |
| $50,000 to $74,999 | 473 (17.8%) | 137 (13.2%) |
| $75,000 to $99,999 | 377 (14.2%) | 74 (7.1%) |
| $100,000 to $149,999 | 395 (14.8%) | 52 (5.0%) |
| $150,000 or more | 330 (12.4%) | 34 (3.3%) |
| Total | 2,661 (100.0%) | 1,040 (100.0%) |
Monthly Housing Cost Tiers in Nowata County
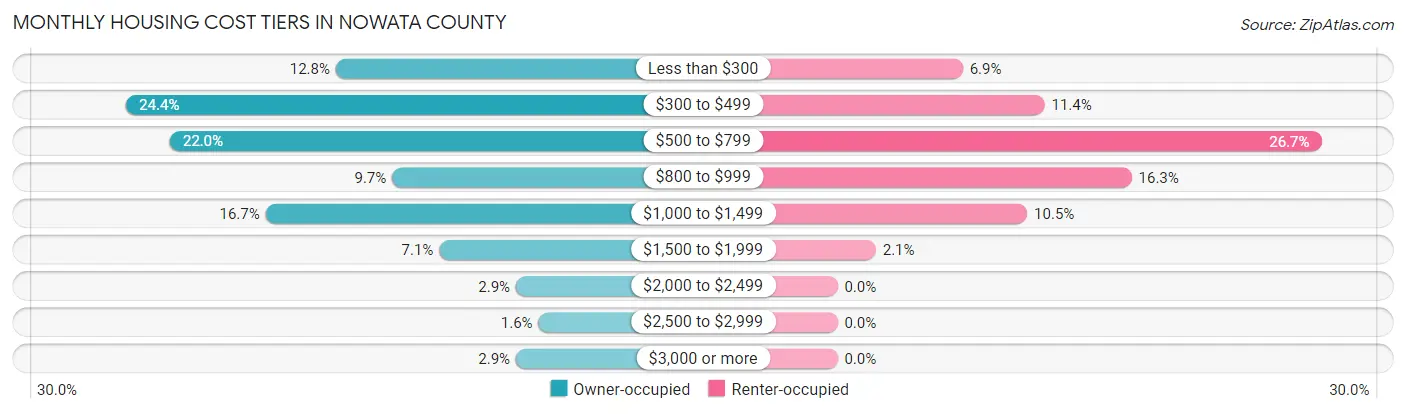
| Monthly Cost | Owner-occupied | Renter-occupied |
| Less than $300 | 341 (12.8%) | 72 (6.9%) |
| $300 to $499 | 649 (24.4%) | 119 (11.4%) |
| $500 to $799 | 585 (22.0%) | 278 (26.7%) |
| $800 to $999 | 258 (9.7%) | 169 (16.3%) |
| $1,000 to $1,499 | 444 (16.7%) | 109 (10.5%) |
| $1,500 to $1,999 | 189 (7.1%) | 22 (2.1%) |
| $2,000 to $2,499 | 76 (2.9%) | 0 (0.0%) |
| $2,500 to $2,999 | 43 (1.6%) | 0 (0.0%) |
| $3,000 or more | 76 (2.9%) | 0 (0.0%) |
| Total | 2,661 (100.0%) | 1,040 (100.0%) |
Physical Housing Characteristics in Nowata County
Housing Structures in Nowata County
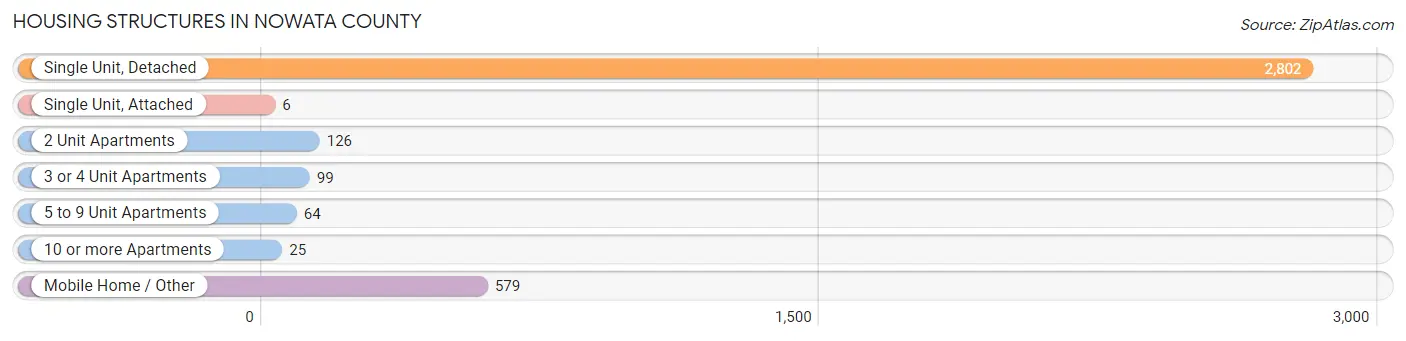
| Structure Type | # Housing Units | % Housing Units |
| Single Unit, Detached | 2,802 | 75.7% |
| Single Unit, Attached | 6 | 0.2% |
| 2 Unit Apartments | 126 | 3.4% |
| 3 or 4 Unit Apartments | 99 | 2.7% |
| 5 to 9 Unit Apartments | 64 | 1.7% |
| 10 or more Apartments | 25 | 0.7% |
| Mobile Home / Other | 579 | 15.6% |
| Total | 3,701 | 100.0% |
Housing Structures by Occupancy in Nowata County
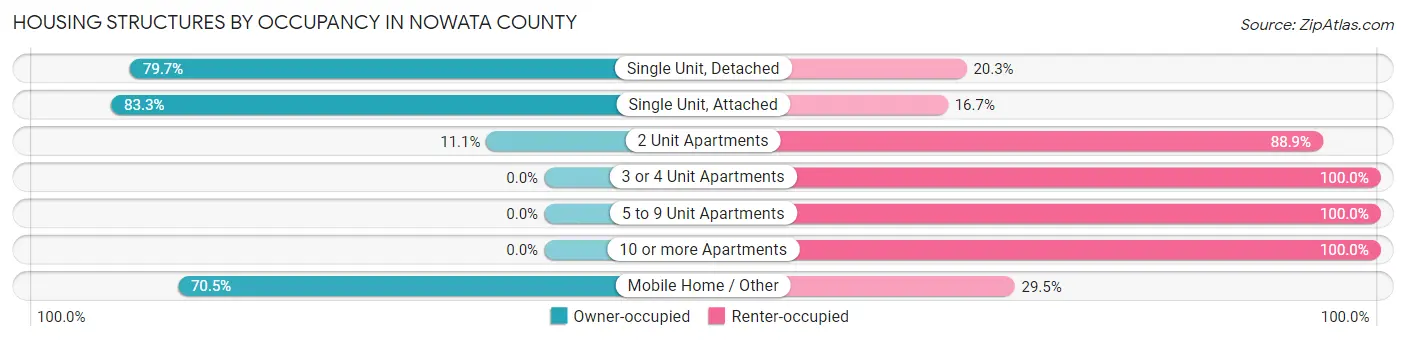
| Structure Type | Owner-occupied | Renter-occupied |
| Single Unit, Detached | 2,234 (79.7%) | 568 (20.3%) |
| Single Unit, Attached | 5 (83.3%) | 1 (16.7%) |
| 2 Unit Apartments | 14 (11.1%) | 112 (88.9%) |
| 3 or 4 Unit Apartments | 0 (0.0%) | 99 (100.0%) |
| 5 to 9 Unit Apartments | 0 (0.0%) | 64 (100.0%) |
| 10 or more Apartments | 0 (0.0%) | 25 (100.0%) |
| Mobile Home / Other | 408 (70.5%) | 171 (29.5%) |
| Total | 2,661 (71.9%) | 1,040 (28.1%) |
Housing Structures by Number of Rooms in Nowata County
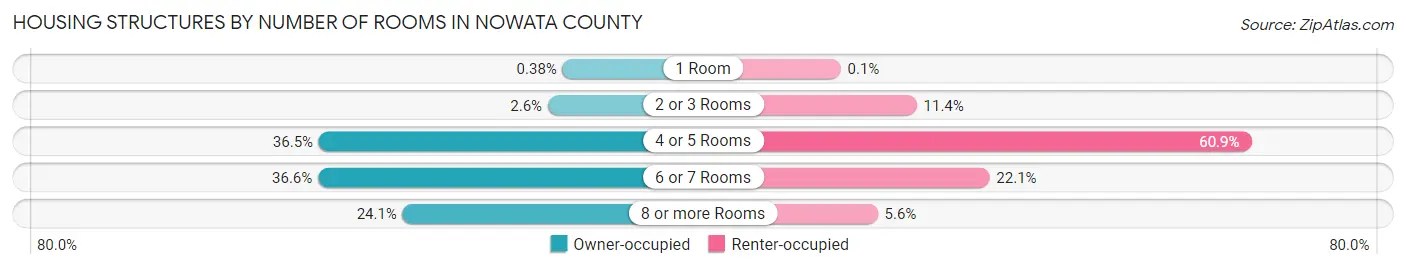
| Number of Rooms | Owner-occupied | Renter-occupied |
| 1 Room | 10 (0.4%) | 1 (0.1%) |
| 2 or 3 Rooms | 68 (2.6%) | 118 (11.4%) |
| 4 or 5 Rooms | 970 (36.4%) | 633 (60.9%) |
| 6 or 7 Rooms | 973 (36.6%) | 230 (22.1%) |
| 8 or more Rooms | 640 (24.0%) | 58 (5.6%) |
| Total | 2,661 (100.0%) | 1,040 (100.0%) |
Housing Structure by Heating Type in Nowata County
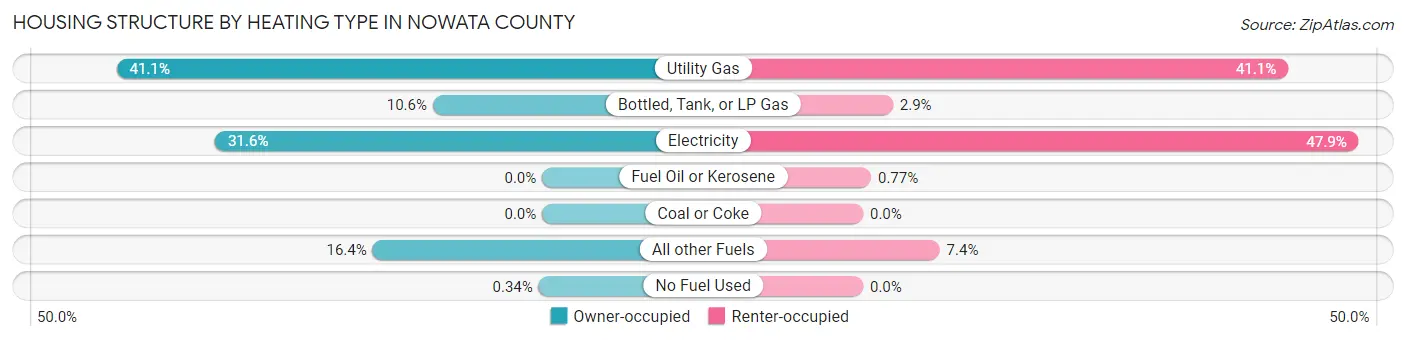
| Heating Type | Owner-occupied | Renter-occupied |
| Utility Gas | 1,094 (41.1%) | 427 (41.1%) |
| Bottled, Tank, or LP Gas | 281 (10.6%) | 30 (2.9%) |
| Electricity | 841 (31.6%) | 498 (47.9%) |
| Fuel Oil or Kerosene | 0 (0.0%) | 8 (0.8%) |
| Coal or Coke | 0 (0.0%) | 0 (0.0%) |
| All other Fuels | 436 (16.4%) | 77 (7.4%) |
| No Fuel Used | 9 (0.3%) | 0 (0.0%) |
| Total | 2,661 (100.0%) | 1,040 (100.0%) |
Household Vehicle Usage in Nowata County
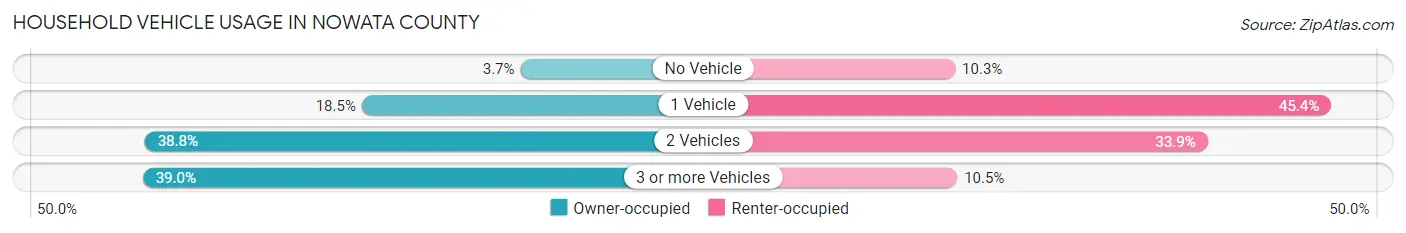
| Vehicles per Household | Owner-occupied | Renter-occupied |
| No Vehicle | 99 (3.7%) | 107 (10.3%) |
| 1 Vehicle | 493 (18.5%) | 472 (45.4%) |
| 2 Vehicles | 1,032 (38.8%) | 352 (33.9%) |
| 3 or more Vehicles | 1,037 (39.0%) | 109 (10.5%) |
| Total | 2,661 (100.0%) | 1,040 (100.0%) |
Real Estate & Mortgages in Nowata County
Real Estate and Mortgage Overview in Nowata County
| Characteristic | Without Mortgage | With Mortgage |
| Housing Units | 1,475 | 1,186 |
| Median Property Value | $94,400 | $140,500 |
| Median Household Income | $48,781 | $167 |
| Monthly Housing Costs | $414 | $76 |
| Real Estate Taxes | $632 | $78 |
Property Value by Mortgage Status in Nowata County
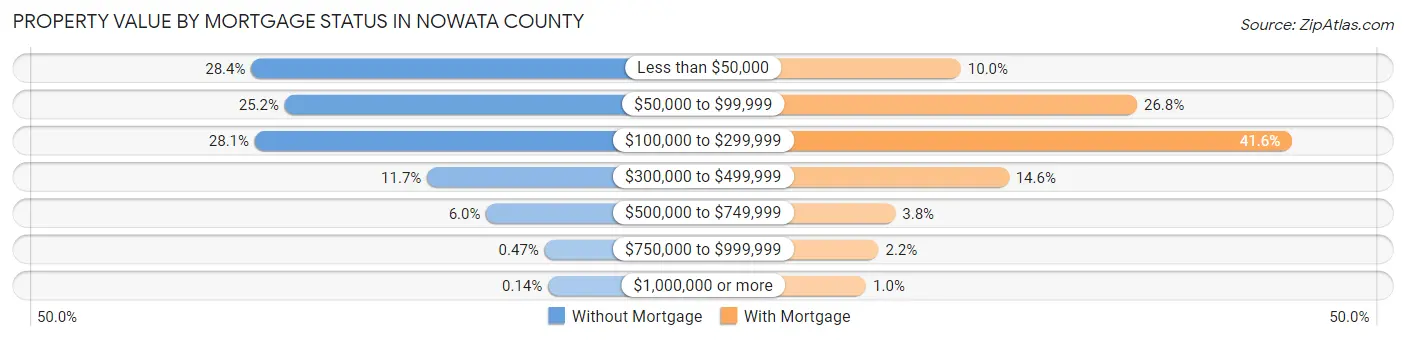
| Property Value | Without Mortgage | With Mortgage |
| Less than $50,000 | 419 (28.4%) | 119 (10.0%) |
| $50,000 to $99,999 | 372 (25.2%) | 318 (26.8%) |
| $100,000 to $299,999 | 414 (28.1%) | 493 (41.6%) |
| $300,000 to $499,999 | 172 (11.7%) | 173 (14.6%) |
| $500,000 to $749,999 | 89 (6.0%) | 45 (3.8%) |
| $750,000 to $999,999 | 7 (0.5%) | 26 (2.2%) |
| $1,000,000 or more | 2 (0.1%) | 12 (1.0%) |
| Total | 1,475 (100.0%) | 1,186 (100.0%) |
Household Income by Mortgage Status in Nowata County
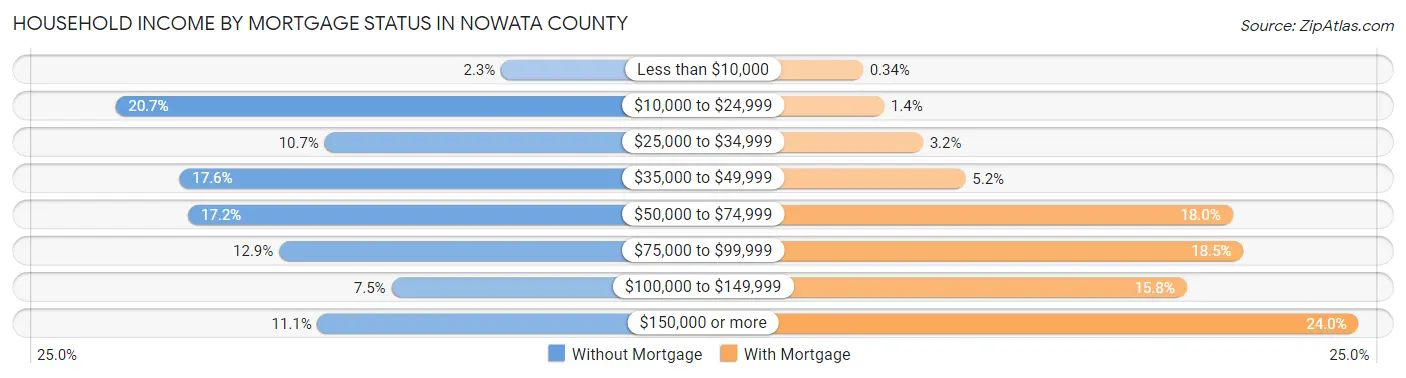
| Household Income | Without Mortgage | With Mortgage |
| Less than $10,000 | 34 (2.3%) | 4 (0.3%) |
| $10,000 to $24,999 | 305 (20.7%) | 16 (1.3%) |
| $25,000 to $34,999 | 158 (10.7%) | 38 (3.2%) |
| $35,000 to $49,999 | 260 (17.6%) | 62 (5.2%) |
| $50,000 to $74,999 | 254 (17.2%) | 213 (18.0%) |
| $75,000 to $99,999 | 190 (12.9%) | 219 (18.5%) |
| $100,000 to $149,999 | 111 (7.5%) | 187 (15.8%) |
| $150,000 or more | 163 (11.1%) | 284 (23.9%) |
| Total | 1,475 (100.0%) | 1,186 (100.0%) |
Property Value to Household Income Ratio in Nowata County
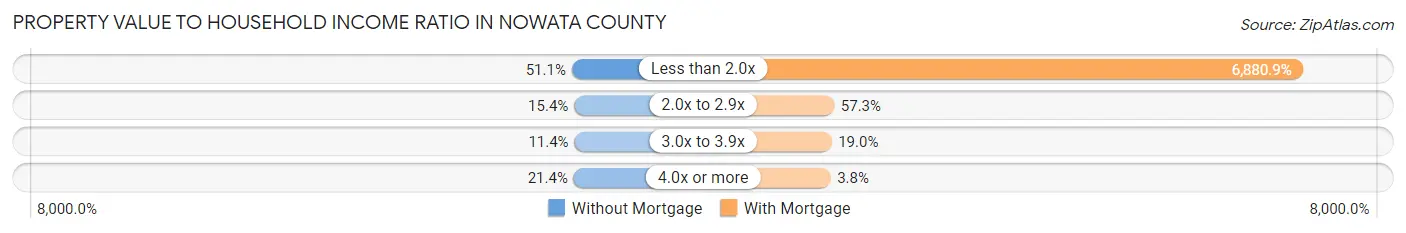
| Value-to-Income Ratio | Without Mortgage | With Mortgage |
| Less than 2.0x | 753 (51.0%) | 81,607 (6,880.9%) |
| 2.0x to 2.9x | 227 (15.4%) | 679 (57.3%) |
| 3.0x to 3.9x | 168 (11.4%) | 225 (19.0%) |
| 4.0x or more | 315 (21.4%) | 45 (3.8%) |
| Total | 1,475 (100.0%) | 1,186 (100.0%) |
Real Estate Taxes by Mortgage Status in Nowata County
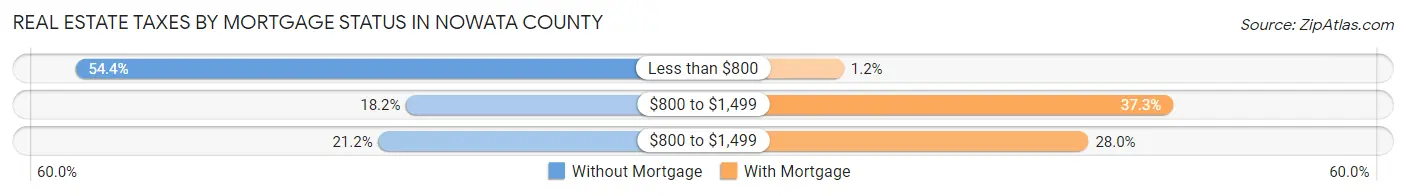
| Property Taxes | Without Mortgage | With Mortgage |
| Less than $800 | 803 (54.4%) | 14 (1.2%) |
| $800 to $1,499 | 268 (18.2%) | 442 (37.3%) |
| $800 to $1,499 | 313 (21.2%) | 332 (28.0%) |
| Total | 1,475 (100.0%) | 1,186 (100.0%) |
Health & Disability in Nowata County
Health Insurance Coverage by Age in Nowata County
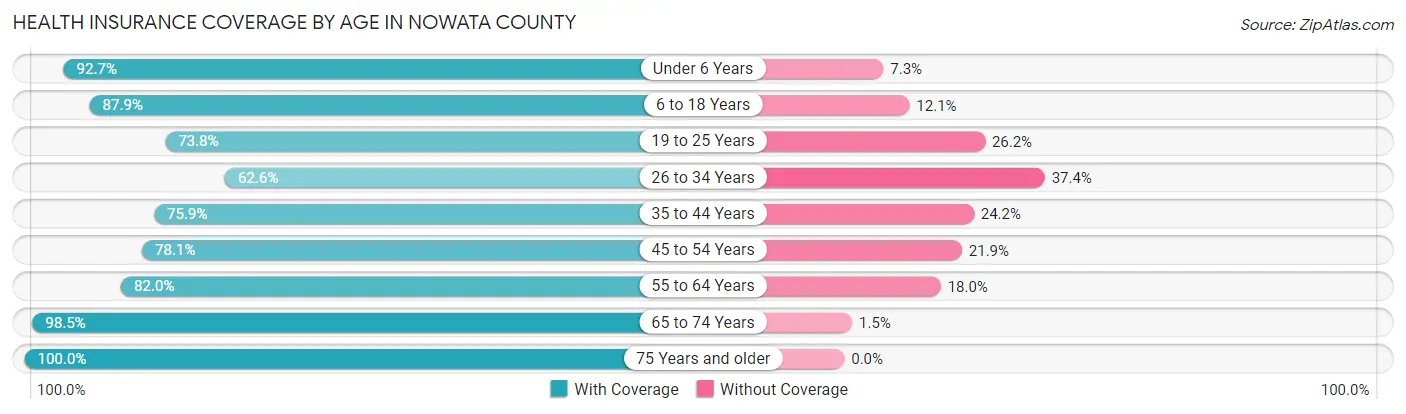
| Age Bracket | With Coverage | Without Coverage |
| Under 6 Years | 688 (92.7%) | 54 (7.3%) |
| 6 to 18 Years | 1,368 (87.9%) | 189 (12.1%) |
| 19 to 25 Years | 526 (73.8%) | 187 (26.2%) |
| 26 to 34 Years | 590 (62.6%) | 352 (37.4%) |
| 35 to 44 Years | 823 (75.8%) | 262 (24.1%) |
| 45 to 54 Years | 862 (78.1%) | 242 (21.9%) |
| 55 to 64 Years | 1,131 (82.0%) | 248 (18.0%) |
| 65 to 74 Years | 1,014 (98.5%) | 15 (1.5%) |
| 75 Years and older | 787 (100.0%) | 0 (0.0%) |
| Total | 7,789 (83.4%) | 1,549 (16.6%) |
Health Insurance Coverage by Citizenship Status in Nowata County
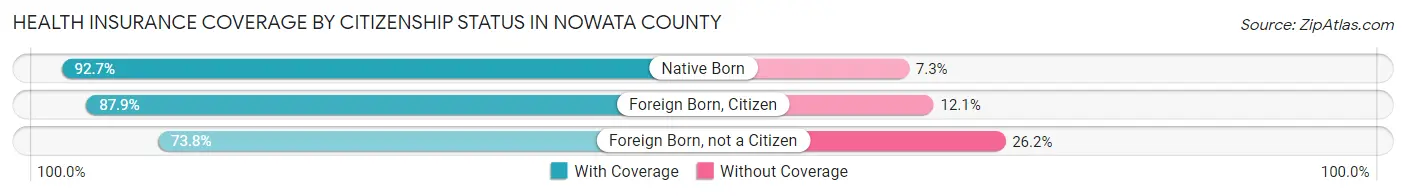
| Citizenship Status | With Coverage | Without Coverage |
| Native Born | 688 (92.7%) | 54 (7.3%) |
| Foreign Born, Citizen | 1,368 (87.9%) | 189 (12.1%) |
| Foreign Born, not a Citizen | 526 (73.8%) | 187 (26.2%) |
Health Insurance Coverage by Household Income in Nowata County

| Household Income | With Coverage | Without Coverage |
| Under $25,000 | 985 (72.2%) | 380 (27.8%) |
| $25,000 to $49,999 | 1,799 (77.9%) | 509 (22.1%) |
| $50,000 to $74,999 | 1,424 (83.1%) | 289 (16.9%) |
| $75,000 to $99,999 | 1,113 (88.0%) | 151 (11.9%) |
| $100,000 and over | 2,401 (91.6%) | 220 (8.4%) |
Public vs Private Health Insurance Coverage by Age in Nowata County
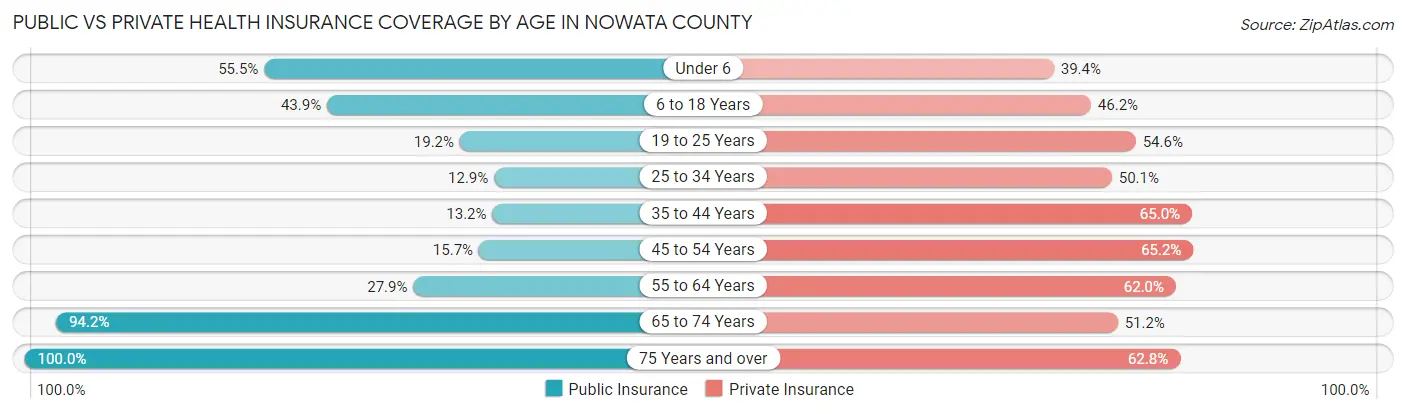
| Age Bracket | Public Insurance | Private Insurance |
| Under 6 | 412 (55.5%) | 292 (39.4%) |
| 6 to 18 Years | 683 (43.9%) | 720 (46.2%) |
| 19 to 25 Years | 137 (19.2%) | 389 (54.6%) |
| 25 to 34 Years | 121 (12.9%) | 472 (50.1%) |
| 35 to 44 Years | 143 (13.2%) | 705 (65.0%) |
| 45 to 54 Years | 173 (15.7%) | 720 (65.2%) |
| 55 to 64 Years | 384 (27.9%) | 855 (62.0%) |
| 65 to 74 Years | 969 (94.2%) | 527 (51.2%) |
| 75 Years and over | 787 (100.0%) | 494 (62.8%) |
| Total | 3,809 (40.8%) | 5,174 (55.4%) |
Disability Status by Sex by Age in Nowata County

| Age Bracket | Male | Female |
| Under 5 Years | 1 (0.3%) | 0 (0.0%) |
| 5 to 17 Years | 6 (0.8%) | 14 (1.8%) |
| 18 to 34 Years | 83 (9.2%) | 78 (8.9%) |
| 35 to 64 Years | 372 (20.8%) | 335 (18.8%) |
| 65 to 74 Years | 223 (46.1%) | 150 (27.5%) |
| 75 Years and over | 211 (57.7%) | 265 (62.9%) |
Disability Class by Sex by Age in Nowata County
Disability Class: Hearing Difficulty

| Age Bracket | Male | Female |
| Under 5 Years | 0 (0.0%) | 0 (0.0%) |
| 5 to 17 Years | 0 (0.0%) | 4 (0.5%) |
| 18 to 34 Years | 21 (2.3%) | 4 (0.5%) |
| 35 to 64 Years | 168 (9.4%) | 74 (4.2%) |
| 65 to 74 Years | 150 (31.0%) | 62 (11.4%) |
| 75 Years and over | 131 (35.8%) | 134 (31.8%) |
Disability Class: Vision Difficulty

| Age Bracket | Male | Female |
| Under 5 Years | 1 (0.3%) | 0 (0.0%) |
| 5 to 17 Years | 3 (0.4%) | 3 (0.4%) |
| 18 to 34 Years | 5 (0.5%) | 34 (3.9%) |
| 35 to 64 Years | 39 (2.2%) | 57 (3.2%) |
| 65 to 74 Years | 52 (10.7%) | 34 (6.2%) |
| 75 Years and over | 50 (13.7%) | 61 (14.5%) |
Disability Class: Cognitive Difficulty
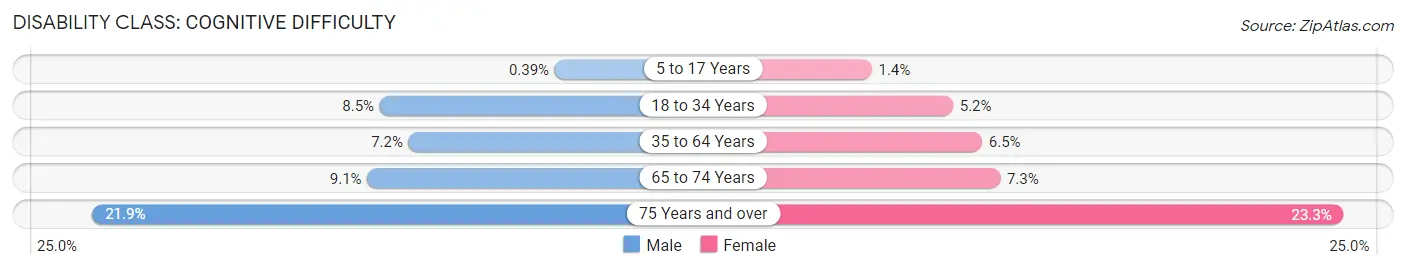
| Age Bracket | Male | Female |
| 5 to 17 Years | 3 (0.4%) | 11 (1.4%) |
| 18 to 34 Years | 77 (8.5%) | 45 (5.1%) |
| 35 to 64 Years | 128 (7.2%) | 116 (6.5%) |
| 65 to 74 Years | 44 (9.1%) | 40 (7.3%) |
| 75 Years and over | 80 (21.9%) | 98 (23.3%) |
Disability Class: Ambulatory Difficulty
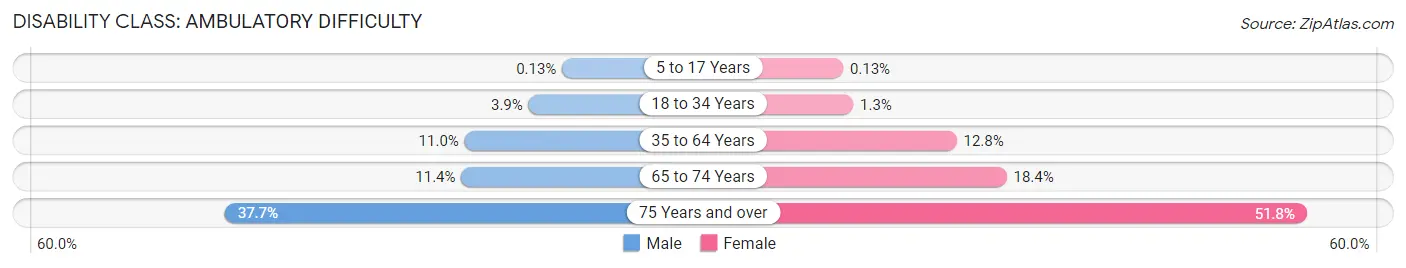
| Age Bracket | Male | Female |
| 5 to 17 Years | 1 (0.1%) | 1 (0.1%) |
| 18 to 34 Years | 35 (3.9%) | 11 (1.3%) |
| 35 to 64 Years | 196 (11.0%) | 228 (12.8%) |
| 65 to 74 Years | 55 (11.4%) | 100 (18.3%) |
| 75 Years and over | 138 (37.7%) | 218 (51.8%) |
Disability Class: Self-Care Difficulty
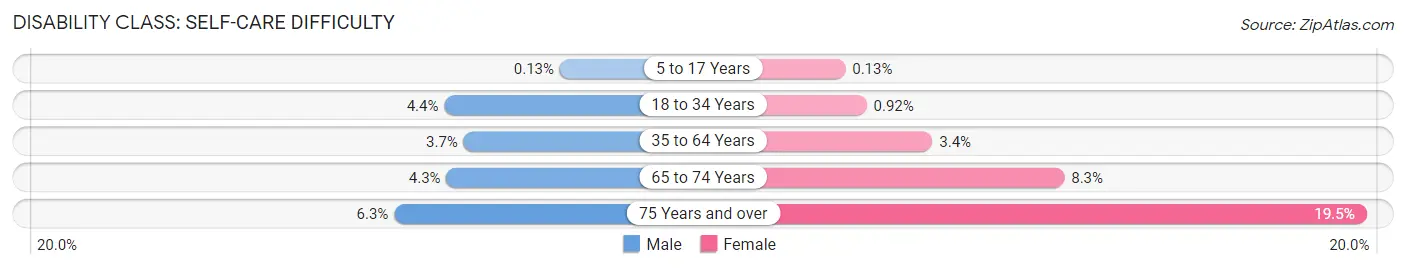
| Age Bracket | Male | Female |
| 5 to 17 Years | 1 (0.1%) | 1 (0.1%) |
| 18 to 34 Years | 40 (4.4%) | 8 (0.9%) |
| 35 to 64 Years | 66 (3.7%) | 60 (3.4%) |
| 65 to 74 Years | 21 (4.3%) | 45 (8.3%) |
| 75 Years and over | 23 (6.3%) | 82 (19.5%) |
Technology Access in Nowata County
Computing Device Access in Nowata County
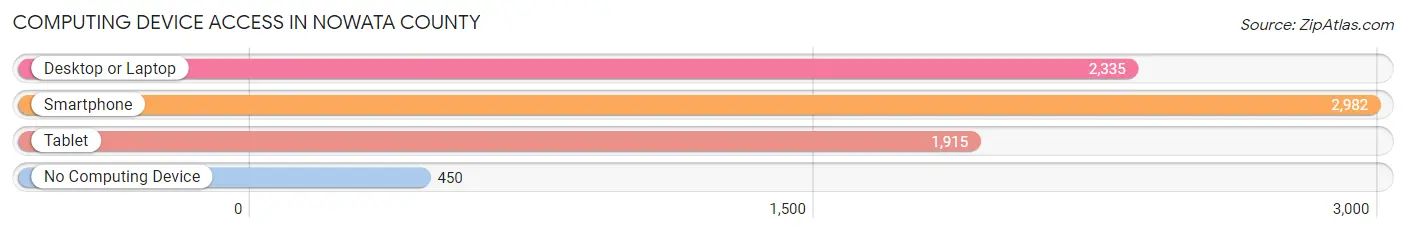
| Device Type | # Households | % Households |
| Desktop or Laptop | 2,335 | 63.1% |
| Smartphone | 2,982 | 80.6% |
| Tablet | 1,915 | 51.7% |
| No Computing Device | 450 | 12.2% |
| Total | 3,701 | 100.0% |
Internet Access in Nowata County
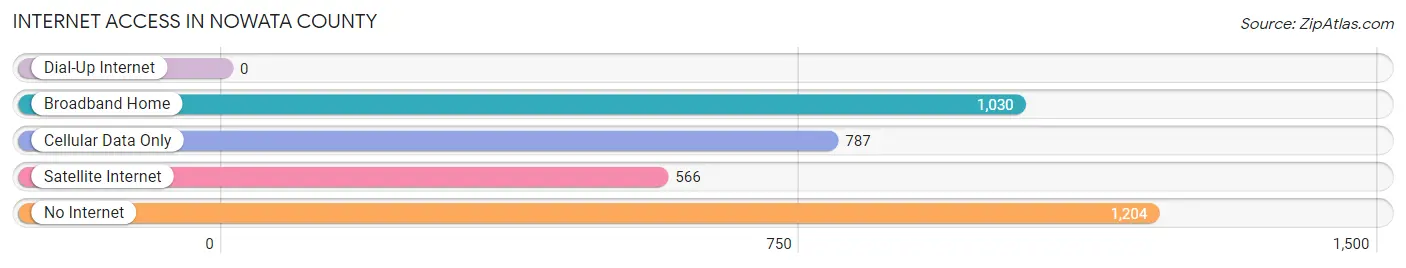
| Internet Type | # Households | % Households |
| Dial-Up Internet | 0 | 0.0% |
| Broadband Home | 1,030 | 27.8% |
| Cellular Data Only | 787 | 21.3% |
| Satellite Internet | 566 | 15.3% |
| No Internet | 1,204 | 32.5% |
| Total | 3,701 | 100.0% |
Nowata County Summary
Nowata County is located in the northeastern corner of Oklahoma, and is bordered by Washington County to the north, Craig County to the east, Rogers County to the south, and Osage County to the west. The county seat is Nowata, and the county was named for a Delaware Indian word meaning “welcome.”
History
Nowata County was created in 1907 from part of the Cherokee Nation. The county was originally part of the Cooweescoowee District of the Cherokee Nation, and was home to the Delaware, Shawnee, and Cherokee tribes. The first settlers in the area were the Delaware, who arrived in the late 1700s. The Shawnee arrived in the early 1800s, and the Cherokee in the mid-1800s.
The first post office in the county was established in 1872, and the first school was built in 1875. The county was officially organized in 1907, and the first county seat was located in Nowata. The county was named for a Delaware Indian word meaning “welcome.”
Geography
Nowata County covers an area of 576 square miles, and is located in the northeastern corner of Oklahoma. The county is bordered by Washington County to the north, Craig County to the east, Rogers County to the south, and Osage County to the west. The county is mostly rural, with the majority of the land being used for agricultural purposes. The county is home to several small towns, including Nowata, Lenapah, and South Coffeyville.
The terrain of Nowata County is mostly flat, with some rolling hills in the northern part of the county. The county is drained by the Verdigris River, which flows through the county from north to south. The county is also home to several small lakes, including Nowata Lake, Lenapah Lake, and South Coffeyville Lake.
Economy
Nowata County’s economy is largely based on agriculture, with the majority of the land being used for farming and ranching. The county is home to several large farms, including the Nowata County Farm Bureau, which is the largest farm in the county. Other major industries in the county include oil and gas production, manufacturing, and tourism.
The county is also home to several small businesses, including restaurants, retail stores, and service providers. The county is served by several major highways, including US Highway 60, US Highway 169, and Oklahoma State Highway 28.
Demographics
As of the 2010 census, Nowata County had a population of 10,536. The population was spread out, with 48.3% male and 51.7% female. The median age was 40.2 years, and the median household income was $37,945. The racial makeup of the county was 87.2% White, 8.2% Native American, 0.7% Asian, 0.3% Black or African American, and 3.6% from other races.
Nowata County is home to several small towns, including Nowata, Lenapah, and South Coffeyville. The county is served by several major highways, including US Highway 60, US Highway 169, and Oklahoma State Highway 28. The county is mostly rural, with the majority of the land being used for agricultural purposes. The county is home to several large farms, including the Nowata County Farm Bureau, which is the largest farm in the county. Other major industries in the county include oil and gas production, manufacturing, and tourism.
Common Questions
What is the Total Population of Nowata County?
Total Population of Nowata County is 9,460.
What is the Total Male Population of Nowata County?
Total Male Population of Nowata County is 4,678.
What is the Total Female Population of Nowata County?
Total Female Population of Nowata County is 4,782.
What is the Ratio of Males per 100 Females in Nowata County?
There are 97.83 Males per 100 Females in Nowata County.
What is the Ratio of Females per 100 Males in Nowata County?
There are 102.22 Females per 100 Males in Nowata County.
What is the Median Population Age in Nowata County?
Median Population Age in Nowata County is 42.1 Years.
What is the Average Family Size in Nowata County
Average Family Size in Nowata County is 3.0 People.
What is the Average Household Size in Nowata County
Average Household Size in Nowata County is 2.5 People.
What is Per Capita Income in Nowata County?
Per Capita income in Nowata County is $29,851.
What is the Median Family Income in Nowata County?
Median Family Income in Nowata County is $61,860.
What is the Median Household income in Nowata County?
Median Household Income in Nowata County is $50,960.
What is Income or Wage Gap in Nowata County?
Income or Wage Gap in Nowata County is 39.1%.
Women in Nowata County earn 60.9 cents for every dollar earned by a man.
What is Family Income Deficit in Nowata County?
Family Income Deficit in Nowata County is $11,532.
Families that are below poverty line in Nowata County earn $11,532 less on average than the poverty threshold level.
What is Inequality or Gini Index in Nowata County?
Inequality or Gini Index in Nowata County is 0.45.
How Large is the Labor Force in Nowata County?
There are 4,174 People in the Labor Forcein in Nowata County.
What is the Percentage of People in the Labor Force in Nowata County?
55.2% of People are in the Labor Force in Nowata County.
What is the Unemployment Rate in Nowata County?
Unemployment Rate in Nowata County is 4.3%.