Muskogee County, OK
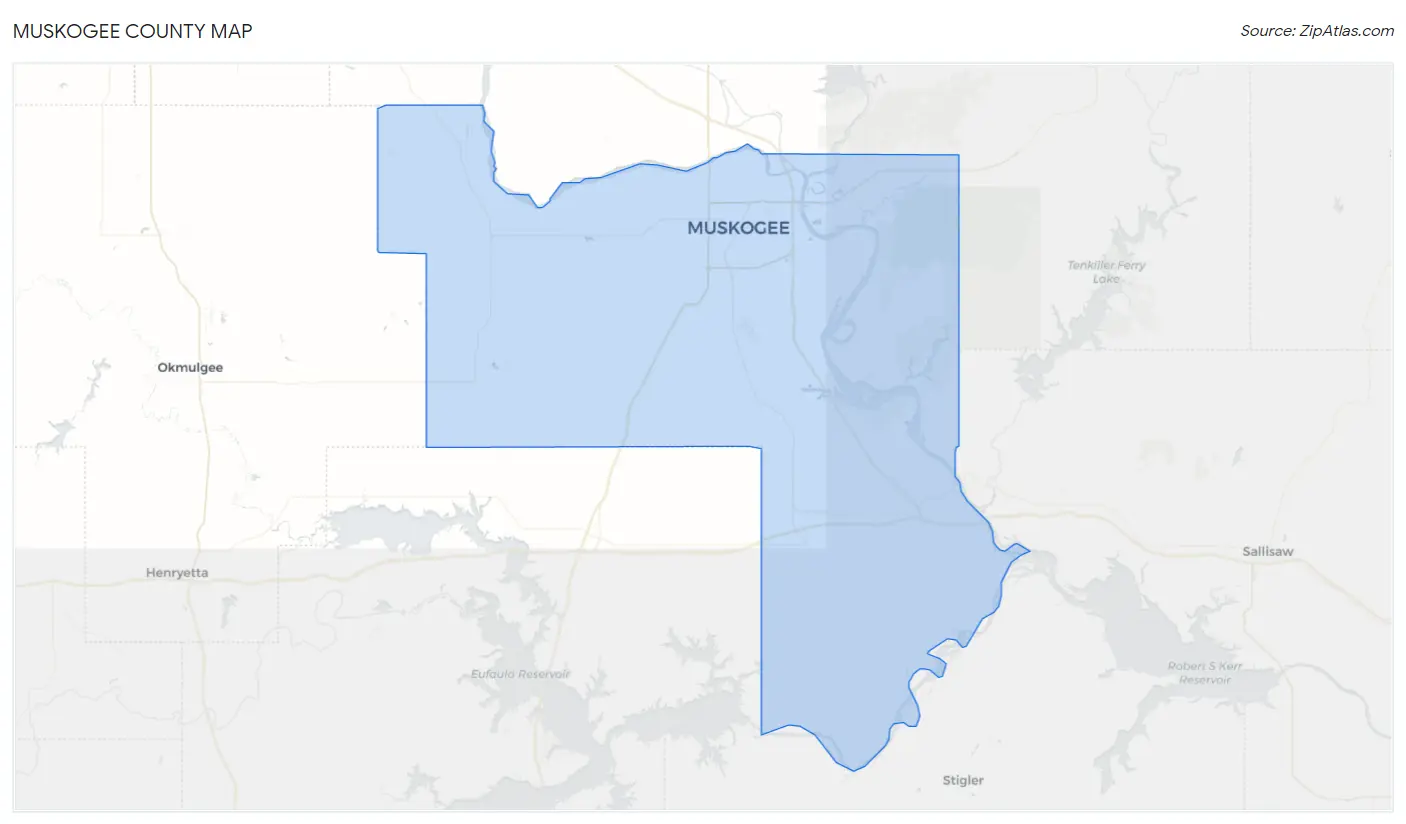
Muskogee County Map
Muskogee County Overview
66,606
TOTAL POPULATION
32,623
MALE POPULATION
33,983
FEMALE POPULATION
96.00
MALES / 100 FEMALES
104.17
FEMALES / 100 MALES
38.1
MEDIAN AGE
3.1
AVG FAMILY SIZE
2.5
AVG HOUSEHOLD SIZE
$26,684
PER CAPITA INCOME
$65,029
AVG FAMILY INCOME
$50,289
AVG HOUSEHOLD INCOME
29.5%
WAGE / INCOME GAP [ % ]
70.5¢/ $1
WAGE / INCOME GAP [ $ ]
$11,403
FAMILY INCOME DEFICIT
0.46
INEQUALITY / GINI INDEX
27,897
LABOR FORCE [ PEOPLE ]
53.5%
PERCENT IN LABOR FORCE
5.7%
UNEMPLOYMENT RATE
Muskogee County Area Codes
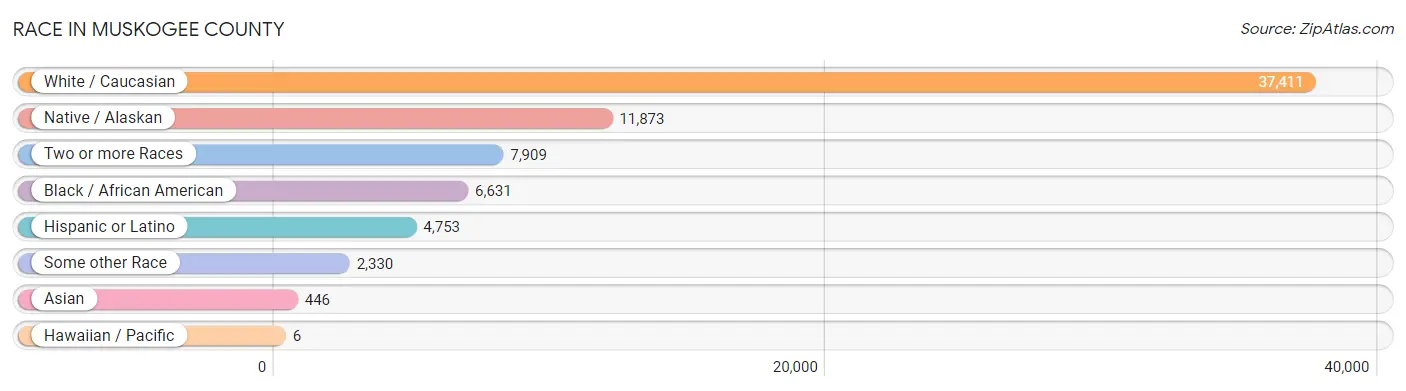
Race in Muskogee County
The most populous races in Muskogee County are White / Caucasian (37,411 | 56.2%), Native / Alaskan (11,873 | 17.8%), and Two or more Races (7,909 | 11.9%).
| Race | # Population | % Population |
| Asian | 446 | 0.7% |
| Black / African American | 6,631 | 10.0% |
| Hawaiian / Pacific | 6 | 0.0% |
| Hispanic or Latino | 4,753 | 7.1% |
| Native / Alaskan | 11,873 | 17.8% |
| White / Caucasian | 37,411 | 56.2% |
| Two or more Races | 7,909 | 11.9% |
| Some other Race | 2,330 | 3.5% |
| Total | 66,606 | 100.0% |
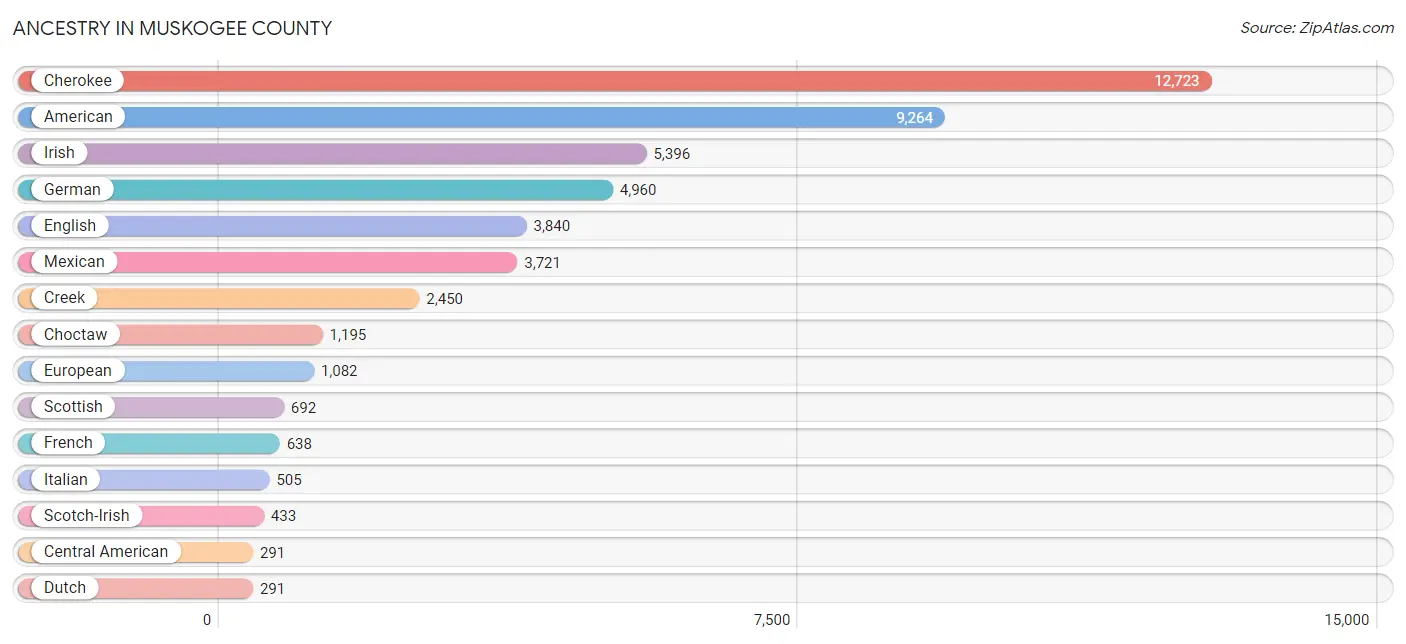
Ancestry in Muskogee County
The most populous ancestries reported in Muskogee County are Cherokee (12,723 | 19.1%), American (9,264 | 13.9%), Irish (5,396 | 8.1%), German (4,960 | 7.4%), and English (3,840 | 5.8%), together accounting for 54.3% of all Muskogee County residents.
| Ancestry | # Population | % Population |
| African | 40 | 0.1% |
| Alaskan Athabascan | 9 | 0.0% |
| American | 9,264 | 13.9% |
| Apache | 12 | 0.0% |
| Arab | 33 | 0.1% |
| Arapaho | 27 | 0.0% |
| Argentinean | 8 | 0.0% |
| Australian | 6 | 0.0% |
| Bangladeshi | 34 | 0.1% |
| Belgian | 81 | 0.1% |
| Bhutanese | 133 | 0.2% |
| Blackfeet | 22 | 0.0% |
| British | 190 | 0.3% |
| Burmese | 64 | 0.1% |
| Cajun | 3 | 0.0% |
| Canadian | 58 | 0.1% |
| Celtic | 9 | 0.0% |
| Central American | 291 | 0.4% |
| Cherokee | 12,723 | 19.1% |
| Chickasaw | 154 | 0.2% |
| Chippewa | 34 | 0.1% |
| Choctaw | 1,195 | 1.8% |
| Colombian | 89 | 0.1% |
| Comanche | 45 | 0.1% |
| Creek | 2,450 | 3.7% |
| Croatian | 14 | 0.0% |
| Cuban | 110 | 0.2% |
| Czech | 66 | 0.1% |
| Czechoslovakian | 5 | 0.0% |
| Danish | 57 | 0.1% |
| Delaware | 10 | 0.0% |
| Dominican | 49 | 0.1% |
| Dutch | 291 | 0.4% |
| Dutch West Indian | 115 | 0.2% |
| Eastern European | 53 | 0.1% |
| English | 3,840 | 5.8% |
| European | 1,082 | 1.6% |
| Filipino | 31 | 0.1% |
| Finnish | 21 | 0.0% |
| French | 638 | 1.0% |
| French Canadian | 81 | 0.1% |
| German | 4,960 | 7.4% |
| Greek | 37 | 0.1% |
| Guamanian / Chamorro | 6 | 0.0% |
| Guatemalan | 223 | 0.3% |
| Haitian | 58 | 0.1% |
| Honduran | 63 | 0.1% |
| Hopi | 15 | 0.0% |
| Hungarian | 98 | 0.2% |
| Icelander | 1 | 0.0% |
| Indian (Asian) | 24 | 0.0% |
| Iranian | 53 | 0.1% |
| Irish | 5,396 | 8.1% |
| Iroquois | 34 | 0.1% |
| Israeli | 42 | 0.1% |
| Italian | 505 | 0.8% |
| Jamaican | 6 | 0.0% |
| Kiowa | 50 | 0.1% |
| Korean | 172 | 0.3% |
| Lebanese | 20 | 0.0% |
| Lithuanian | 3 | 0.0% |
| Malaysian | 27 | 0.0% |
| Mexican | 3,721 | 5.6% |
| Mexican American Indian | 16 | 0.0% |
| Native Hawaiian | 10 | 0.0% |
| Navajo | 26 | 0.0% |
| Nicaraguan | 5 | 0.0% |
| Nigerian | 28 | 0.0% |
| Northern European | 45 | 0.1% |
| Norwegian | 260 | 0.4% |
| Osage | 58 | 0.1% |
| Ottawa | 2 | 0.0% |
| Pakistani | 97 | 0.2% |
| Polish | 282 | 0.4% |
| Portuguese | 25 | 0.0% |
| Potawatomi | 75 | 0.1% |
| Pueblo | 15 | 0.0% |
| Puerto Rican | 283 | 0.4% |
| Russian | 65 | 0.1% |
| Scandinavian | 155 | 0.2% |
| Scotch-Irish | 433 | 0.6% |
| Scottish | 692 | 1.0% |
| Seminole | 183 | 0.3% |
| Serbian | 3 | 0.0% |
| Sioux | 14 | 0.0% |
| Slovene | 3 | 0.0% |
| South African | 15 | 0.0% |
| South American | 97 | 0.2% |
| Spaniard | 55 | 0.1% |
| Spanish | 32 | 0.1% |
| Sri Lankan | 137 | 0.2% |
| Subsaharan African | 92 | 0.1% |
| Swedish | 258 | 0.4% |
| Swiss | 29 | 0.0% |
| Thai | 84 | 0.1% |
| Ukrainian | 13 | 0.0% |
| Welsh | 155 | 0.2% |
| Yugoslavian | 1 | 0.0% | View All 98 Rows |
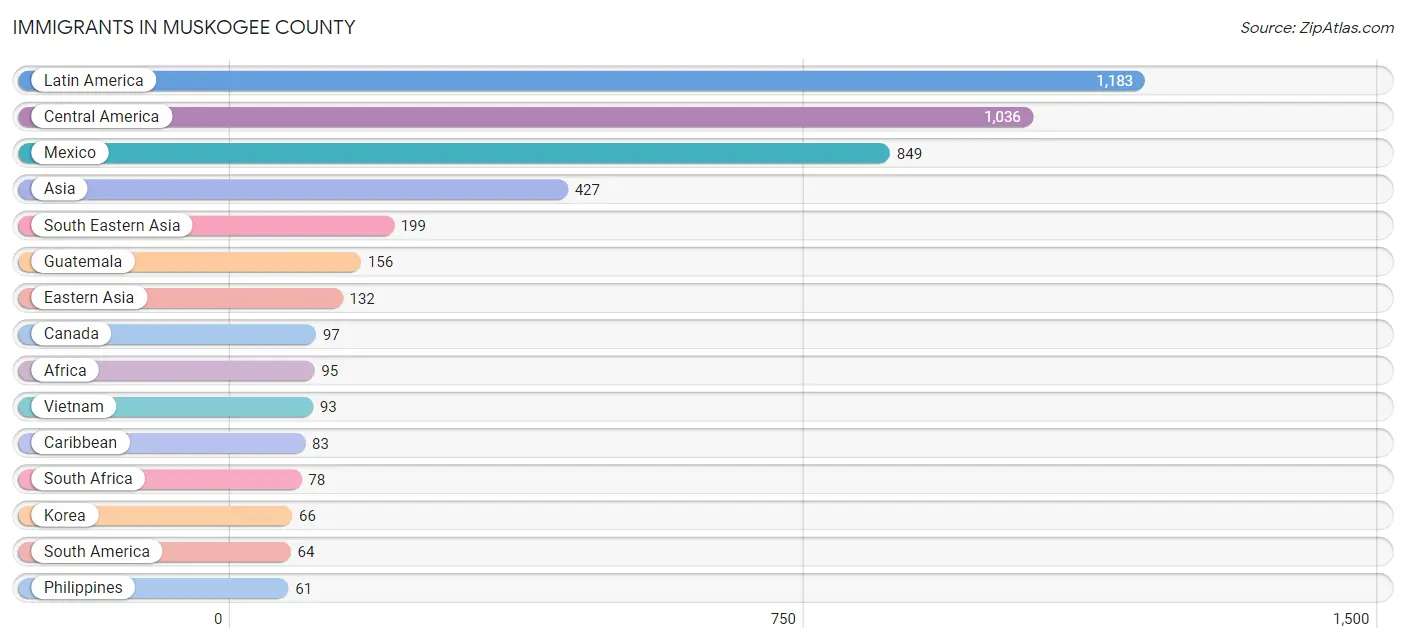
Immigrants in Muskogee County
The most numerous immigrant groups reported in Muskogee County came from Latin America (1,183 | 1.8%), Central America (1,036 | 1.6%), Mexico (849 | 1.3%), Asia (427 | 0.6%), and South Eastern Asia (199 | 0.3%), together accounting for 5.6% of all Muskogee County residents.
| Immigration Origin | # Population | % Population |
| Africa | 95 | 0.1% |
| Argentina | 10 | 0.0% |
| Asia | 427 | 0.6% |
| Brazil | 20 | 0.0% |
| Canada | 97 | 0.2% |
| Caribbean | 83 | 0.1% |
| Central America | 1,036 | 1.6% |
| China | 45 | 0.1% |
| Colombia | 29 | 0.0% |
| Dominican Republic | 31 | 0.1% |
| Eastern Asia | 132 | 0.2% |
| Eastern Europe | 1 | 0.0% |
| England | 3 | 0.0% |
| Europe | 43 | 0.1% |
| France | 11 | 0.0% |
| Guatemala | 156 | 0.2% |
| Haiti | 52 | 0.1% |
| Honduras | 31 | 0.1% |
| India | 23 | 0.0% |
| Israel | 30 | 0.1% |
| Japan | 21 | 0.0% |
| Korea | 66 | 0.1% |
| Kuwait | 10 | 0.0% |
| Laos | 40 | 0.1% |
| Latin America | 1,183 | 1.8% |
| Mexico | 849 | 1.3% |
| Nepal | 23 | 0.0% |
| Nigeria | 3 | 0.0% |
| Northern Europe | 20 | 0.0% |
| Oceania | 5 | 0.0% |
| Pakistan | 10 | 0.0% |
| Philippines | 61 | 0.1% |
| South Africa | 78 | 0.1% |
| South America | 64 | 0.1% |
| South Central Asia | 56 | 0.1% |
| South Eastern Asia | 199 | 0.3% |
| Sweden | 16 | 0.0% |
| Switzerland | 11 | 0.0% |
| Taiwan | 31 | 0.1% |
| Thailand | 5 | 0.0% |
| Vietnam | 93 | 0.1% |
| Western Africa | 3 | 0.0% |
| Western Asia | 40 | 0.1% |
| Western Europe | 22 | 0.0% | View All 44 Rows |
Sex and Age in Muskogee County
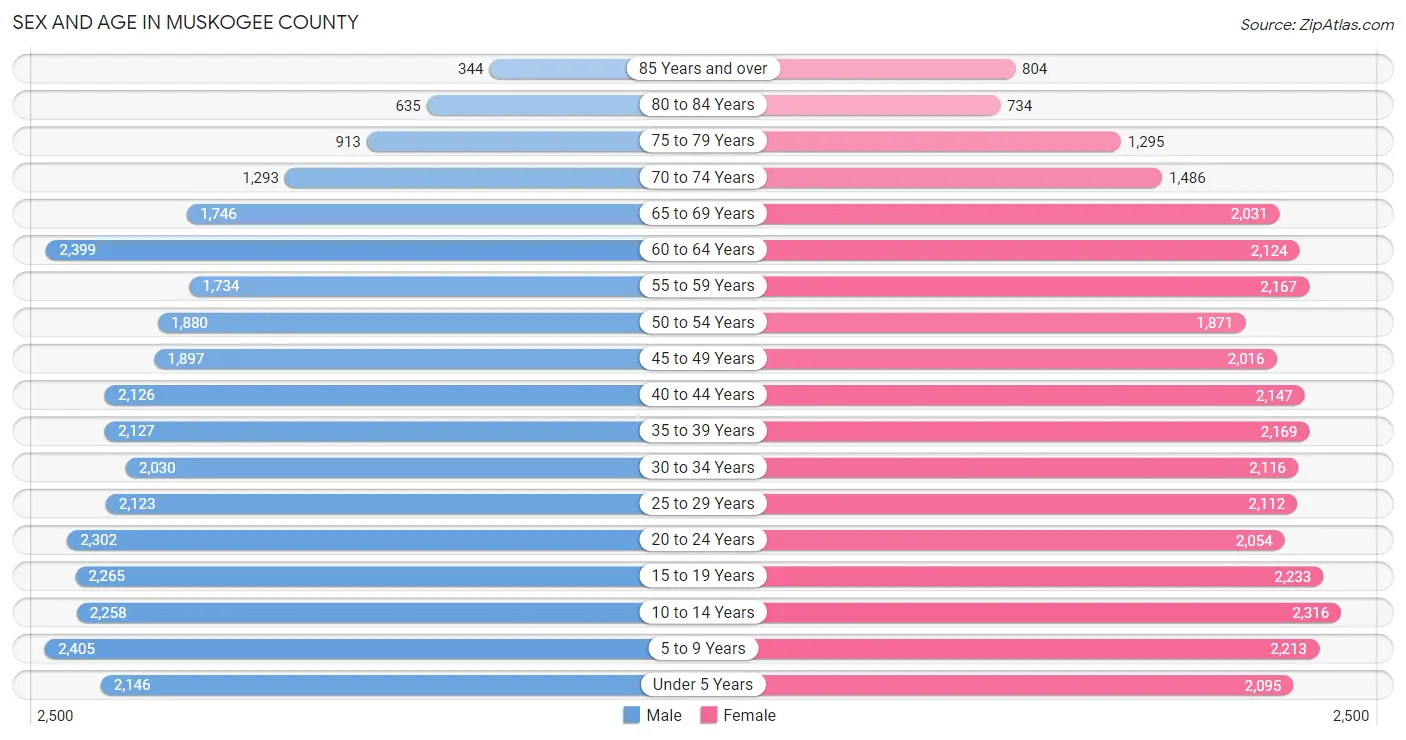
Sex and Age in Muskogee County
The most populous age groups in Muskogee County are 5 to 9 Years (2,405 | 7.4%) for men and 10 to 14 Years (2,316 | 6.8%) for women.
| Age Bracket | Male | Female |
| Under 5 Years | 2,146 (6.6%) | 2,095 (6.2%) |
| 5 to 9 Years | 2,405 (7.4%) | 2,213 (6.5%) |
| 10 to 14 Years | 2,258 (6.9%) | 2,316 (6.8%) |
| 15 to 19 Years | 2,265 (6.9%) | 2,233 (6.6%) |
| 20 to 24 Years | 2,302 (7.1%) | 2,054 (6.0%) |
| 25 to 29 Years | 2,123 (6.5%) | 2,112 (6.2%) |
| 30 to 34 Years | 2,030 (6.2%) | 2,116 (6.2%) |
| 35 to 39 Years | 2,127 (6.5%) | 2,169 (6.4%) |
| 40 to 44 Years | 2,126 (6.5%) | 2,147 (6.3%) |
| 45 to 49 Years | 1,897 (5.8%) | 2,016 (5.9%) |
| 50 to 54 Years | 1,880 (5.8%) | 1,871 (5.5%) |
| 55 to 59 Years | 1,734 (5.3%) | 2,167 (6.4%) |
| 60 to 64 Years | 2,399 (7.3%) | 2,124 (6.2%) |
| 65 to 69 Years | 1,746 (5.3%) | 2,031 (6.0%) |
| 70 to 74 Years | 1,293 (4.0%) | 1,486 (4.4%) |
| 75 to 79 Years | 913 (2.8%) | 1,295 (3.8%) |
| 80 to 84 Years | 635 (1.9%) | 734 (2.2%) |
| 85 Years and over | 344 (1.1%) | 804 (2.4%) |
| Total | 32,623 (100.0%) | 33,983 (100.0%) |
Families and Households in Muskogee County
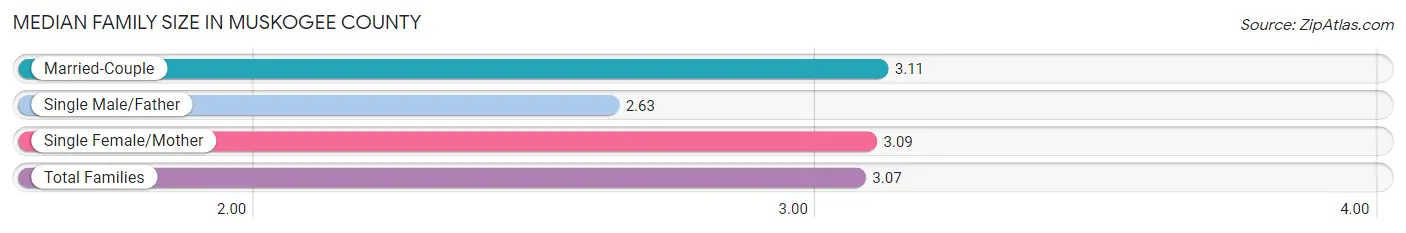
Median Family Size in Muskogee County
The median family size in Muskogee County is 3.07 persons per family, with married-couple families (11,275 | 68.1%) accounting for the largest median family size of 3.11 persons per family. On the other hand, single male/father families (1,236 | 7.5%) represent the smallest median family size with 2.63 persons per family.
| Family Type | # Families | Family Size |
| Married-Couple | 11,275 (68.1%) | 3.11 |
| Single Male/Father | 1,236 (7.5%) | 2.63 |
| Single Female/Mother | 4,047 (24.4%) | 3.09 |
| Total Families | 16,558 (100.0%) | 3.07 |
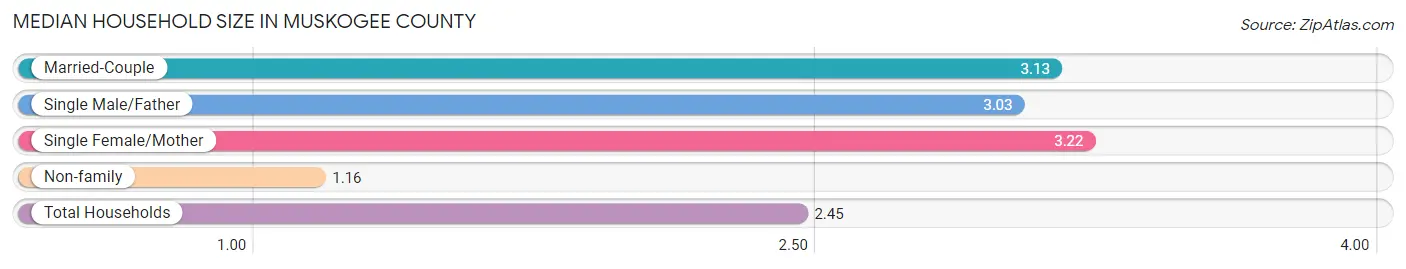
Median Household Size in Muskogee County
The median household size in Muskogee County is 2.45 persons per household, with single female/mother households (4,047 | 15.8%) accounting for the largest median household size of 3.22 persons per household. non-family households (9,040 | 35.3%) represent the smallest median household size with 1.16 persons per household.
| Household Type | # Households | Household Size |
| Married-Couple | 11,275 (44.1%) | 3.13 |
| Single Male/Father | 1,236 (4.8%) | 3.03 |
| Single Female/Mother | 4,047 (15.8%) | 3.22 |
| Non-family | 9,040 (35.3%) | 1.16 |
| Total Households | 25,598 (100.0%) | 2.45 |
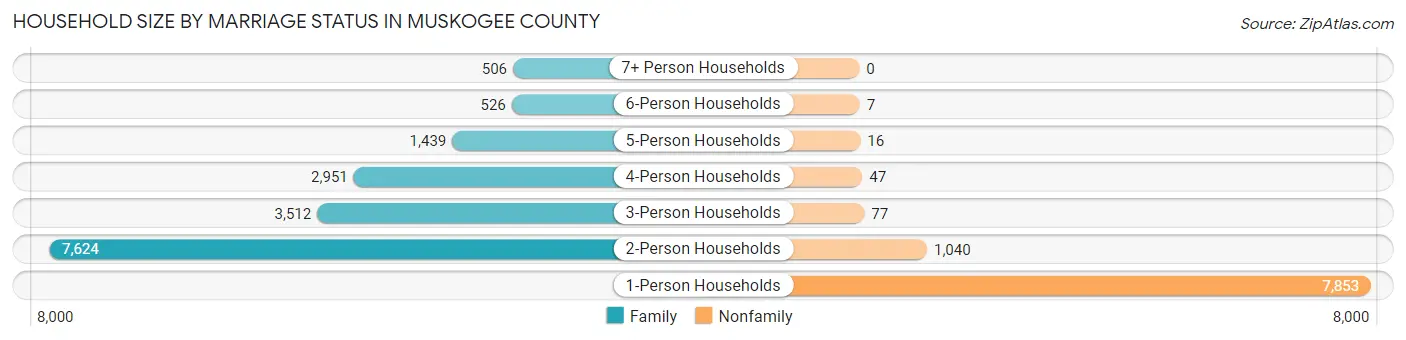
Household Size by Marriage Status in Muskogee County
Out of a total of 25,598 households in Muskogee County, 16,558 (64.7%) are family households, while 9,040 (35.3%) are nonfamily households. The most numerous type of family households are 2-person households, comprising 7,624, and the most common type of nonfamily households are 1-person households, comprising 7,853.
| Household Size | Family Households | Nonfamily Households |
| 1-Person Households | - | 7,853 (30.7%) |
| 2-Person Households | 7,624 (29.8%) | 1,040 (4.1%) |
| 3-Person Households | 3,512 (13.7%) | 77 (0.3%) |
| 4-Person Households | 2,951 (11.5%) | 47 (0.2%) |
| 5-Person Households | 1,439 (5.6%) | 16 (0.1%) |
| 6-Person Households | 526 (2.1%) | 7 (0.0%) |
| 7+ Person Households | 506 (2.0%) | 0 (0.0%) |
| Total | 16,558 (64.7%) | 9,040 (35.3%) |
Female Fertility in Muskogee County
Fertility by Age in Muskogee County
Average fertility rate in Muskogee County is 58.0 births per 1,000 women. Women in the age bracket of 20 to 34 years have the highest fertility rate with 108.0 births per 1,000 women. Women in the age bracket of 20 to 34 years acount for 75.8% of all women with births.
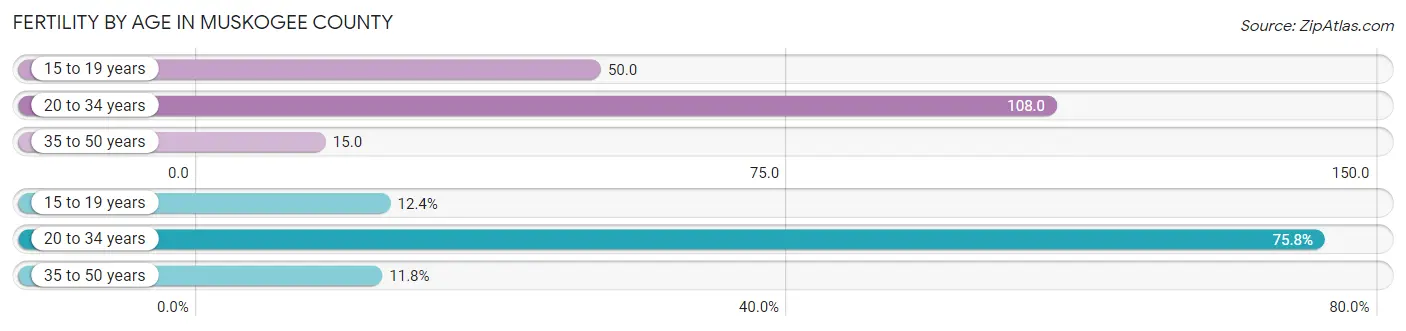
| Age Bracket | Women with Births | Births / 1,000 Women |
| 15 to 19 years | 111 (12.4%) | 50.0 |
| 20 to 34 years | 679 (75.8%) | 108.0 |
| 35 to 50 years | 106 (11.8%) | 15.0 |
| Total | 896 (100.0%) | 58.0 |
Fertility by Age by Marriage Status in Muskogee County
48.9% of women with births (896) in Muskogee County are married. The highest percentage of unmarried women with births falls into 15 to 19 years age bracket with 100.0% of them unmarried at the time of birth, while the lowest percentage of unmarried women with births belong to 35 to 50 years age bracket with 36.8% of them unmarried.
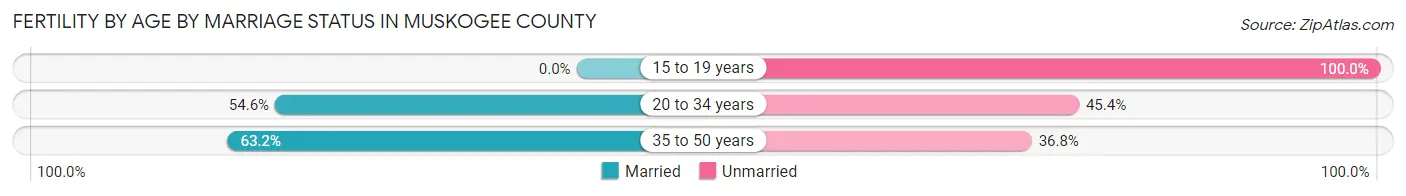
| Age Bracket | Married | Unmarried |
| 15 to 19 years | 0 (0.0%) | 111 (100.0%) |
| 20 to 34 years | 371 (54.6%) | 308 (45.4%) |
| 35 to 50 years | 67 (63.2%) | 39 (36.8%) |
| Total | 438 (48.9%) | 458 (51.1%) |
Fertility by Education in Muskogee County
Average fertility rate in Muskogee County is 58.0 births per 1,000 women. Women with the education attainment of college or associate's degree have the highest fertility rate of 68.0 births per 1,000 women, while women with the education attainment of graduate degree have the lowest fertility at 37.0 births per 1,000 women. Women with the education attainment of college or associate's degree represent 43.1% of all women with births.
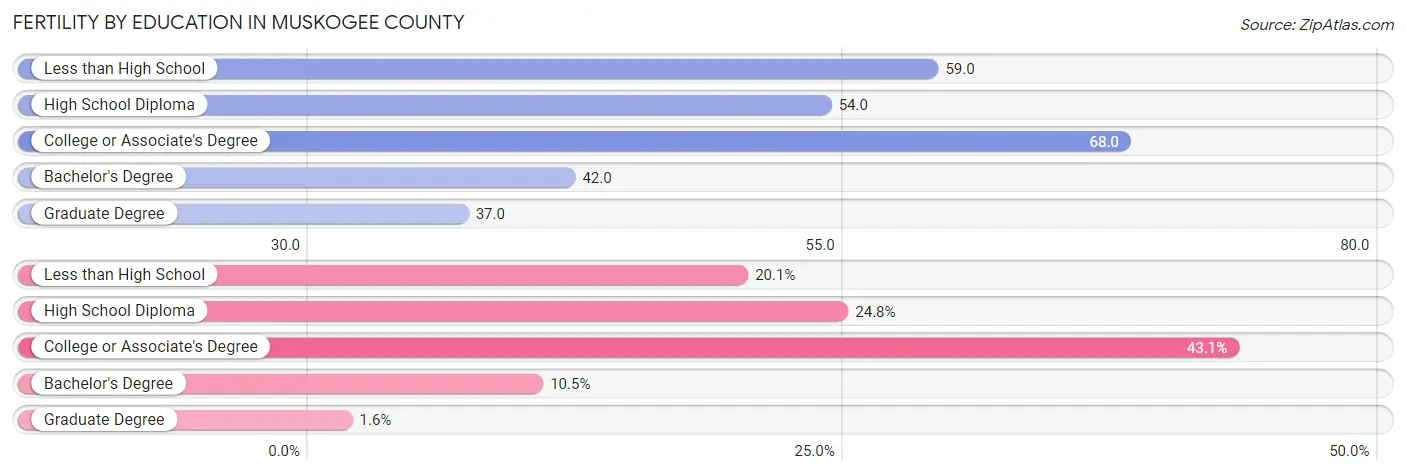
| Educational Attainment | Women with Births | Births / 1,000 Women |
| Less than High School | 180 (20.1%) | 59.0 |
| High School Diploma | 222 (24.8%) | 54.0 |
| College or Associate's Degree | 386 (43.1%) | 68.0 |
| Bachelor's Degree | 94 (10.5%) | 42.0 |
| Graduate Degree | 14 (1.6%) | 37.0 |
| Total | 896 (100.0%) | 58.0 |
Fertility by Education by Marriage Status in Muskogee County
51.1% of women with births in Muskogee County are unmarried. Women with the educational attainment of bachelor's degree are most likely to be married with 75.5% of them married at childbirth, while women with the educational attainment of less than high school are least likely to be married with 85.0% of them unmarried at childbirth.
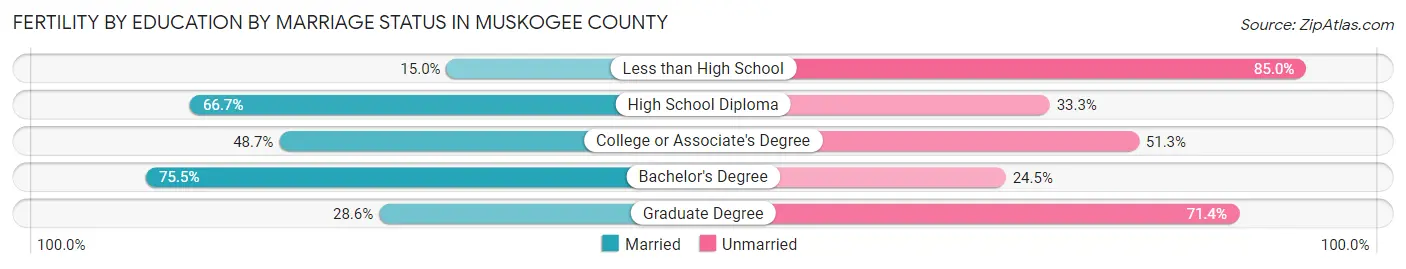
| Educational Attainment | Married | Unmarried |
| Less than High School | 27 (15.0%) | 153 (85.0%) |
| High School Diploma | 148 (66.7%) | 74 (33.3%) |
| College or Associate's Degree | 188 (48.7%) | 198 (51.3%) |
| Bachelor's Degree | 71 (75.5%) | 23 (24.5%) |
| Graduate Degree | 4 (28.6%) | 10 (71.4%) |
| Total | 438 (48.9%) | 458 (51.1%) |
Income in Muskogee County
Income Overview in Muskogee County
Per Capita Income in Muskogee County is $26,684, while median incomes of families and households are $65,029 and $50,289 respectively.
| Characteristic | Number | Measure |
| Per Capita Income | 66,606 | $26,684 |
| Median Family Income | 16,558 | $65,029 |
| Mean Family Income | 16,558 | $82,352 |
| Median Household Income | 25,598 | $50,289 |
| Mean Household Income | 25,598 | $68,798 |
| Income Deficit | 16,558 | $11,403 |
| Wage / Income Gap (%) | 66,606 | 29.49% |
| Wage / Income Gap ($) | 66,606 | 70.51¢ per $1 |
| Gini / Inequality Index | 66,606 | 0.46 |
Earnings by Sex in Muskogee County
Average Earnings in Muskogee County are $34,137, $40,080 for men and $28,260 for women, a difference of 29.5%.
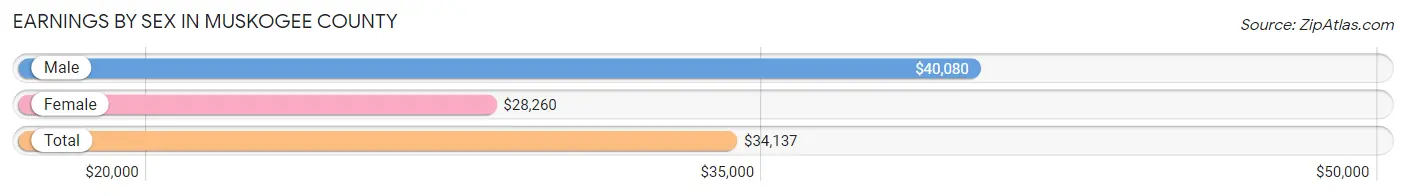
| Sex | Number | Average Earnings |
| Male | 15,210 (51.2%) | $40,080 |
| Female | 14,472 (48.8%) | $28,260 |
| Total | 29,682 (100.0%) | $34,137 |
Earnings by Sex by Income Bracket in Muskogee County
The most common earnings brackets in Muskogee County are $55,000 to $64,999 for men (1,478 | 9.7%) and $2,499 or less for women (1,125 | 7.8%).
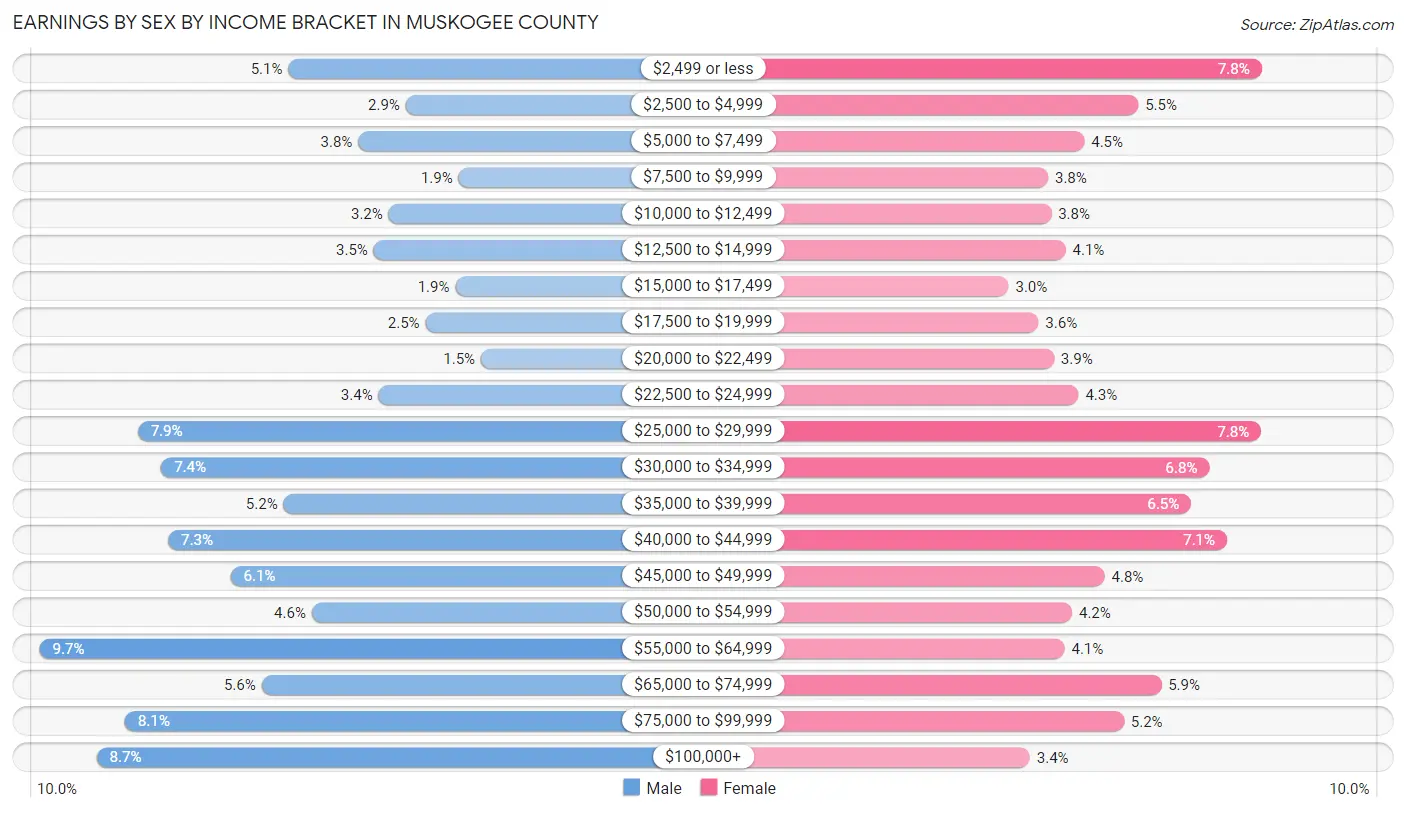
| Income | Male | Female |
| $2,499 or less | 770 (5.1%) | 1,125 (7.8%) |
| $2,500 to $4,999 | 435 (2.9%) | 790 (5.5%) |
| $5,000 to $7,499 | 570 (3.7%) | 644 (4.4%) |
| $7,500 to $9,999 | 284 (1.9%) | 545 (3.8%) |
| $10,000 to $12,499 | 483 (3.2%) | 555 (3.8%) |
| $12,500 to $14,999 | 527 (3.5%) | 593 (4.1%) |
| $15,000 to $17,499 | 294 (1.9%) | 438 (3.0%) |
| $17,500 to $19,999 | 379 (2.5%) | 520 (3.6%) |
| $20,000 to $22,499 | 220 (1.5%) | 561 (3.9%) |
| $22,500 to $24,999 | 512 (3.4%) | 628 (4.3%) |
| $25,000 to $29,999 | 1,198 (7.9%) | 1,123 (7.8%) |
| $30,000 to $34,999 | 1,132 (7.4%) | 983 (6.8%) |
| $35,000 to $39,999 | 783 (5.1%) | 934 (6.5%) |
| $40,000 to $44,999 | 1,112 (7.3%) | 1,031 (7.1%) |
| $45,000 to $49,999 | 934 (6.1%) | 699 (4.8%) |
| $50,000 to $54,999 | 703 (4.6%) | 611 (4.2%) |
| $55,000 to $64,999 | 1,478 (9.7%) | 591 (4.1%) |
| $65,000 to $74,999 | 846 (5.6%) | 853 (5.9%) |
| $75,000 to $99,999 | 1,235 (8.1%) | 751 (5.2%) |
| $100,000+ | 1,315 (8.6%) | 497 (3.4%) |
| Total | 15,210 (100.0%) | 14,472 (100.0%) |
Earnings by Sex by Educational Attainment in Muskogee County
Average earnings in Muskogee County are $44,705 for men and $33,906 for women, a difference of 24.2%. Men with an educational attainment of graduate degree enjoy the highest average annual earnings of $83,333, while those with less than high school education earn the least with $33,488. Women with an educational attainment of graduate degree earn the most with the average annual earnings of $59,276, while those with less than high school education have the smallest earnings of $21,305.
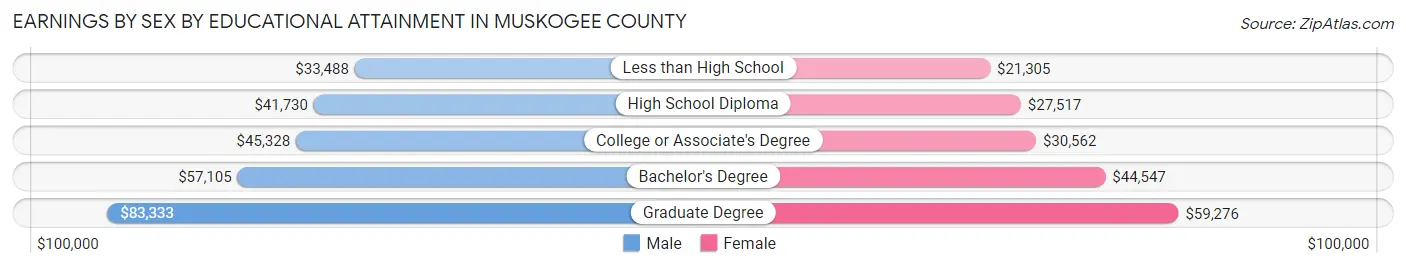
| Educational Attainment | Male Income | Female Income |
| Less than High School | $33,488 | $21,305 |
| High School Diploma | $41,730 | $27,517 |
| College or Associate's Degree | $45,328 | $30,562 |
| Bachelor's Degree | $57,105 | $44,547 |
| Graduate Degree | $83,333 | $59,276 |
| Total | $44,705 | $33,906 |
Family Income in Muskogee County
Family Income Brackets in Muskogee County
According to the Muskogee County family income data, there are 3,047 families falling into the $50,000 to $74,999 income range, which is the most common income bracket and makes up 18.4% of all families. Conversely, the $10,000 to $14,999 income bracket is the least frequent group with only 364 families (2.2%) belonging to this category.
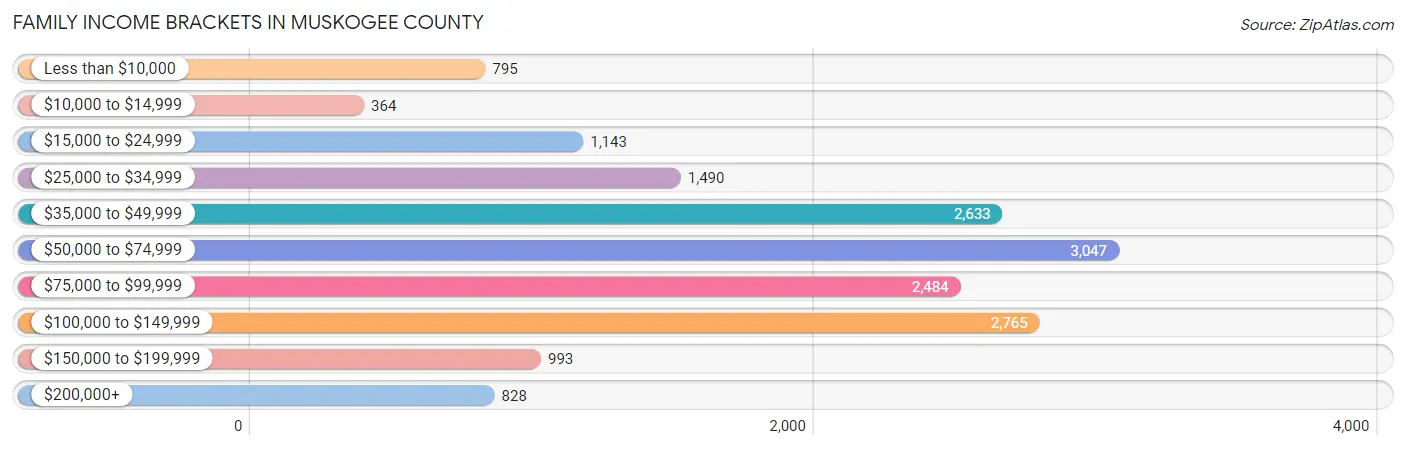
| Income Bracket | # Families | % Families |
| Less than $10,000 | 795 | 4.8% |
| $10,000 to $14,999 | 364 | 2.2% |
| $15,000 to $24,999 | 1,143 | 6.9% |
| $25,000 to $34,999 | 1,490 | 9.0% |
| $35,000 to $49,999 | 2,633 | 15.9% |
| $50,000 to $74,999 | 3,047 | 18.4% |
| $75,000 to $99,999 | 2,484 | 15.0% |
| $100,000 to $149,999 | 2,765 | 16.7% |
| $150,000 to $199,999 | 993 | 6.0% |
| $200,000+ | 828 | 5.0% |
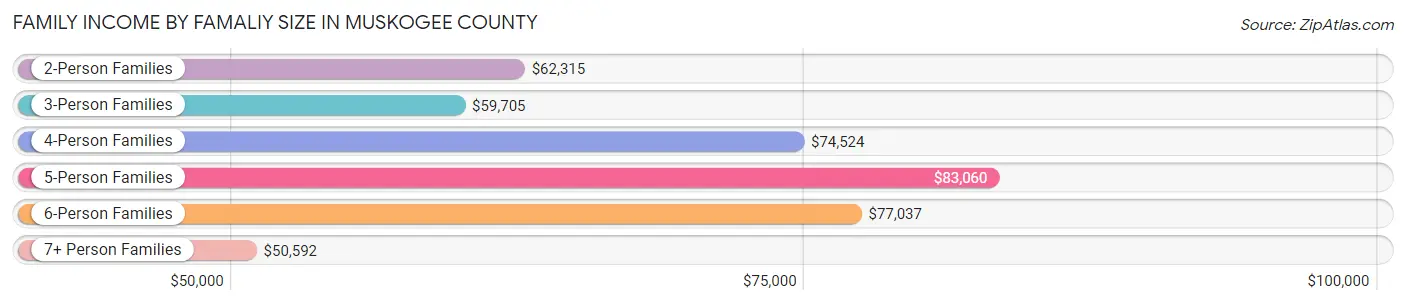
Family Income by Famaliy Size in Muskogee County
5-person families (1,257 | 7.6%) account for the highest median family income in Muskogee County with $83,060 per family, while 2-person families (8,035 | 48.5%) have the highest median income of $31,158 per family member.
| Income Bracket | # Families | Median Income |
| 2-Person Families | 8,035 (48.5%) | $62,315 |
| 3-Person Families | 3,563 (21.5%) | $59,705 |
| 4-Person Families | 2,722 (16.4%) | $74,524 |
| 5-Person Families | 1,257 (7.6%) | $83,060 |
| 6-Person Families | 538 (3.3%) | $77,037 |
| 7+ Person Families | 443 (2.7%) | $50,592 |
| Total | 16,558 (100.0%) | $65,029 |
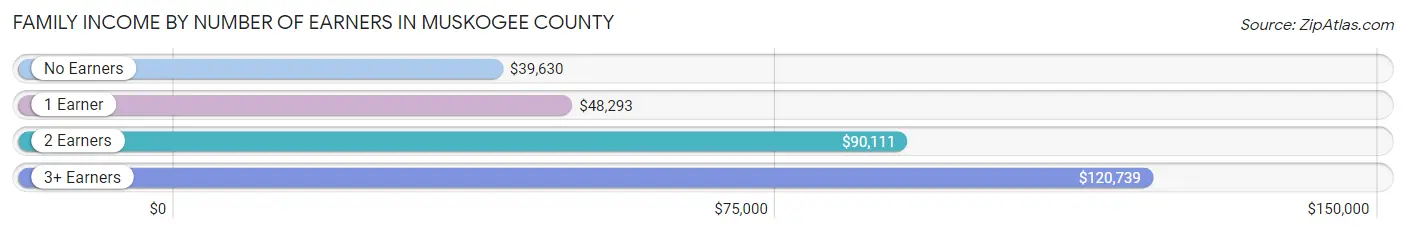
Family Income by Number of Earners in Muskogee County
The median family income in Muskogee County is $65,029, with families comprising 3+ earners (1,513) having the highest median family income of $120,739, while families with no earners (3,023) have the lowest median family income of $39,630, accounting for 9.1% and 18.3% of families, respectively.
| Number of Earners | # Families | Median Income |
| No Earners | 3,023 (18.3%) | $39,630 |
| 1 Earner | 6,497 (39.2%) | $48,293 |
| 2 Earners | 5,525 (33.4%) | $90,111 |
| 3+ Earners | 1,513 (9.1%) | $120,739 |
| Total | 16,558 (100.0%) | $65,029 |
Household Income in Muskogee County
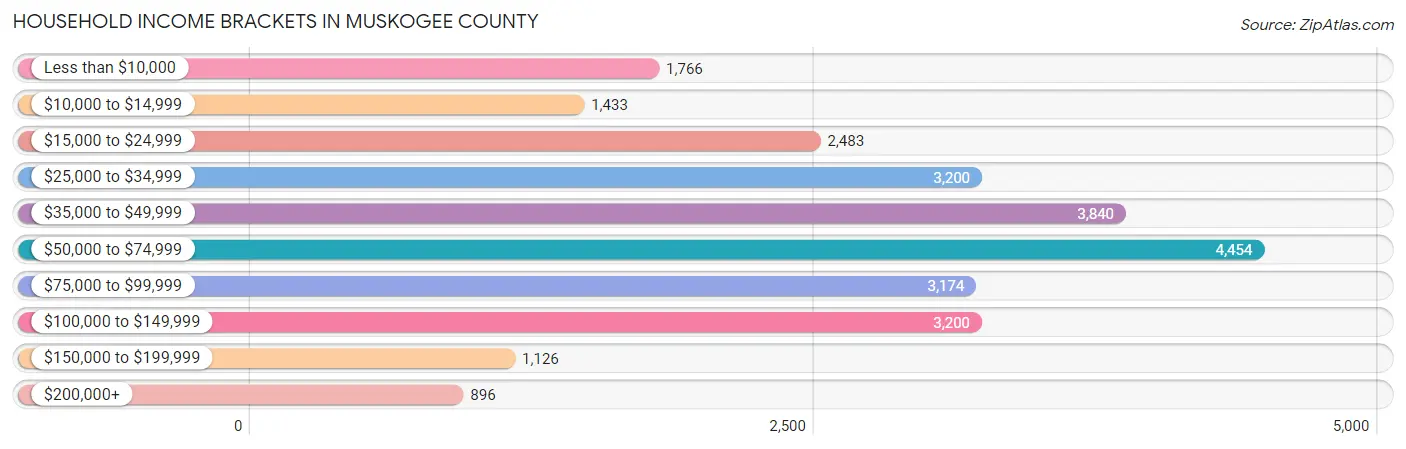
Household Income Brackets in Muskogee County
With 4,454 households falling in the category, the $50,000 to $74,999 income range is the most frequent in Muskogee County, accounting for 17.4% of all households. In contrast, only 896 households (3.5%) fall into the $200,000+ income bracket, making it the least populous group.
| Income Bracket | # Households | % Households |
| Less than $10,000 | 1,766 | 6.9% |
| $10,000 to $14,999 | 1,433 | 5.6% |
| $15,000 to $24,999 | 2,483 | 9.7% |
| $25,000 to $34,999 | 3,200 | 12.5% |
| $35,000 to $49,999 | 3,840 | 15.0% |
| $50,000 to $74,999 | 4,454 | 17.4% |
| $75,000 to $99,999 | 3,174 | 12.4% |
| $100,000 to $149,999 | 3,200 | 12.5% |
| $150,000 to $199,999 | 1,126 | 4.4% |
| $200,000+ | 896 | 3.5% |
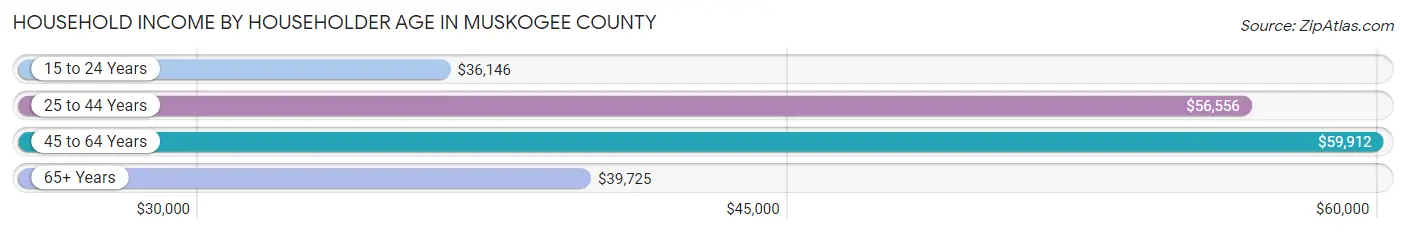
Household Income by Householder Age in Muskogee County
The median household income in Muskogee County is $50,289, with the highest median household income of $59,912 found in the 45 to 64 years age bracket for the primary householder. A total of 9,052 households (35.4%) fall into this category. Meanwhile, the 15 to 24 years age bracket for the primary householder has the lowest median household income of $36,146, with 1,084 households (4.2%) in this group.
| Income Bracket | # Households | Median Income |
| 15 to 24 Years | 1,084 (4.2%) | $36,146 |
| 25 to 44 Years | 7,956 (31.1%) | $56,556 |
| 45 to 64 Years | 9,052 (35.4%) | $59,912 |
| 65+ Years | 7,506 (29.3%) | $39,725 |
| Total | 25,598 (100.0%) | $50,289 |
Poverty in Muskogee County
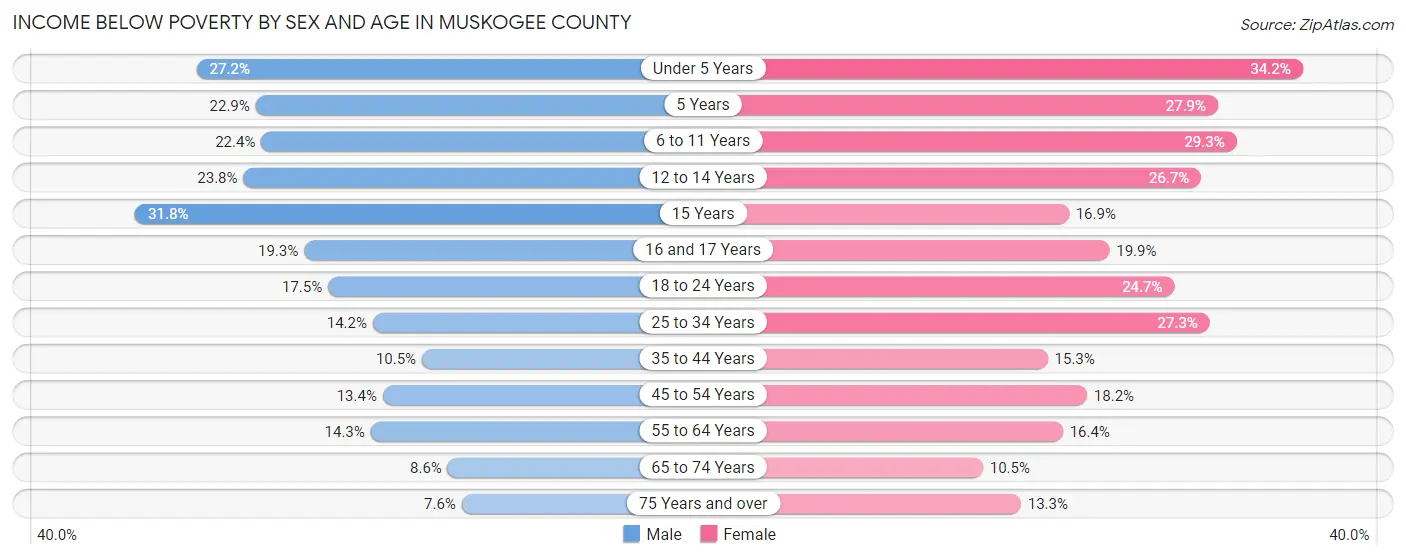
Income Below Poverty by Sex and Age in Muskogee County
With 15.6% poverty level for males and 20.5% for females among the residents of Muskogee County, 15 year old males and under 5 year old females are the most vulnerable to poverty, with 151 males (31.8%) and 710 females (34.2%) in their respective age groups living below the poverty level.
| Age Bracket | Male | Female |
| Under 5 Years | 571 (27.2%) | 710 (34.2%) |
| 5 Years | 85 (22.9%) | 129 (27.9%) |
| 6 to 11 Years | 610 (22.4%) | 769 (29.3%) |
| 12 to 14 Years | 350 (23.8%) | 361 (26.7%) |
| 15 Years | 151 (31.8%) | 93 (16.9%) |
| 16 and 17 Years | 160 (19.3%) | 172 (19.9%) |
| 18 to 24 Years | 473 (17.5%) | 602 (24.7%) |
| 25 to 34 Years | 537 (14.1%) | 1,082 (27.3%) |
| 35 to 44 Years | 412 (10.5%) | 585 (15.3%) |
| 45 to 54 Years | 463 (13.4%) | 658 (18.2%) |
| 55 to 64 Years | 571 (14.3%) | 687 (16.4%) |
| 65 to 74 Years | 253 (8.6%) | 357 (10.5%) |
| 75 Years and over | 135 (7.5%) | 341 (13.3%) |
| Total | 4,771 (15.6%) | 6,546 (20.5%) |
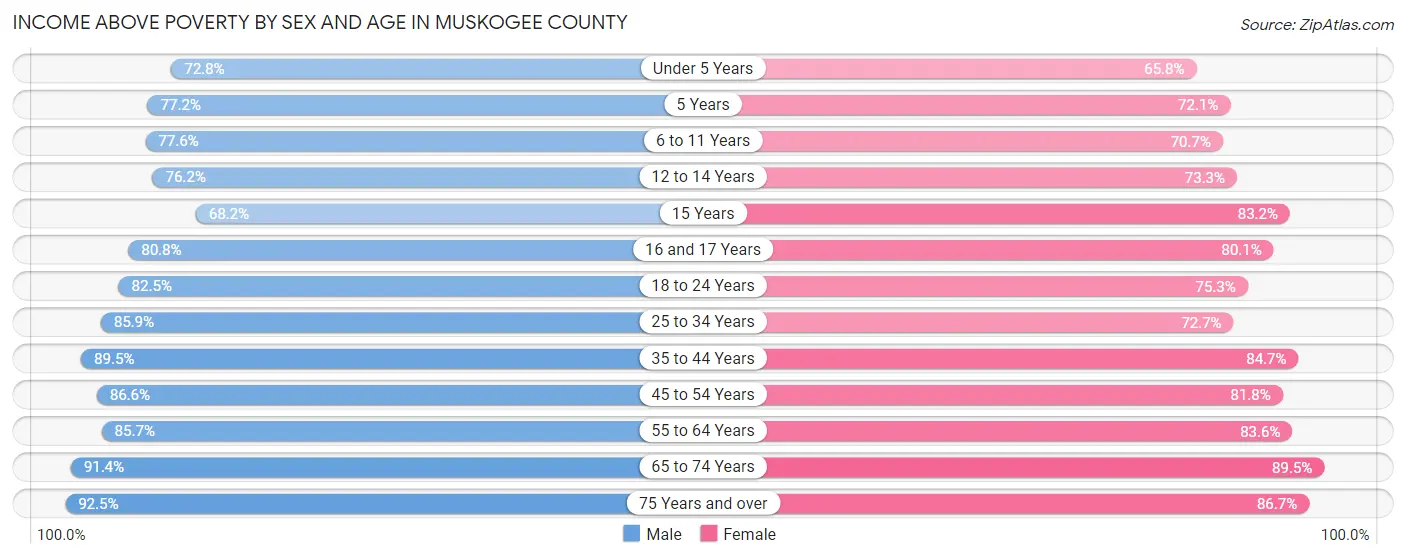
Income Above Poverty by Sex and Age in Muskogee County
According to the poverty statistics in Muskogee County, males aged 75 years and over and females aged 65 to 74 years are the age groups that are most secure financially, with 92.4% of males and 89.5% of females in these age groups living above the poverty line.
| Age Bracket | Male | Female |
| Under 5 Years | 1,526 (72.8%) | 1,366 (65.8%) |
| 5 Years | 287 (77.1%) | 333 (72.1%) |
| 6 to 11 Years | 2,109 (77.6%) | 1,856 (70.7%) |
| 12 to 14 Years | 1,123 (76.2%) | 992 (73.3%) |
| 15 Years | 324 (68.2%) | 459 (83.2%) |
| 16 and 17 Years | 671 (80.7%) | 694 (80.1%) |
| 18 to 24 Years | 2,235 (82.5%) | 1,837 (75.3%) |
| 25 to 34 Years | 3,257 (85.9%) | 2,880 (72.7%) |
| 35 to 44 Years | 3,511 (89.5%) | 3,243 (84.7%) |
| 45 to 54 Years | 2,990 (86.6%) | 2,957 (81.8%) |
| 55 to 64 Years | 3,419 (85.7%) | 3,501 (83.6%) |
| 65 to 74 Years | 2,692 (91.4%) | 3,052 (89.5%) |
| 75 Years and over | 1,653 (92.4%) | 2,225 (86.7%) |
| Total | 25,797 (84.4%) | 25,395 (79.5%) |
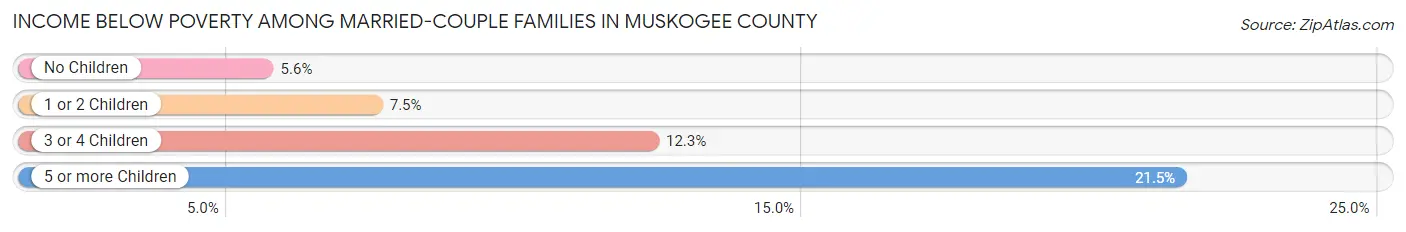
Income Below Poverty Among Married-Couple Families in Muskogee County
The poverty statistics for married-couple families in Muskogee County show that 7.0% or 788 of the total 11,275 families live below the poverty line. Families with 5 or more children have the highest poverty rate of 21.5%, comprising of 34 families. On the other hand, families with no children have the lowest poverty rate of 5.6%, which includes 380 families.
| Children | Above Poverty | Below Poverty |
| No Children | 6,381 (94.4%) | 380 (5.6%) |
| 1 or 2 Children | 3,136 (92.5%) | 255 (7.5%) |
| 3 or 4 Children | 846 (87.7%) | 119 (12.3%) |
| 5 or more Children | 124 (78.5%) | 34 (21.5%) |
| Total | 10,487 (93.0%) | 788 (7.0%) |
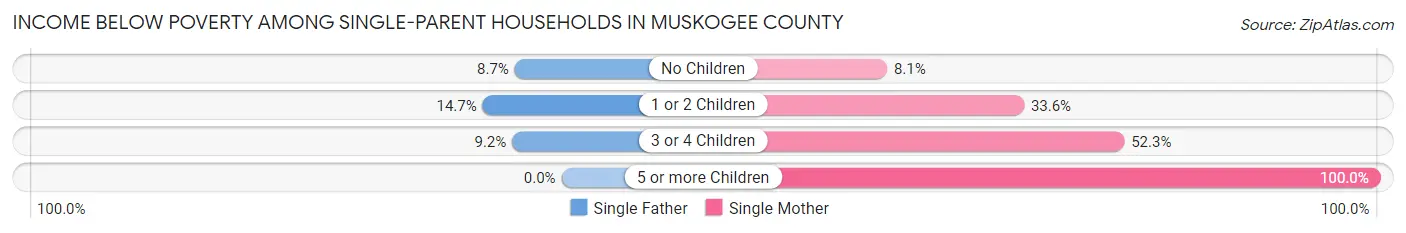
Income Below Poverty Among Single-Parent Households in Muskogee County
According to the poverty data in Muskogee County, 12.0% or 148 single-father households and 29.4% or 1,191 single-mother households are living below the poverty line. Among single-father households, those with 1 or 2 children have the highest poverty rate, with 101 households (14.7%) experiencing poverty. Likewise, among single-mother households, those with 5 or more children have the highest poverty rate, with 34 households (100.0%) falling below the poverty line.
| Children | Single Father | Single Mother |
| No Children | 39 (8.7%) | 98 (8.1%) |
| 1 or 2 Children | 101 (14.7%) | 724 (33.6%) |
| 3 or 4 Children | 8 (9.2%) | 335 (52.3%) |
| 5 or more Children | 0 (0.0%) | 34 (100.0%) |
| Total | 148 (12.0%) | 1,191 (29.4%) |
Income Below Poverty Among Married-Couple vs Single-Parent Households in Muskogee County
The poverty data for Muskogee County shows that 788 of the married-couple family households (7.0%) and 1,339 of the single-parent households (25.4%) are living below the poverty level. Within the married-couple family households, those with 5 or more children have the highest poverty rate, with 34 households (21.5%) falling below the poverty line. Among the single-parent households, those with 5 or more children have the highest poverty rate, with 34 household (69.4%) living below poverty.
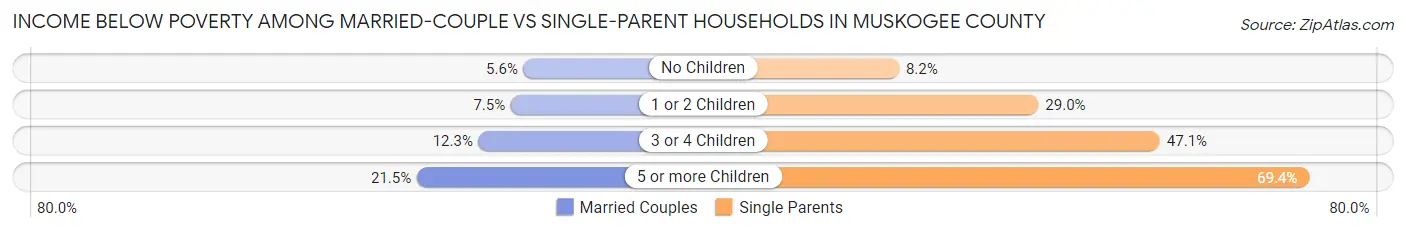
| Children | Married-Couple Families | Single-Parent Households |
| No Children | 380 (5.6%) | 137 (8.2%) |
| 1 or 2 Children | 255 (7.5%) | 825 (29.0%) |
| 3 or 4 Children | 119 (12.3%) | 343 (47.1%) |
| 5 or more Children | 34 (21.5%) | 34 (69.4%) |
| Total | 788 (7.0%) | 1,339 (25.4%) |
Employment Characteristics in Muskogee County
Employment by Class of Employer in Muskogee County
Among the 25,734 employed individuals in Muskogee County, private company employees (16,269 | 63.2%), federal government employees (2,243 | 8.7%), and local government employees (1,870 | 7.3%) make up the most common classes of employment.
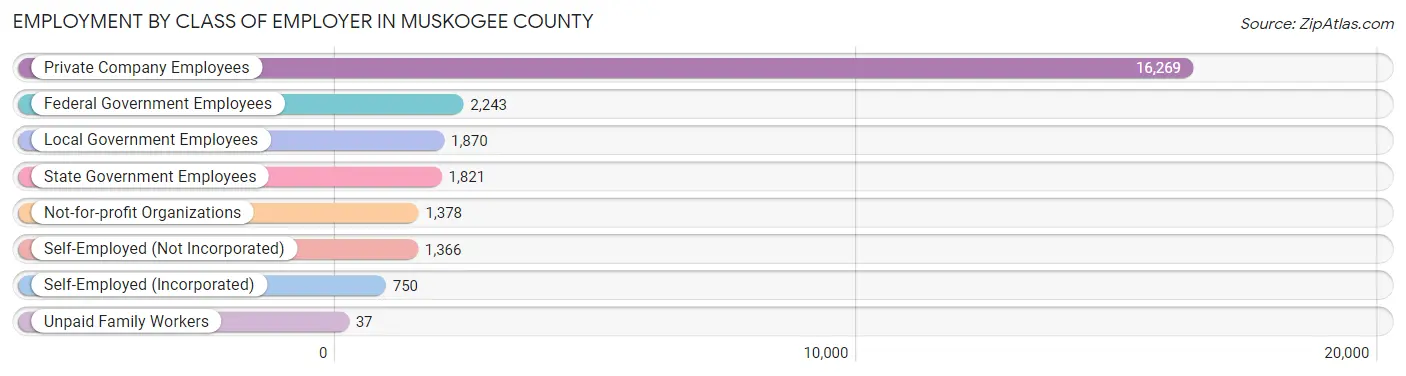
| Employer Class | # Employees | % Employees |
| Private Company Employees | 16,269 | 63.2% |
| Self-Employed (Incorporated) | 750 | 2.9% |
| Self-Employed (Not Incorporated) | 1,366 | 5.3% |
| Not-for-profit Organizations | 1,378 | 5.3% |
| Local Government Employees | 1,870 | 7.3% |
| State Government Employees | 1,821 | 7.1% |
| Federal Government Employees | 2,243 | 8.7% |
| Unpaid Family Workers | 37 | 0.1% |
| Total | 25,734 | 100.0% |
Employment Status by Age in Muskogee County
According to the labor force statistics for Muskogee County, out of the total population over 16 years of age (52,143), 53.5% or 27,897 individuals are in the labor force, with 5.7% or 1,590 of them unemployed. The age group with the highest labor force participation rate is 35 to 44 years, with 74.3% or 6,367 individuals in the labor force. Within the labor force, the 16 to 19 years age range has the highest percentage of unemployed individuals, with 13.0% or 168 of them being unemployed.
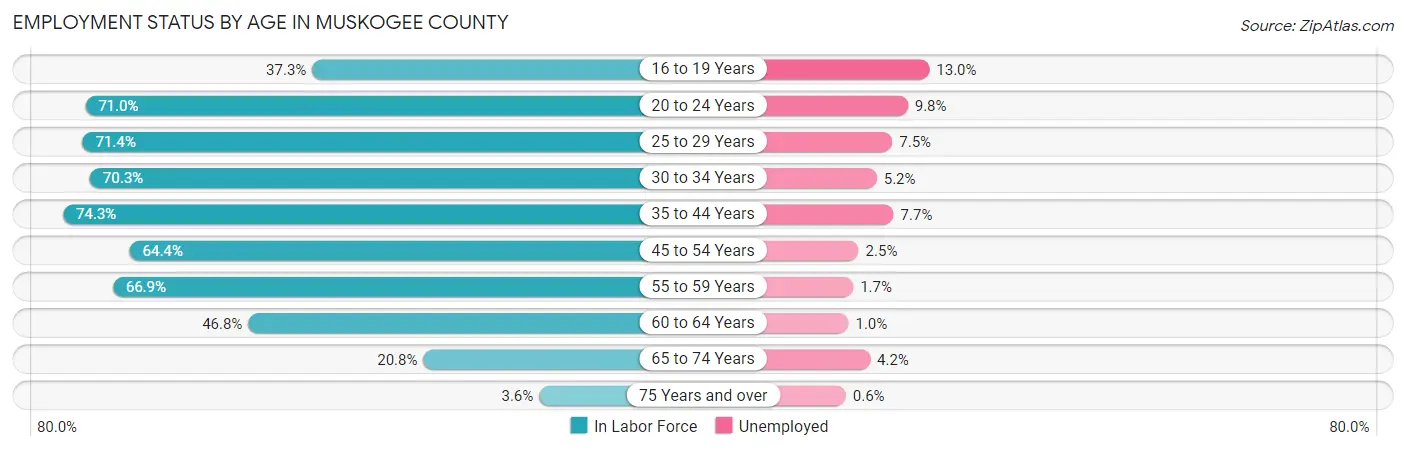
| Age Bracket | In Labor Force | Unemployed |
| 16 to 19 Years | 1,294 (37.3%) | 168 (13.0%) |
| 20 to 24 Years | 3,093 (71.0%) | 303 (9.8%) |
| 25 to 29 Years | 3,024 (71.4%) | 227 (7.5%) |
| 30 to 34 Years | 2,915 (70.3%) | 152 (5.2%) |
| 35 to 44 Years | 6,367 (74.3%) | 490 (7.7%) |
| 45 to 54 Years | 4,936 (64.4%) | 123 (2.5%) |
| 55 to 59 Years | 2,610 (66.9%) | 44 (1.7%) |
| 60 to 64 Years | 2,117 (46.8%) | 21 (1.0%) |
| 65 to 74 Years | 1,364 (20.8%) | 57 (4.2%) |
| 75 Years and over | 170 (3.6%) | 1 (0.6%) |
| Total | 27,897 (53.5%) | 1,590 (5.7%) |
Employment Status by Educational Attainment in Muskogee County
According to labor force statistics for Muskogee County, 66.5% of individuals (21,970) out of the total population between 25 and 64 years of age (33,038) are in the labor force, with 4.8% or 1,055 of them being unemployed. The group with the highest labor force participation rate are those with the educational attainment of bachelor's degree or higher, with 84.0% or 5,493 individuals in the labor force. Within the labor force, individuals with less than high school education have the highest percentage of unemployment, with 11.5% or 246 of them being unemployed.
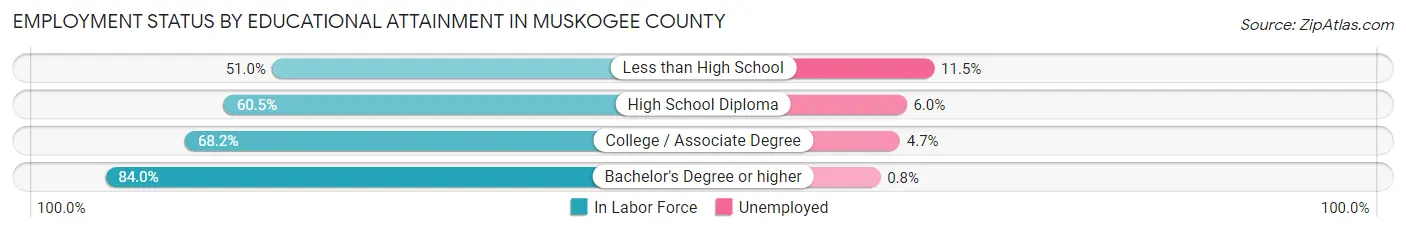
| Educational Attainment | In Labor Force | Unemployed |
| Less than High School | 2,141 (51.0%) | 483 (11.5%) |
| High School Diploma | 6,961 (60.5%) | 690 (6.0%) |
| College / Associate Degree | 7,363 (68.2%) | 507 (4.7%) |
| Bachelor's Degree or higher | 5,493 (84.0%) | 52 (0.8%) |
| Total | 21,970 (66.5%) | 1,586 (4.8%) |
Employment Occupations by Sex in Muskogee County
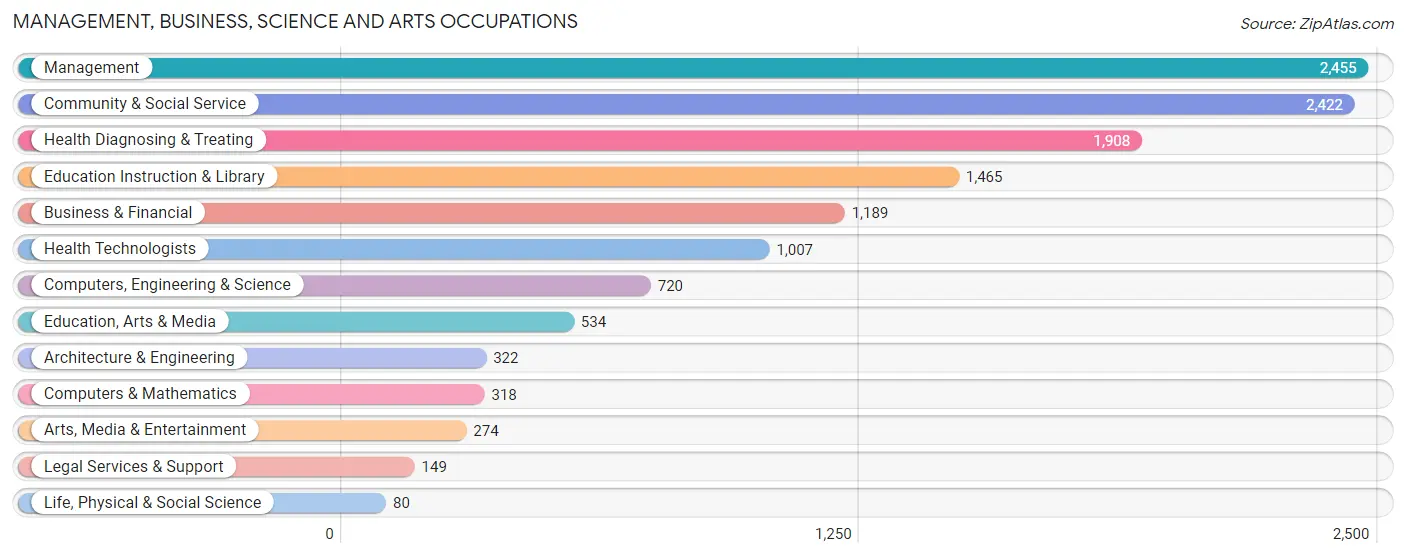
Management, Business, Science and Arts Occupations
The most common Management, Business, Science and Arts occupations in Muskogee County are Management (2,455 | 9.3%), Community & Social Service (2,422 | 9.2%), Health Diagnosing & Treating (1,908 | 7.3%), Education Instruction & Library (1,465 | 5.6%), and Business & Financial (1,189 | 4.5%).
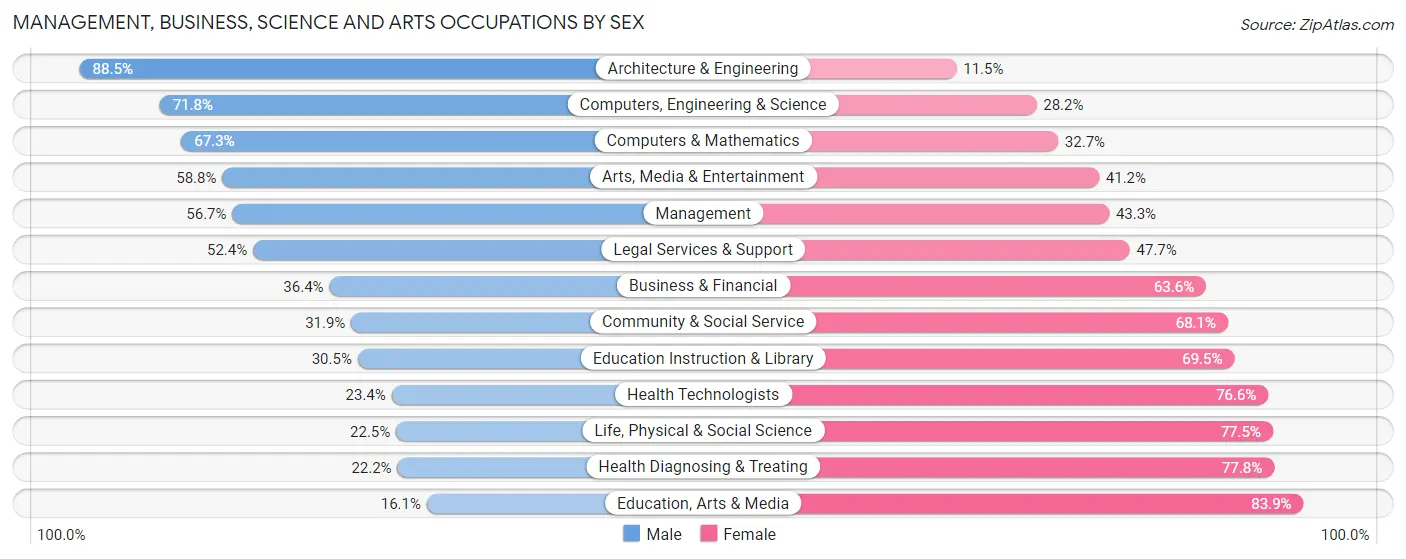
Management, Business, Science and Arts Occupations by Sex
Within the Management, Business, Science and Arts occupations in Muskogee County, the most male-oriented occupations are Architecture & Engineering (88.5%), Computers, Engineering & Science (71.8%), and Computers & Mathematics (67.3%), while the most female-oriented occupations are Education, Arts & Media (83.9%), Health Diagnosing & Treating (77.8%), and Life, Physical & Social Science (77.5%).
| Occupation | Male | Female |
| Management | 1,391 (56.7%) | 1,064 (43.3%) |
| Business & Financial | 433 (36.4%) | 756 (63.6%) |
| Computers, Engineering & Science | 517 (71.8%) | 203 (28.2%) |
| Computers & Mathematics | 214 (67.3%) | 104 (32.7%) |
| Architecture & Engineering | 285 (88.5%) | 37 (11.5%) |
| Life, Physical & Social Science | 18 (22.5%) | 62 (77.5%) |
| Community & Social Service | 772 (31.9%) | 1,650 (68.1%) |
| Education, Arts & Media | 86 (16.1%) | 448 (83.9%) |
| Legal Services & Support | 78 (52.3%) | 71 (47.6%) |
| Education Instruction & Library | 447 (30.5%) | 1,018 (69.5%) |
| Arts, Media & Entertainment | 161 (58.8%) | 113 (41.2%) |
| Health Diagnosing & Treating | 424 (22.2%) | 1,484 (77.8%) |
| Health Technologists | 236 (23.4%) | 771 (76.6%) |
| Total (Category) | 3,537 (40.7%) | 5,157 (59.3%) |
| Total (Overall) | 13,634 (51.9%) | 12,652 (48.1%) |
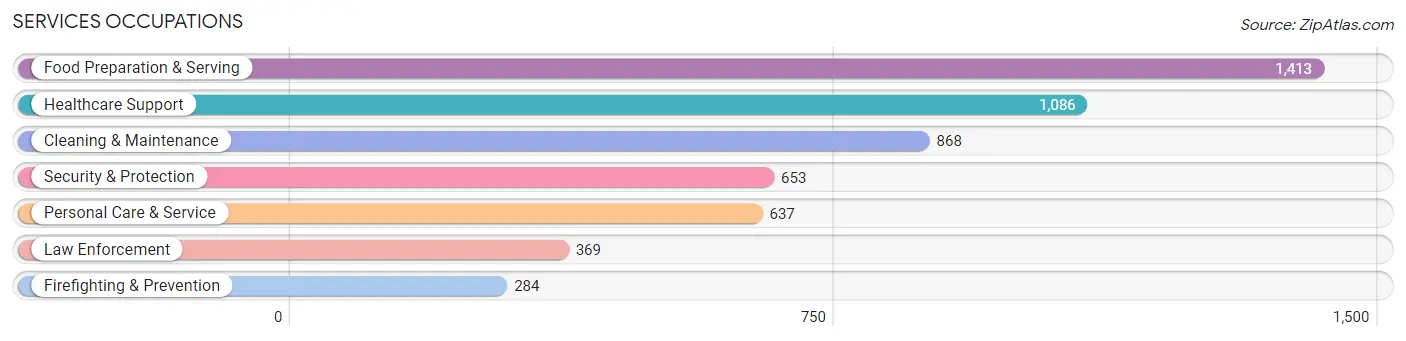
Services Occupations
The most common Services occupations in Muskogee County are Food Preparation & Serving (1,413 | 5.4%), Healthcare Support (1,086 | 4.1%), Cleaning & Maintenance (868 | 3.3%), Security & Protection (653 | 2.5%), and Personal Care & Service (637 | 2.4%).
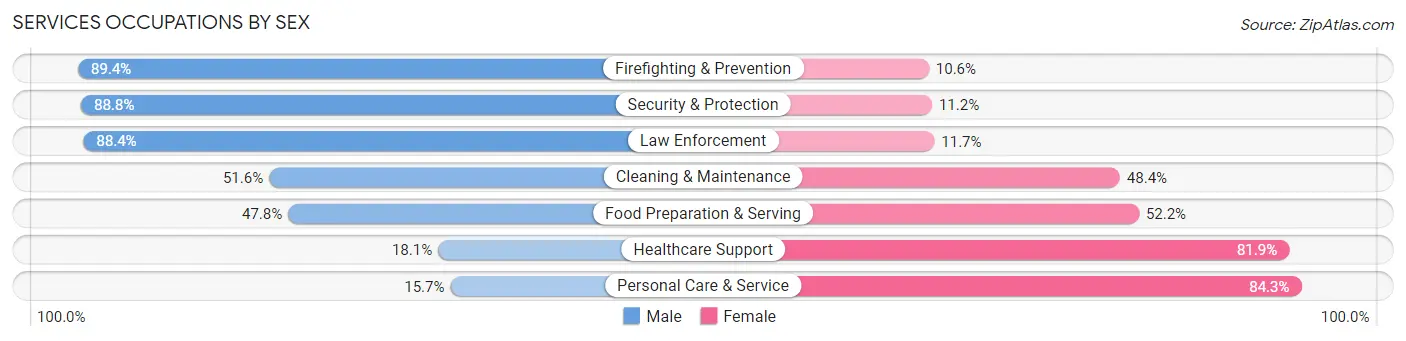
Services Occupations by Sex
Within the Services occupations in Muskogee County, the most male-oriented occupations are Firefighting & Prevention (89.4%), Security & Protection (88.8%), and Law Enforcement (88.3%), while the most female-oriented occupations are Personal Care & Service (84.3%), Healthcare Support (81.9%), and Food Preparation & Serving (52.2%).
| Occupation | Male | Female |
| Healthcare Support | 197 (18.1%) | 889 (81.9%) |
| Security & Protection | 580 (88.8%) | 73 (11.2%) |
| Firefighting & Prevention | 254 (89.4%) | 30 (10.6%) |
| Law Enforcement | 326 (88.3%) | 43 (11.7%) |
| Food Preparation & Serving | 676 (47.8%) | 737 (52.2%) |
| Cleaning & Maintenance | 448 (51.6%) | 420 (48.4%) |
| Personal Care & Service | 100 (15.7%) | 537 (84.3%) |
| Total (Category) | 2,001 (43.0%) | 2,656 (57.0%) |
| Total (Overall) | 13,634 (51.9%) | 12,652 (48.1%) |
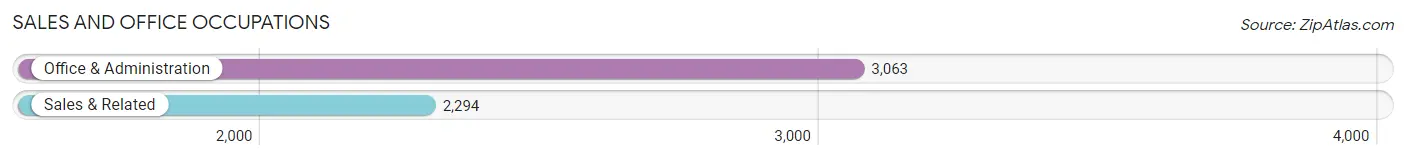
Sales and Office Occupations
The most common Sales and Office occupations in Muskogee County are Office & Administration (3,063 | 11.7%), and Sales & Related (2,294 | 8.7%).
Sales and Office Occupations by Sex
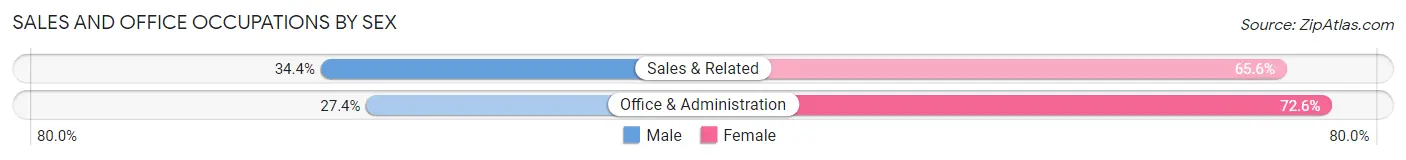
| Occupation | Male | Female |
| Sales & Related | 790 (34.4%) | 1,504 (65.6%) |
| Office & Administration | 840 (27.4%) | 2,223 (72.6%) |
| Total (Category) | 1,630 (30.4%) | 3,727 (69.6%) |
| Total (Overall) | 13,634 (51.9%) | 12,652 (48.1%) |
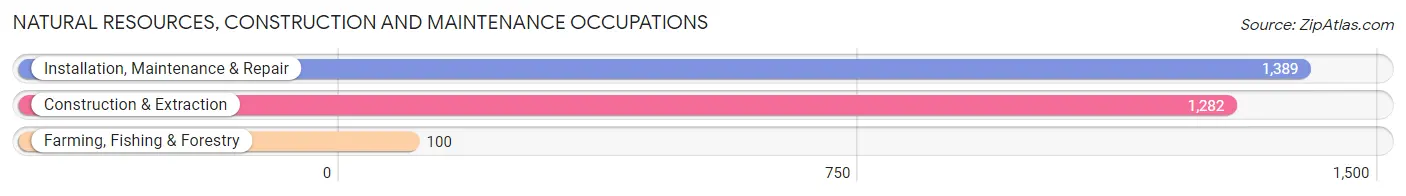
Natural Resources, Construction and Maintenance Occupations
The most common Natural Resources, Construction and Maintenance occupations in Muskogee County are Installation, Maintenance & Repair (1,389 | 5.3%), Construction & Extraction (1,282 | 4.9%), and Farming, Fishing & Forestry (100 | 0.4%).
Natural Resources, Construction and Maintenance Occupations by Sex
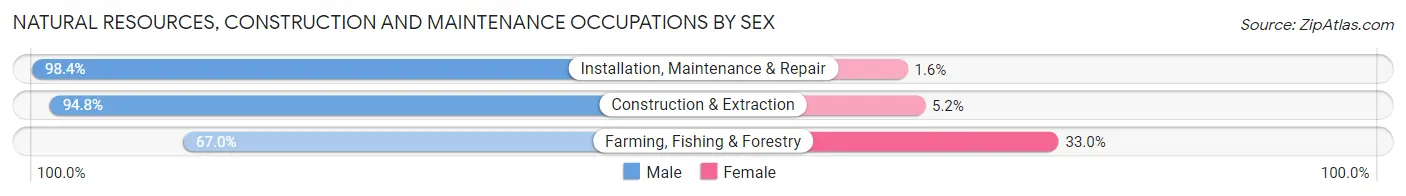
| Occupation | Male | Female |
| Farming, Fishing & Forestry | 67 (67.0%) | 33 (33.0%) |
| Construction & Extraction | 1,215 (94.8%) | 67 (5.2%) |
| Installation, Maintenance & Repair | 1,367 (98.4%) | 22 (1.6%) |
| Total (Category) | 2,649 (95.6%) | 122 (4.4%) |
| Total (Overall) | 13,634 (51.9%) | 12,652 (48.1%) |
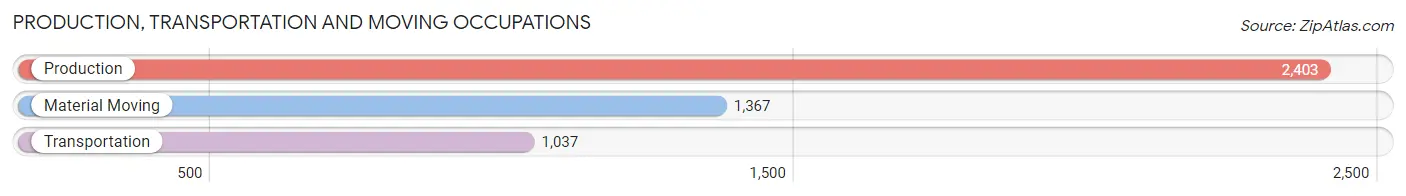
Production, Transportation and Moving Occupations
The most common Production, Transportation and Moving occupations in Muskogee County are Production (2,403 | 9.1%), Material Moving (1,367 | 5.2%), and Transportation (1,037 | 4.0%).
Production, Transportation and Moving Occupations by Sex
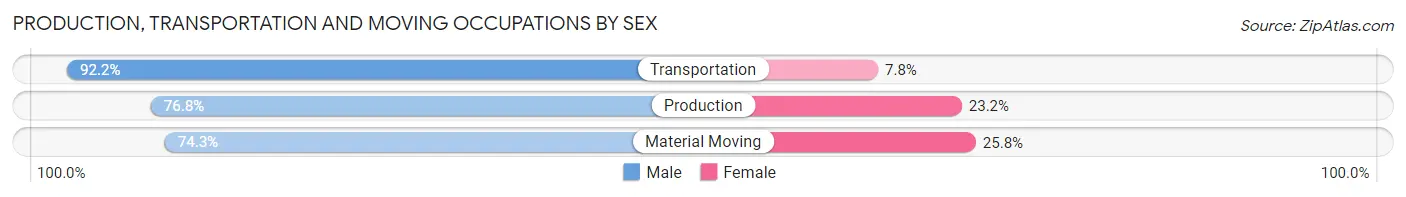
| Occupation | Male | Female |
| Production | 1,846 (76.8%) | 557 (23.2%) |
| Transportation | 956 (92.2%) | 81 (7.8%) |
| Material Moving | 1,015 (74.3%) | 352 (25.8%) |
| Total (Category) | 3,817 (79.4%) | 990 (20.6%) |
| Total (Overall) | 13,634 (51.9%) | 12,652 (48.1%) |
Employment Industries by Sex in Muskogee County
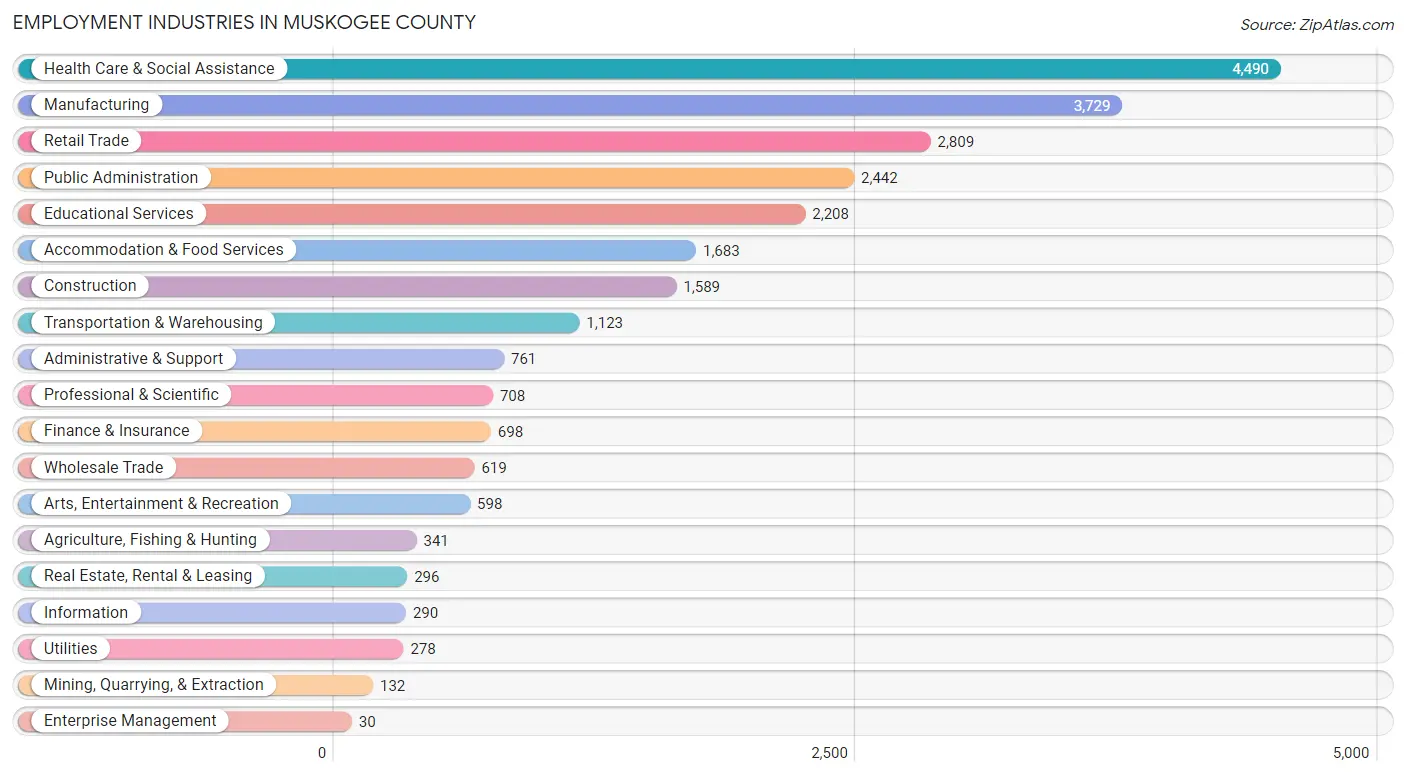
Employment Industries in Muskogee County
The major employment industries in Muskogee County include Health Care & Social Assistance (4,490 | 17.1%), Manufacturing (3,729 | 14.2%), Retail Trade (2,809 | 10.7%), Public Administration (2,442 | 9.3%), and Educational Services (2,208 | 8.4%).
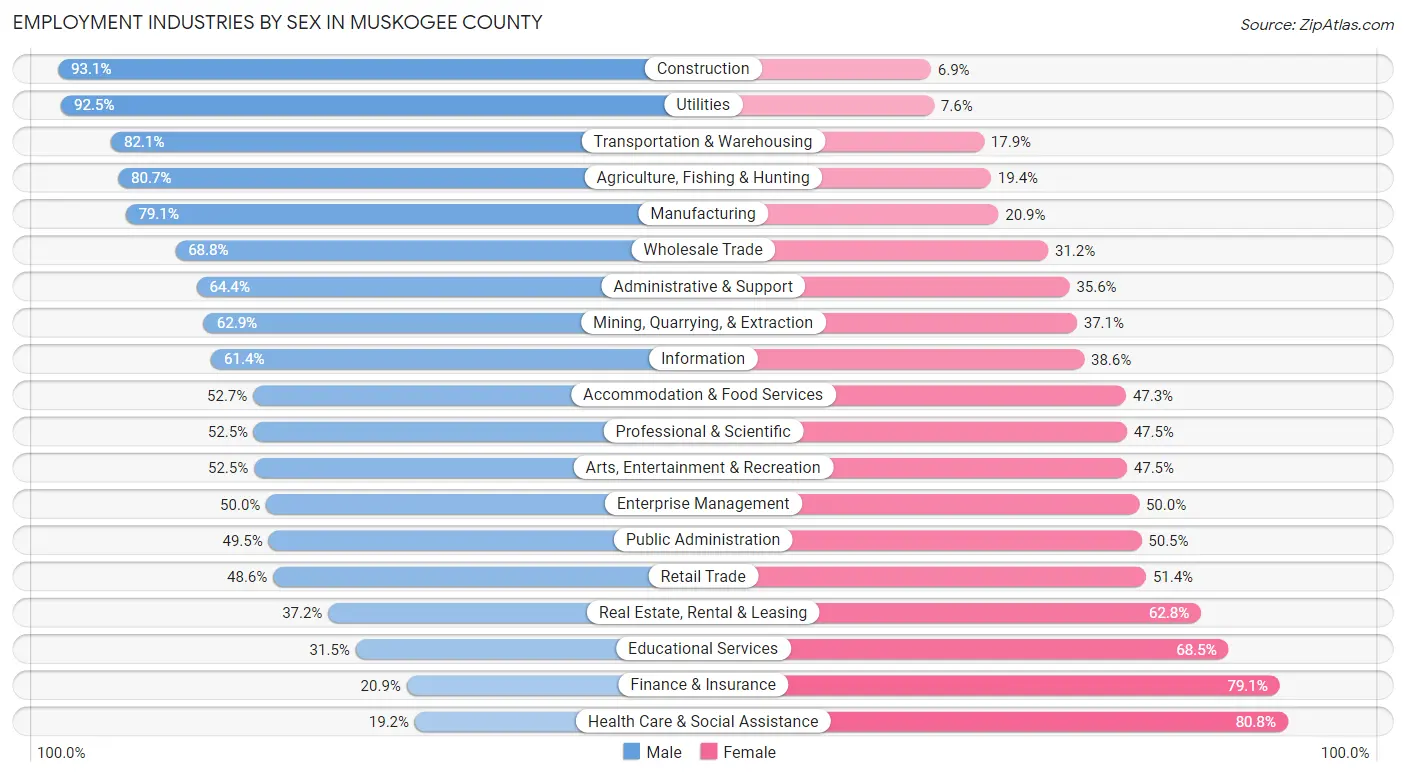
Employment Industries by Sex in Muskogee County
The Muskogee County industries that see more men than women are Construction (93.1%), Utilities (92.4%), and Transportation & Warehousing (82.1%), whereas the industries that tend to have a higher number of women are Health Care & Social Assistance (80.8%), Finance & Insurance (79.1%), and Educational Services (68.5%).
| Industry | Male | Female |
| Agriculture, Fishing & Hunting | 275 (80.6%) | 66 (19.4%) |
| Mining, Quarrying, & Extraction | 83 (62.9%) | 49 (37.1%) |
| Construction | 1,479 (93.1%) | 110 (6.9%) |
| Manufacturing | 2,950 (79.1%) | 779 (20.9%) |
| Wholesale Trade | 426 (68.8%) | 193 (31.2%) |
| Retail Trade | 1,364 (48.6%) | 1,445 (51.4%) |
| Transportation & Warehousing | 922 (82.1%) | 201 (17.9%) |
| Utilities | 257 (92.4%) | 21 (7.5%) |
| Information | 178 (61.4%) | 112 (38.6%) |
| Finance & Insurance | 146 (20.9%) | 552 (79.1%) |
| Real Estate, Rental & Leasing | 110 (37.2%) | 186 (62.8%) |
| Professional & Scientific | 372 (52.5%) | 336 (47.5%) |
| Enterprise Management | 15 (50.0%) | 15 (50.0%) |
| Administrative & Support | 490 (64.4%) | 271 (35.6%) |
| Educational Services | 695 (31.5%) | 1,513 (68.5%) |
| Health Care & Social Assistance | 863 (19.2%) | 3,627 (80.8%) |
| Arts, Entertainment & Recreation | 314 (52.5%) | 284 (47.5%) |
| Accommodation & Food Services | 887 (52.7%) | 796 (47.3%) |
| Public Administration | 1,209 (49.5%) | 1,233 (50.5%) |
| Total | 13,634 (51.9%) | 12,652 (48.1%) |
Education in Muskogee County
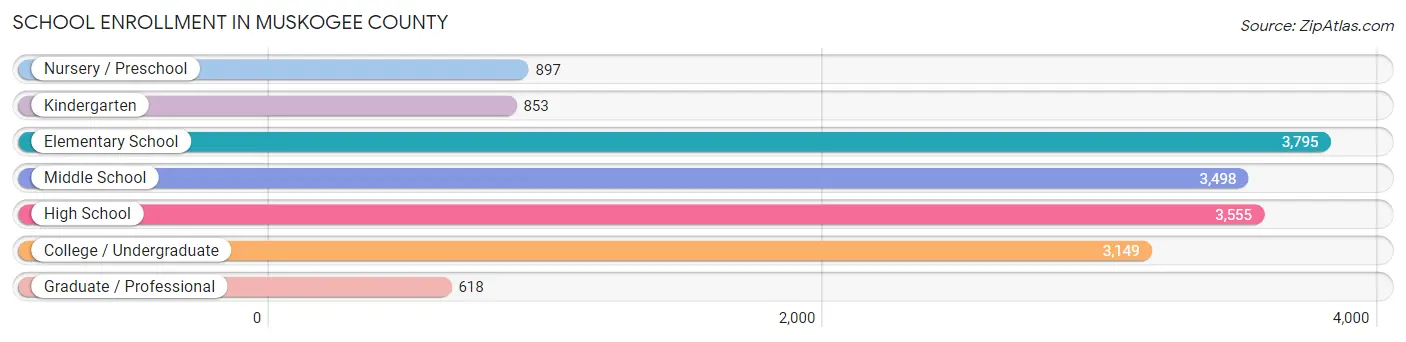
School Enrollment in Muskogee County
The most common levels of schooling among the 16,365 students in Muskogee County are elementary school (3,795 | 23.2%), high school (3,555 | 21.7%), and middle school (3,498 | 21.4%).
| School Level | # Students | % Students |
| Nursery / Preschool | 897 | 5.5% |
| Kindergarten | 853 | 5.2% |
| Elementary School | 3,795 | 23.2% |
| Middle School | 3,498 | 21.4% |
| High School | 3,555 | 21.7% |
| College / Undergraduate | 3,149 | 19.2% |
| Graduate / Professional | 618 | 3.8% |
| Total | 16,365 | 100.0% |
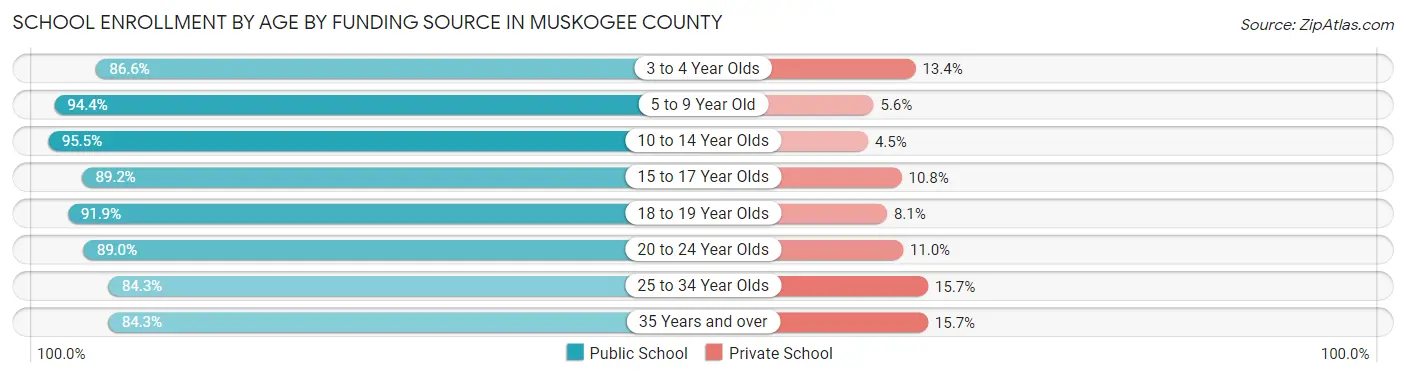
School Enrollment by Age by Funding Source in Muskogee County
Out of a total of 16,365 students who are enrolled in schools in Muskogee County, 1,358 (8.3%) attend a private institution, while the remaining 15,007 (91.7%) are enrolled in public schools. The age group of 25 to 34 year olds has the highest likelihood of being enrolled in private schools, with 129 (15.7% in the age bracket) enrolled. Conversely, the age group of 10 to 14 year olds has the lowest likelihood of being enrolled in a private school, with 4,059 (95.5% in the age bracket) attending a public institution.
| Age Bracket | Public School | Private School |
| 3 to 4 Year Olds | 576 (86.6%) | 89 (13.4%) |
| 5 to 9 Year Old | 4,024 (94.4%) | 237 (5.6%) |
| 10 to 14 Year Olds | 4,059 (95.5%) | 192 (4.5%) |
| 15 to 17 Year Olds | 2,292 (89.2%) | 277 (10.8%) |
| 18 to 19 Year Olds | 1,266 (91.9%) | 111 (8.1%) |
| 20 to 24 Year Olds | 1,184 (89.0%) | 147 (11.0%) |
| 25 to 34 Year Olds | 692 (84.3%) | 129 (15.7%) |
| 35 Years and over | 919 (84.3%) | 171 (15.7%) |
| Total | 15,007 (91.7%) | 1,358 (8.3%) |
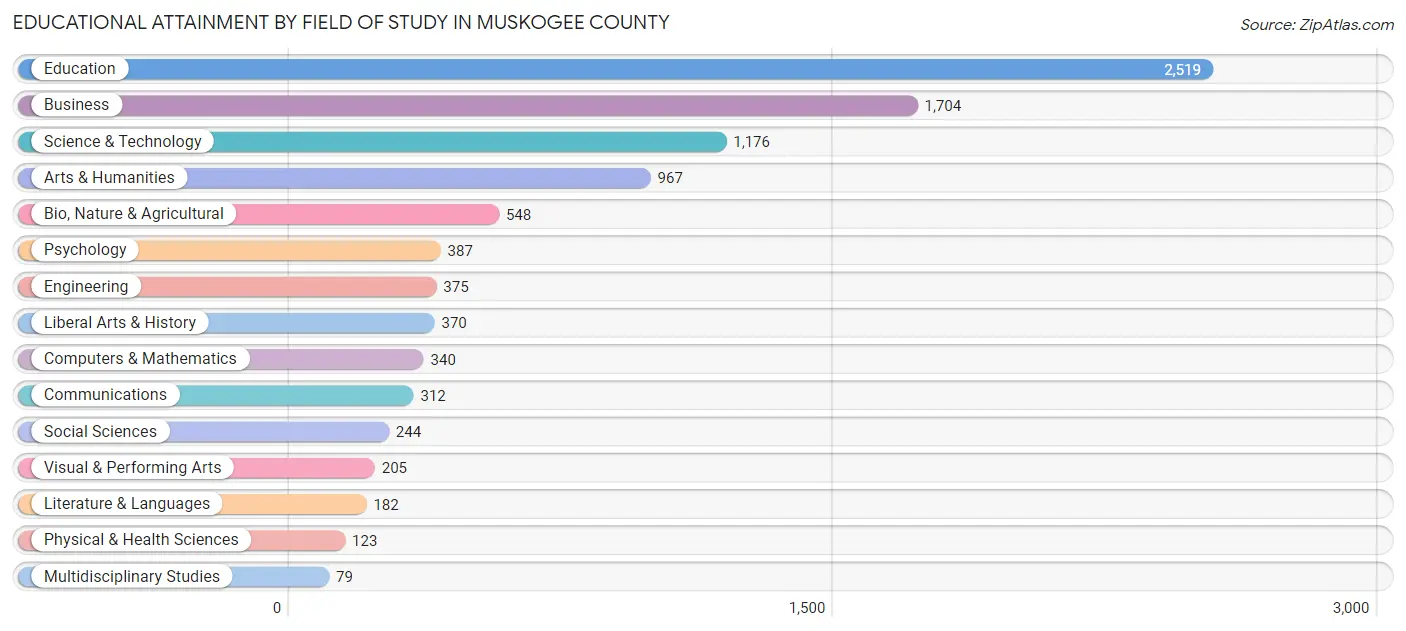
Educational Attainment by Field of Study in Muskogee County
Education (2,519 | 26.4%), business (1,704 | 17.9%), science & technology (1,176 | 12.3%), arts & humanities (967 | 10.2%), and bio, nature & agricultural (548 | 5.8%) are the most common fields of study among 9,531 individuals in Muskogee County who have obtained a bachelor's degree or higher.
| Field of Study | # Graduates | % Graduates |
| Computers & Mathematics | 340 | 3.6% |
| Bio, Nature & Agricultural | 548 | 5.8% |
| Physical & Health Sciences | 123 | 1.3% |
| Psychology | 387 | 4.1% |
| Social Sciences | 244 | 2.6% |
| Engineering | 375 | 3.9% |
| Multidisciplinary Studies | 79 | 0.8% |
| Science & Technology | 1,176 | 12.3% |
| Business | 1,704 | 17.9% |
| Education | 2,519 | 26.4% |
| Literature & Languages | 182 | 1.9% |
| Liberal Arts & History | 370 | 3.9% |
| Visual & Performing Arts | 205 | 2.1% |
| Communications | 312 | 3.3% |
| Arts & Humanities | 967 | 10.2% |
| Total | 9,531 | 100.0% |
Transportation & Commute in Muskogee County
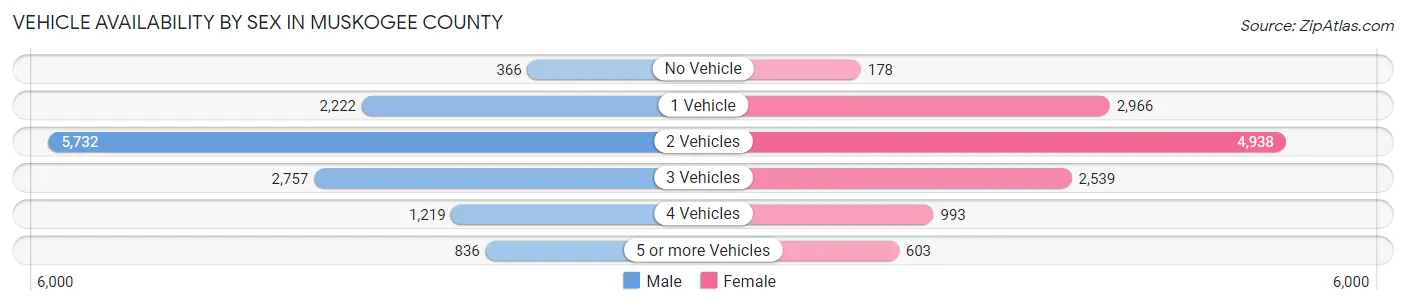
Vehicle Availability by Sex in Muskogee County
The most prevalent vehicle ownership categories in Muskogee County are males with 2 vehicles (5,732, accounting for 43.6%) and females with 2 vehicles (4,938, making up 46.9%).
| Vehicles Available | Male | Female |
| No Vehicle | 366 (2.8%) | 178 (1.5%) |
| 1 Vehicle | 2,222 (16.9%) | 2,966 (24.3%) |
| 2 Vehicles | 5,732 (43.6%) | 4,938 (40.4%) |
| 3 Vehicles | 2,757 (21.0%) | 2,539 (20.8%) |
| 4 Vehicles | 1,219 (9.3%) | 993 (8.1%) |
| 5 or more Vehicles | 836 (6.4%) | 603 (4.9%) |
| Total | 13,132 (100.0%) | 12,217 (100.0%) |
Commute Time in Muskogee County
The most frequently occuring commute durations in Muskogee County are 15 to 19 minutes (4,802 commuters, 19.9%), 10 to 14 minutes (4,373 commuters, 18.1%), and 5 to 9 minutes (3,693 commuters, 15.3%).
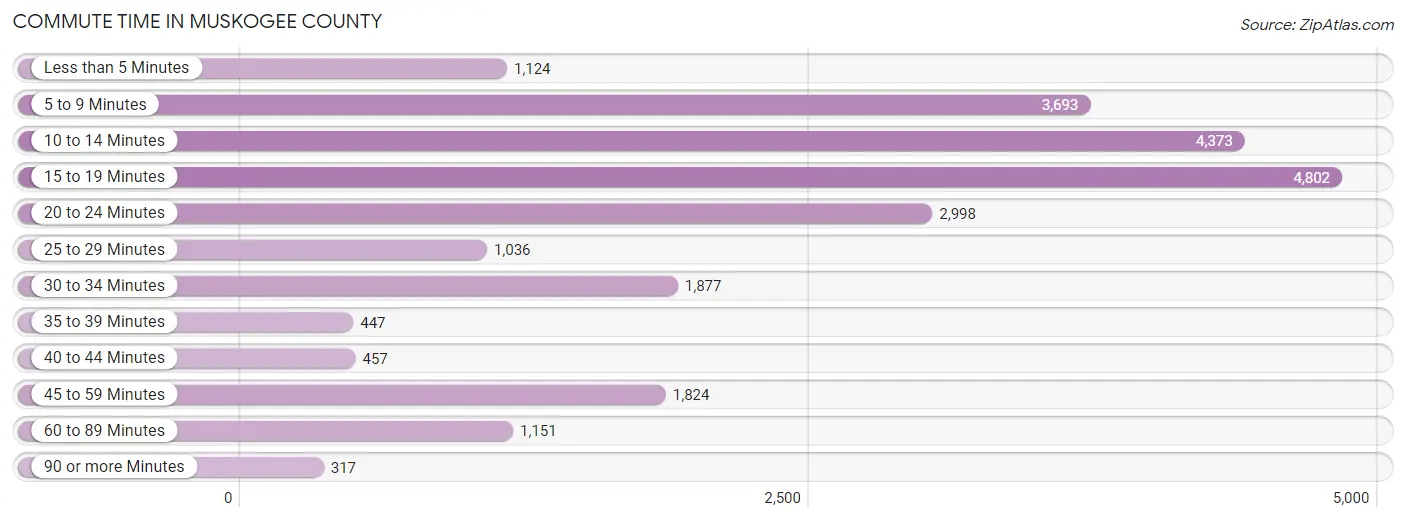
| Commute Time | # Commuters | % Commuters |
| Less than 5 Minutes | 1,124 | 4.7% |
| 5 to 9 Minutes | 3,693 | 15.3% |
| 10 to 14 Minutes | 4,373 | 18.1% |
| 15 to 19 Minutes | 4,802 | 19.9% |
| 20 to 24 Minutes | 2,998 | 12.4% |
| 25 to 29 Minutes | 1,036 | 4.3% |
| 30 to 34 Minutes | 1,877 | 7.8% |
| 35 to 39 Minutes | 447 | 1.8% |
| 40 to 44 Minutes | 457 | 1.9% |
| 45 to 59 Minutes | 1,824 | 7.6% |
| 60 to 89 Minutes | 1,151 | 4.8% |
| 90 or more Minutes | 317 | 1.3% |
Commute Time by Sex in Muskogee County
The most common commute times in Muskogee County are 15 to 19 minutes (2,480 commuters, 19.7%) for males and 15 to 19 minutes (2,322 commuters, 20.2%) for females.
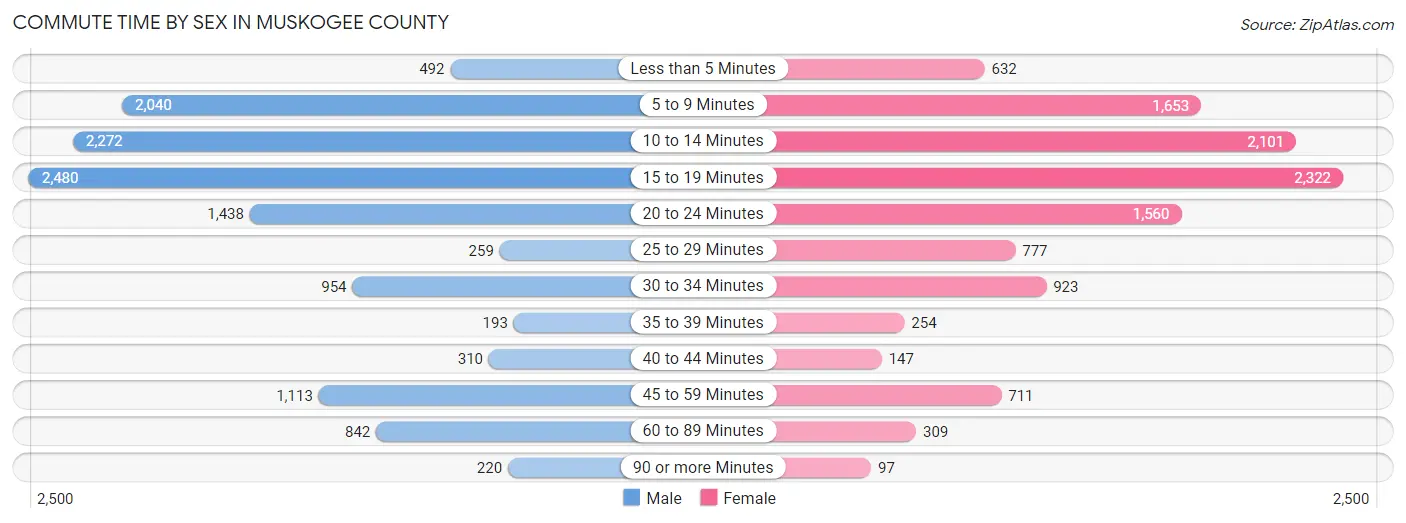
| Commute Time | Male | Female |
| Less than 5 Minutes | 492 (3.9%) | 632 (5.5%) |
| 5 to 9 Minutes | 2,040 (16.2%) | 1,653 (14.4%) |
| 10 to 14 Minutes | 2,272 (18.0%) | 2,101 (18.3%) |
| 15 to 19 Minutes | 2,480 (19.7%) | 2,322 (20.2%) |
| 20 to 24 Minutes | 1,438 (11.4%) | 1,560 (13.6%) |
| 25 to 29 Minutes | 259 (2.1%) | 777 (6.8%) |
| 30 to 34 Minutes | 954 (7.6%) | 923 (8.0%) |
| 35 to 39 Minutes | 193 (1.5%) | 254 (2.2%) |
| 40 to 44 Minutes | 310 (2.5%) | 147 (1.3%) |
| 45 to 59 Minutes | 1,113 (8.8%) | 711 (6.2%) |
| 60 to 89 Minutes | 842 (6.7%) | 309 (2.7%) |
| 90 or more Minutes | 220 (1.7%) | 97 (0.8%) |
Time of Departure to Work by Sex in Muskogee County
The most frequent times of departure to work in Muskogee County are 7:00 AM to 7:29 AM (1,597, 12.7%) for males and 7:00 AM to 7:29 AM (2,019, 17.6%) for females.
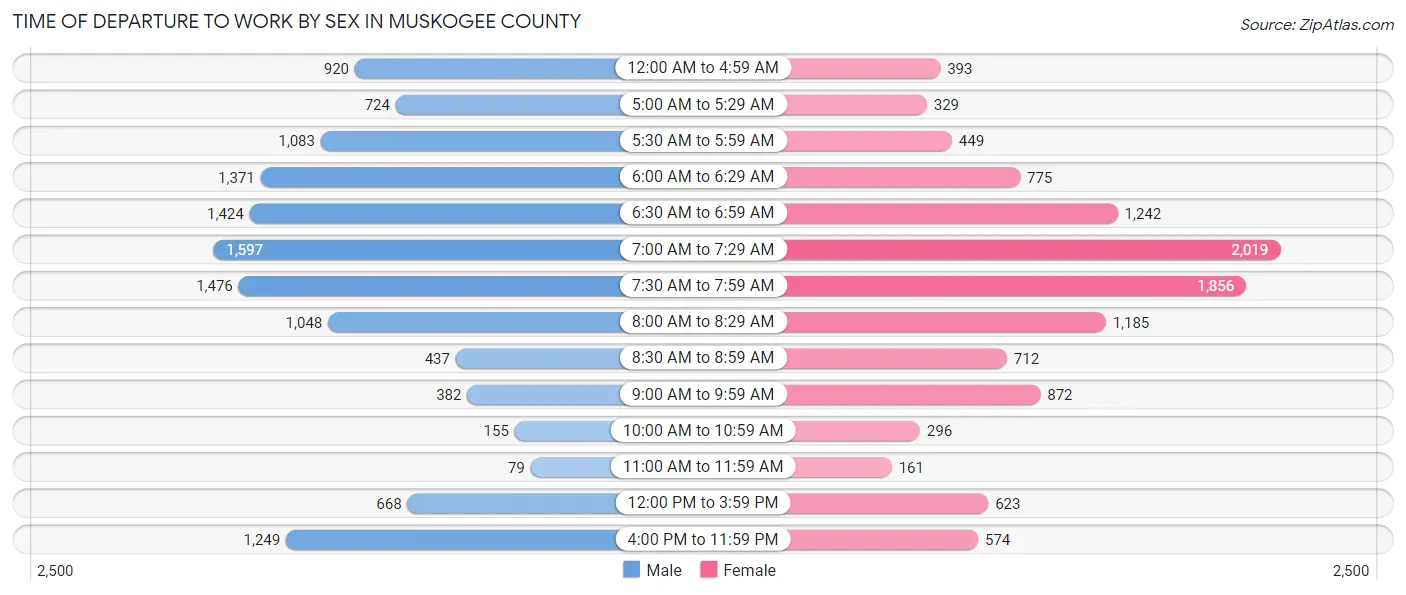
| Time of Departure | Male | Female |
| 12:00 AM to 4:59 AM | 920 (7.3%) | 393 (3.4%) |
| 5:00 AM to 5:29 AM | 724 (5.7%) | 329 (2.9%) |
| 5:30 AM to 5:59 AM | 1,083 (8.6%) | 449 (3.9%) |
| 6:00 AM to 6:29 AM | 1,371 (10.9%) | 775 (6.8%) |
| 6:30 AM to 6:59 AM | 1,424 (11.3%) | 1,242 (10.8%) |
| 7:00 AM to 7:29 AM | 1,597 (12.7%) | 2,019 (17.6%) |
| 7:30 AM to 7:59 AM | 1,476 (11.7%) | 1,856 (16.2%) |
| 8:00 AM to 8:29 AM | 1,048 (8.3%) | 1,185 (10.3%) |
| 8:30 AM to 8:59 AM | 437 (3.5%) | 712 (6.2%) |
| 9:00 AM to 9:59 AM | 382 (3.0%) | 872 (7.6%) |
| 10:00 AM to 10:59 AM | 155 (1.2%) | 296 (2.6%) |
| 11:00 AM to 11:59 AM | 79 (0.6%) | 161 (1.4%) |
| 12:00 PM to 3:59 PM | 668 (5.3%) | 623 (5.4%) |
| 4:00 PM to 11:59 PM | 1,249 (9.9%) | 574 (5.0%) |
| Total | 12,613 (100.0%) | 11,486 (100.0%) |
Housing Occupancy in Muskogee County
Occupancy by Ownership in Muskogee County
Of the total 25,598 dwellings in Muskogee County, owner-occupied units account for 17,081 (66.7%), while renter-occupied units make up 8,517 (33.3%).
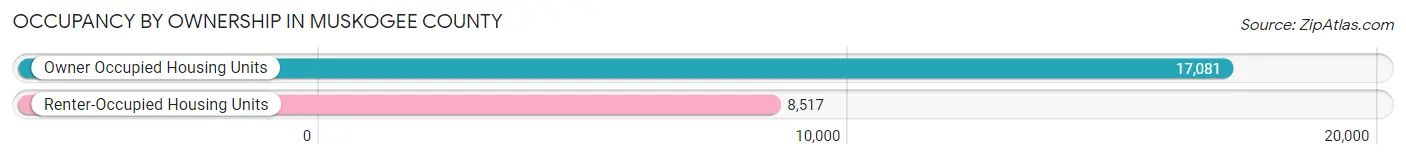
| Occupancy | # Housing Units | % Housing Units |
| Owner Occupied Housing Units | 17,081 | 66.7% |
| Renter-Occupied Housing Units | 8,517 | 33.3% |
| Total Occupied Housing Units | 25,598 | 100.0% |
Occupancy by Household Size in Muskogee County
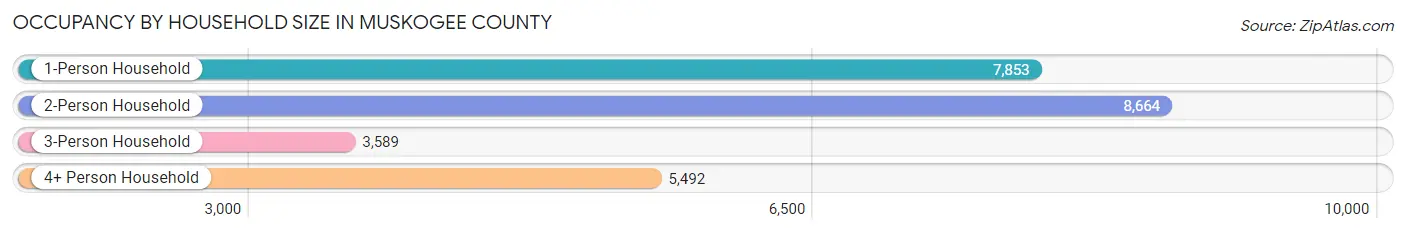
| Household Size | # Housing Units | % Housing Units |
| 1-Person Household | 7,853 | 30.7% |
| 2-Person Household | 8,664 | 33.9% |
| 3-Person Household | 3,589 | 14.0% |
| 4+ Person Household | 5,492 | 21.4% |
| Total Housing Units | 25,598 | 100.0% |
Occupancy by Ownership by Household Size in Muskogee County
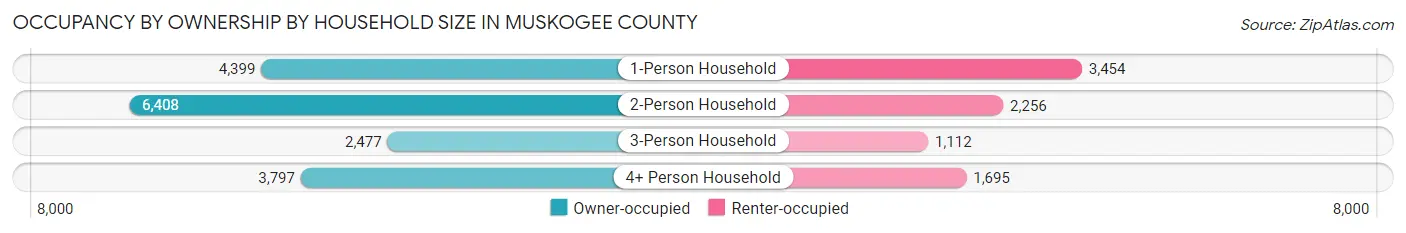
| Household Size | Owner-occupied | Renter-occupied |
| 1-Person Household | 4,399 (56.0%) | 3,454 (44.0%) |
| 2-Person Household | 6,408 (74.0%) | 2,256 (26.0%) |
| 3-Person Household | 2,477 (69.0%) | 1,112 (31.0%) |
| 4+ Person Household | 3,797 (69.1%) | 1,695 (30.9%) |
| Total Housing Units | 17,081 (66.7%) | 8,517 (33.3%) |
Occupancy by Educational Attainment in Muskogee County
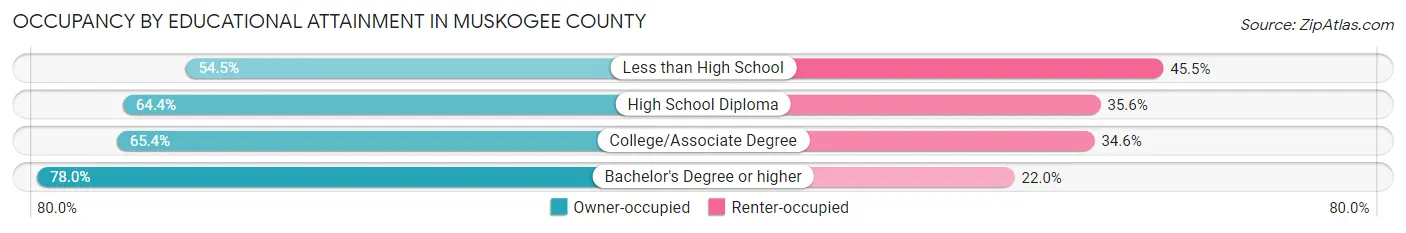
| Household Size | Owner-occupied | Renter-occupied |
| Less than High School | 1,525 (54.5%) | 1,275 (45.5%) |
| High School Diploma | 5,148 (64.4%) | 2,845 (35.6%) |
| College/Associate Degree | 5,909 (65.4%) | 3,130 (34.6%) |
| Bachelor's Degree or higher | 4,499 (78.0%) | 1,267 (22.0%) |
Occupancy by Age of Householder in Muskogee County
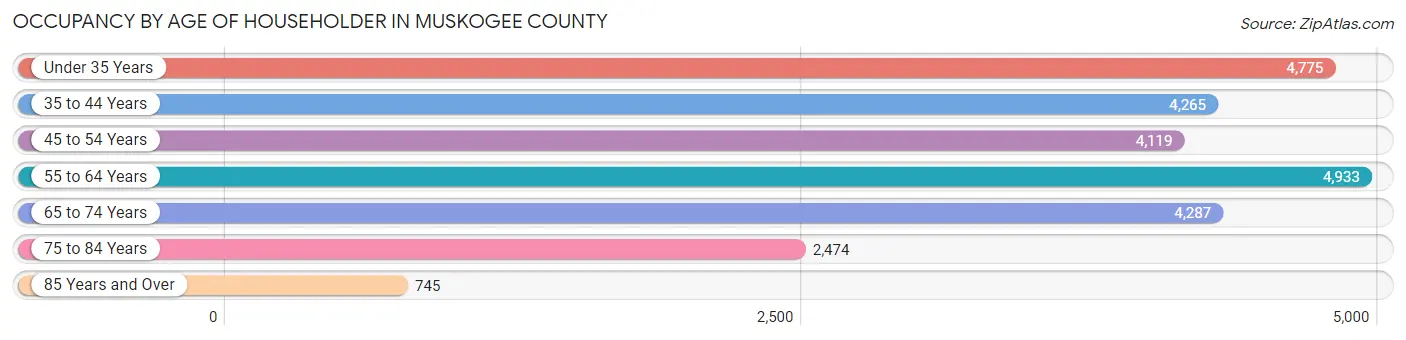
| Age Bracket | # Households | % Households |
| Under 35 Years | 4,775 | 18.6% |
| 35 to 44 Years | 4,265 | 16.7% |
| 45 to 54 Years | 4,119 | 16.1% |
| 55 to 64 Years | 4,933 | 19.3% |
| 65 to 74 Years | 4,287 | 16.8% |
| 75 to 84 Years | 2,474 | 9.7% |
| 85 Years and Over | 745 | 2.9% |
| Total | 25,598 | 100.0% |
Housing Finances in Muskogee County
Median Income by Occupancy in Muskogee County
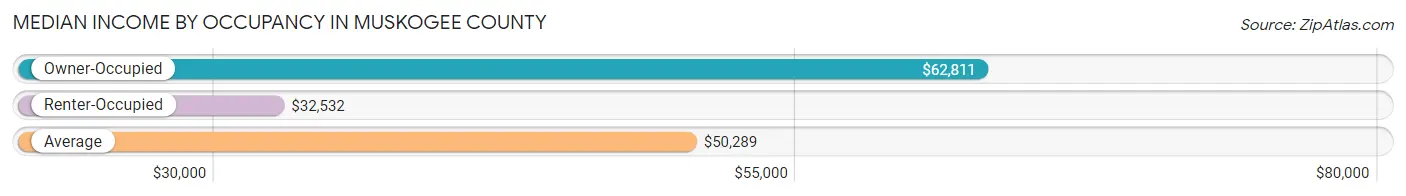
| Occupancy Type | # Households | Median Income |
| Owner-Occupied | 17,081 (66.7%) | $62,811 |
| Renter-Occupied | 8,517 (33.3%) | $32,532 |
| Average | 25,598 (100.0%) | $50,289 |
Occupancy by Householder Income Bracket in Muskogee County
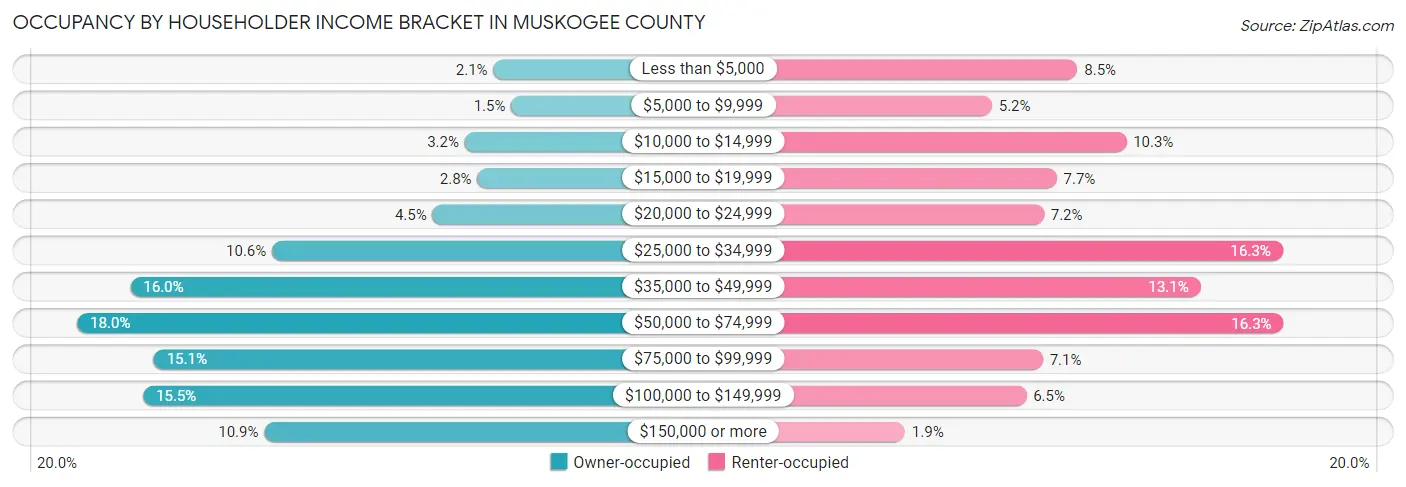
| Income Bracket | Owner-occupied | Renter-occupied |
| Less than $5,000 | 365 (2.1%) | 720 (8.5%) |
| $5,000 to $9,999 | 249 (1.5%) | 442 (5.2%) |
| $10,000 to $14,999 | 551 (3.2%) | 878 (10.3%) |
| $15,000 to $19,999 | 469 (2.8%) | 652 (7.7%) |
| $20,000 to $24,999 | 761 (4.5%) | 611 (7.2%) |
| $25,000 to $34,999 | 1,806 (10.6%) | 1,386 (16.3%) |
| $35,000 to $49,999 | 2,727 (16.0%) | 1,119 (13.1%) |
| $50,000 to $74,999 | 3,075 (18.0%) | 1,388 (16.3%) |
| $75,000 to $99,999 | 2,576 (15.1%) | 607 (7.1%) |
| $100,000 to $149,999 | 2,646 (15.5%) | 554 (6.5%) |
| $150,000 or more | 1,856 (10.9%) | 160 (1.9%) |
| Total | 17,081 (100.0%) | 8,517 (100.0%) |
Monthly Housing Cost Tiers in Muskogee County
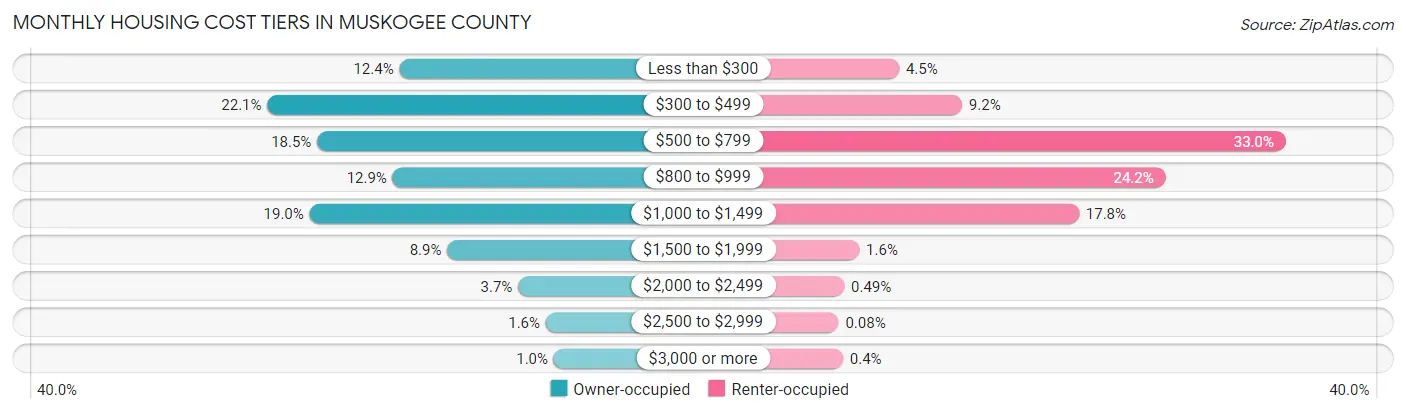
| Monthly Cost | Owner-occupied | Renter-occupied |
| Less than $300 | 2,116 (12.4%) | 386 (4.5%) |
| $300 to $499 | 3,778 (22.1%) | 781 (9.2%) |
| $500 to $799 | 3,152 (18.4%) | 2,812 (33.0%) |
| $800 to $999 | 2,201 (12.9%) | 2,058 (24.2%) |
| $1,000 to $1,499 | 3,247 (19.0%) | 1,514 (17.8%) |
| $1,500 to $1,999 | 1,515 (8.9%) | 136 (1.6%) |
| $2,000 to $2,499 | 623 (3.6%) | 42 (0.5%) |
| $2,500 to $2,999 | 275 (1.6%) | 7 (0.1%) |
| $3,000 or more | 174 (1.0%) | 34 (0.4%) |
| Total | 17,081 (100.0%) | 8,517 (100.0%) |
Physical Housing Characteristics in Muskogee County
Housing Structures in Muskogee County
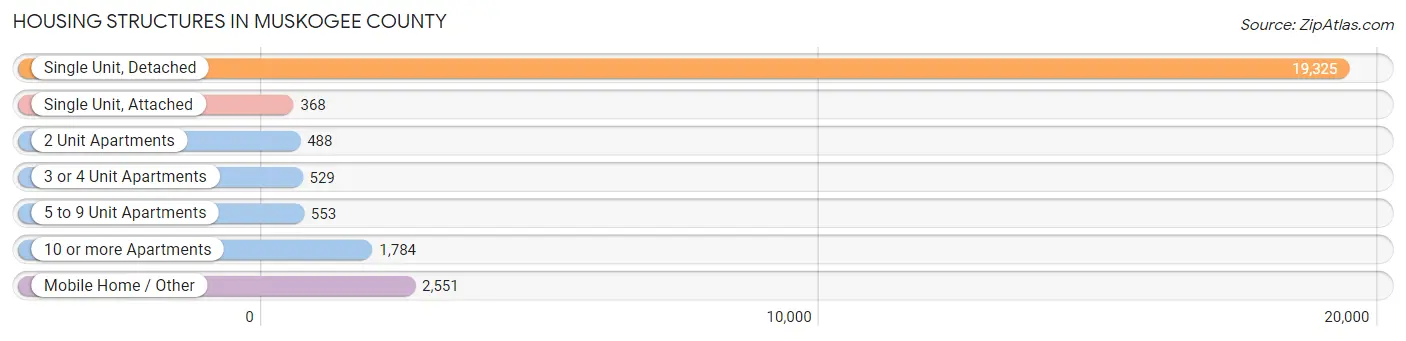
| Structure Type | # Housing Units | % Housing Units |
| Single Unit, Detached | 19,325 | 75.5% |
| Single Unit, Attached | 368 | 1.4% |
| 2 Unit Apartments | 488 | 1.9% |
| 3 or 4 Unit Apartments | 529 | 2.1% |
| 5 to 9 Unit Apartments | 553 | 2.2% |
| 10 or more Apartments | 1,784 | 7.0% |
| Mobile Home / Other | 2,551 | 10.0% |
| Total | 25,598 | 100.0% |
Housing Structures by Occupancy in Muskogee County
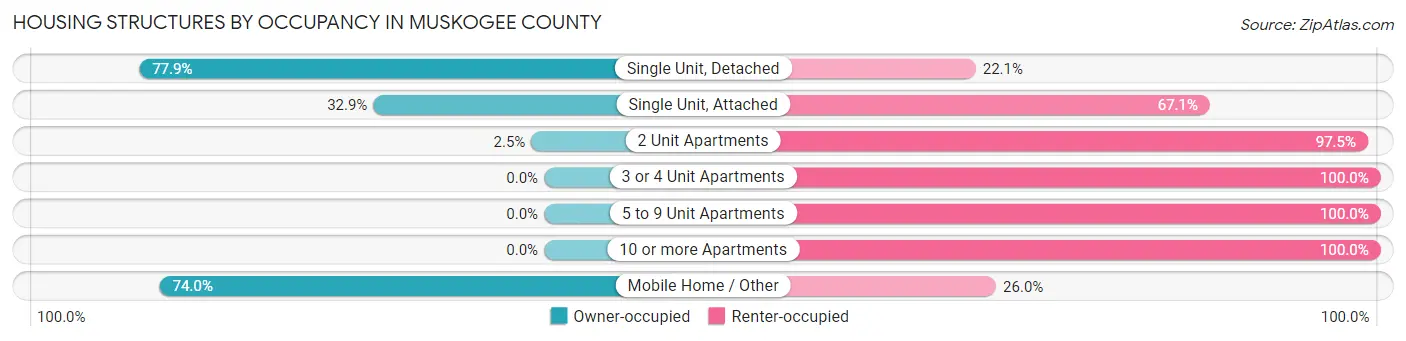
| Structure Type | Owner-occupied | Renter-occupied |
| Single Unit, Detached | 15,060 (77.9%) | 4,265 (22.1%) |
| Single Unit, Attached | 121 (32.9%) | 247 (67.1%) |
| 2 Unit Apartments | 12 (2.5%) | 476 (97.5%) |
| 3 or 4 Unit Apartments | 0 (0.0%) | 529 (100.0%) |
| 5 to 9 Unit Apartments | 0 (0.0%) | 553 (100.0%) |
| 10 or more Apartments | 0 (0.0%) | 1,784 (100.0%) |
| Mobile Home / Other | 1,888 (74.0%) | 663 (26.0%) |
| Total | 17,081 (66.7%) | 8,517 (33.3%) |
Housing Structures by Number of Rooms in Muskogee County
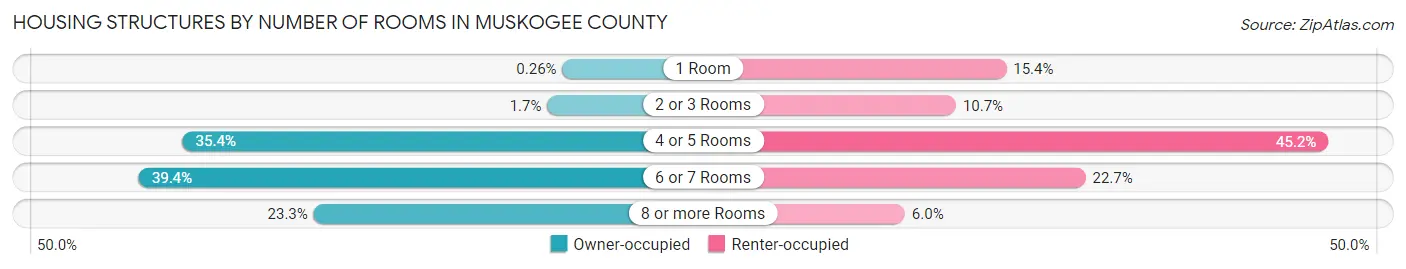
| Number of Rooms | Owner-occupied | Renter-occupied |
| 1 Room | 45 (0.3%) | 1,311 (15.4%) |
| 2 or 3 Rooms | 283 (1.7%) | 914 (10.7%) |
| 4 or 5 Rooms | 6,044 (35.4%) | 3,845 (45.2%) |
| 6 or 7 Rooms | 6,735 (39.4%) | 1,935 (22.7%) |
| 8 or more Rooms | 3,974 (23.3%) | 512 (6.0%) |
| Total | 17,081 (100.0%) | 8,517 (100.0%) |
Housing Structure by Heating Type in Muskogee County
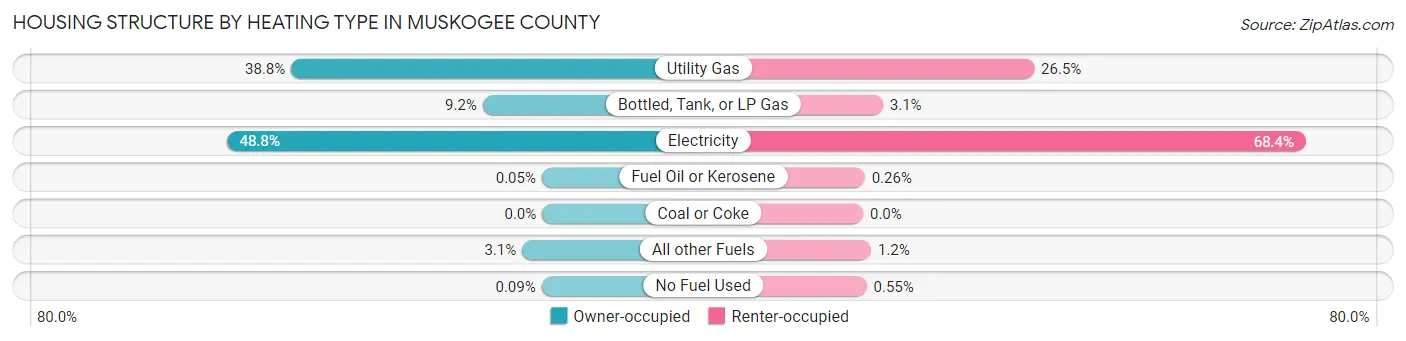
| Heating Type | Owner-occupied | Renter-occupied |
| Utility Gas | 6,628 (38.8%) | 2,253 (26.5%) |
| Bottled, Tank, or LP Gas | 1,568 (9.2%) | 261 (3.1%) |
| Electricity | 8,332 (48.8%) | 5,829 (68.4%) |
| Fuel Oil or Kerosene | 8 (0.1%) | 22 (0.3%) |
| Coal or Coke | 0 (0.0%) | 0 (0.0%) |
| All other Fuels | 530 (3.1%) | 105 (1.2%) |
| No Fuel Used | 15 (0.1%) | 47 (0.5%) |
| Total | 17,081 (100.0%) | 8,517 (100.0%) |
Household Vehicle Usage in Muskogee County
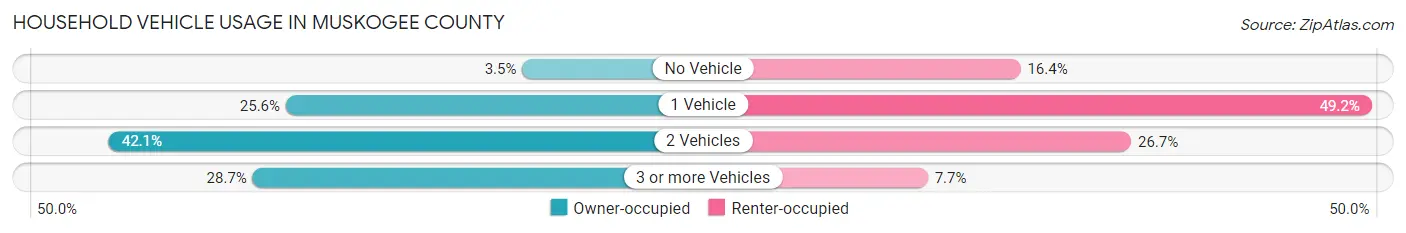
| Vehicles per Household | Owner-occupied | Renter-occupied |
| No Vehicle | 605 (3.5%) | 1,396 (16.4%) |
| 1 Vehicle | 4,374 (25.6%) | 4,188 (49.2%) |
| 2 Vehicles | 7,198 (42.1%) | 2,275 (26.7%) |
| 3 or more Vehicles | 4,904 (28.7%) | 658 (7.7%) |
| Total | 17,081 (100.0%) | 8,517 (100.0%) |
Real Estate & Mortgages in Muskogee County
Real Estate and Mortgage Overview in Muskogee County
| Characteristic | Without Mortgage | With Mortgage |
| Housing Units | 8,404 | 8,677 |
| Median Property Value | $108,700 | $145,800 |
| Median Household Income | $47,500 | $1,194 |
| Monthly Housing Costs | $417 | $163 |
| Real Estate Taxes | $695 | $857 |
Property Value by Mortgage Status in Muskogee County
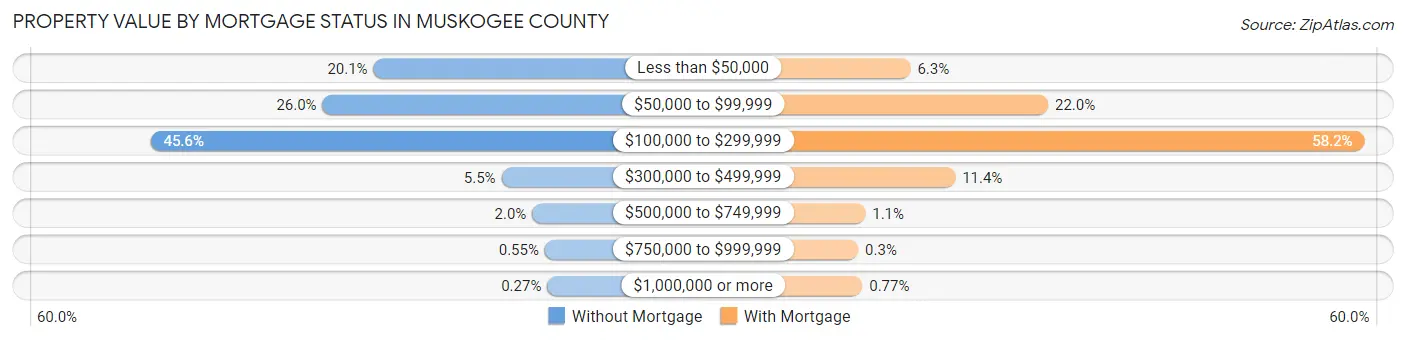
| Property Value | Without Mortgage | With Mortgage |
| Less than $50,000 | 1,692 (20.1%) | 545 (6.3%) |
| $50,000 to $99,999 | 2,182 (26.0%) | 1,909 (22.0%) |
| $100,000 to $299,999 | 3,832 (45.6%) | 5,046 (58.2%) |
| $300,000 to $499,999 | 462 (5.5%) | 988 (11.4%) |
| $500,000 to $749,999 | 167 (2.0%) | 96 (1.1%) |
| $750,000 to $999,999 | 46 (0.5%) | 26 (0.3%) |
| $1,000,000 or more | 23 (0.3%) | 67 (0.8%) |
| Total | 8,404 (100.0%) | 8,677 (100.0%) |
Household Income by Mortgage Status in Muskogee County
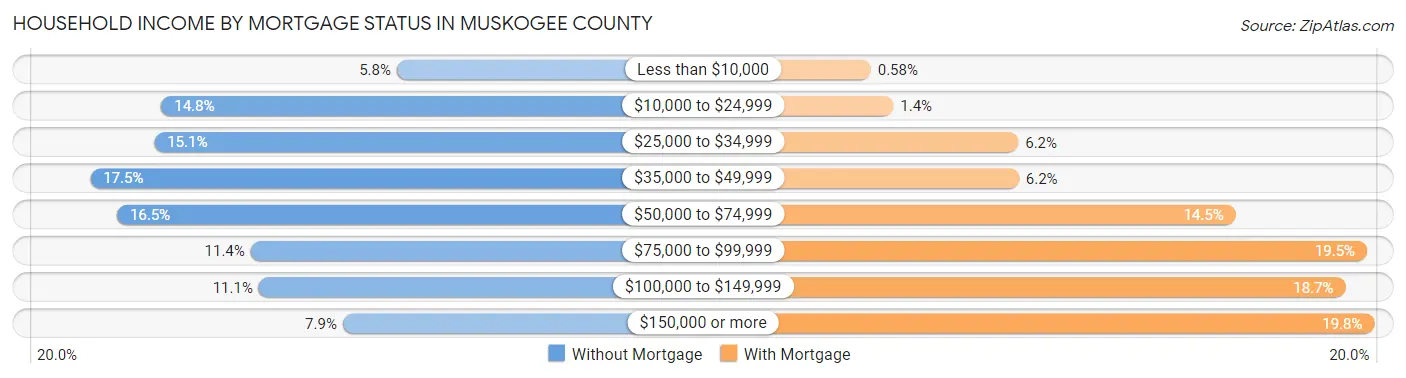
| Household Income | Without Mortgage | With Mortgage |
| Less than $10,000 | 489 (5.8%) | 50 (0.6%) |
| $10,000 to $24,999 | 1,243 (14.8%) | 125 (1.4%) |
| $25,000 to $34,999 | 1,266 (15.1%) | 538 (6.2%) |
| $35,000 to $49,999 | 1,471 (17.5%) | 540 (6.2%) |
| $50,000 to $74,999 | 1,385 (16.5%) | 1,256 (14.5%) |
| $75,000 to $99,999 | 957 (11.4%) | 1,690 (19.5%) |
| $100,000 to $149,999 | 931 (11.1%) | 1,619 (18.7%) |
| $150,000 or more | 662 (7.9%) | 1,715 (19.8%) |
| Total | 8,404 (100.0%) | 8,677 (100.0%) |
Property Value to Household Income Ratio in Muskogee County
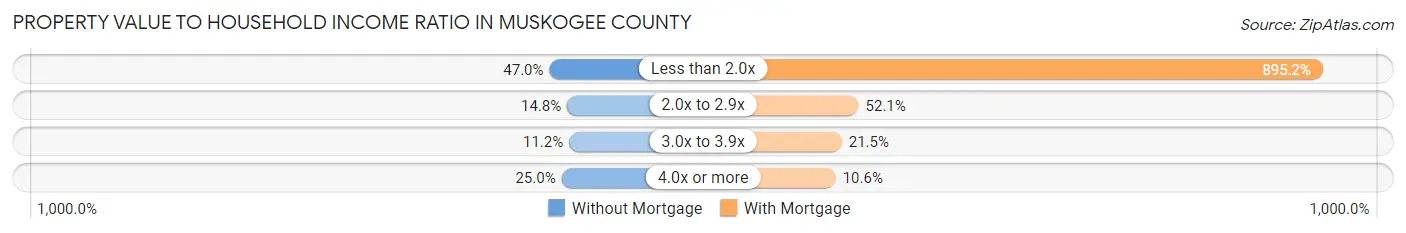
| Value-to-Income Ratio | Without Mortgage | With Mortgage |
| Less than 2.0x | 3,952 (47.0%) | 77,675 (895.2%) |
| 2.0x to 2.9x | 1,243 (14.8%) | 4,522 (52.1%) |
| 3.0x to 3.9x | 940 (11.2%) | 1,866 (21.5%) |
| 4.0x or more | 2,101 (25.0%) | 920 (10.6%) |
| Total | 8,404 (100.0%) | 8,677 (100.0%) |
Real Estate Taxes by Mortgage Status in Muskogee County
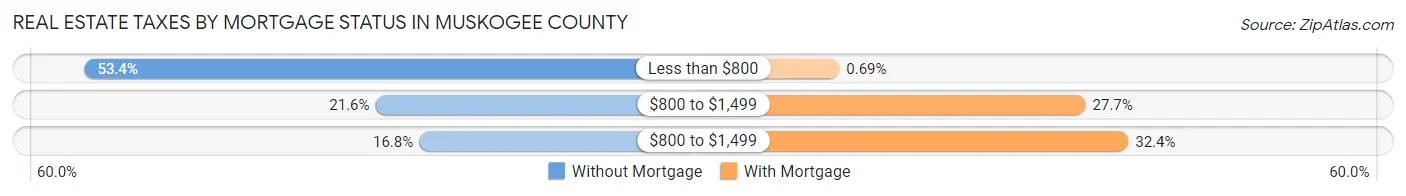
| Property Taxes | Without Mortgage | With Mortgage |
| Less than $800 | 4,490 (53.4%) | 60 (0.7%) |
| $800 to $1,499 | 1,812 (21.6%) | 2,402 (27.7%) |
| $800 to $1,499 | 1,409 (16.8%) | 2,808 (32.4%) |
| Total | 8,404 (100.0%) | 8,677 (100.0%) |
Health & Disability in Muskogee County
Health Insurance Coverage by Age in Muskogee County
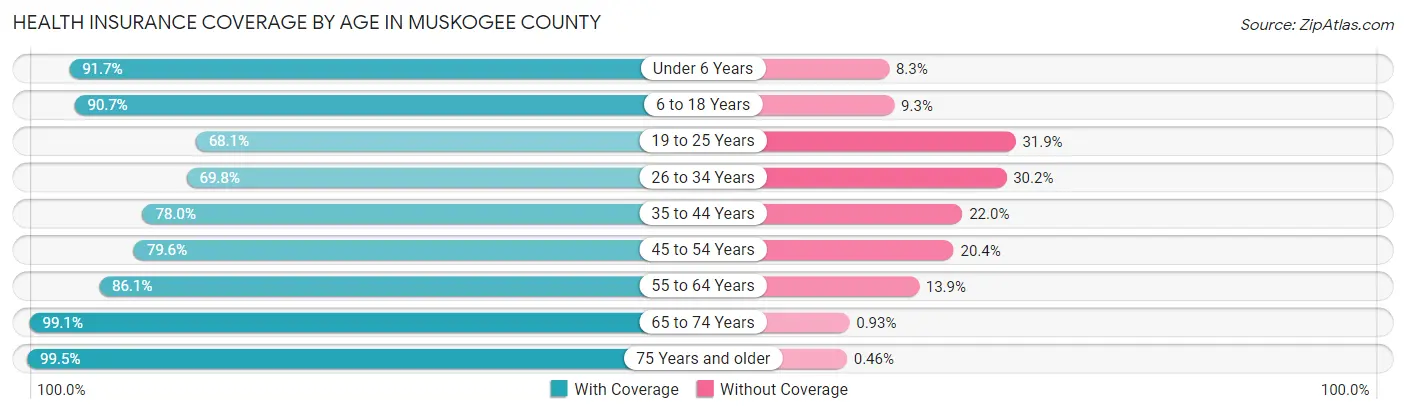
| Age Bracket | With Coverage | Without Coverage |
| Under 6 Years | 4,664 (91.7%) | 424 (8.3%) |
| 6 to 18 Years | 10,948 (90.7%) | 1,123 (9.3%) |
| 19 to 25 Years | 3,767 (68.1%) | 1,766 (31.9%) |
| 26 to 34 Years | 5,010 (69.8%) | 2,168 (30.2%) |
| 35 to 44 Years | 6,055 (78.0%) | 1,707 (22.0%) |
| 45 to 54 Years | 5,628 (79.6%) | 1,440 (20.4%) |
| 55 to 64 Years | 7,042 (86.1%) | 1,136 (13.9%) |
| 65 to 74 Years | 6,295 (99.1%) | 59 (0.9%) |
| 75 Years and older | 4,334 (99.5%) | 20 (0.5%) |
| Total | 53,743 (84.5%) | 9,843 (15.5%) |
Health Insurance Coverage by Citizenship Status in Muskogee County
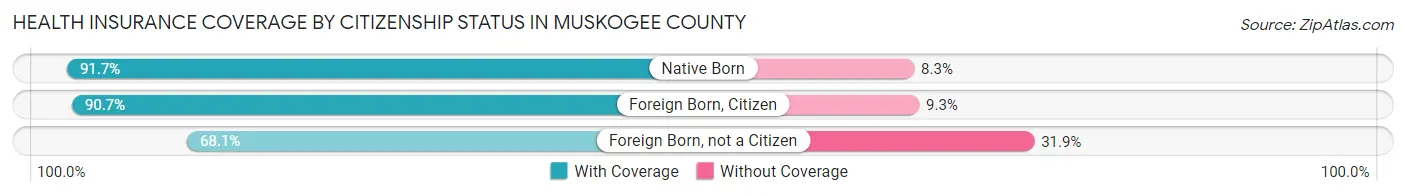
| Citizenship Status | With Coverage | Without Coverage |
| Native Born | 4,664 (91.7%) | 424 (8.3%) |
| Foreign Born, Citizen | 10,948 (90.7%) | 1,123 (9.3%) |
| Foreign Born, not a Citizen | 3,767 (68.1%) | 1,766 (31.9%) |
Health Insurance Coverage by Household Income in Muskogee County
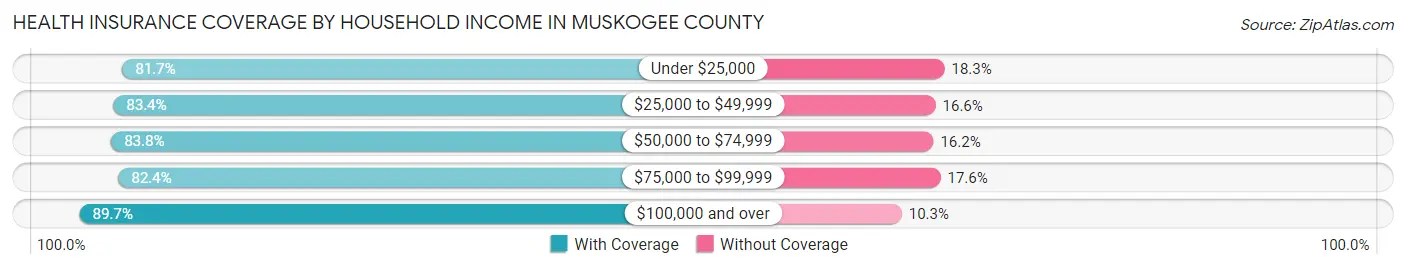
| Household Income | With Coverage | Without Coverage |
| Under $25,000 | 8,466 (81.7%) | 1,898 (18.3%) |
| $25,000 to $49,999 | 12,975 (83.4%) | 2,590 (16.6%) |
| $50,000 to $74,999 | 9,533 (83.8%) | 1,848 (16.2%) |
| $75,000 to $99,999 | 7,329 (82.4%) | 1,561 (17.6%) |
| $100,000 and over | 14,702 (89.7%) | 1,688 (10.3%) |
Public vs Private Health Insurance Coverage by Age in Muskogee County
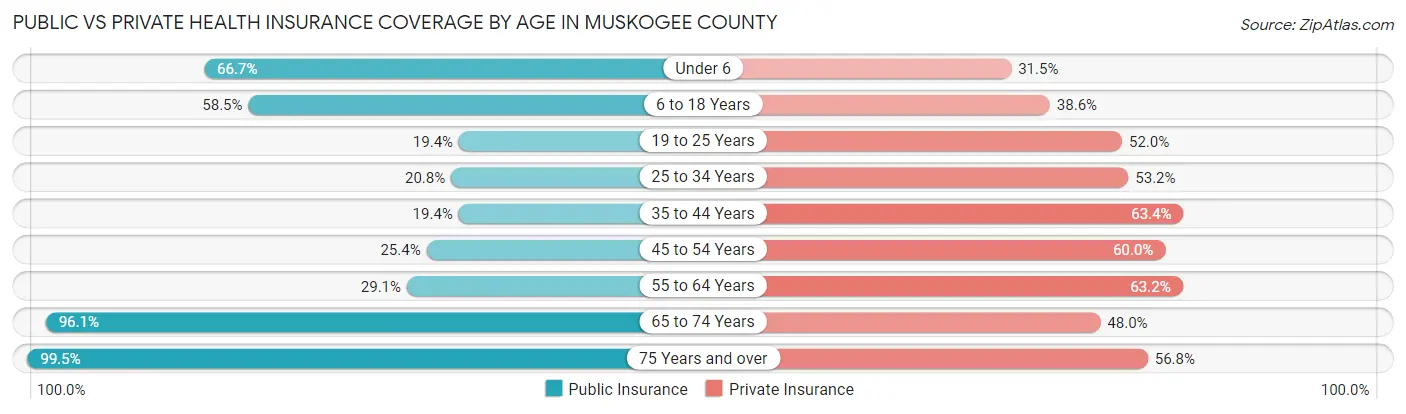
| Age Bracket | Public Insurance | Private Insurance |
| Under 6 | 3,393 (66.7%) | 1,600 (31.5%) |
| 6 to 18 Years | 7,058 (58.5%) | 4,663 (38.6%) |
| 19 to 25 Years | 1,073 (19.4%) | 2,878 (52.0%) |
| 25 to 34 Years | 1,496 (20.8%) | 3,818 (53.2%) |
| 35 to 44 Years | 1,508 (19.4%) | 4,921 (63.4%) |
| 45 to 54 Years | 1,795 (25.4%) | 4,242 (60.0%) |
| 55 to 64 Years | 2,376 (29.0%) | 5,171 (63.2%) |
| 65 to 74 Years | 6,105 (96.1%) | 3,050 (48.0%) |
| 75 Years and over | 4,332 (99.5%) | 2,473 (56.8%) |
| Total | 29,136 (45.8%) | 32,816 (51.6%) |
Disability Status by Sex by Age in Muskogee County
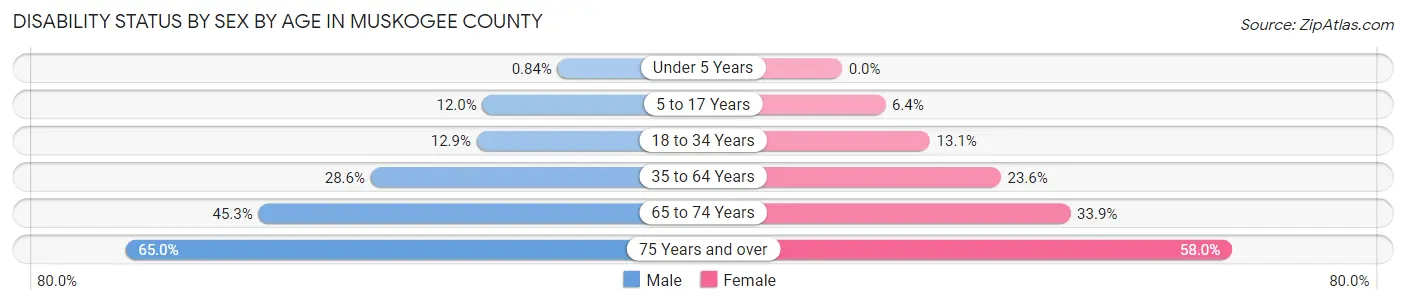
| Age Bracket | Male | Female |
| Under 5 Years | 18 (0.8%) | 0 (0.0%) |
| 5 to 17 Years | 716 (12.0%) | 382 (6.4%) |
| 18 to 34 Years | 893 (12.9%) | 883 (13.1%) |
| 35 to 64 Years | 3,253 (28.6%) | 2,741 (23.6%) |
| 65 to 74 Years | 1,333 (45.3%) | 1,156 (33.9%) |
| 75 Years and over | 1,163 (65.0%) | 1,487 (58.0%) |
Disability Class by Sex by Age in Muskogee County
Disability Class: Hearing Difficulty
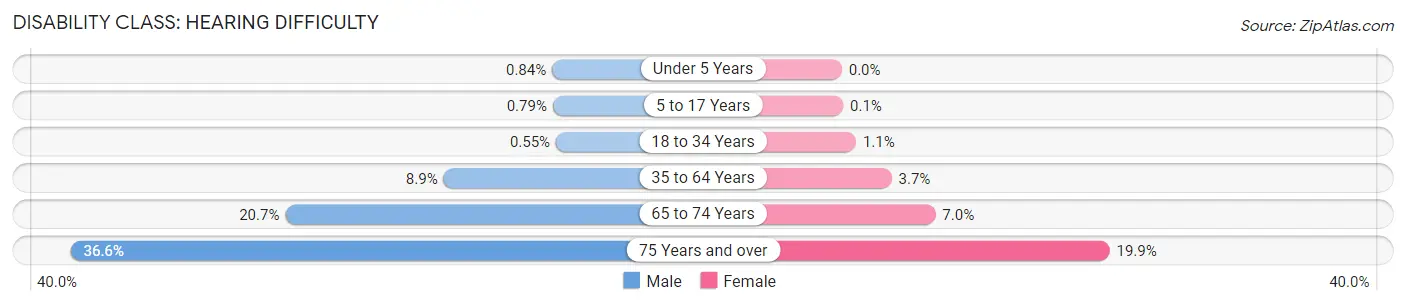
| Age Bracket | Male | Female |
| Under 5 Years | 18 (0.8%) | 0 (0.0%) |
| 5 to 17 Years | 47 (0.8%) | 6 (0.1%) |
| 18 to 34 Years | 38 (0.5%) | 71 (1.1%) |
| 35 to 64 Years | 1,013 (8.9%) | 430 (3.7%) |
| 65 to 74 Years | 608 (20.6%) | 237 (7.0%) |
| 75 Years and over | 654 (36.6%) | 510 (19.9%) |
Disability Class: Vision Difficulty
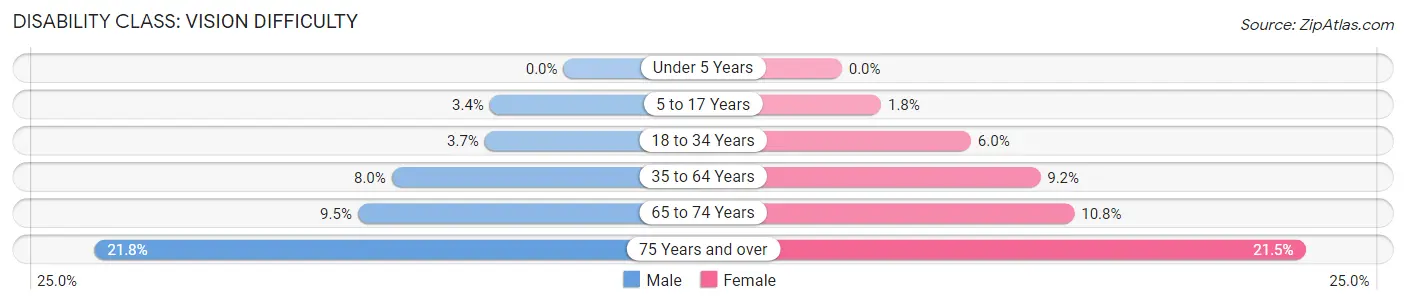
| Age Bracket | Male | Female |
| Under 5 Years | 0 (0.0%) | 0 (0.0%) |
| 5 to 17 Years | 204 (3.4%) | 108 (1.8%) |
| 18 to 34 Years | 254 (3.6%) | 405 (6.0%) |
| 35 to 64 Years | 907 (8.0%) | 1,071 (9.2%) |
| 65 to 74 Years | 281 (9.5%) | 368 (10.8%) |
| 75 Years and over | 389 (21.8%) | 552 (21.5%) |
Disability Class: Cognitive Difficulty
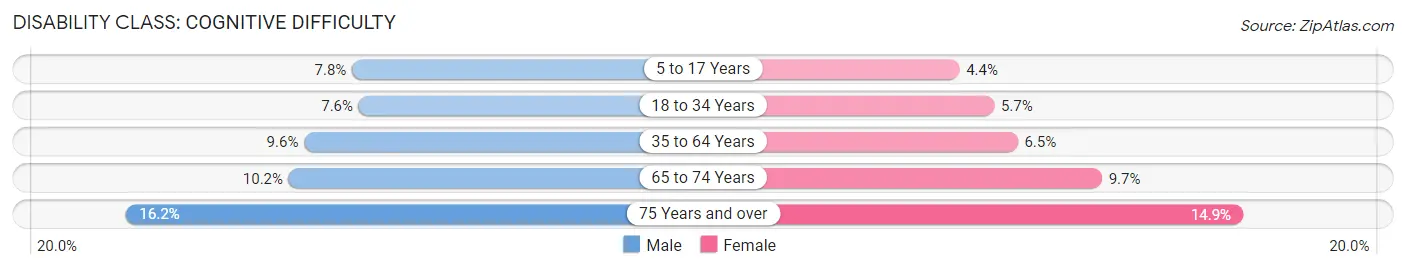
| Age Bracket | Male | Female |
| 5 to 17 Years | 468 (7.8%) | 259 (4.4%) |
| 18 to 34 Years | 528 (7.6%) | 382 (5.7%) |
| 35 to 64 Years | 1,095 (9.6%) | 758 (6.5%) |
| 65 to 74 Years | 300 (10.2%) | 329 (9.7%) |
| 75 Years and over | 290 (16.2%) | 382 (14.9%) |
Disability Class: Ambulatory Difficulty
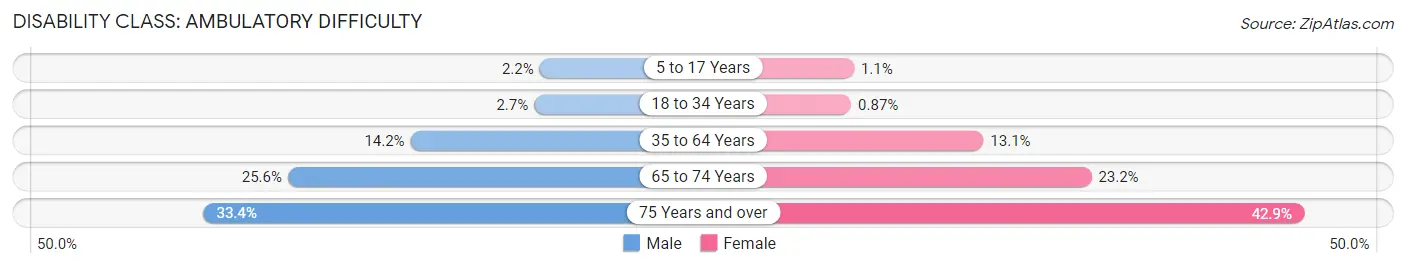
| Age Bracket | Male | Female |
| 5 to 17 Years | 132 (2.2%) | 67 (1.1%) |
| 18 to 34 Years | 189 (2.7%) | 59 (0.9%) |
| 35 to 64 Years | 1,614 (14.2%) | 1,528 (13.1%) |
| 65 to 74 Years | 753 (25.6%) | 790 (23.2%) |
| 75 Years and over | 597 (33.4%) | 1,100 (42.9%) |
Disability Class: Self-Care Difficulty
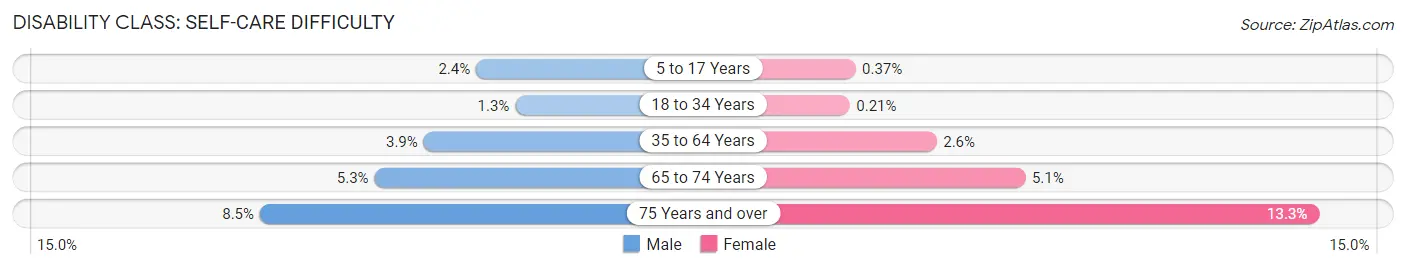
| Age Bracket | Male | Female |
| 5 to 17 Years | 145 (2.4%) | 22 (0.4%) |
| 18 to 34 Years | 93 (1.3%) | 14 (0.2%) |
| 35 to 64 Years | 443 (3.9%) | 306 (2.6%) |
| 65 to 74 Years | 155 (5.3%) | 174 (5.1%) |
| 75 Years and over | 151 (8.5%) | 341 (13.3%) |
Technology Access in Muskogee County
Computing Device Access in Muskogee County
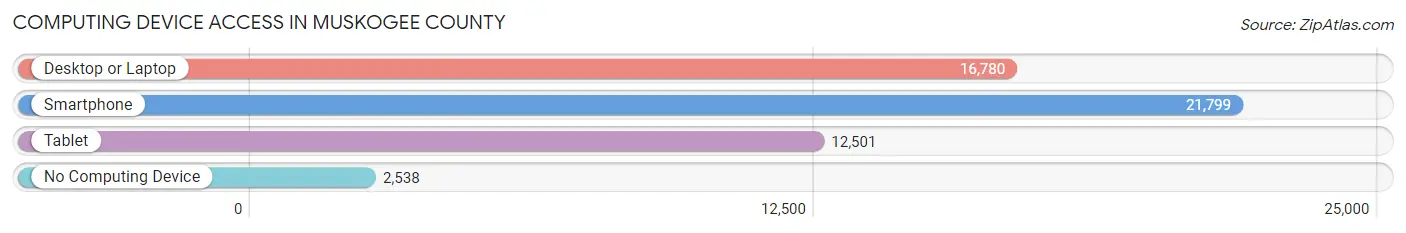
| Device Type | # Households | % Households |
| Desktop or Laptop | 16,780 | 65.5% |
| Smartphone | 21,799 | 85.2% |
| Tablet | 12,501 | 48.8% |
| No Computing Device | 2,538 | 9.9% |
| Total | 25,598 | 100.0% |
Internet Access in Muskogee County
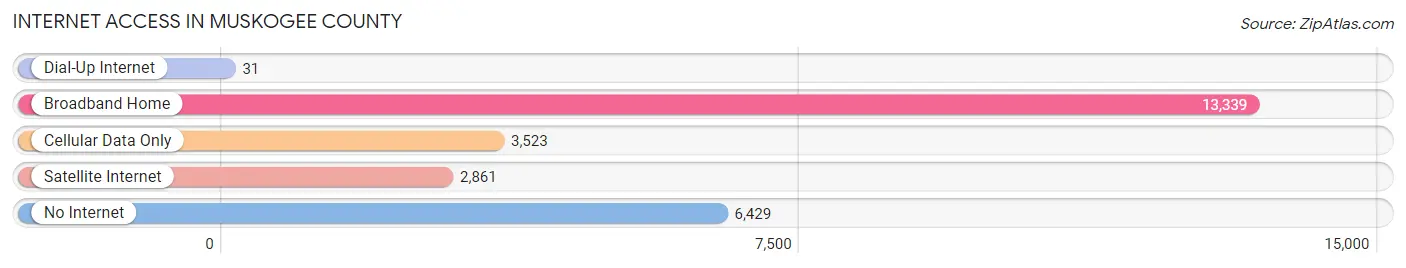
| Internet Type | # Households | % Households |
| Dial-Up Internet | 31 | 0.1% |
| Broadband Home | 13,339 | 52.1% |
| Cellular Data Only | 3,523 | 13.8% |
| Satellite Internet | 2,861 | 11.2% |
| No Internet | 6,429 | 25.1% |
| Total | 25,598 | 100.0% |
Muskogee County Summary
Muskogee County is located in the east-central part of Oklahoma, and is bordered by Wagoner County to the north, Cherokee County to the east, Sequoyah County to the south, and Okmulgee County to the west. The county seat is Muskogee, and the county is part of the Muskogee, OK Micropolitan Statistical Area. As of the 2010 census, the population of Muskogee County was 70,990.
History
Muskogee County was created in 1907, when the Oklahoma Legislature divided the former Creek Nation into six counties. The county was named for the Muscogee (Creek) Nation, which had been relocated to the area in the 1830s. The county was originally part of the Moshulatubbee District of the Creek Nation, and the county seat was originally located in the town of Oktaha.
In the early 1900s, the county was home to a large number of oil and gas wells, and the county seat was moved to Muskogee in 1910. The county was also home to a large number of cotton plantations, and the county seat was moved to Muskogee in 1910.
Geography
Muskogee County covers an area of 845 square miles, and is located in the east-central part of Oklahoma. The county is bordered by Wagoner County to the north, Cherokee County to the east, Sequoyah County to the south, and Okmulgee County to the west. The county is part of the Arkansas River Valley, and is drained by the Arkansas River and its tributaries. The county is mostly flat, with some rolling hills in the western part of the county.
The county is home to several state parks, including Sequoyah State Park, Fort Gibson State Park, and Greenleaf State Park. The county is also home to the Muskogee National Wildlife Refuge, which is located in the western part of the county.
Economy
Muskogee County is home to a diverse economy, with a mix of manufacturing, agriculture, and services. The county is home to several large employers, including Muskogee Regional Medical Center, Muskogee Public Schools, and Muskogee County Government.
The county is also home to several large manufacturing companies, including Muskogee Manufacturing, Muskogee Machine Works, and Muskogee Tool & Die. The county is also home to several agricultural operations, including cattle, poultry, and dairy farms.
Demographics
As of the 2010 census, the population of Muskogee County was 70,990. The racial makeup of the county was 73.3% White, 15.2% African American, 8.2% Native American, 0.7% Asian, 0.2% Pacific Islander, and 2.4% from other races. Hispanic or Latino of any race were 4.2% of the population.
The median income for a household in the county was $37,945, and the median income for a family was $45,945. The per capita income for the county was $19,945. About 16.2% of the population was below the poverty line.
Common Questions
What is the Total Population of Muskogee County?
Total Population of Muskogee County is 66,606.
What is the Total Male Population of Muskogee County?
Total Male Population of Muskogee County is 32,623.
What is the Total Female Population of Muskogee County?
Total Female Population of Muskogee County is 33,983.
What is the Ratio of Males per 100 Females in Muskogee County?
There are 96.00 Males per 100 Females in Muskogee County.
What is the Ratio of Females per 100 Males in Muskogee County?
There are 104.17 Females per 100 Males in Muskogee County.
What is the Median Population Age in Muskogee County?
Median Population Age in Muskogee County is 38.1 Years.
What is the Average Family Size in Muskogee County
Average Family Size in Muskogee County is 3.1 People.
What is the Average Household Size in Muskogee County
Average Household Size in Muskogee County is 2.5 People.
What is Per Capita Income in Muskogee County?
Per Capita income in Muskogee County is $26,684.
What is the Median Family Income in Muskogee County?
Median Family Income in Muskogee County is $65,029.
What is the Median Household income in Muskogee County?
Median Household Income in Muskogee County is $50,289.
What is Income or Wage Gap in Muskogee County?
Income or Wage Gap in Muskogee County is 29.5%.
Women in Muskogee County earn 70.5 cents for every dollar earned by a man.
What is Family Income Deficit in Muskogee County?
Family Income Deficit in Muskogee County is $11,403.
Families that are below poverty line in Muskogee County earn $11,403 less on average than the poverty threshold level.
What is Inequality or Gini Index in Muskogee County?
Inequality or Gini Index in Muskogee County is 0.46.
How Large is the Labor Force in Muskogee County?
There are 27,897 People in the Labor Forcein in Muskogee County.
What is the Percentage of People in the Labor Force in Muskogee County?
53.5% of People are in the Labor Force in Muskogee County.
What is the Unemployment Rate in Muskogee County?
Unemployment Rate in Muskogee County is 5.7%.