Murray County, OK
Murray County Map
Murray County Overview
13,837
TOTAL POPULATION
7,153
MALE POPULATION
6,684
FEMALE POPULATION
107.02
MALES / 100 FEMALES
93.44
FEMALES / 100 MALES
41.5
MEDIAN AGE
3.2
AVG FAMILY SIZE
2.6
AVG HOUSEHOLD SIZE
$32,488
PER CAPITA INCOME
$73,333
AVG FAMILY INCOME
$60,213
AVG HOUSEHOLD INCOME
21.0%
WAGE / INCOME GAP [ % ]
79.0¢/ $1
WAGE / INCOME GAP [ $ ]
$10,548
FAMILY INCOME DEFICIT
0.45
INEQUALITY / GINI INDEX
6,089
LABOR FORCE [ PEOPLE ]
55.5%
PERCENT IN LABOR FORCE
2.1%
UNEMPLOYMENT RATE
Murray County Area Codes
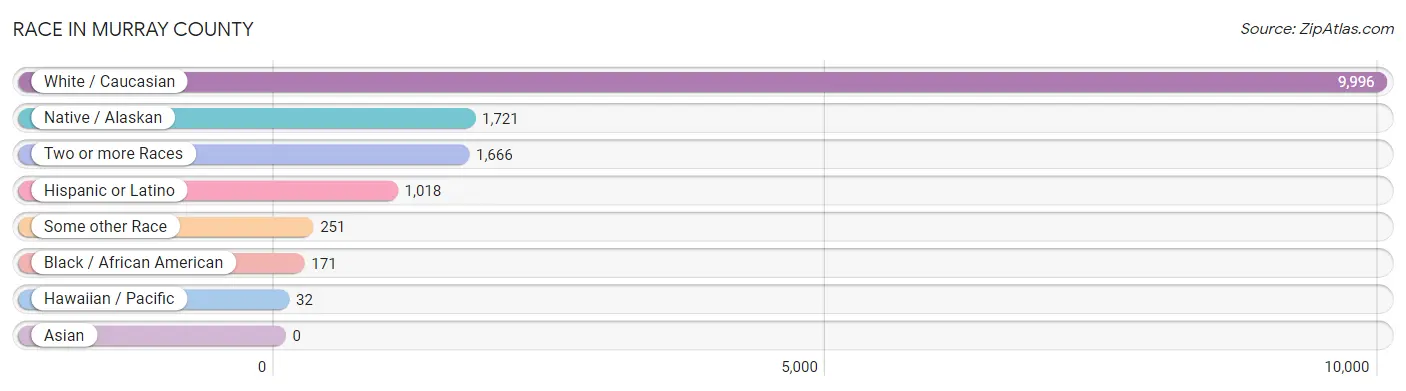
Race in Murray County
The most populous races in Murray County are White / Caucasian (9,996 | 72.2%), Native / Alaskan (1,721 | 12.4%), and Two or more Races (1,666 | 12.0%).
| Race | # Population | % Population |
| Asian | 0 | 0.0% |
| Black / African American | 171 | 1.2% |
| Hawaiian / Pacific | 32 | 0.2% |
| Hispanic or Latino | 1,018 | 7.4% |
| Native / Alaskan | 1,721 | 12.4% |
| White / Caucasian | 9,996 | 72.2% |
| Two or more Races | 1,666 | 12.0% |
| Some other Race | 251 | 1.8% |
| Total | 13,837 | 100.0% |
Ancestry in Murray County
The most populous ancestries reported in Murray County are German (1,456 | 10.5%), English (1,284 | 9.3%), Irish (1,251 | 9.0%), American (1,130 | 8.2%), and Chickasaw (1,071 | 7.7%), together accounting for 44.8% of all Murray County residents.

| Ancestry | # Population | % Population |
| American | 1,130 | 8.2% |
| Apache | 11 | 0.1% |
| Austrian | 7 | 0.1% |
| Blackfeet | 17 | 0.1% |
| British | 99 | 0.7% |
| Cajun | 16 | 0.1% |
| Central American | 2 | 0.0% |
| Cherokee | 529 | 3.8% |
| Chickasaw | 1,071 | 7.7% |
| Choctaw | 950 | 6.9% |
| Comanche | 65 | 0.5% |
| Creek | 62 | 0.4% |
| Croatian | 9 | 0.1% |
| Czech | 75 | 0.5% |
| Danish | 23 | 0.2% |
| Delaware | 41 | 0.3% |
| Dutch | 159 | 1.1% |
| Dutch West Indian | 54 | 0.4% |
| Eastern European | 8 | 0.1% |
| English | 1,284 | 9.3% |
| European | 199 | 1.4% |
| Finnish | 11 | 0.1% |
| French | 69 | 0.5% |
| French Canadian | 18 | 0.1% |
| German | 1,456 | 10.5% |
| Greek | 12 | 0.1% |
| Guatemalan | 2 | 0.0% |
| Houma | 2 | 0.0% |
| Irish | 1,251 | 9.0% |
| Iroquois | 13 | 0.1% |
| Italian | 130 | 0.9% |
| Mexican | 855 | 6.2% |
| Northern European | 28 | 0.2% |
| Norwegian | 181 | 1.3% |
| Osage | 32 | 0.2% |
| Pennsylvania German | 43 | 0.3% |
| Polish | 92 | 0.7% |
| Portuguese | 16 | 0.1% |
| Potawatomi | 38 | 0.3% |
| Puerto Rican | 57 | 0.4% |
| Russian | 32 | 0.2% |
| Scotch-Irish | 99 | 0.7% |
| Scottish | 281 | 2.0% |
| Seminole | 66 | 0.5% |
| Serbian | 27 | 0.2% |
| Sioux | 3 | 0.0% |
| Spanish | 41 | 0.3% |
| Swedish | 34 | 0.3% |
| Swiss | 15 | 0.1% |
| Welsh | 13 | 0.1% |
| Yaqui | 77 | 0.6% | View All 51 Rows |
Immigrants in Murray County
The most numerous immigrant groups reported in Murray County came from Central America (118 | 0.9%), Latin America (118 | 0.9%), Mexico (118 | 0.9%), Oceania (32 | 0.2%), and Europe (12 | 0.1%), together accounting for 2.9% of all Murray County residents.

| Immigration Origin | # Population | % Population |
| Canada | 1 | 0.0% |
| Central America | 118 | 0.9% |
| Europe | 12 | 0.1% |
| Latin America | 118 | 0.9% |
| Mexico | 118 | 0.9% |
| Northern Europe | 12 | 0.1% |
| Oceania | 32 | 0.2% | View All 7 Rows |
Sex and Age in Murray County
Sex and Age in Murray County
The most populous age groups in Murray County are 60 to 64 Years (528 | 7.4%) for men and 60 to 64 Years (530 | 7.9%) for women.

| Age Bracket | Male | Female |
| Under 5 Years | 499 (7.0%) | 342 (5.1%) |
| 5 to 9 Years | 429 (6.0%) | 362 (5.4%) |
| 10 to 14 Years | 480 (6.7%) | 510 (7.6%) |
| 15 to 19 Years | 495 (6.9%) | 436 (6.5%) |
| 20 to 24 Years | 482 (6.7%) | 270 (4.0%) |
| 25 to 29 Years | 425 (5.9%) | 414 (6.2%) |
| 30 to 34 Years | 392 (5.5%) | 338 (5.1%) |
| 35 to 39 Years | 385 (5.4%) | 435 (6.5%) |
| 40 to 44 Years | 417 (5.8%) | 325 (4.9%) |
| 45 to 49 Years | 439 (6.1%) | 396 (5.9%) |
| 50 to 54 Years | 386 (5.4%) | 447 (6.7%) |
| 55 to 59 Years | 475 (6.6%) | 463 (6.9%) |
| 60 to 64 Years | 528 (7.4%) | 530 (7.9%) |
| 65 to 69 Years | 451 (6.3%) | 441 (6.6%) |
| 70 to 74 Years | 281 (3.9%) | 333 (5.0%) |
| 75 to 79 Years | 297 (4.2%) | 165 (2.5%) |
| 80 to 84 Years | 143 (2.0%) | 206 (3.1%) |
| 85 Years and over | 149 (2.1%) | 271 (4.1%) |
| Total | 7,153 (100.0%) | 6,684 (100.0%) |
Families and Households in Murray County
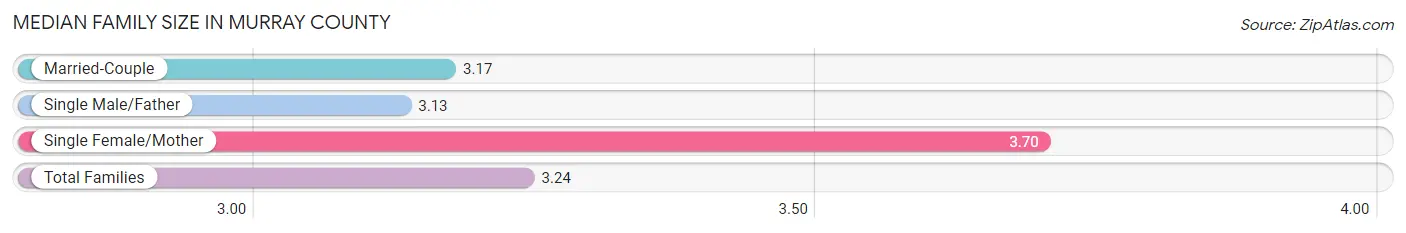
Median Family Size in Murray County
The median family size in Murray County is 3.24 persons per family, with single female/mother families (469 | 13.8%) accounting for the largest median family size of 3.7 persons per family. On the other hand, single male/father families (351 | 10.3%) represent the smallest median family size with 3.13 persons per family.
| Family Type | # Families | Family Size |
| Married-Couple | 2,588 (75.9%) | 3.17 |
| Single Male/Father | 351 (10.3%) | 3.13 |
| Single Female/Mother | 469 (13.8%) | 3.70 |
| Total Families | 3,408 (100.0%) | 3.24 |
Median Household Size in Murray County
The median household size in Murray County is 2.64 persons per household, with single female/mother households (469 | 9.3%) accounting for the largest median household size of 3.85 persons per household. non-family households (1,651 | 32.6%) represent the smallest median household size with 1.25 persons per household.

| Household Type | # Households | Household Size |
| Married-Couple | 2,588 (51.2%) | 3.20 |
| Single Male/Father | 351 (6.9%) | 3.46 |
| Single Female/Mother | 469 (9.3%) | 3.85 |
| Non-family | 1,651 (32.6%) | 1.25 |
| Total Households | 5,059 (100.0%) | 2.64 |
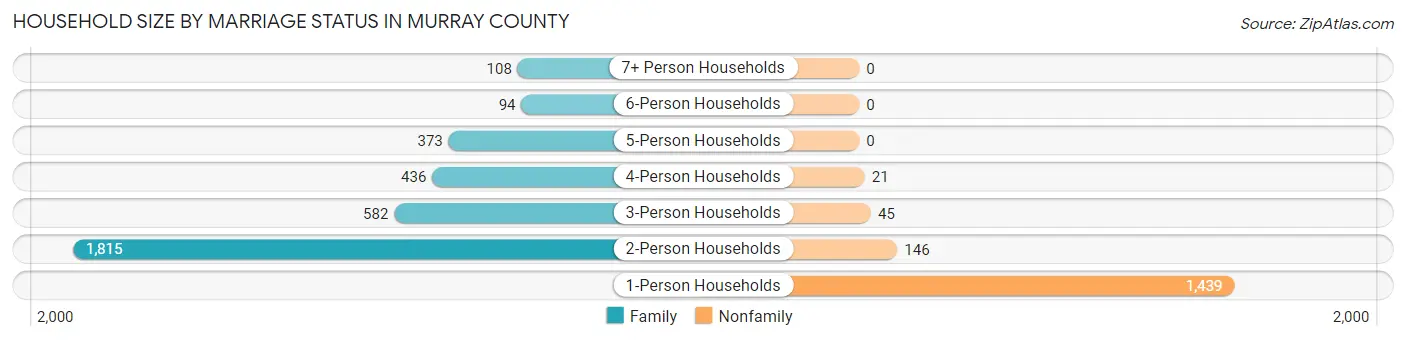
Household Size by Marriage Status in Murray County
Out of a total of 5,059 households in Murray County, 3,408 (67.4%) are family households, while 1,651 (32.6%) are nonfamily households. The most numerous type of family households are 2-person households, comprising 1,815, and the most common type of nonfamily households are 1-person households, comprising 1,439.
| Household Size | Family Households | Nonfamily Households |
| 1-Person Households | - | 1,439 (28.4%) |
| 2-Person Households | 1,815 (35.9%) | 146 (2.9%) |
| 3-Person Households | 582 (11.5%) | 45 (0.9%) |
| 4-Person Households | 436 (8.6%) | 21 (0.4%) |
| 5-Person Households | 373 (7.4%) | 0 (0.0%) |
| 6-Person Households | 94 (1.9%) | 0 (0.0%) |
| 7+ Person Households | 108 (2.1%) | 0 (0.0%) |
| Total | 3,408 (67.4%) | 1,651 (32.6%) |
Female Fertility in Murray County
Fertility by Age in Murray County
Average fertility rate in Murray County is 52.0 births per 1,000 women. Women in the age bracket of 20 to 34 years have the highest fertility rate with 129.0 births per 1,000 women. Women in the age bracket of 20 to 34 years acount for 95.0% of all women with births.
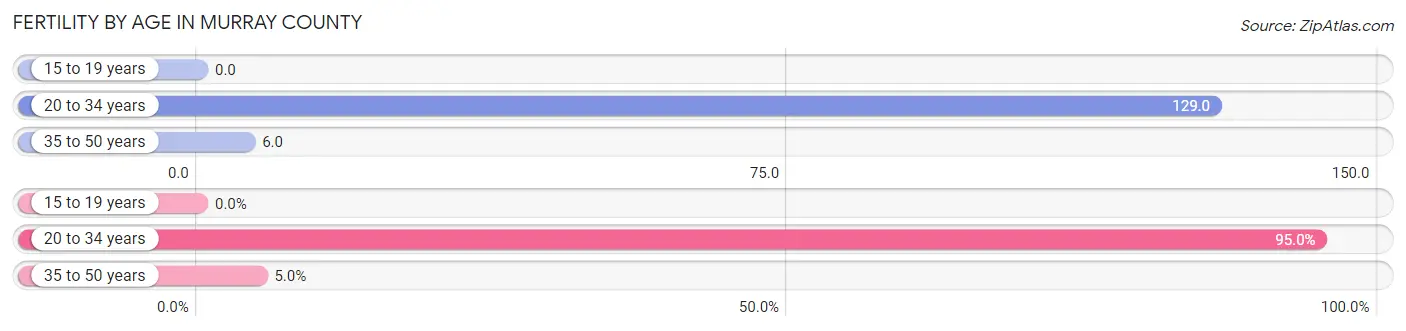
| Age Bracket | Women with Births | Births / 1,000 Women |
| 15 to 19 years | 0 (0.0%) | 0.0 |
| 20 to 34 years | 132 (95.0%) | 129.0 |
| 35 to 50 years | 7 (5.0%) | 6.0 |
| Total | 139 (100.0%) | 52.0 |
Fertility by Age by Marriage Status in Murray County
77.0% of women with births (139) in Murray County are married. The highest percentage of unmarried women with births falls into 20 to 34 years age bracket with 24.2% of them unmarried at the time of birth, while the lowest percentage of unmarried women with births belong to 35 to 50 years age bracket with 0.0% of them unmarried.
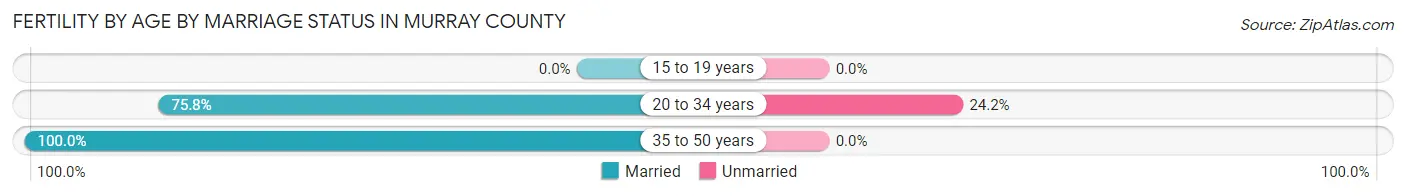
| Age Bracket | Married | Unmarried |
| 15 to 19 years | 0 (0.0%) | 0 (0.0%) |
| 20 to 34 years | 100 (75.8%) | 32 (24.2%) |
| 35 to 50 years | 7 (100.0%) | 0 (0.0%) |
| Total | 107 (77.0%) | 32 (23.0%) |
Fertility by Education in Murray County
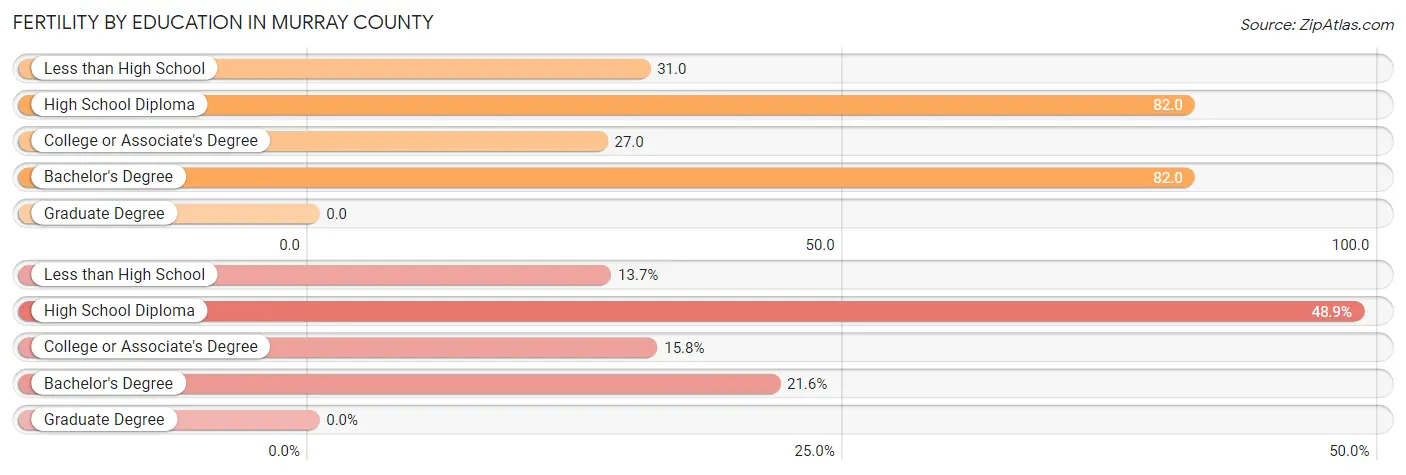
| Educational Attainment | Women with Births | Births / 1,000 Women |
| Less than High School | 19 (13.7%) | 31.0 |
| High School Diploma | 68 (48.9%) | 82.0 |
| College or Associate's Degree | 22 (15.8%) | 27.0 |
| Bachelor's Degree | 30 (21.6%) | 82.0 |
| Graduate Degree | 0 (0.0%) | 0.0 |
| Total | 139 (100.0%) | 52.0 |
Fertility by Education by Marriage Status in Murray County
23.0% of women with births in Murray County are unmarried. Women with the educational attainment of bachelor's degree are most likely to be married with 100.0% of them married at childbirth, while women with the educational attainment of college or associate's degree are least likely to be married with 50.0% of them unmarried at childbirth.
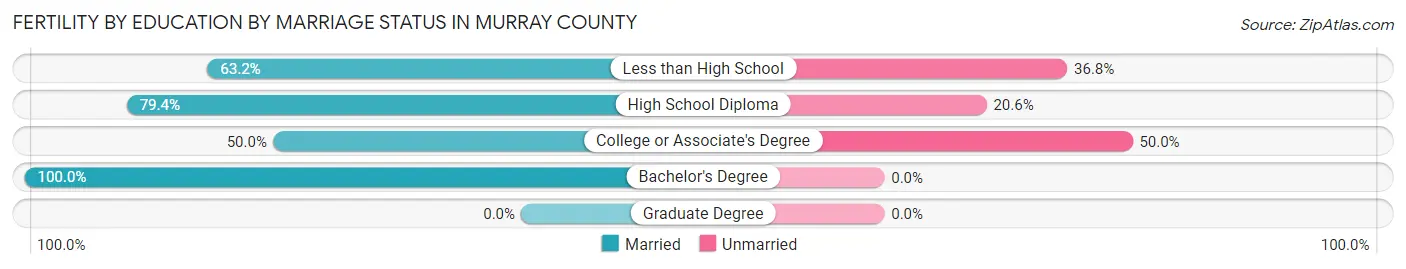
| Educational Attainment | Married | Unmarried |
| Less than High School | 12 (63.2%) | 7 (36.8%) |
| High School Diploma | 54 (79.4%) | 14 (20.6%) |
| College or Associate's Degree | 11 (50.0%) | 11 (50.0%) |
| Bachelor's Degree | 30 (100.0%) | 0 (0.0%) |
| Graduate Degree | 0 (0.0%) | 0 (0.0%) |
| Total | 107 (77.0%) | 32 (23.0%) |
Income in Murray County
Income Overview in Murray County
Per Capita Income in Murray County is $32,488, while median incomes of families and households are $73,333 and $60,213 respectively.
| Characteristic | Number | Measure |
| Per Capita Income | 13,837 | $32,488 |
| Median Family Income | 3,408 | $73,333 |
| Mean Family Income | 3,408 | $93,938 |
| Median Household Income | 5,059 | $60,213 |
| Mean Household Income | 5,059 | $81,468 |
| Income Deficit | 3,408 | $10,548 |
| Wage / Income Gap (%) | 13,837 | 21.04% |
| Wage / Income Gap ($) | 13,837 | 78.96¢ per $1 |
| Gini / Inequality Index | 13,837 | 0.45 |
Earnings by Sex in Murray County
Average Earnings in Murray County are $38,199, $42,338 for men and $33,429 for women, a difference of 21.0%.
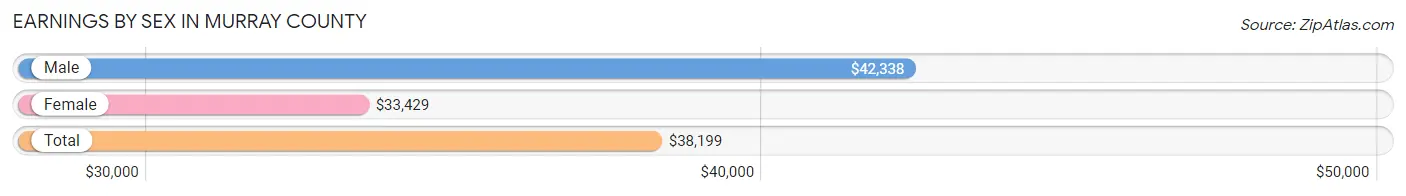
| Sex | Number | Average Earnings |
| Male | 3,451 (54.7%) | $42,338 |
| Female | 2,854 (45.3%) | $33,429 |
| Total | 6,305 (100.0%) | $38,199 |
Earnings by Sex by Income Bracket in Murray County
The most common earnings brackets in Murray County are $100,000+ for men (431 | 12.5%) and $25,000 to $29,999 for women (291 | 10.2%).
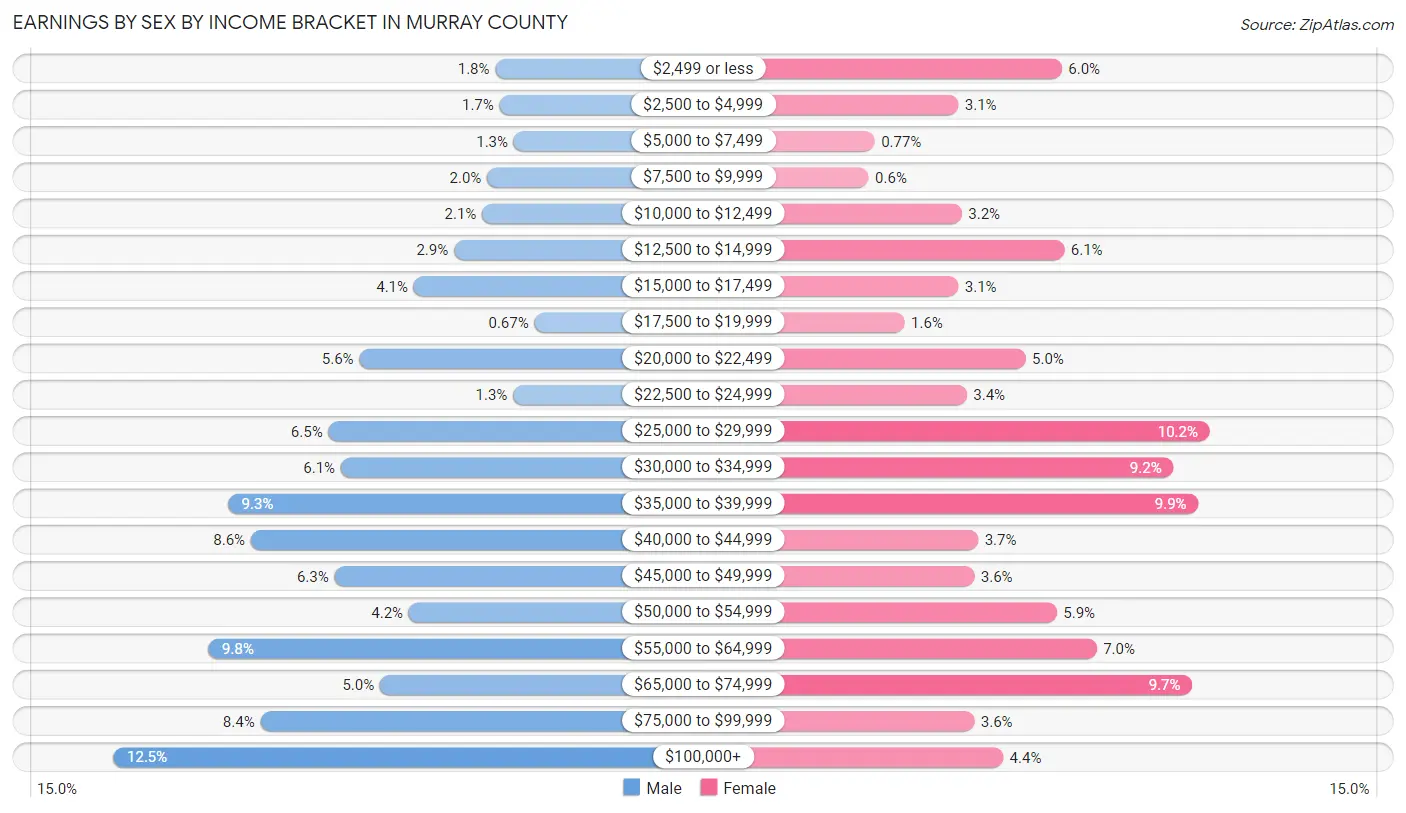
| Income | Male | Female |
| $2,499 or less | 61 (1.8%) | 172 (6.0%) |
| $2,500 to $4,999 | 57 (1.7%) | 89 (3.1%) |
| $5,000 to $7,499 | 43 (1.3%) | 22 (0.8%) |
| $7,500 to $9,999 | 69 (2.0%) | 17 (0.6%) |
| $10,000 to $12,499 | 74 (2.1%) | 92 (3.2%) |
| $12,500 to $14,999 | 101 (2.9%) | 174 (6.1%) |
| $15,000 to $17,499 | 140 (4.1%) | 89 (3.1%) |
| $17,500 to $19,999 | 23 (0.7%) | 46 (1.6%) |
| $20,000 to $22,499 | 193 (5.6%) | 143 (5.0%) |
| $22,500 to $24,999 | 44 (1.3%) | 96 (3.4%) |
| $25,000 to $29,999 | 223 (6.5%) | 291 (10.2%) |
| $30,000 to $34,999 | 211 (6.1%) | 262 (9.2%) |
| $35,000 to $39,999 | 320 (9.3%) | 282 (9.9%) |
| $40,000 to $44,999 | 298 (8.6%) | 105 (3.7%) |
| $45,000 to $49,999 | 217 (6.3%) | 102 (3.6%) |
| $50,000 to $54,999 | 145 (4.2%) | 168 (5.9%) |
| $55,000 to $64,999 | 339 (9.8%) | 200 (7.0%) |
| $65,000 to $74,999 | 173 (5.0%) | 277 (9.7%) |
| $75,000 to $99,999 | 289 (8.4%) | 102 (3.6%) |
| $100,000+ | 431 (12.5%) | 125 (4.4%) |
| Total | 3,451 (100.0%) | 2,854 (100.0%) |
Earnings by Sex by Educational Attainment in Murray County
Average earnings in Murray County are $47,819 for men and $36,417 for women, a difference of 23.8%. Men with an educational attainment of bachelor's degree enjoy the highest average annual earnings of $53,750, while those with less than high school education earn the least with $39,196. Women with an educational attainment of graduate degree earn the most with the average annual earnings of $57,125, while those with less than high school education have the smallest earnings of $30,938.
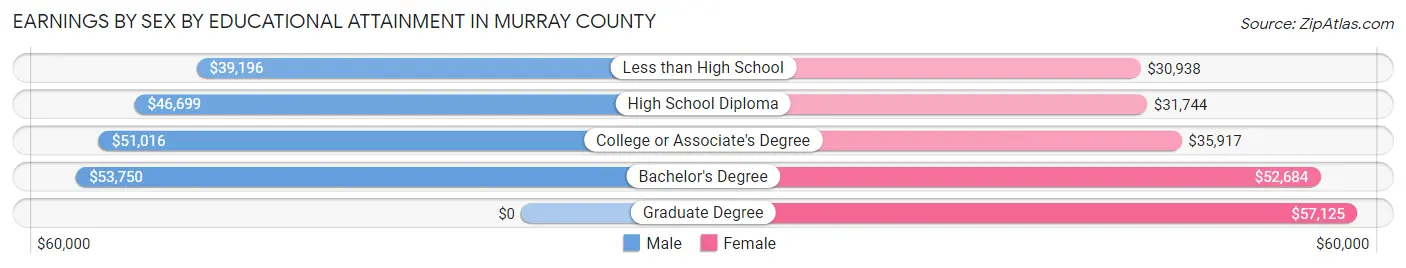
| Educational Attainment | Male Income | Female Income |
| Less than High School | $39,196 | $30,938 |
| High School Diploma | $46,699 | $31,744 |
| College or Associate's Degree | $51,016 | $35,917 |
| Bachelor's Degree | $53,750 | $52,684 |
| Graduate Degree | - | - |
| Total | $47,819 | $36,417 |
Family Income in Murray County
Family Income Brackets in Murray County
According to the Murray County family income data, there are 774 families falling into the $50,000 to $74,999 income range, which is the most common income bracket and makes up 22.7% of all families. Conversely, the $10,000 to $14,999 income bracket is the least frequent group with only 78 families (2.3%) belonging to this category.
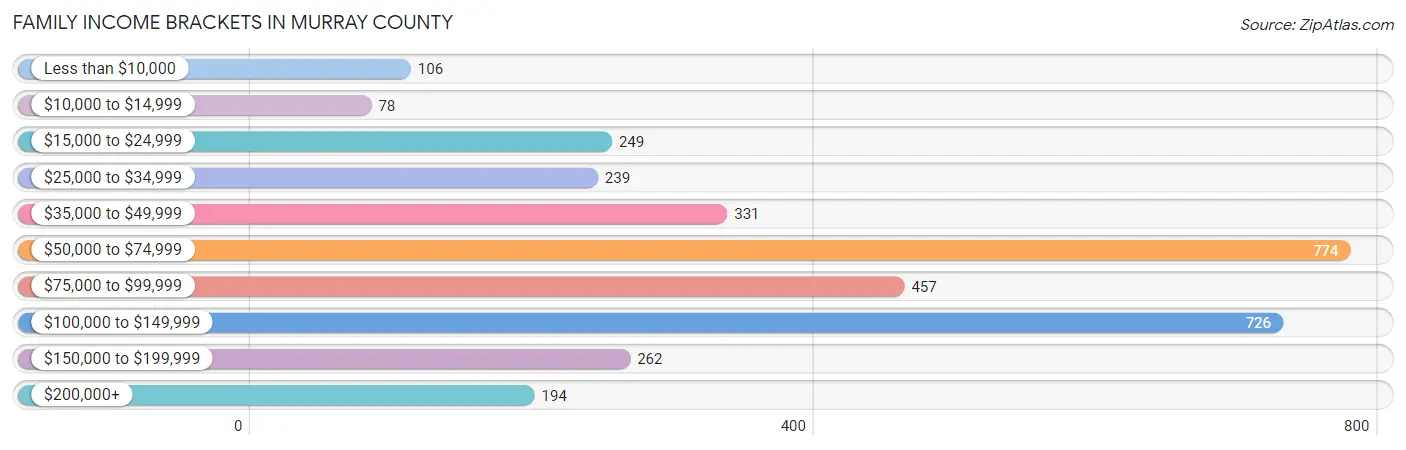
| Income Bracket | # Families | % Families |
| Less than $10,000 | 106 | 3.1% |
| $10,000 to $14,999 | 78 | 2.3% |
| $15,000 to $24,999 | 249 | 7.3% |
| $25,000 to $34,999 | 239 | 7.0% |
| $35,000 to $49,999 | 331 | 9.7% |
| $50,000 to $74,999 | 774 | 22.7% |
| $75,000 to $99,999 | 457 | 13.4% |
| $100,000 to $149,999 | 726 | 21.3% |
| $150,000 to $199,999 | 262 | 7.7% |
| $200,000+ | 194 | 5.7% |
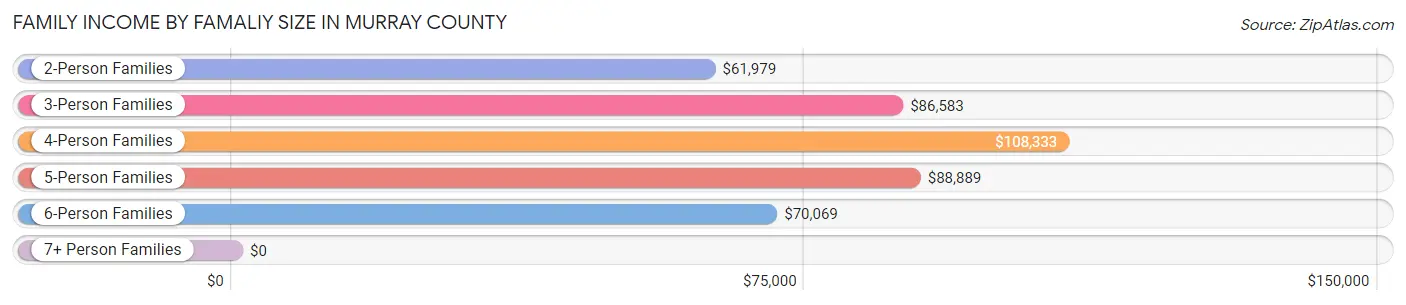
Family Income by Famaliy Size in Murray County
4-person families (432 | 12.7%) account for the highest median family income in Murray County with $108,333 per family, while 2-person families (1,892 | 55.5%) have the highest median income of $30,990 per family member.
| Income Bracket | # Families | Median Income |
| 2-Person Families | 1,892 (55.5%) | $61,979 |
| 3-Person Families | 539 (15.8%) | $86,583 |
| 4-Person Families | 432 (12.7%) | $108,333 |
| 5-Person Families | 358 (10.5%) | $88,889 |
| 6-Person Families | 109 (3.2%) | $70,069 |
| 7+ Person Families | 78 (2.3%) | $0 |
| Total | 3,408 (100.0%) | $73,333 |
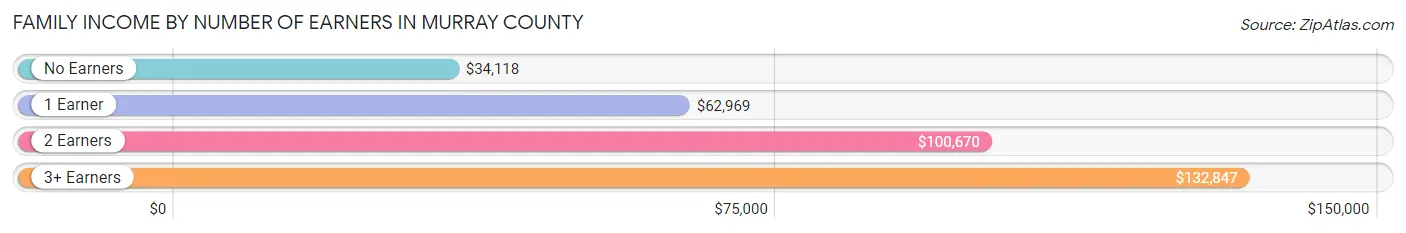
Family Income by Number of Earners in Murray County
The median family income in Murray County is $73,333, with families comprising 3+ earners (197) having the highest median family income of $132,847, while families with no earners (792) have the lowest median family income of $34,118, accounting for 5.8% and 23.2% of families, respectively.
| Number of Earners | # Families | Median Income |
| No Earners | 792 (23.2%) | $34,118 |
| 1 Earner | 1,113 (32.7%) | $62,969 |
| 2 Earners | 1,306 (38.3%) | $100,670 |
| 3+ Earners | 197 (5.8%) | $132,847 |
| Total | 3,408 (100.0%) | $73,333 |
Household Income in Murray County
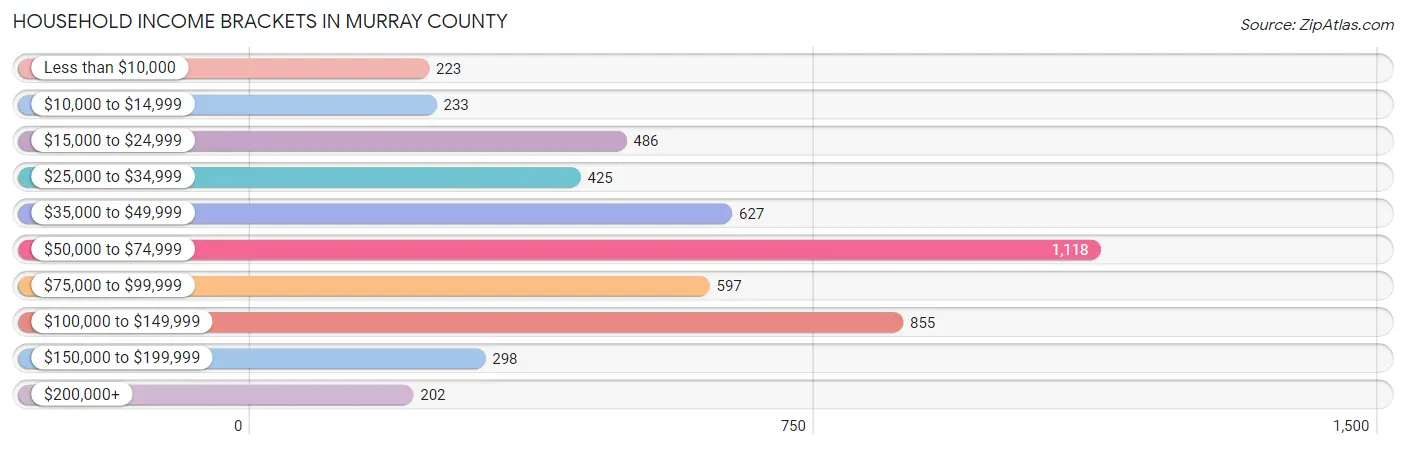
Household Income Brackets in Murray County
With 1,118 households falling in the category, the $50,000 to $74,999 income range is the most frequent in Murray County, accounting for 22.1% of all households. In contrast, only 202 households (4.0%) fall into the $200,000+ income bracket, making it the least populous group.
| Income Bracket | # Households | % Households |
| Less than $10,000 | 223 | 4.4% |
| $10,000 to $14,999 | 233 | 4.6% |
| $15,000 to $24,999 | 486 | 9.6% |
| $25,000 to $34,999 | 425 | 8.4% |
| $35,000 to $49,999 | 627 | 12.4% |
| $50,000 to $74,999 | 1,118 | 22.1% |
| $75,000 to $99,999 | 597 | 11.8% |
| $100,000 to $149,999 | 855 | 16.9% |
| $150,000 to $199,999 | 298 | 5.9% |
| $200,000+ | 202 | 4.0% |
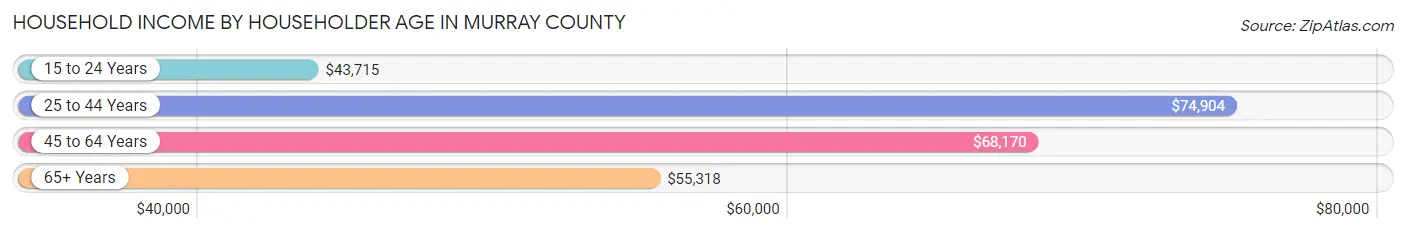
Household Income by Householder Age in Murray County
The median household income in Murray County is $60,213, with the highest median household income of $74,904 found in the 25 to 44 years age bracket for the primary householder. A total of 1,241 households (24.5%) fall into this category. Meanwhile, the 15 to 24 years age bracket for the primary householder has the lowest median household income of $43,715, with 225 households (4.4%) in this group.
| Income Bracket | # Households | Median Income |
| 15 to 24 Years | 225 (4.4%) | $43,715 |
| 25 to 44 Years | 1,241 (24.5%) | $74,904 |
| 45 to 64 Years | 2,044 (40.4%) | $68,170 |
| 65+ Years | 1,549 (30.6%) | $55,318 |
| Total | 5,059 (100.0%) | $60,213 |
Poverty in Murray County
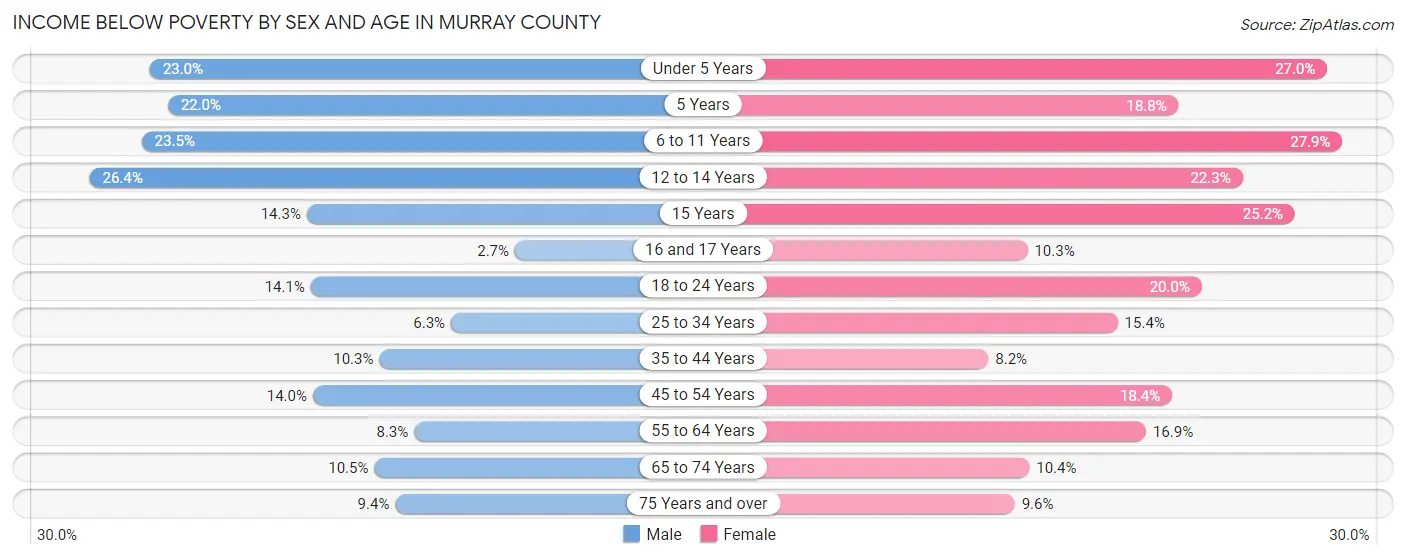
Income Below Poverty by Sex and Age in Murray County
With 12.9% poverty level for males and 16.4% for females among the residents of Murray County, 12 to 14 year old males and 6 to 11 year old females are the most vulnerable to poverty, with 91 males (26.4%) and 124 females (27.9%) in their respective age groups living below the poverty level.
| Age Bracket | Male | Female |
| Under 5 Years | 111 (23.0%) | 90 (27.0%) |
| 5 Years | 13 (22.0%) | 12 (18.8%) |
| 6 to 11 Years | 116 (23.5%) | 124 (27.9%) |
| 12 to 14 Years | 91 (26.4%) | 81 (22.3%) |
| 15 Years | 19 (14.3%) | 28 (25.2%) |
| 16 and 17 Years | 5 (2.7%) | 9 (10.3%) |
| 18 to 24 Years | 82 (14.1%) | 96 (20.0%) |
| 25 to 34 Years | 49 (6.3%) | 114 (15.4%) |
| 35 to 44 Years | 81 (10.2%) | 62 (8.2%) |
| 45 to 54 Years | 114 (14.0%) | 155 (18.4%) |
| 55 to 64 Years | 78 (8.3%) | 167 (16.9%) |
| 65 to 74 Years | 71 (10.5%) | 76 (10.4%) |
| 75 Years and over | 51 (9.4%) | 54 (9.6%) |
| Total | 881 (12.9%) | 1,068 (16.4%) |
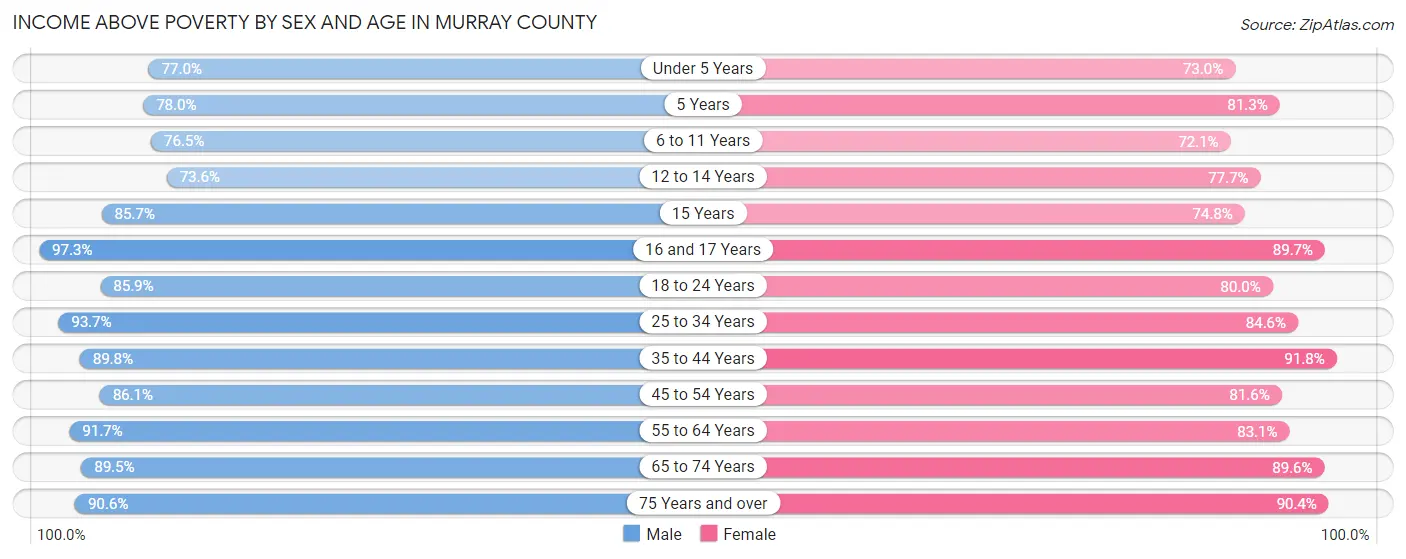
Income Above Poverty by Sex and Age in Murray County
According to the poverty statistics in Murray County, males aged 16 and 17 years and females aged 35 to 44 years are the age groups that are most secure financially, with 97.3% of males and 91.8% of females in these age groups living above the poverty line.
| Age Bracket | Male | Female |
| Under 5 Years | 371 (77.0%) | 243 (73.0%) |
| 5 Years | 46 (78.0%) | 52 (81.2%) |
| 6 to 11 Years | 378 (76.5%) | 321 (72.1%) |
| 12 to 14 Years | 254 (73.6%) | 282 (77.7%) |
| 15 Years | 114 (85.7%) | 83 (74.8%) |
| 16 and 17 Years | 180 (97.3%) | 78 (89.7%) |
| 18 to 24 Years | 501 (85.9%) | 383 (80.0%) |
| 25 to 34 Years | 734 (93.7%) | 628 (84.6%) |
| 35 to 44 Years | 709 (89.7%) | 698 (91.8%) |
| 45 to 54 Years | 703 (86.1%) | 688 (81.6%) |
| 55 to 64 Years | 861 (91.7%) | 819 (83.1%) |
| 65 to 74 Years | 603 (89.5%) | 652 (89.6%) |
| 75 Years and over | 494 (90.6%) | 507 (90.4%) |
| Total | 5,948 (87.1%) | 5,434 (83.6%) |
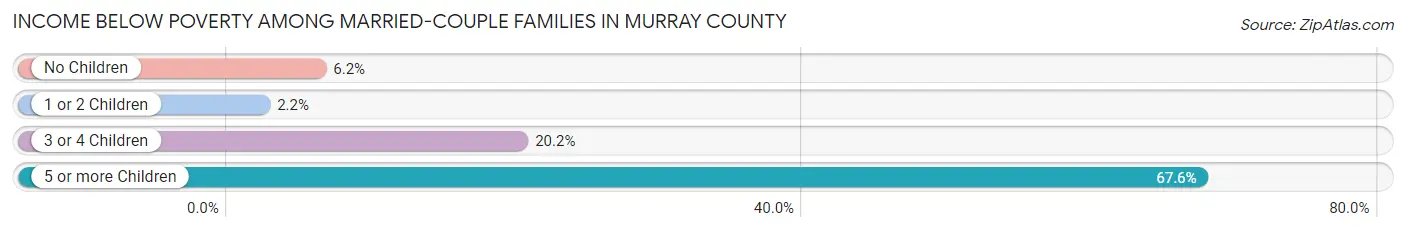
Income Below Poverty Among Married-Couple Families in Murray County
The poverty statistics for married-couple families in Murray County show that 7.6% or 197 of the total 2,588 families live below the poverty line. Families with 5 or more children have the highest poverty rate of 67.6%, comprising of 25 families. On the other hand, families with 1 or 2 children have the lowest poverty rate of 2.2%, which includes 14 families.
| Children | Above Poverty | Below Poverty |
| No Children | 1,542 (93.9%) | 101 (6.1%) |
| 1 or 2 Children | 612 (97.8%) | 14 (2.2%) |
| 3 or 4 Children | 225 (79.8%) | 57 (20.2%) |
| 5 or more Children | 12 (32.4%) | 25 (67.6%) |
| Total | 2,391 (92.4%) | 197 (7.6%) |
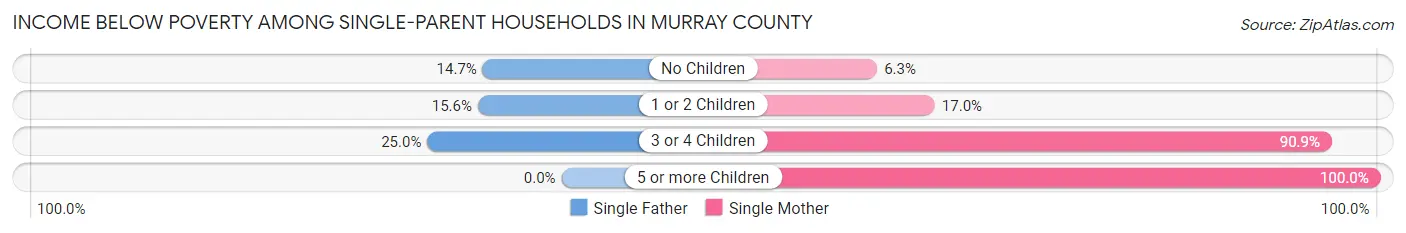
Income Below Poverty Among Single-Parent Households in Murray County
According to the poverty data in Murray County, 16.5% or 58 single-father households and 21.3% or 100 single-mother households are living below the poverty line. Among single-father households, those with 3 or 4 children have the highest poverty rate, with 14 households (25.0%) experiencing poverty. Likewise, among single-mother households, those with 5 or more children have the highest poverty rate, with 6 households (100.0%) falling below the poverty line.
| Children | Single Father | Single Mother |
| No Children | 32 (14.7%) | 10 (6.2%) |
| 1 or 2 Children | 12 (15.6%) | 44 (17.0%) |
| 3 or 4 Children | 14 (25.0%) | 40 (90.9%) |
| 5 or more Children | 0 (0.0%) | 6 (100.0%) |
| Total | 58 (16.5%) | 100 (21.3%) |
Income Below Poverty Among Married-Couple vs Single-Parent Households in Murray County
The poverty data for Murray County shows that 197 of the married-couple family households (7.6%) and 158 of the single-parent households (19.3%) are living below the poverty level. Within the married-couple family households, those with 5 or more children have the highest poverty rate, with 25 households (67.6%) falling below the poverty line. Among the single-parent households, those with 5 or more children have the highest poverty rate, with 6 household (100.0%) living below poverty.
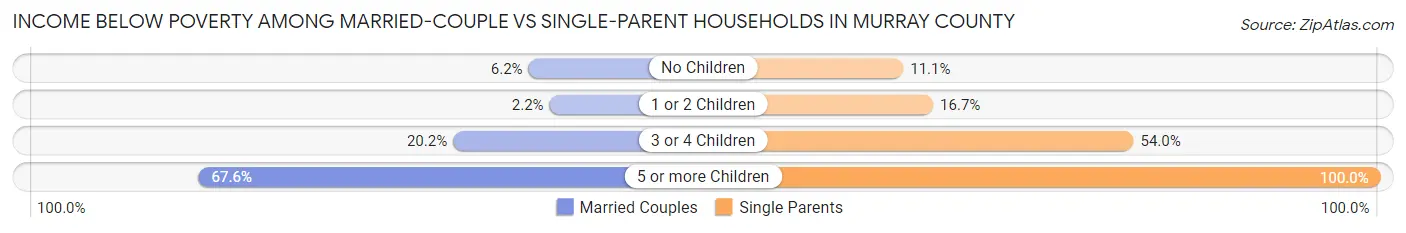
| Children | Married-Couple Families | Single-Parent Households |
| No Children | 101 (6.1%) | 42 (11.1%) |
| 1 or 2 Children | 14 (2.2%) | 56 (16.7%) |
| 3 or 4 Children | 57 (20.2%) | 54 (54.0%) |
| 5 or more Children | 25 (67.6%) | 6 (100.0%) |
| Total | 197 (7.6%) | 158 (19.3%) |
Employment Characteristics in Murray County
Employment by Class of Employer in Murray County
Among the 5,893 employed individuals in Murray County, private company employees (4,039 | 68.5%), local government employees (517 | 8.8%), and self-employed (not incorporated) (445 | 7.5%) make up the most common classes of employment.
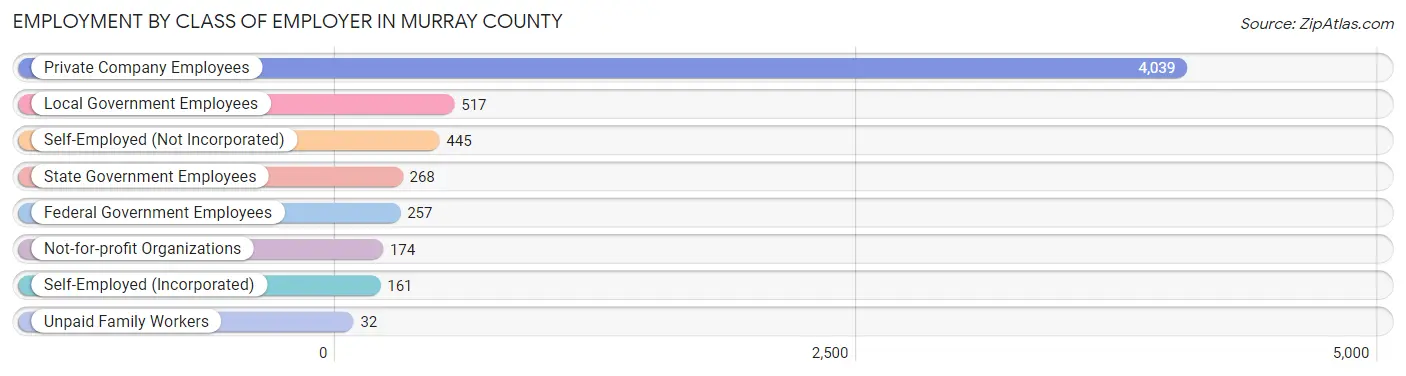
| Employer Class | # Employees | % Employees |
| Private Company Employees | 4,039 | 68.5% |
| Self-Employed (Incorporated) | 161 | 2.7% |
| Self-Employed (Not Incorporated) | 445 | 7.5% |
| Not-for-profit Organizations | 174 | 2.9% |
| Local Government Employees | 517 | 8.8% |
| State Government Employees | 268 | 4.5% |
| Federal Government Employees | 257 | 4.4% |
| Unpaid Family Workers | 32 | 0.5% |
| Total | 5,893 | 100.0% |
Employment Status by Age in Murray County
According to the labor force statistics for Murray County, out of the total population over 16 years of age (10,971), 55.5% or 6,089 individuals are in the labor force, with 2.1% or 128 of them unemployed. The age group with the highest labor force participation rate is 20 to 24 years, with 82.0% or 617 individuals in the labor force. Within the labor force, the 16 to 19 years age range has the highest percentage of unemployed individuals, with 4.8% or 12 of them being unemployed.
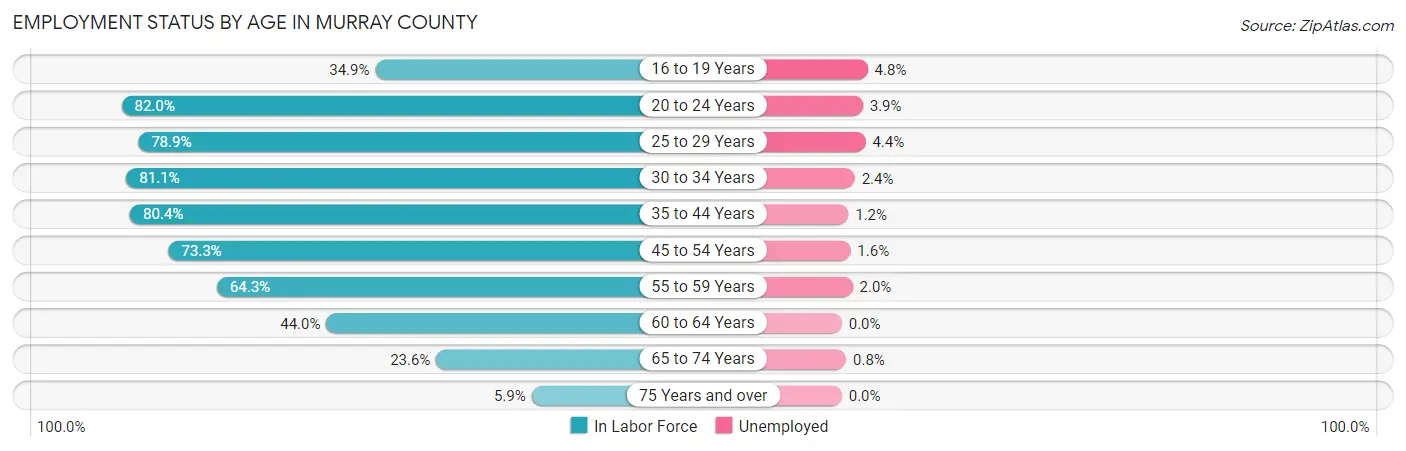
| Age Bracket | In Labor Force | Unemployed |
| 16 to 19 Years | 240 (34.9%) | 12 (4.8%) |
| 20 to 24 Years | 617 (82.0%) | 24 (3.9%) |
| 25 to 29 Years | 662 (78.9%) | 29 (4.4%) |
| 30 to 34 Years | 592 (81.1%) | 14 (2.4%) |
| 35 to 44 Years | 1,256 (80.4%) | 15 (1.2%) |
| 45 to 54 Years | 1,223 (73.3%) | 20 (1.6%) |
| 55 to 59 Years | 603 (64.3%) | 12 (2.0%) |
| 60 to 64 Years | 466 (44.0%) | 0 (0.0%) |
| 65 to 74 Years | 355 (23.6%) | 3 (0.8%) |
| 75 Years and over | 73 (5.9%) | 0 (0.0%) |
| Total | 6,089 (55.5%) | 128 (2.1%) |
Employment Status by Educational Attainment in Murray County
According to labor force statistics for Murray County, 70.7% of individuals (4,804) out of the total population between 25 and 64 years of age (6,795) are in the labor force, with 1.9% or 91 of them being unemployed. The group with the highest labor force participation rate are those with the educational attainment of college / associate degree, with 80.1% or 1,586 individuals in the labor force. Within the labor force, individuals with less than high school education have the highest percentage of unemployment, with 3.1% or 15 of them being unemployed.
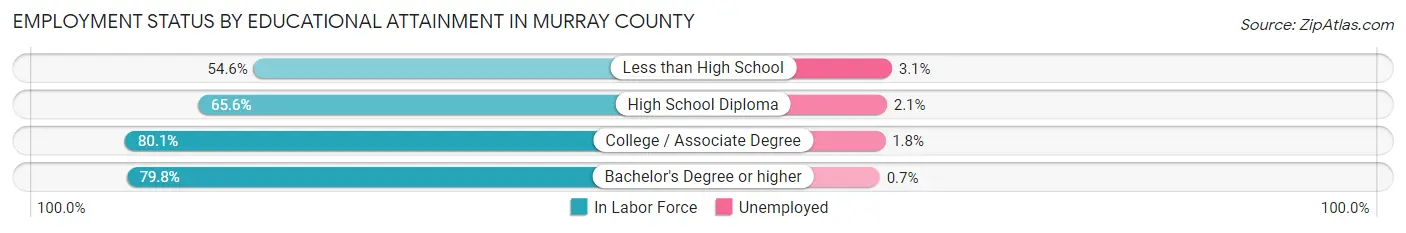
| Educational Attainment | In Labor Force | Unemployed |
| Less than High School | 482 (54.6%) | 27 (3.1%) |
| High School Diploma | 1,872 (65.6%) | 60 (2.1%) |
| College / Associate Degree | 1,586 (80.1%) | 36 (1.8%) |
| Bachelor's Degree or higher | 861 (79.8%) | 8 (0.7%) |
| Total | 4,804 (70.7%) | 129 (1.9%) |
Employment Occupations by Sex in Murray County
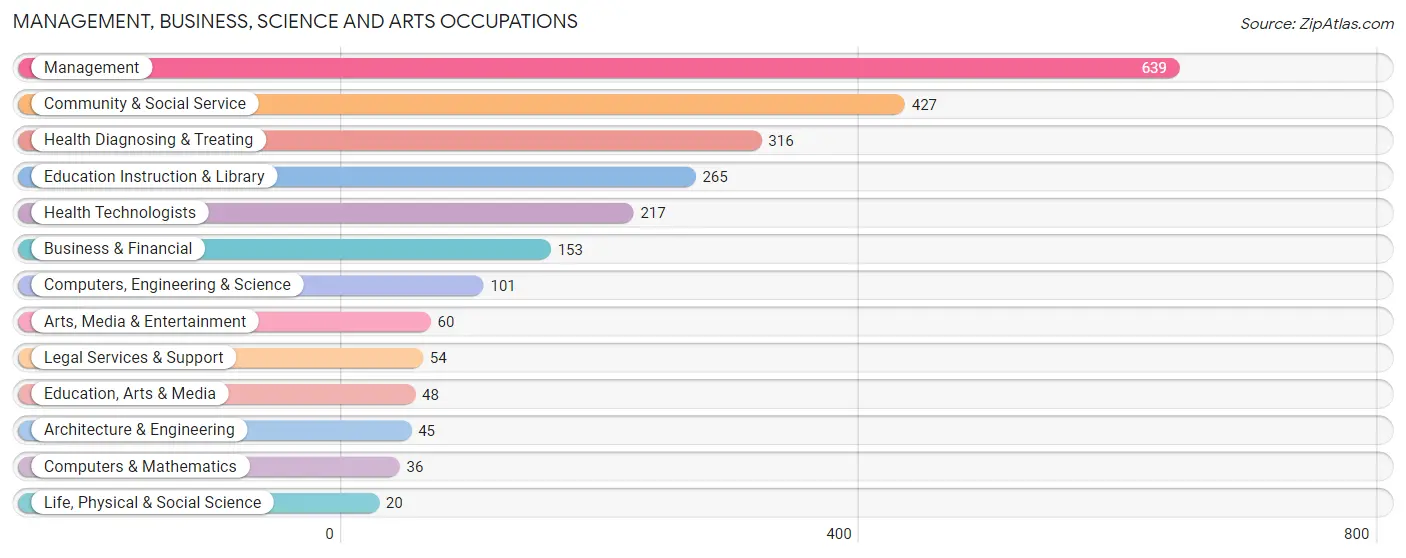
Management, Business, Science and Arts Occupations
The most common Management, Business, Science and Arts occupations in Murray County are Management (639 | 10.7%), Community & Social Service (427 | 7.2%), Health Diagnosing & Treating (316 | 5.3%), Education Instruction & Library (265 | 4.4%), and Health Technologists (217 | 3.6%).
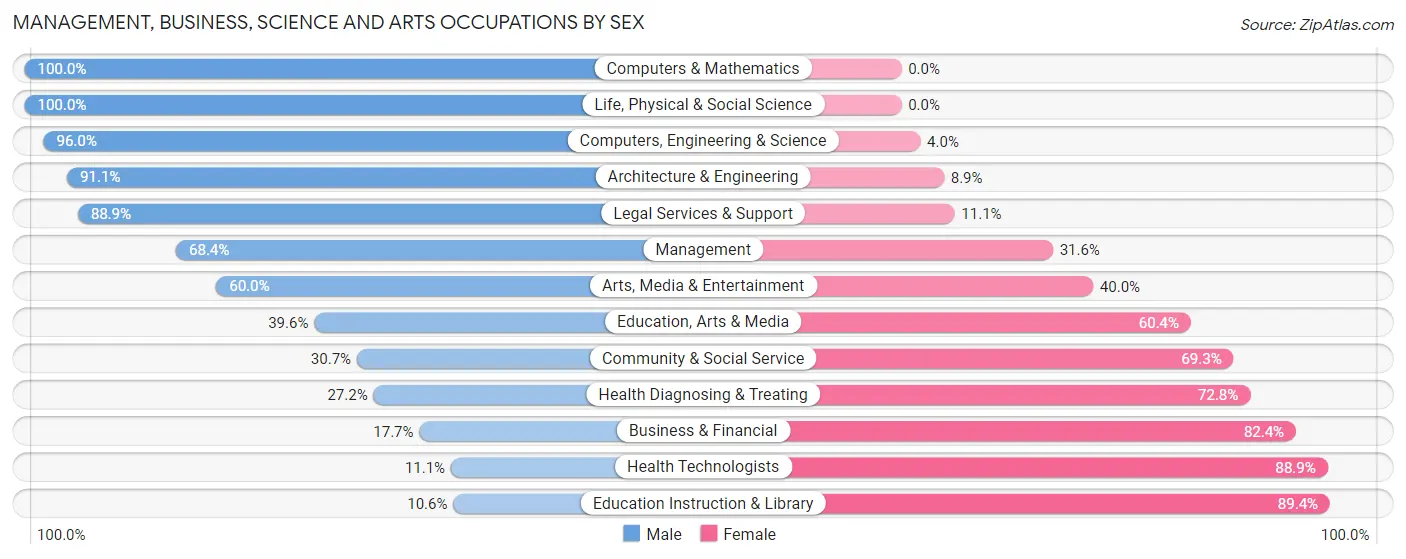
Management, Business, Science and Arts Occupations by Sex
Within the Management, Business, Science and Arts occupations in Murray County, the most male-oriented occupations are Computers & Mathematics (100.0%), Life, Physical & Social Science (100.0%), and Computers, Engineering & Science (96.0%), while the most female-oriented occupations are Education Instruction & Library (89.4%), Health Technologists (88.9%), and Business & Financial (82.4%).
| Occupation | Male | Female |
| Management | 437 (68.4%) | 202 (31.6%) |
| Business & Financial | 27 (17.6%) | 126 (82.4%) |
| Computers, Engineering & Science | 97 (96.0%) | 4 (4.0%) |
| Computers & Mathematics | 36 (100.0%) | 0 (0.0%) |
| Architecture & Engineering | 41 (91.1%) | 4 (8.9%) |
| Life, Physical & Social Science | 20 (100.0%) | 0 (0.0%) |
| Community & Social Service | 131 (30.7%) | 296 (69.3%) |
| Education, Arts & Media | 19 (39.6%) | 29 (60.4%) |
| Legal Services & Support | 48 (88.9%) | 6 (11.1%) |
| Education Instruction & Library | 28 (10.6%) | 237 (89.4%) |
| Arts, Media & Entertainment | 36 (60.0%) | 24 (40.0%) |
| Health Diagnosing & Treating | 86 (27.2%) | 230 (72.8%) |
| Health Technologists | 24 (11.1%) | 193 (88.9%) |
| Total (Category) | 778 (47.6%) | 858 (52.4%) |
| Total (Overall) | 3,267 (54.9%) | 2,683 (45.1%) |
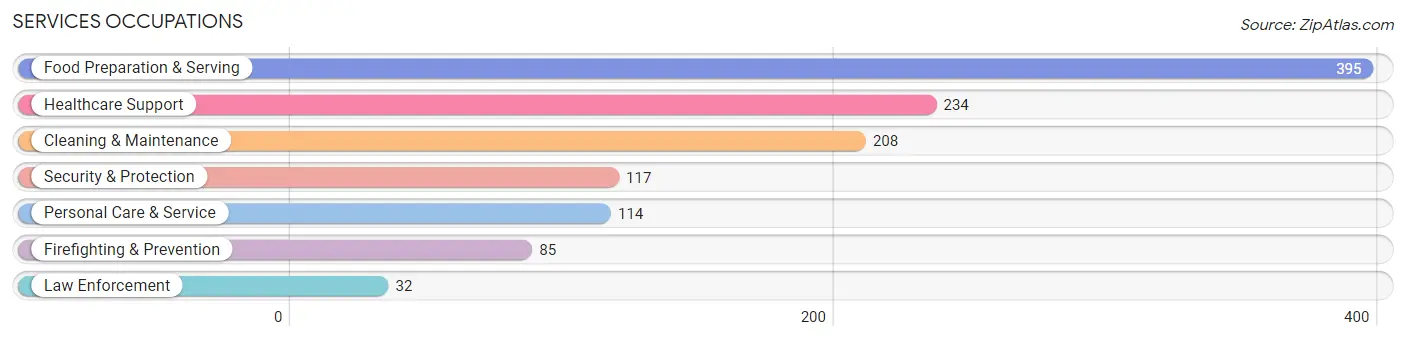
Services Occupations
The most common Services occupations in Murray County are Food Preparation & Serving (395 | 6.6%), Healthcare Support (234 | 3.9%), Cleaning & Maintenance (208 | 3.5%), Security & Protection (117 | 2.0%), and Personal Care & Service (114 | 1.9%).
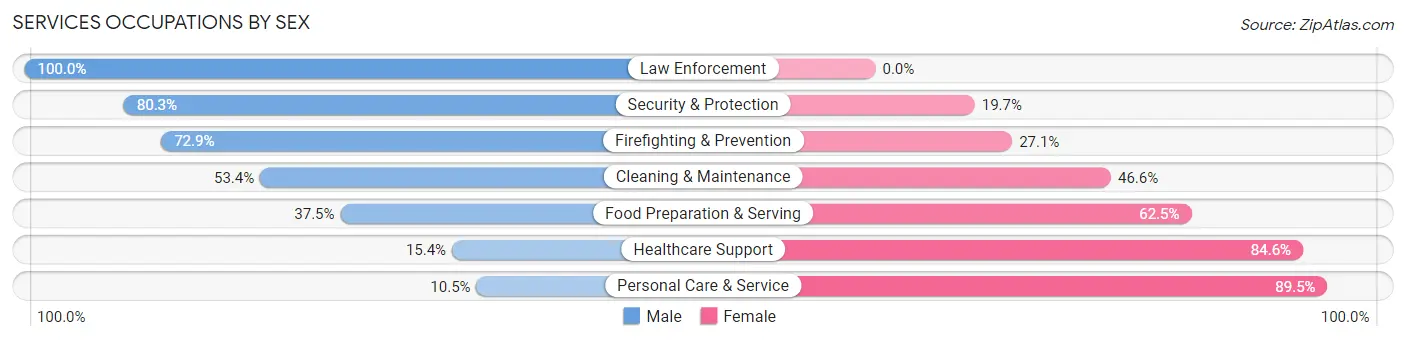
Services Occupations by Sex
Within the Services occupations in Murray County, the most male-oriented occupations are Law Enforcement (100.0%), Security & Protection (80.3%), and Firefighting & Prevention (72.9%), while the most female-oriented occupations are Personal Care & Service (89.5%), Healthcare Support (84.6%), and Food Preparation & Serving (62.5%).
| Occupation | Male | Female |
| Healthcare Support | 36 (15.4%) | 198 (84.6%) |
| Security & Protection | 94 (80.3%) | 23 (19.7%) |
| Firefighting & Prevention | 62 (72.9%) | 23 (27.1%) |
| Law Enforcement | 32 (100.0%) | 0 (0.0%) |
| Food Preparation & Serving | 148 (37.5%) | 247 (62.5%) |
| Cleaning & Maintenance | 111 (53.4%) | 97 (46.6%) |
| Personal Care & Service | 12 (10.5%) | 102 (89.5%) |
| Total (Category) | 401 (37.6%) | 667 (62.5%) |
| Total (Overall) | 3,267 (54.9%) | 2,683 (45.1%) |
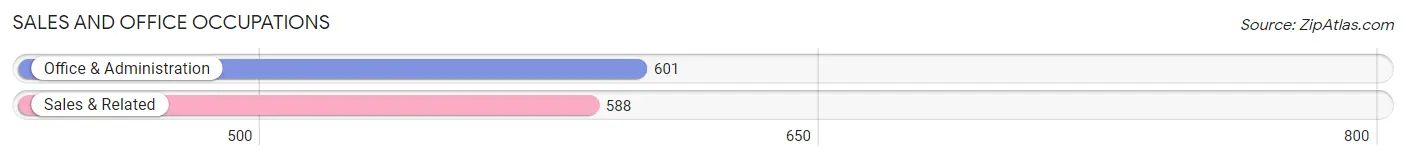
Sales and Office Occupations
The most common Sales and Office occupations in Murray County are Office & Administration (601 | 10.1%), and Sales & Related (588 | 9.9%).
Sales and Office Occupations by Sex
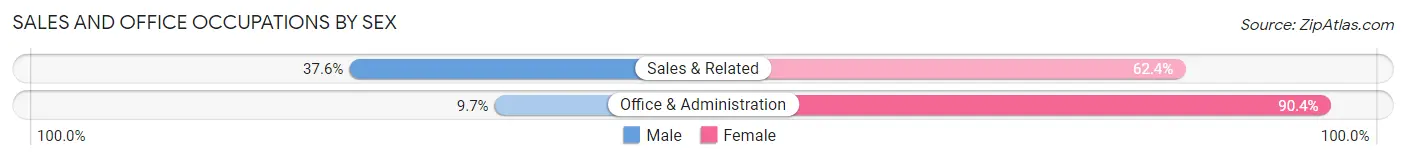
| Occupation | Male | Female |
| Sales & Related | 221 (37.6%) | 367 (62.4%) |
| Office & Administration | 58 (9.7%) | 543 (90.3%) |
| Total (Category) | 279 (23.5%) | 910 (76.5%) |
| Total (Overall) | 3,267 (54.9%) | 2,683 (45.1%) |
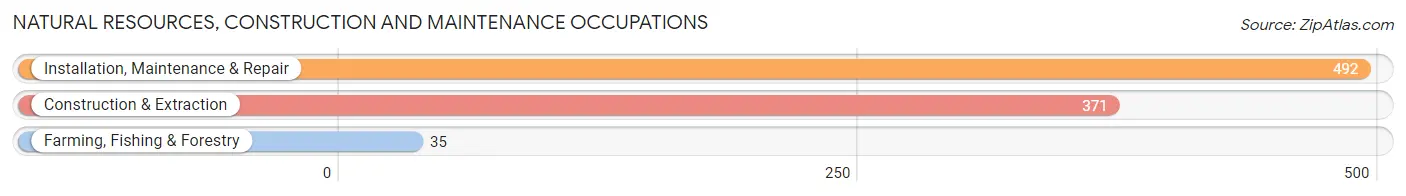
Natural Resources, Construction and Maintenance Occupations
The most common Natural Resources, Construction and Maintenance occupations in Murray County are Installation, Maintenance & Repair (492 | 8.3%), Construction & Extraction (371 | 6.2%), and Farming, Fishing & Forestry (35 | 0.6%).
Natural Resources, Construction and Maintenance Occupations by Sex
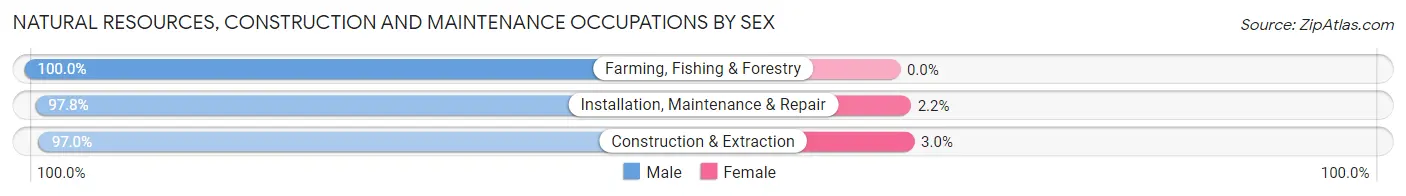
| Occupation | Male | Female |
| Farming, Fishing & Forestry | 35 (100.0%) | 0 (0.0%) |
| Construction & Extraction | 360 (97.0%) | 11 (3.0%) |
| Installation, Maintenance & Repair | 481 (97.8%) | 11 (2.2%) |
| Total (Category) | 876 (97.6%) | 22 (2.5%) |
| Total (Overall) | 3,267 (54.9%) | 2,683 (45.1%) |
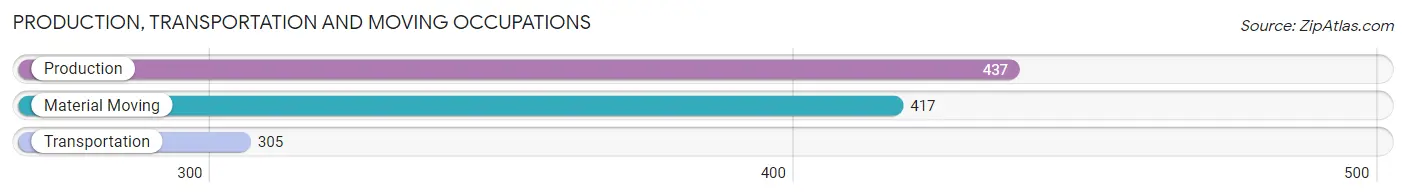
Production, Transportation and Moving Occupations
The most common Production, Transportation and Moving occupations in Murray County are Production (437 | 7.3%), Material Moving (417 | 7.0%), and Transportation (305 | 5.1%).
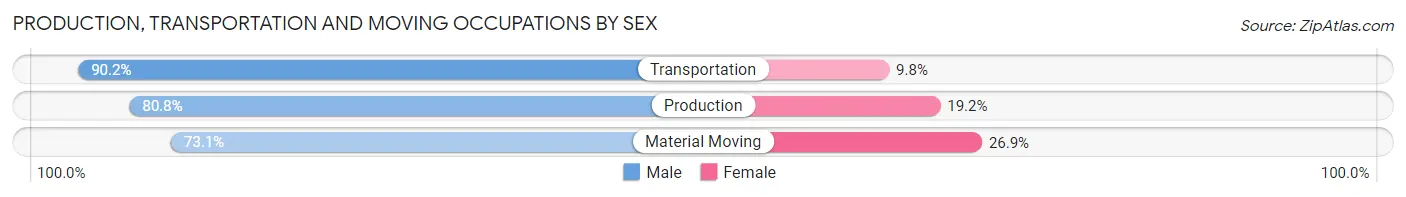
Production, Transportation and Moving Occupations by Sex
| Occupation | Male | Female |
| Production | 353 (80.8%) | 84 (19.2%) |
| Transportation | 275 (90.2%) | 30 (9.8%) |
| Material Moving | 305 (73.1%) | 112 (26.9%) |
| Total (Category) | 933 (80.5%) | 226 (19.5%) |
| Total (Overall) | 3,267 (54.9%) | 2,683 (45.1%) |
Employment Industries by Sex in Murray County
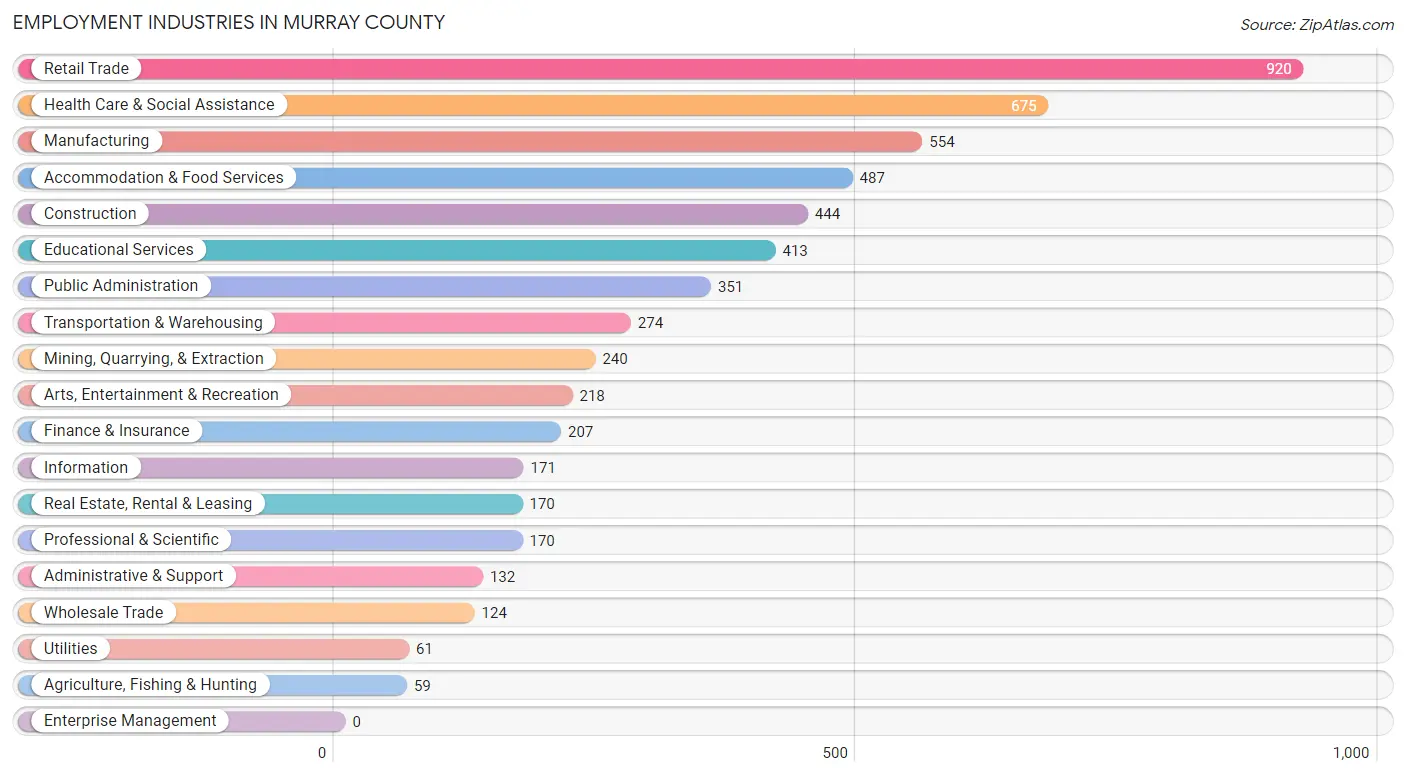
Employment Industries in Murray County
The major employment industries in Murray County include Retail Trade (920 | 15.5%), Health Care & Social Assistance (675 | 11.3%), Manufacturing (554 | 9.3%), Accommodation & Food Services (487 | 8.2%), and Construction (444 | 7.5%).
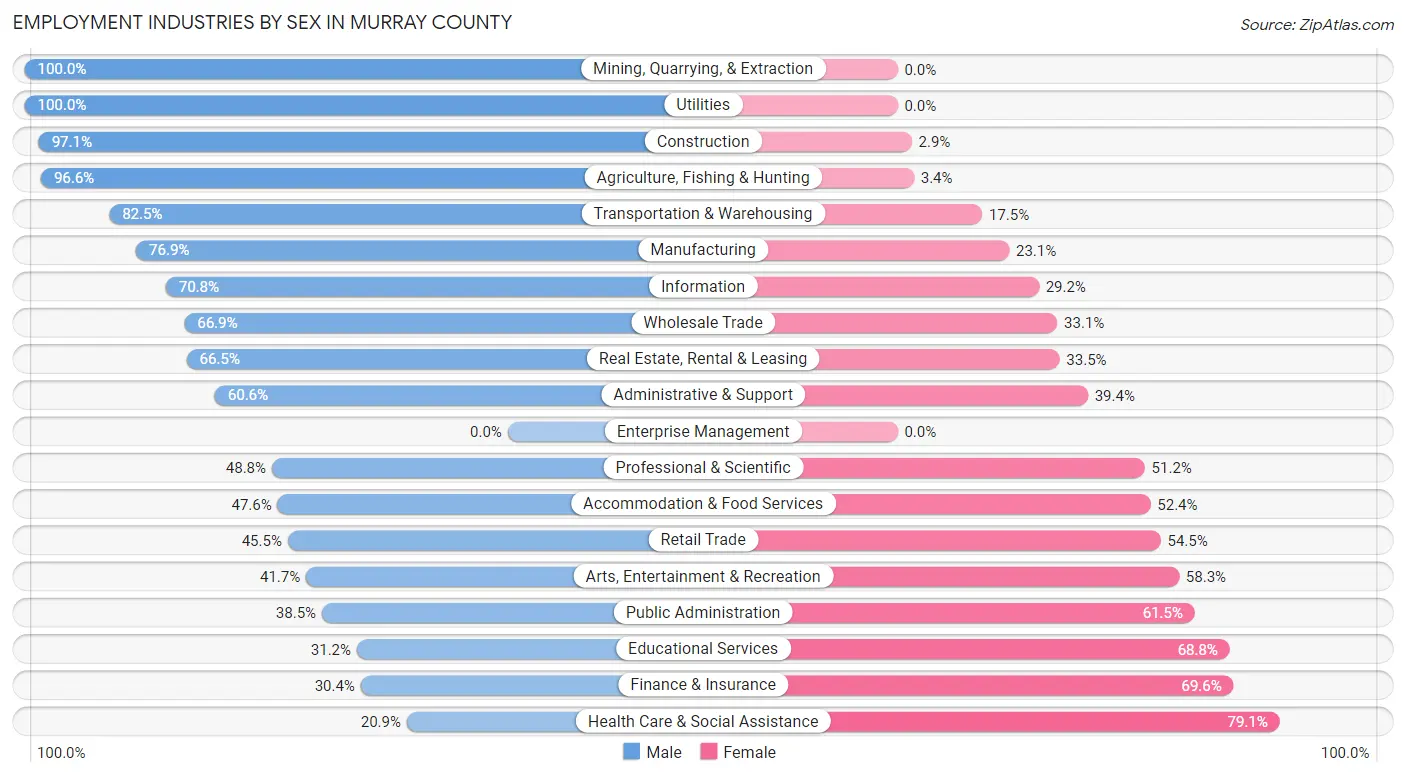
Employment Industries by Sex in Murray County
The Murray County industries that see more men than women are Mining, Quarrying, & Extraction (100.0%), Utilities (100.0%), and Construction (97.1%), whereas the industries that tend to have a higher number of women are Health Care & Social Assistance (79.1%), Finance & Insurance (69.6%), and Educational Services (68.8%).
| Industry | Male | Female |
| Agriculture, Fishing & Hunting | 57 (96.6%) | 2 (3.4%) |
| Mining, Quarrying, & Extraction | 240 (100.0%) | 0 (0.0%) |
| Construction | 431 (97.1%) | 13 (2.9%) |
| Manufacturing | 426 (76.9%) | 128 (23.1%) |
| Wholesale Trade | 83 (66.9%) | 41 (33.1%) |
| Retail Trade | 419 (45.5%) | 501 (54.5%) |
| Transportation & Warehousing | 226 (82.5%) | 48 (17.5%) |
| Utilities | 61 (100.0%) | 0 (0.0%) |
| Information | 121 (70.8%) | 50 (29.2%) |
| Finance & Insurance | 63 (30.4%) | 144 (69.6%) |
| Real Estate, Rental & Leasing | 113 (66.5%) | 57 (33.5%) |
| Professional & Scientific | 83 (48.8%) | 87 (51.2%) |
| Enterprise Management | 0 (0.0%) | 0 (0.0%) |
| Administrative & Support | 80 (60.6%) | 52 (39.4%) |
| Educational Services | 129 (31.2%) | 284 (68.8%) |
| Health Care & Social Assistance | 141 (20.9%) | 534 (79.1%) |
| Arts, Entertainment & Recreation | 91 (41.7%) | 127 (58.3%) |
| Accommodation & Food Services | 232 (47.6%) | 255 (52.4%) |
| Public Administration | 135 (38.5%) | 216 (61.5%) |
| Total | 3,267 (54.9%) | 2,683 (45.1%) |
Education in Murray County
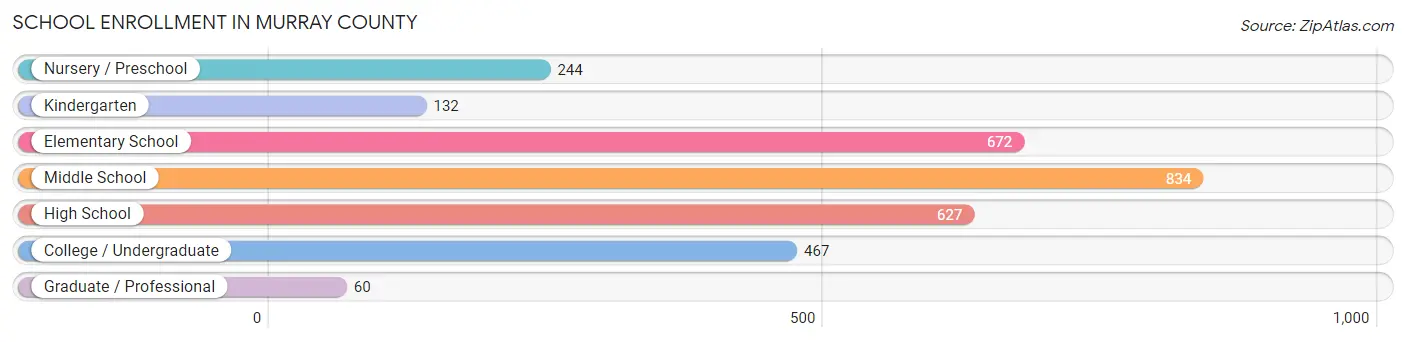
School Enrollment in Murray County
The most common levels of schooling among the 3,036 students in Murray County are middle school (834 | 27.5%), elementary school (672 | 22.1%), and high school (627 | 20.6%).
| School Level | # Students | % Students |
| Nursery / Preschool | 244 | 8.0% |
| Kindergarten | 132 | 4.3% |
| Elementary School | 672 | 22.1% |
| Middle School | 834 | 27.5% |
| High School | 627 | 20.6% |
| College / Undergraduate | 467 | 15.4% |
| Graduate / Professional | 60 | 2.0% |
| Total | 3,036 | 100.0% |
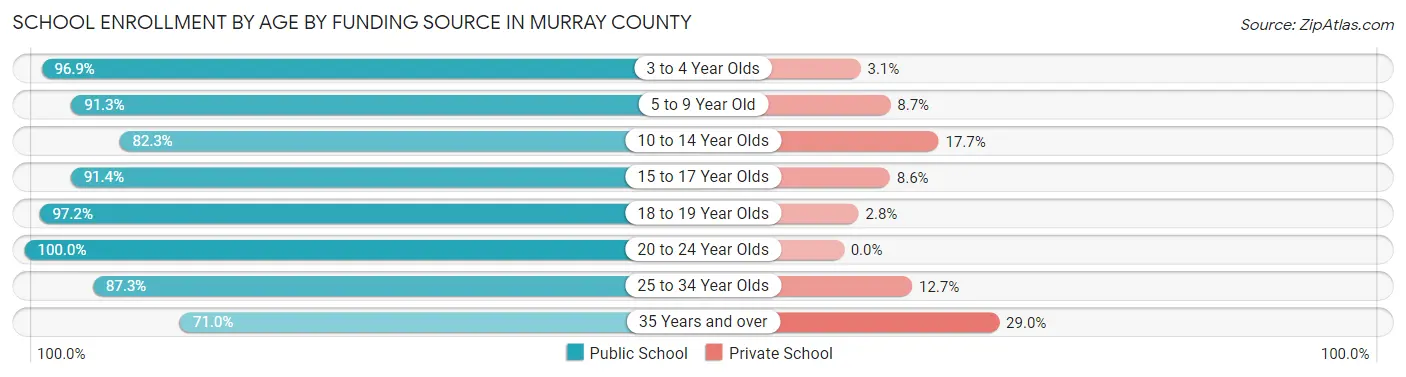
School Enrollment by Age by Funding Source in Murray County
Out of a total of 3,036 students who are enrolled in schools in Murray County, 355 (11.7%) attend a private institution, while the remaining 2,681 (88.3%) are enrolled in public schools. The age group of 35 years and over has the highest likelihood of being enrolled in private schools, with 53 (29.0% in the age bracket) enrolled. Conversely, the age group of 20 to 24 year olds has the lowest likelihood of being enrolled in a private school, with 177 (100.0% in the age bracket) attending a public institution.
| Age Bracket | Public School | Private School |
| 3 to 4 Year Olds | 154 (96.9%) | 5 (3.1%) |
| 5 to 9 Year Old | 682 (91.3%) | 65 (8.7%) |
| 10 to 14 Year Olds | 806 (82.3%) | 173 (17.7%) |
| 15 to 17 Year Olds | 425 (91.4%) | 40 (8.6%) |
| 18 to 19 Year Olds | 210 (97.2%) | 6 (2.8%) |
| 20 to 24 Year Olds | 177 (100.0%) | 0 (0.0%) |
| 25 to 34 Year Olds | 96 (87.3%) | 14 (12.7%) |
| 35 Years and over | 130 (71.0%) | 53 (29.0%) |
| Total | 2,681 (88.3%) | 355 (11.7%) |
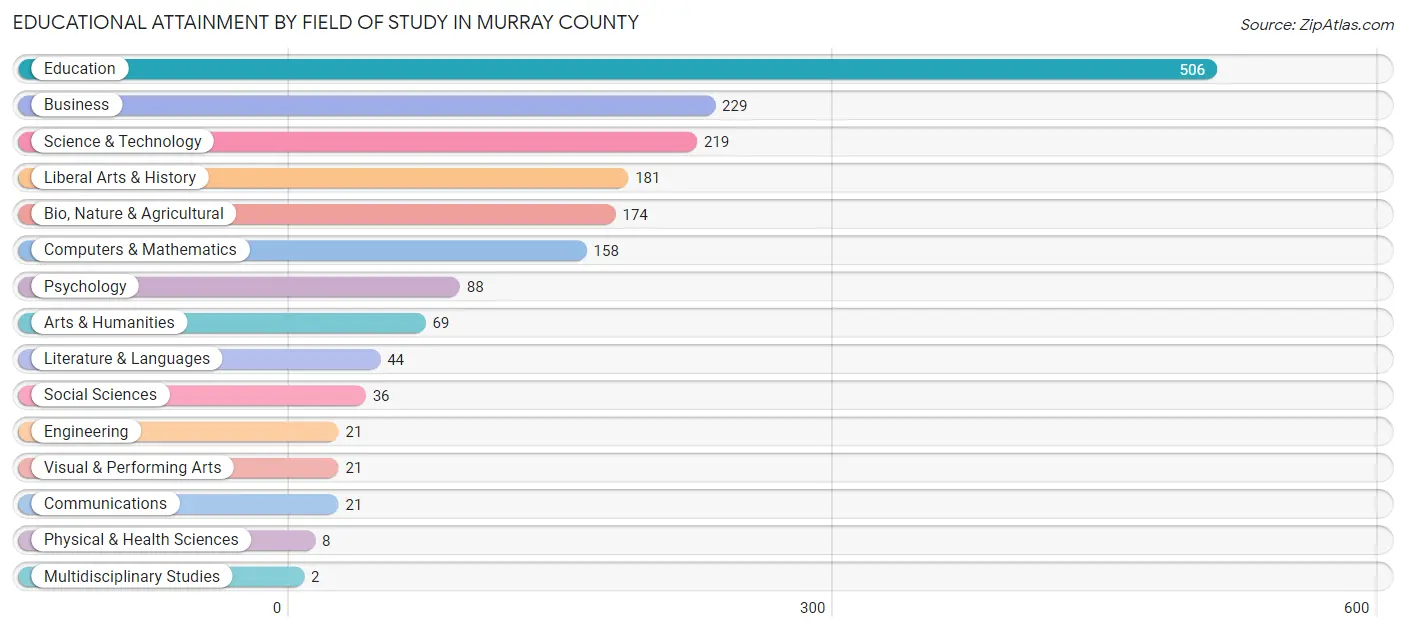
Educational Attainment by Field of Study in Murray County
Education (506 | 28.5%), business (229 | 12.9%), science & technology (219 | 12.3%), liberal arts & history (181 | 10.2%), and bio, nature & agricultural (174 | 9.8%) are the most common fields of study among 1,777 individuals in Murray County who have obtained a bachelor's degree or higher.
| Field of Study | # Graduates | % Graduates |
| Computers & Mathematics | 158 | 8.9% |
| Bio, Nature & Agricultural | 174 | 9.8% |
| Physical & Health Sciences | 8 | 0.4% |
| Psychology | 88 | 5.0% |
| Social Sciences | 36 | 2.0% |
| Engineering | 21 | 1.2% |
| Multidisciplinary Studies | 2 | 0.1% |
| Science & Technology | 219 | 12.3% |
| Business | 229 | 12.9% |
| Education | 506 | 28.5% |
| Literature & Languages | 44 | 2.5% |
| Liberal Arts & History | 181 | 10.2% |
| Visual & Performing Arts | 21 | 1.2% |
| Communications | 21 | 1.2% |
| Arts & Humanities | 69 | 3.9% |
| Total | 1,777 | 100.0% |
Transportation & Commute in Murray County
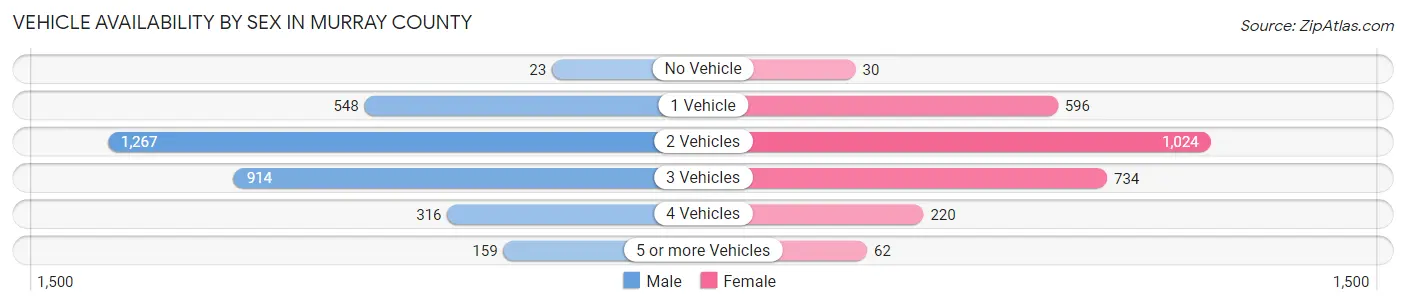
Vehicle Availability by Sex in Murray County
The most prevalent vehicle ownership categories in Murray County are males with 2 vehicles (1,267, accounting for 39.3%) and females with 2 vehicles (1,024, making up 47.5%).
| Vehicles Available | Male | Female |
| No Vehicle | 23 (0.7%) | 30 (1.1%) |
| 1 Vehicle | 548 (17.0%) | 596 (22.4%) |
| 2 Vehicles | 1,267 (39.3%) | 1,024 (38.4%) |
| 3 Vehicles | 914 (28.3%) | 734 (27.5%) |
| 4 Vehicles | 316 (9.8%) | 220 (8.3%) |
| 5 or more Vehicles | 159 (4.9%) | 62 (2.3%) |
| Total | 3,227 (100.0%) | 2,666 (100.0%) |
Commute Time in Murray County
The most frequently occuring commute durations in Murray County are 15 to 19 minutes (1,269 commuters, 22.0%), 10 to 14 minutes (1,056 commuters, 18.3%), and 5 to 9 minutes (812 commuters, 14.1%).
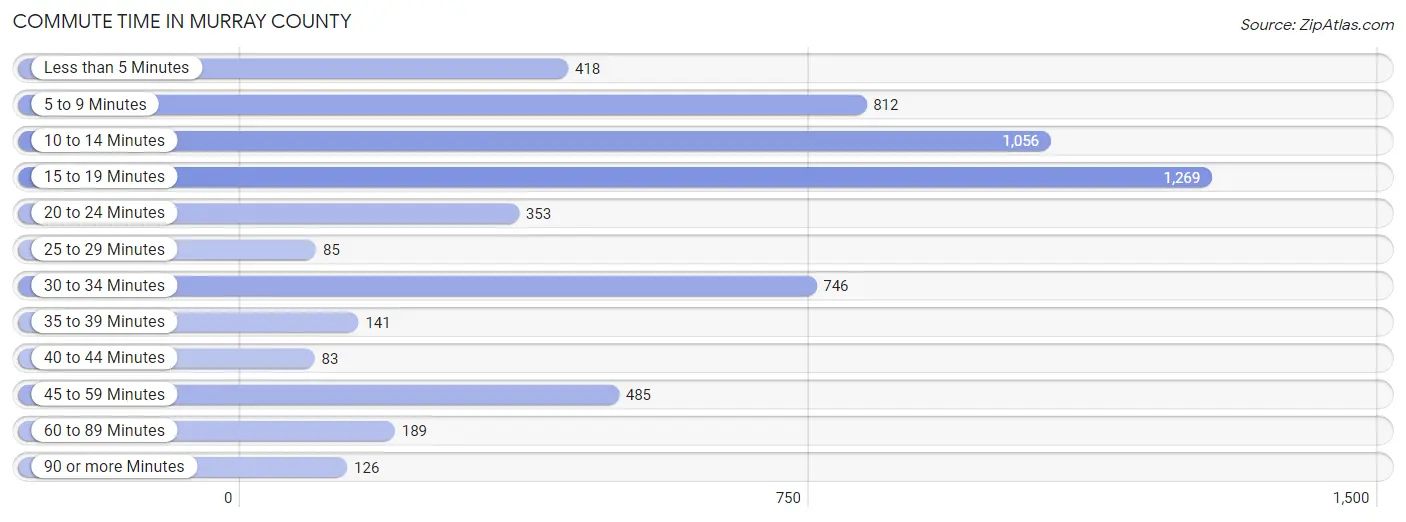
| Commute Time | # Commuters | % Commuters |
| Less than 5 Minutes | 418 | 7.2% |
| 5 to 9 Minutes | 812 | 14.1% |
| 10 to 14 Minutes | 1,056 | 18.3% |
| 15 to 19 Minutes | 1,269 | 22.0% |
| 20 to 24 Minutes | 353 | 6.1% |
| 25 to 29 Minutes | 85 | 1.5% |
| 30 to 34 Minutes | 746 | 12.9% |
| 35 to 39 Minutes | 141 | 2.5% |
| 40 to 44 Minutes | 83 | 1.4% |
| 45 to 59 Minutes | 485 | 8.4% |
| 60 to 89 Minutes | 189 | 3.3% |
| 90 or more Minutes | 126 | 2.2% |
Commute Time by Sex in Murray County
The most common commute times in Murray County are 15 to 19 minutes (678 commuters, 21.8%) for males and 10 to 14 minutes (607 commuters, 22.9%) for females.
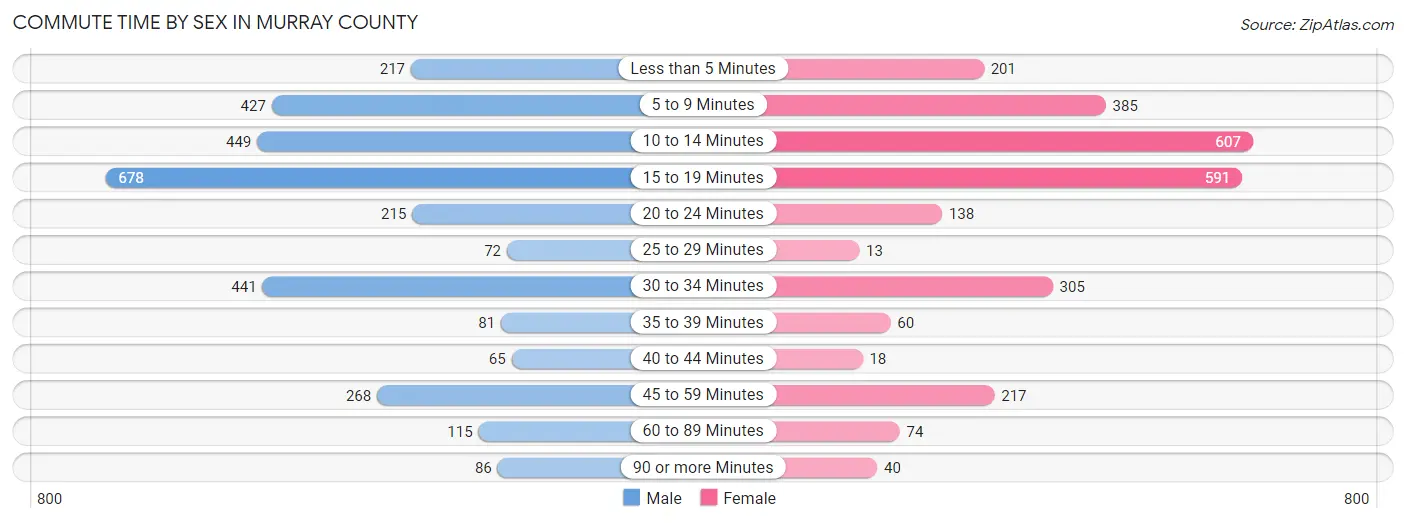
| Commute Time | Male | Female |
| Less than 5 Minutes | 217 (7.0%) | 201 (7.6%) |
| 5 to 9 Minutes | 427 (13.7%) | 385 (14.5%) |
| 10 to 14 Minutes | 449 (14.4%) | 607 (22.9%) |
| 15 to 19 Minutes | 678 (21.8%) | 591 (22.3%) |
| 20 to 24 Minutes | 215 (6.9%) | 138 (5.2%) |
| 25 to 29 Minutes | 72 (2.3%) | 13 (0.5%) |
| 30 to 34 Minutes | 441 (14.2%) | 305 (11.5%) |
| 35 to 39 Minutes | 81 (2.6%) | 60 (2.3%) |
| 40 to 44 Minutes | 65 (2.1%) | 18 (0.7%) |
| 45 to 59 Minutes | 268 (8.6%) | 217 (8.2%) |
| 60 to 89 Minutes | 115 (3.7%) | 74 (2.8%) |
| 90 or more Minutes | 86 (2.8%) | 40 (1.5%) |
Time of Departure to Work by Sex in Murray County
The most frequent times of departure to work in Murray County are 12:00 AM to 4:59 AM (432, 13.9%) for males and 7:30 AM to 7:59 AM (447, 16.9%) for females.
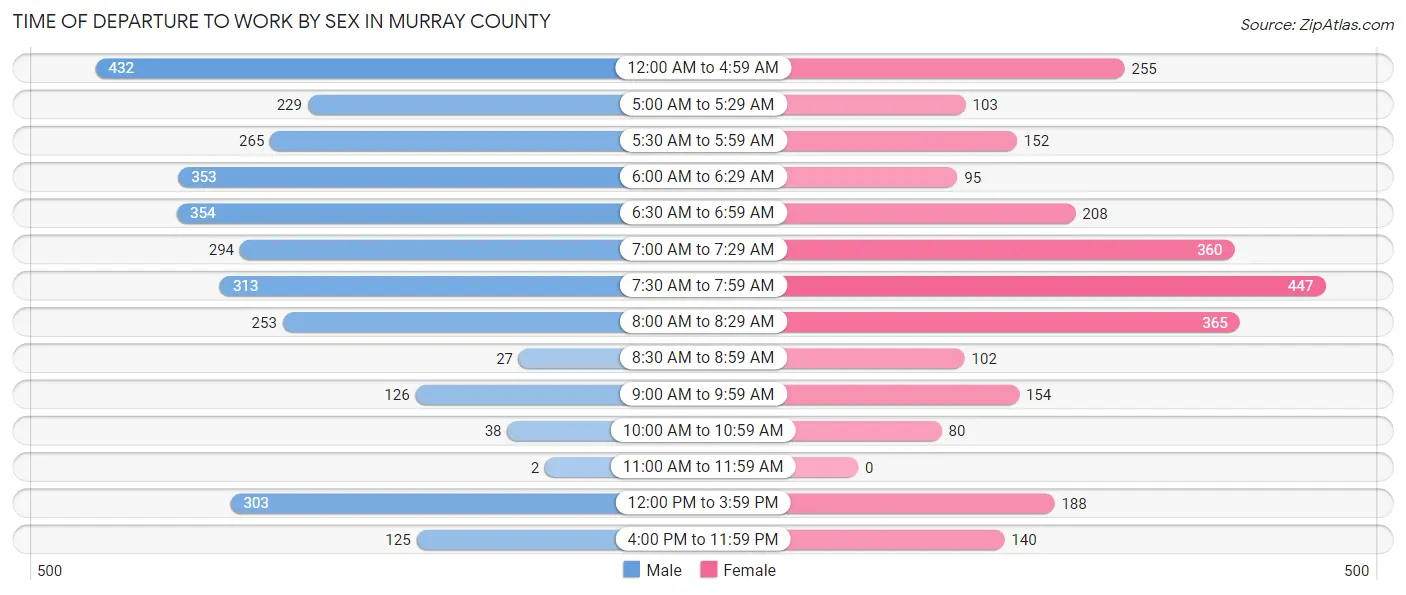
| Time of Departure | Male | Female |
| 12:00 AM to 4:59 AM | 432 (13.9%) | 255 (9.6%) |
| 5:00 AM to 5:29 AM | 229 (7.3%) | 103 (3.9%) |
| 5:30 AM to 5:59 AM | 265 (8.5%) | 152 (5.7%) |
| 6:00 AM to 6:29 AM | 353 (11.3%) | 95 (3.6%) |
| 6:30 AM to 6:59 AM | 354 (11.4%) | 208 (7.9%) |
| 7:00 AM to 7:29 AM | 294 (9.4%) | 360 (13.6%) |
| 7:30 AM to 7:59 AM | 313 (10.1%) | 447 (16.9%) |
| 8:00 AM to 8:29 AM | 253 (8.1%) | 365 (13.8%) |
| 8:30 AM to 8:59 AM | 27 (0.9%) | 102 (3.8%) |
| 9:00 AM to 9:59 AM | 126 (4.1%) | 154 (5.8%) |
| 10:00 AM to 10:59 AM | 38 (1.2%) | 80 (3.0%) |
| 11:00 AM to 11:59 AM | 2 (0.1%) | 0 (0.0%) |
| 12:00 PM to 3:59 PM | 303 (9.7%) | 188 (7.1%) |
| 4:00 PM to 11:59 PM | 125 (4.0%) | 140 (5.3%) |
| Total | 3,114 (100.0%) | 2,649 (100.0%) |
Housing Occupancy in Murray County
Occupancy by Ownership in Murray County
Of the total 5,059 dwellings in Murray County, owner-occupied units account for 3,695 (73.0%), while renter-occupied units make up 1,364 (27.0%).
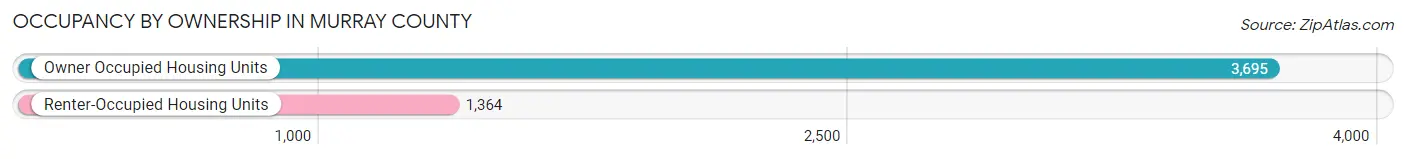
| Occupancy | # Housing Units | % Housing Units |
| Owner Occupied Housing Units | 3,695 | 73.0% |
| Renter-Occupied Housing Units | 1,364 | 27.0% |
| Total Occupied Housing Units | 5,059 | 100.0% |
Occupancy by Household Size in Murray County
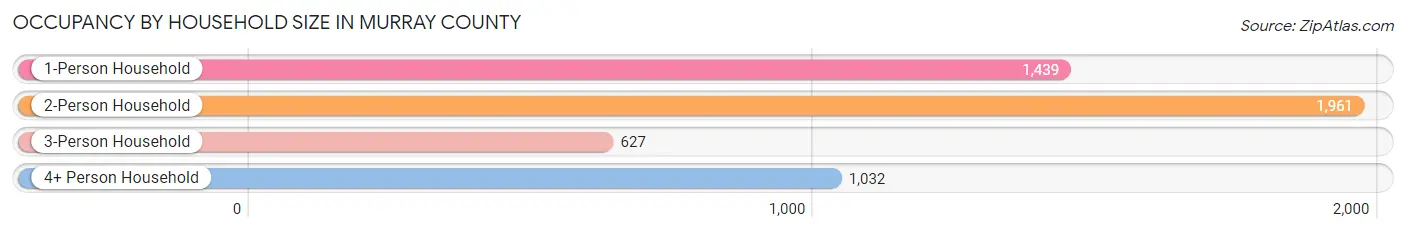
| Household Size | # Housing Units | % Housing Units |
| 1-Person Household | 1,439 | 28.4% |
| 2-Person Household | 1,961 | 38.8% |
| 3-Person Household | 627 | 12.4% |
| 4+ Person Household | 1,032 | 20.4% |
| Total Housing Units | 5,059 | 100.0% |
Occupancy by Ownership by Household Size in Murray County
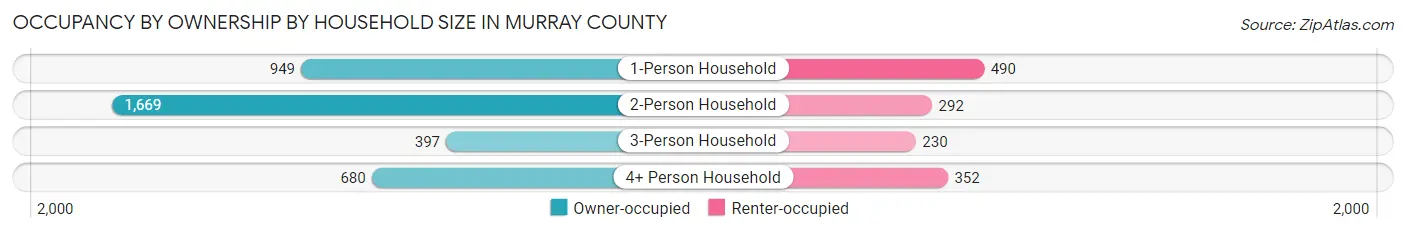
| Household Size | Owner-occupied | Renter-occupied |
| 1-Person Household | 949 (65.9%) | 490 (34.1%) |
| 2-Person Household | 1,669 (85.1%) | 292 (14.9%) |
| 3-Person Household | 397 (63.3%) | 230 (36.7%) |
| 4+ Person Household | 680 (65.9%) | 352 (34.1%) |
| Total Housing Units | 3,695 (73.0%) | 1,364 (27.0%) |
Occupancy by Educational Attainment in Murray County
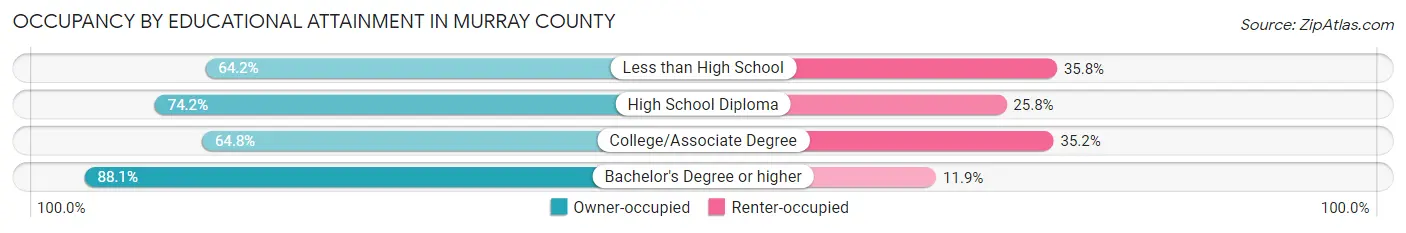
| Household Size | Owner-occupied | Renter-occupied |
| Less than High School | 367 (64.2%) | 205 (35.8%) |
| High School Diploma | 1,462 (74.2%) | 509 (25.8%) |
| College/Associate Degree | 977 (64.8%) | 530 (35.2%) |
| Bachelor's Degree or higher | 889 (88.1%) | 120 (11.9%) |
Occupancy by Age of Householder in Murray County
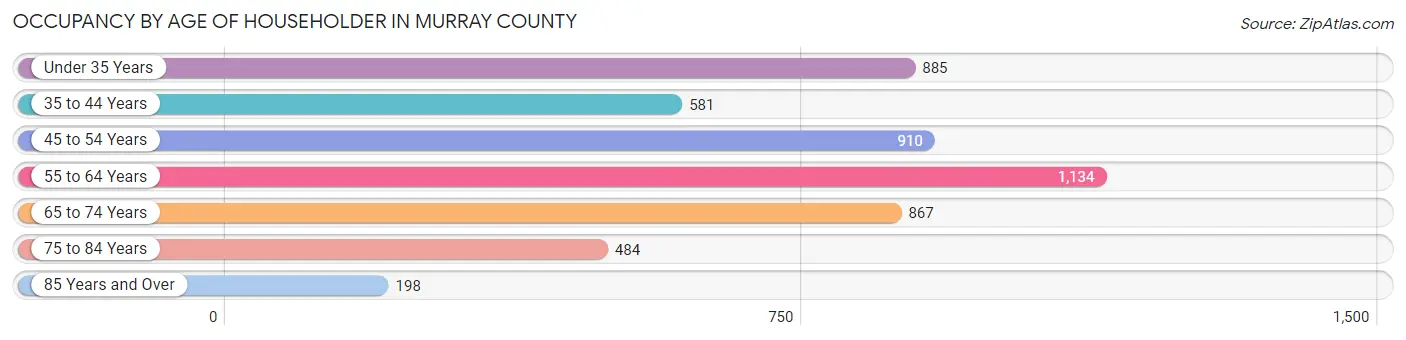
| Age Bracket | # Households | % Households |
| Under 35 Years | 885 | 17.5% |
| 35 to 44 Years | 581 | 11.5% |
| 45 to 54 Years | 910 | 18.0% |
| 55 to 64 Years | 1,134 | 22.4% |
| 65 to 74 Years | 867 | 17.1% |
| 75 to 84 Years | 484 | 9.6% |
| 85 Years and Over | 198 | 3.9% |
| Total | 5,059 | 100.0% |
Housing Finances in Murray County
Median Income by Occupancy in Murray County
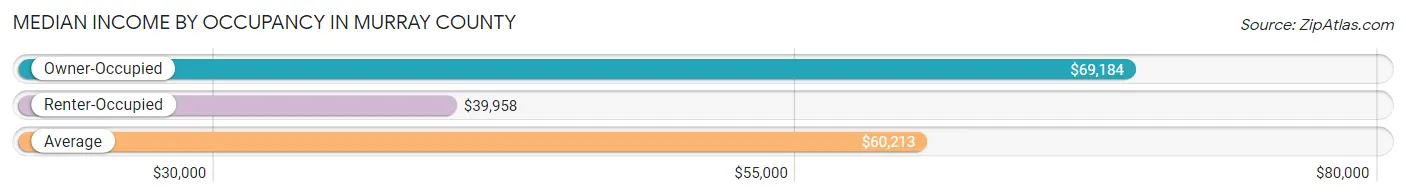
| Occupancy Type | # Households | Median Income |
| Owner-Occupied | 3,695 (73.0%) | $69,184 |
| Renter-Occupied | 1,364 (27.0%) | $39,958 |
| Average | 5,059 (100.0%) | $60,213 |
Occupancy by Householder Income Bracket in Murray County
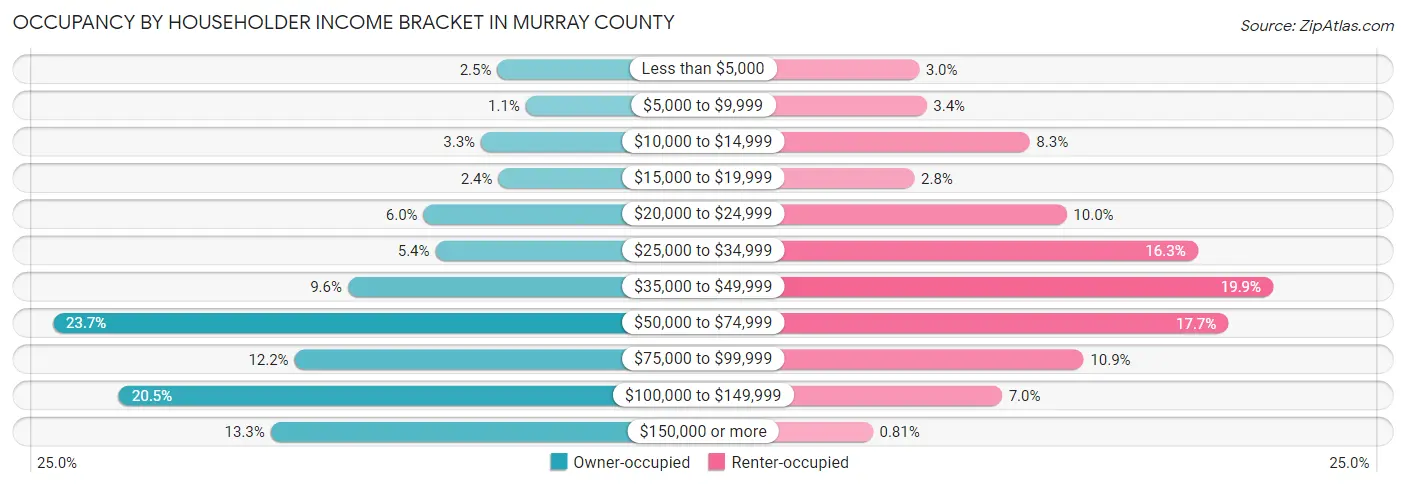
| Income Bracket | Owner-occupied | Renter-occupied |
| Less than $5,000 | 92 (2.5%) | 41 (3.0%) |
| $5,000 to $9,999 | 42 (1.1%) | 46 (3.4%) |
| $10,000 to $14,999 | 121 (3.3%) | 113 (8.3%) |
| $15,000 to $19,999 | 90 (2.4%) | 38 (2.8%) |
| $20,000 to $24,999 | 222 (6.0%) | 137 (10.0%) |
| $25,000 to $34,999 | 201 (5.4%) | 222 (16.3%) |
| $35,000 to $49,999 | 355 (9.6%) | 271 (19.9%) |
| $50,000 to $74,999 | 874 (23.6%) | 242 (17.7%) |
| $75,000 to $99,999 | 449 (12.1%) | 148 (10.8%) |
| $100,000 to $149,999 | 758 (20.5%) | 95 (7.0%) |
| $150,000 or more | 491 (13.3%) | 11 (0.8%) |
| Total | 3,695 (100.0%) | 1,364 (100.0%) |
Monthly Housing Cost Tiers in Murray County
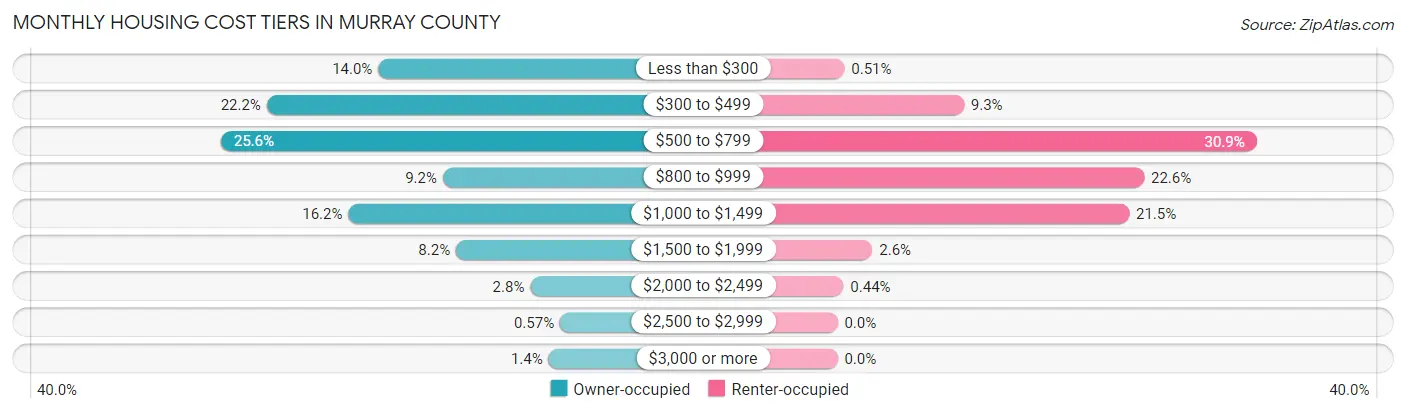
| Monthly Cost | Owner-occupied | Renter-occupied |
| Less than $300 | 516 (14.0%) | 7 (0.5%) |
| $300 to $499 | 819 (22.2%) | 127 (9.3%) |
| $500 to $799 | 944 (25.6%) | 421 (30.9%) |
| $800 to $999 | 340 (9.2%) | 308 (22.6%) |
| $1,000 to $1,499 | 597 (16.2%) | 293 (21.5%) |
| $1,500 to $1,999 | 304 (8.2%) | 35 (2.6%) |
| $2,000 to $2,499 | 102 (2.8%) | 6 (0.4%) |
| $2,500 to $2,999 | 21 (0.6%) | 0 (0.0%) |
| $3,000 or more | 52 (1.4%) | 0 (0.0%) |
| Total | 3,695 (100.0%) | 1,364 (100.0%) |
Physical Housing Characteristics in Murray County
Housing Structures in Murray County
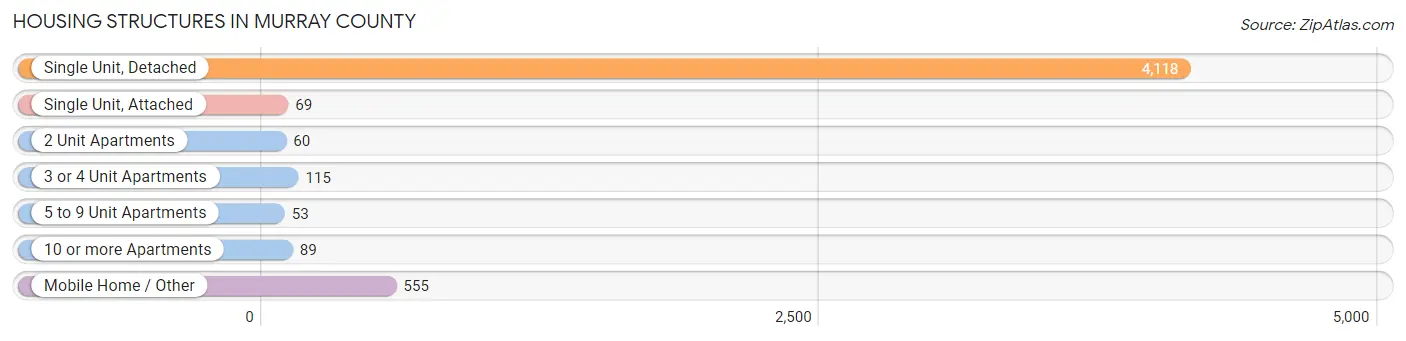
| Structure Type | # Housing Units | % Housing Units |
| Single Unit, Detached | 4,118 | 81.4% |
| Single Unit, Attached | 69 | 1.4% |
| 2 Unit Apartments | 60 | 1.2% |
| 3 or 4 Unit Apartments | 115 | 2.3% |
| 5 to 9 Unit Apartments | 53 | 1.1% |
| 10 or more Apartments | 89 | 1.8% |
| Mobile Home / Other | 555 | 11.0% |
| Total | 5,059 | 100.0% |
Housing Structures by Occupancy in Murray County
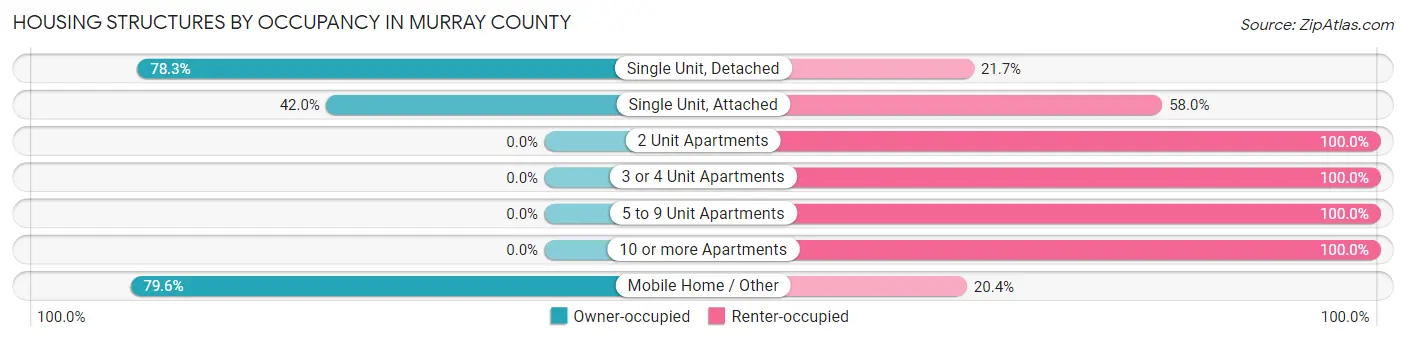
| Structure Type | Owner-occupied | Renter-occupied |
| Single Unit, Detached | 3,224 (78.3%) | 894 (21.7%) |
| Single Unit, Attached | 29 (42.0%) | 40 (58.0%) |
| 2 Unit Apartments | 0 (0.0%) | 60 (100.0%) |
| 3 or 4 Unit Apartments | 0 (0.0%) | 115 (100.0%) |
| 5 to 9 Unit Apartments | 0 (0.0%) | 53 (100.0%) |
| 10 or more Apartments | 0 (0.0%) | 89 (100.0%) |
| Mobile Home / Other | 442 (79.6%) | 113 (20.4%) |
| Total | 3,695 (73.0%) | 1,364 (27.0%) |
Housing Structures by Number of Rooms in Murray County
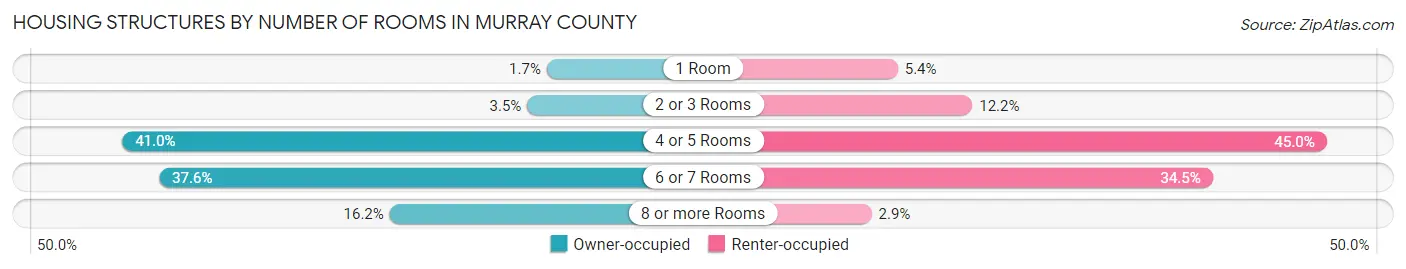
| Number of Rooms | Owner-occupied | Renter-occupied |
| 1 Room | 63 (1.7%) | 73 (5.3%) |
| 2 or 3 Rooms | 130 (3.5%) | 167 (12.2%) |
| 4 or 5 Rooms | 1,514 (41.0%) | 614 (45.0%) |
| 6 or 7 Rooms | 1,388 (37.6%) | 470 (34.5%) |
| 8 or more Rooms | 600 (16.2%) | 40 (2.9%) |
| Total | 3,695 (100.0%) | 1,364 (100.0%) |
Housing Structure by Heating Type in Murray County

| Heating Type | Owner-occupied | Renter-occupied |
| Utility Gas | 926 (25.1%) | 490 (35.9%) |
| Bottled, Tank, or LP Gas | 381 (10.3%) | 101 (7.4%) |
| Electricity | 2,143 (58.0%) | 745 (54.6%) |
| Fuel Oil or Kerosene | 87 (2.4%) | 5 (0.4%) |
| Coal or Coke | 0 (0.0%) | 0 (0.0%) |
| All other Fuels | 156 (4.2%) | 23 (1.7%) |
| No Fuel Used | 2 (0.1%) | 0 (0.0%) |
| Total | 3,695 (100.0%) | 1,364 (100.0%) |
Household Vehicle Usage in Murray County
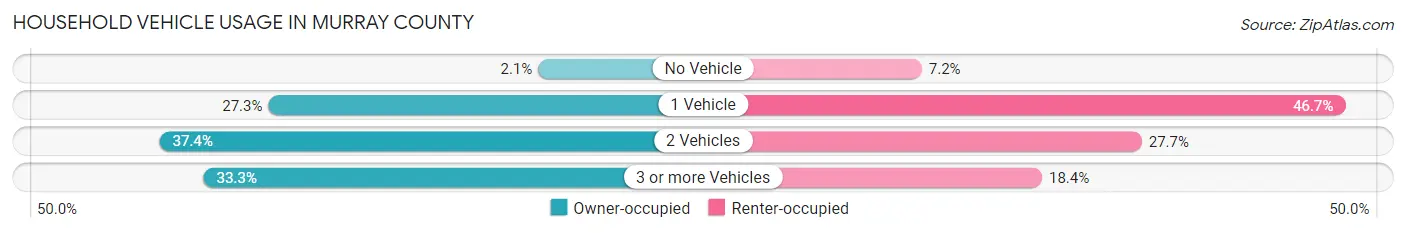
| Vehicles per Household | Owner-occupied | Renter-occupied |
| No Vehicle | 76 (2.1%) | 98 (7.2%) |
| 1 Vehicle | 1,007 (27.3%) | 637 (46.7%) |
| 2 Vehicles | 1,382 (37.4%) | 378 (27.7%) |
| 3 or more Vehicles | 1,230 (33.3%) | 251 (18.4%) |
| Total | 3,695 (100.0%) | 1,364 (100.0%) |
Real Estate & Mortgages in Murray County
Real Estate and Mortgage Overview in Murray County
| Characteristic | Without Mortgage | With Mortgage |
| Housing Units | 2,085 | 1,610 |
| Median Property Value | $123,200 | $178,500 |
| Median Household Income | $56,774 | $255 |
| Monthly Housing Costs | $403 | $37 |
| Real Estate Taxes | $441 | $84 |
Property Value by Mortgage Status in Murray County
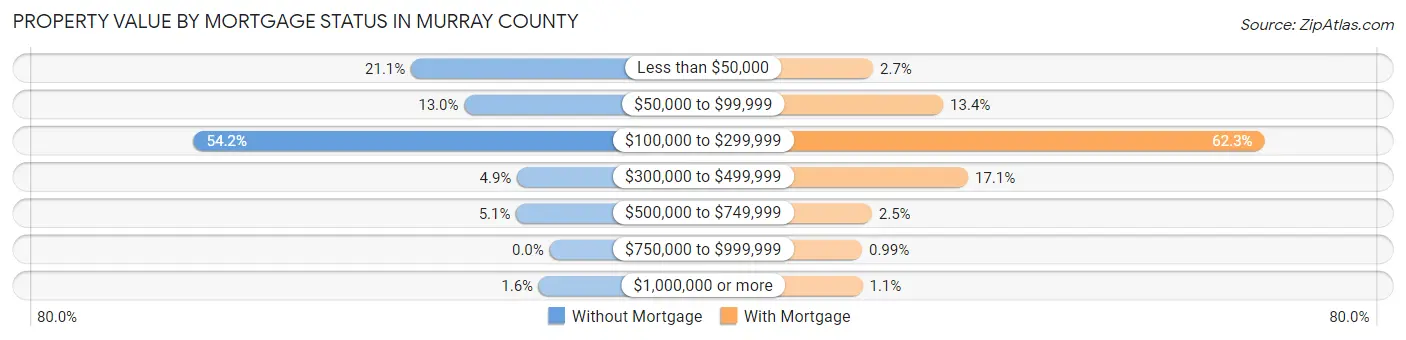
| Property Value | Without Mortgage | With Mortgage |
| Less than $50,000 | 440 (21.1%) | 43 (2.7%) |
| $50,000 to $99,999 | 271 (13.0%) | 215 (13.4%) |
| $100,000 to $299,999 | 1,131 (54.2%) | 1,003 (62.3%) |
| $300,000 to $499,999 | 103 (4.9%) | 276 (17.1%) |
| $500,000 to $749,999 | 106 (5.1%) | 40 (2.5%) |
| $750,000 to $999,999 | 0 (0.0%) | 16 (1.0%) |
| $1,000,000 or more | 34 (1.6%) | 17 (1.1%) |
| Total | 2,085 (100.0%) | 1,610 (100.0%) |
Household Income by Mortgage Status in Murray County
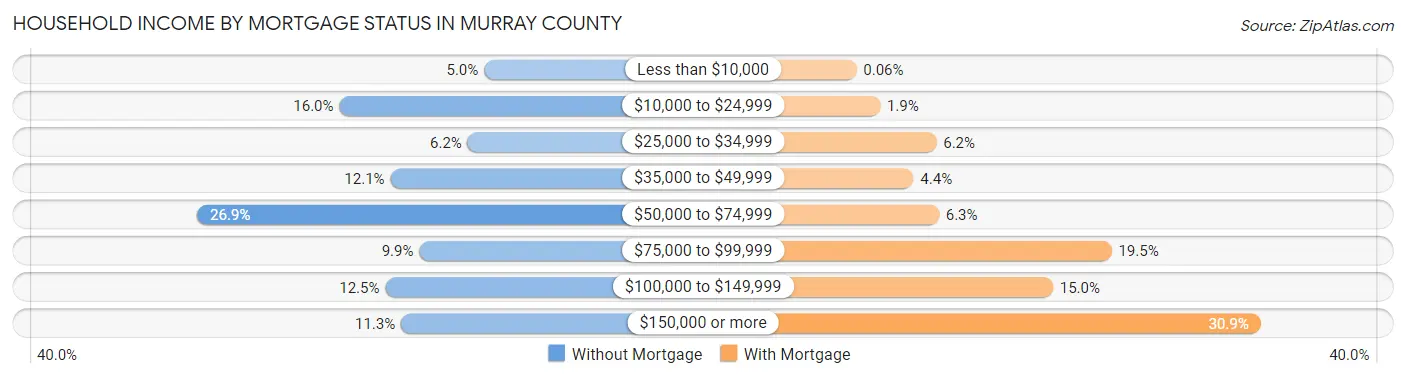
| Household Income | Without Mortgage | With Mortgage |
| Less than $10,000 | 104 (5.0%) | 1 (0.1%) |
| $10,000 to $24,999 | 334 (16.0%) | 30 (1.9%) |
| $25,000 to $34,999 | 130 (6.2%) | 99 (6.1%) |
| $35,000 to $49,999 | 253 (12.1%) | 71 (4.4%) |
| $50,000 to $74,999 | 560 (26.9%) | 102 (6.3%) |
| $75,000 to $99,999 | 207 (9.9%) | 314 (19.5%) |
| $100,000 to $149,999 | 261 (12.5%) | 242 (15.0%) |
| $150,000 or more | 236 (11.3%) | 497 (30.9%) |
| Total | 2,085 (100.0%) | 1,610 (100.0%) |
Property Value to Household Income Ratio in Murray County
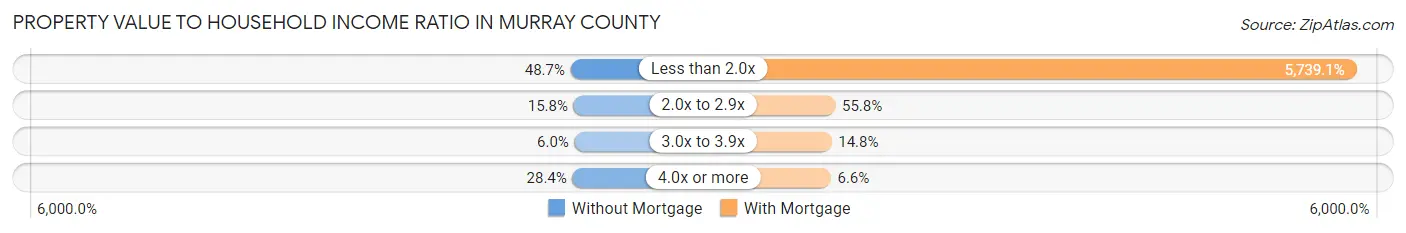
| Value-to-Income Ratio | Without Mortgage | With Mortgage |
| Less than 2.0x | 1,015 (48.7%) | 92,400 (5,739.1%) |
| 2.0x to 2.9x | 330 (15.8%) | 899 (55.8%) |
| 3.0x to 3.9x | 125 (6.0%) | 239 (14.8%) |
| 4.0x or more | 592 (28.4%) | 106 (6.6%) |
| Total | 2,085 (100.0%) | 1,610 (100.0%) |
Real Estate Taxes by Mortgage Status in Murray County
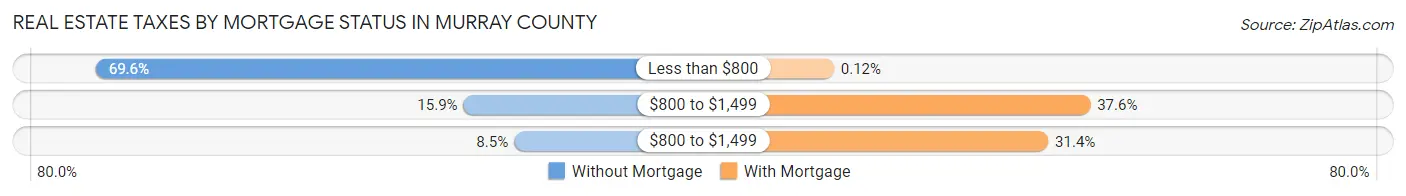
| Property Taxes | Without Mortgage | With Mortgage |
| Less than $800 | 1,451 (69.6%) | 2 (0.1%) |
| $800 to $1,499 | 331 (15.9%) | 605 (37.6%) |
| $800 to $1,499 | 177 (8.5%) | 506 (31.4%) |
| Total | 2,085 (100.0%) | 1,610 (100.0%) |
Health & Disability in Murray County
Health Insurance Coverage by Age in Murray County
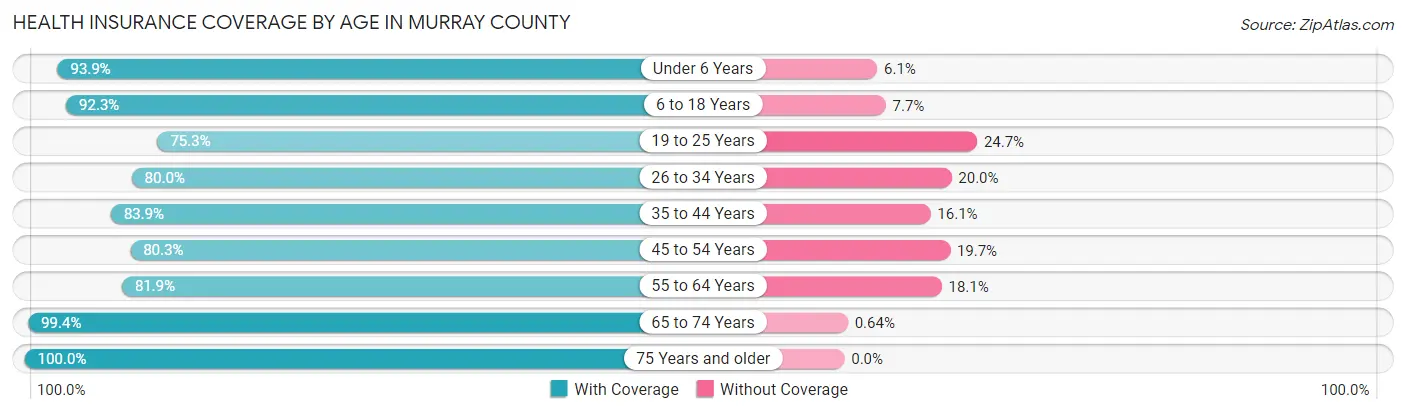
| Age Bracket | With Coverage | Without Coverage |
| Under 6 Years | 905 (93.9%) | 59 (6.1%) |
| 6 to 18 Years | 2,203 (92.3%) | 184 (7.7%) |
| 19 to 25 Years | 724 (75.3%) | 238 (24.7%) |
| 26 to 34 Years | 1,122 (80.0%) | 280 (20.0%) |
| 35 to 44 Years | 1,301 (83.9%) | 249 (16.1%) |
| 45 to 54 Years | 1,333 (80.3%) | 327 (19.7%) |
| 55 to 64 Years | 1,576 (81.9%) | 349 (18.1%) |
| 65 to 74 Years | 1,393 (99.4%) | 9 (0.6%) |
| 75 Years and older | 1,106 (100.0%) | 0 (0.0%) |
| Total | 11,663 (87.3%) | 1,695 (12.7%) |
Health Insurance Coverage by Citizenship Status in Murray County
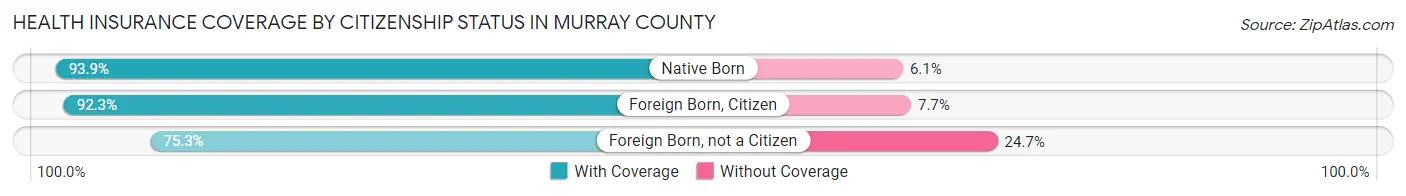
| Citizenship Status | With Coverage | Without Coverage |
| Native Born | 905 (93.9%) | 59 (6.1%) |
| Foreign Born, Citizen | 2,203 (92.3%) | 184 (7.7%) |
| Foreign Born, not a Citizen | 724 (75.3%) | 238 (24.7%) |
Health Insurance Coverage by Household Income in Murray County
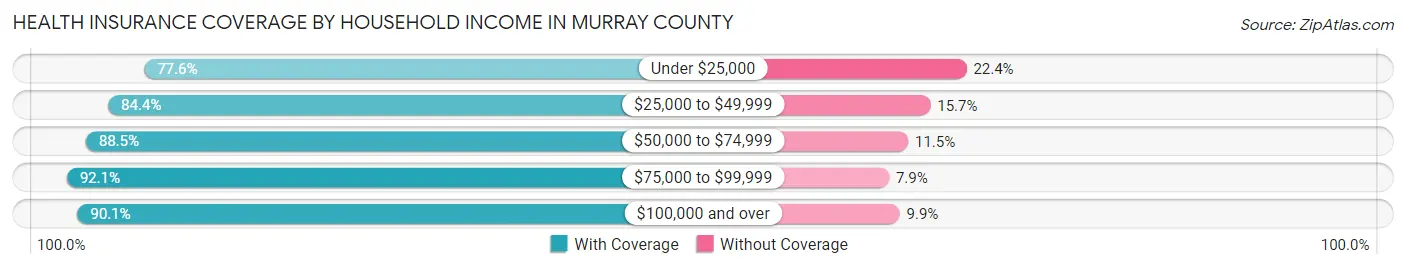
| Household Income | With Coverage | Without Coverage |
| Under $25,000 | 1,453 (77.6%) | 420 (22.4%) |
| $25,000 to $49,999 | 1,957 (84.4%) | 363 (15.7%) |
| $50,000 to $74,999 | 2,455 (88.5%) | 318 (11.5%) |
| $75,000 to $99,999 | 1,760 (92.1%) | 151 (7.9%) |
| $100,000 and over | 4,038 (90.1%) | 443 (9.9%) |
Public vs Private Health Insurance Coverage by Age in Murray County
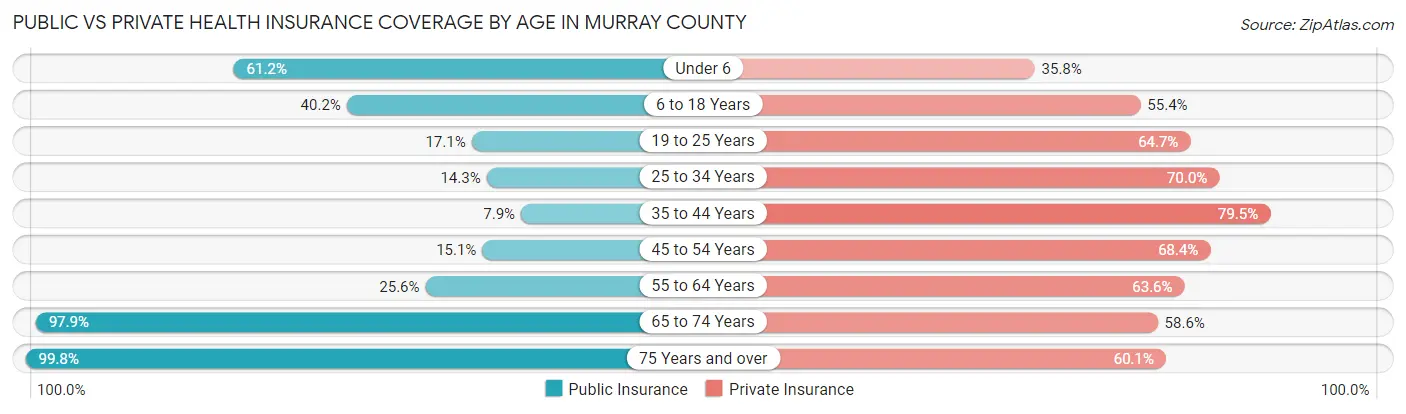
| Age Bracket | Public Insurance | Private Insurance |
| Under 6 | 590 (61.2%) | 345 (35.8%) |
| 6 to 18 Years | 960 (40.2%) | 1,323 (55.4%) |
| 19 to 25 Years | 164 (17.1%) | 622 (64.7%) |
| 25 to 34 Years | 200 (14.3%) | 982 (70.0%) |
| 35 to 44 Years | 122 (7.9%) | 1,232 (79.5%) |
| 45 to 54 Years | 250 (15.1%) | 1,135 (68.4%) |
| 55 to 64 Years | 493 (25.6%) | 1,224 (63.6%) |
| 65 to 74 Years | 1,373 (97.9%) | 822 (58.6%) |
| 75 Years and over | 1,104 (99.8%) | 665 (60.1%) |
| Total | 5,256 (39.4%) | 8,350 (62.5%) |
Disability Status by Sex by Age in Murray County
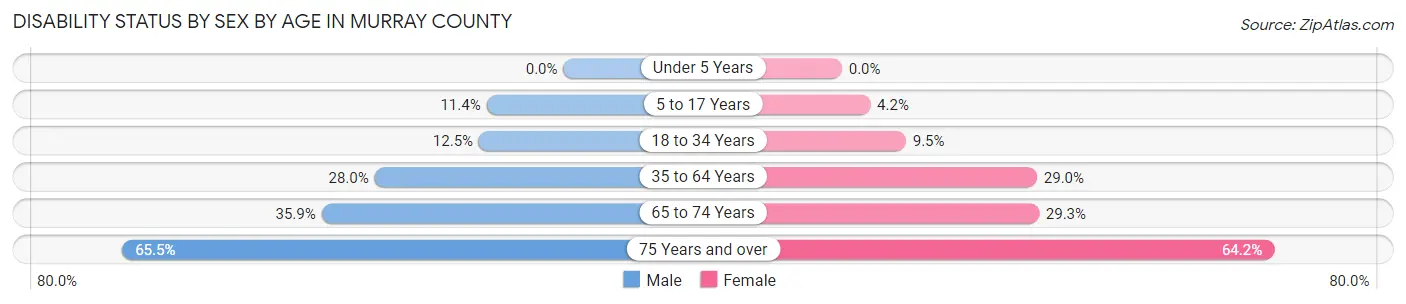
| Age Bracket | Male | Female |
| Under 5 Years | 0 (0.0%) | 0 (0.0%) |
| 5 to 17 Years | 140 (11.4%) | 45 (4.2%) |
| 18 to 34 Years | 170 (12.5%) | 116 (9.5%) |
| 35 to 64 Years | 714 (28.0%) | 750 (29.0%) |
| 65 to 74 Years | 242 (35.9%) | 213 (29.3%) |
| 75 Years and over | 357 (65.5%) | 360 (64.2%) |
Disability Class by Sex by Age in Murray County
Disability Class: Hearing Difficulty

| Age Bracket | Male | Female |
| Under 5 Years | 0 (0.0%) | 0 (0.0%) |
| 5 to 17 Years | 0 (0.0%) | 5 (0.5%) |
| 18 to 34 Years | 30 (2.2%) | 6 (0.5%) |
| 35 to 64 Years | 356 (14.0%) | 175 (6.8%) |
| 65 to 74 Years | 162 (24.0%) | 74 (10.2%) |
| 75 Years and over | 211 (38.7%) | 43 (7.7%) |
Disability Class: Vision Difficulty

| Age Bracket | Male | Female |
| Under 5 Years | 0 (0.0%) | 0 (0.0%) |
| 5 to 17 Years | 48 (3.9%) | 0 (0.0%) |
| 18 to 34 Years | 56 (4.1%) | 57 (4.7%) |
| 35 to 64 Years | 308 (12.1%) | 207 (8.0%) |
| 65 to 74 Years | 16 (2.4%) | 43 (5.9%) |
| 75 Years and over | 109 (20.0%) | 41 (7.3%) |
Disability Class: Cognitive Difficulty
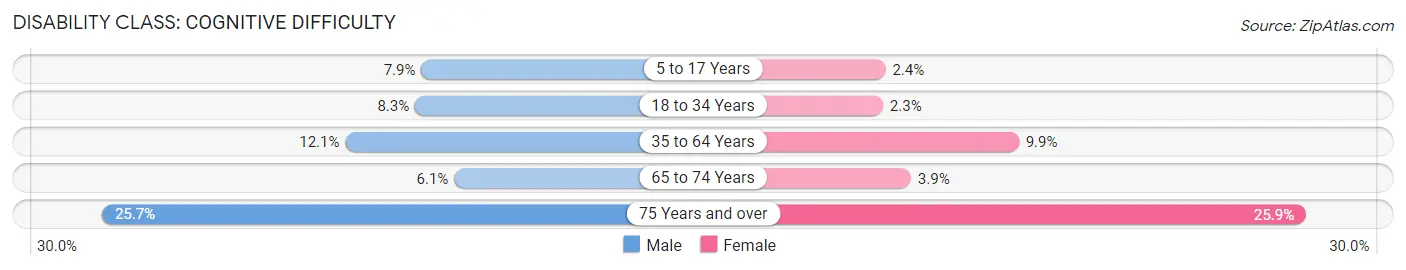
| Age Bracket | Male | Female |
| 5 to 17 Years | 97 (7.9%) | 26 (2.4%) |
| 18 to 34 Years | 112 (8.3%) | 28 (2.3%) |
| 35 to 64 Years | 309 (12.1%) | 255 (9.9%) |
| 65 to 74 Years | 41 (6.1%) | 28 (3.8%) |
| 75 Years and over | 140 (25.7%) | 145 (25.9%) |
Disability Class: Ambulatory Difficulty

| Age Bracket | Male | Female |
| 5 to 17 Years | 24 (2.0%) | 14 (1.3%) |
| 18 to 34 Years | 19 (1.4%) | 74 (6.1%) |
| 35 to 64 Years | 258 (10.1%) | 401 (15.5%) |
| 65 to 74 Years | 140 (20.8%) | 188 (25.8%) |
| 75 Years and over | 246 (45.1%) | 353 (62.9%) |
Disability Class: Self-Care Difficulty
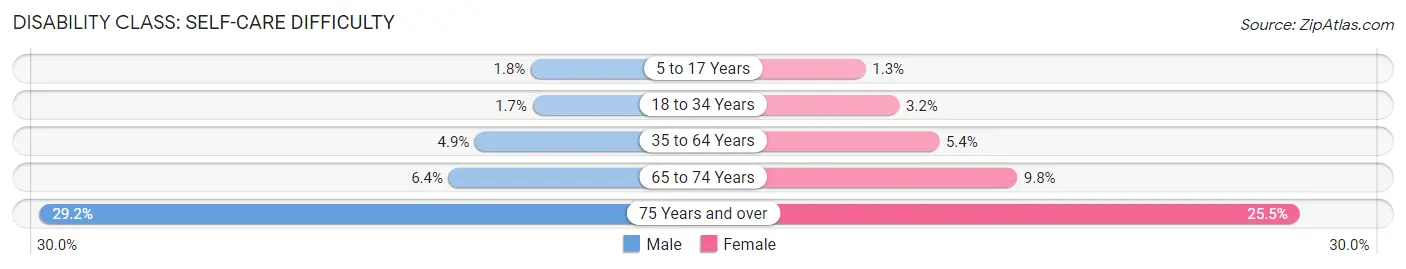
| Age Bracket | Male | Female |
| 5 to 17 Years | 22 (1.8%) | 14 (1.3%) |
| 18 to 34 Years | 23 (1.7%) | 39 (3.2%) |
| 35 to 64 Years | 125 (4.9%) | 140 (5.4%) |
| 65 to 74 Years | 43 (6.4%) | 71 (9.8%) |
| 75 Years and over | 159 (29.2%) | 143 (25.5%) |
Technology Access in Murray County
Computing Device Access in Murray County
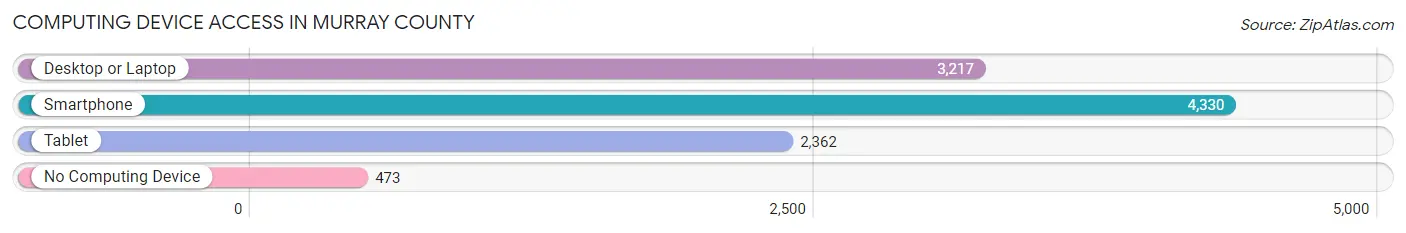
| Device Type | # Households | % Households |
| Desktop or Laptop | 3,217 | 63.6% |
| Smartphone | 4,330 | 85.6% |
| Tablet | 2,362 | 46.7% |
| No Computing Device | 473 | 9.3% |
| Total | 5,059 | 100.0% |
Internet Access in Murray County
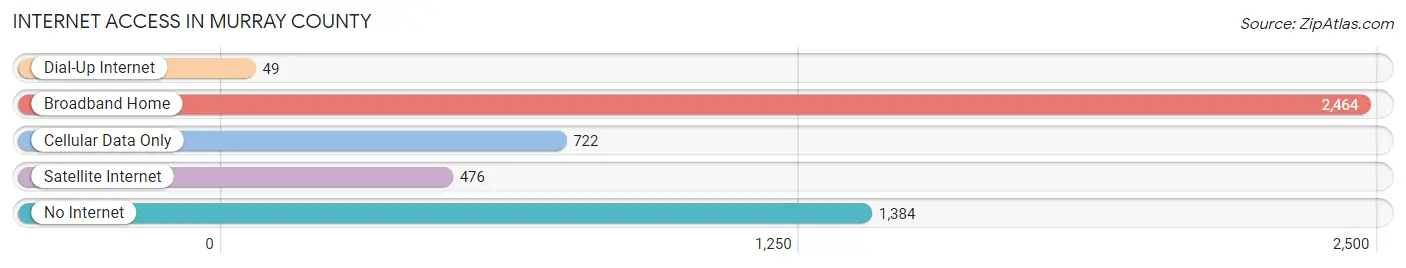
| Internet Type | # Households | % Households |
| Dial-Up Internet | 49 | 1.0% |
| Broadband Home | 2,464 | 48.7% |
| Cellular Data Only | 722 | 14.3% |
| Satellite Internet | 476 | 9.4% |
| No Internet | 1,384 | 27.4% |
| Total | 5,059 | 100.0% |
Murray County Summary
Murray County is located in south-central Oklahoma and is part of the Chickasaw Nation. It is bordered by Carter County to the north, Johnston County to the east, Pontotoc County to the south, and Love County to the west. The county seat is Sulphur, and the largest city is Davis. The county was named for William H. Murray, a Confederate general and the first governor of the Chickasaw Nation.
Geography
Murray County covers an area of 590 square miles and is located in the Arbuckle Mountains region of Oklahoma. The terrain is mostly hilly and forested, with some open prairie in the western part of the county. The county is drained by the Washita River, which flows through the county from north to south. The county also contains several small lakes, including Lake of the Arbuckles, Lake Murray, and Lake Texoma.
Climate
Murray County has a humid subtropical climate, with hot summers and mild winters. The average annual temperature is 64°F, and the average annual precipitation is 40 inches.
Demographics
As of the 2010 census, there were 13,488 people, 5,093 households, and 3,619 families living in Murray County. The population density was 23 people per square mile. The racial makeup of the county was 87.3% White, 8.2% Native American, 0.5% Black or African American, 0.3% Asian, 0.1% Pacific Islander, 1.2% from other races, and 2.4% from two or more races. Hispanic or Latino of any race were 3.2% of the population.
The median income for a household in the county was $35,945, and the median income for a family was $41,945. The per capita income for the county was $17,845. About 14.2% of families and 17.7% of the population were below the poverty line, including 22.3% of those under age 18 and 11.2% of those age 65 or over.
Economy
The economy of Murray County is largely based on agriculture and tourism. The county is home to several large farms, which produce a variety of crops, including wheat, corn, soybeans, and hay. The county is also home to several wineries and vineyards, which produce a variety of wines.
Tourism is an important part of the economy, as the county is home to several popular attractions, including the Chickasaw National Recreation Area, the Arbuckle Mountains, and Lake Murray. The county is also home to several popular festivals, including the Sulphur Springs Festival and the Davis Fall Festival.
Conclusion
Murray County is a rural county located in south-central Oklahoma. It is part of the Chickasaw Nation and is bordered by Carter, Johnston, Pontotoc, and Love counties. The county has a humid subtropical climate and is home to several large farms, wineries, and vineyards. Tourism is an important part of the economy, as the county is home to several popular attractions and festivals.
Common Questions
What is the Total Population of Murray County?
Total Population of Murray County is 13,837.
What is the Total Male Population of Murray County?
Total Male Population of Murray County is 7,153.
What is the Total Female Population of Murray County?
Total Female Population of Murray County is 6,684.
What is the Ratio of Males per 100 Females in Murray County?
There are 107.02 Males per 100 Females in Murray County.
What is the Ratio of Females per 100 Males in Murray County?
There are 93.44 Females per 100 Males in Murray County.
What is the Median Population Age in Murray County?
Median Population Age in Murray County is 41.5 Years.
What is the Average Family Size in Murray County
Average Family Size in Murray County is 3.2 People.
What is the Average Household Size in Murray County
Average Household Size in Murray County is 2.6 People.
What is Per Capita Income in Murray County?
Per Capita income in Murray County is $32,488.
What is the Median Family Income in Murray County?
Median Family Income in Murray County is $73,333.
What is the Median Household income in Murray County?
Median Household Income in Murray County is $60,213.
What is Income or Wage Gap in Murray County?
Income or Wage Gap in Murray County is 21.0%.
Women in Murray County earn 79.0 cents for every dollar earned by a man.
What is Family Income Deficit in Murray County?
Family Income Deficit in Murray County is $10,548.
Families that are below poverty line in Murray County earn $10,548 less on average than the poverty threshold level.
What is Inequality or Gini Index in Murray County?
Inequality or Gini Index in Murray County is 0.45.
How Large is the Labor Force in Murray County?
There are 6,089 People in the Labor Forcein in Murray County.
What is the Percentage of People in the Labor Force in Murray County?
55.5% of People are in the Labor Force in Murray County.
What is the Unemployment Rate in Murray County?
Unemployment Rate in Murray County is 2.1%.