McClain County, OK
McClain County Map
McClain County Overview
42,393
TOTAL POPULATION
21,349
MALE POPULATION
21,044
FEMALE POPULATION
101.45
MALES / 100 FEMALES
98.57
FEMALES / 100 MALES
38.8
MEDIAN AGE
3.2
AVG FAMILY SIZE
2.7
AVG HOUSEHOLD SIZE
$39,921
PER CAPITA INCOME
$90,995
AVG FAMILY INCOME
$80,150
AVG HOUSEHOLD INCOME
36.3%
WAGE / INCOME GAP [ % ]
63.7¢/ $1
WAGE / INCOME GAP [ $ ]
$11,582
FAMILY INCOME DEFICIT
0.42
INEQUALITY / GINI INDEX
21,241
LABOR FORCE [ PEOPLE ]
64.2%
PERCENT IN LABOR FORCE
4.1%
UNEMPLOYMENT RATE
McClain County Area Codes
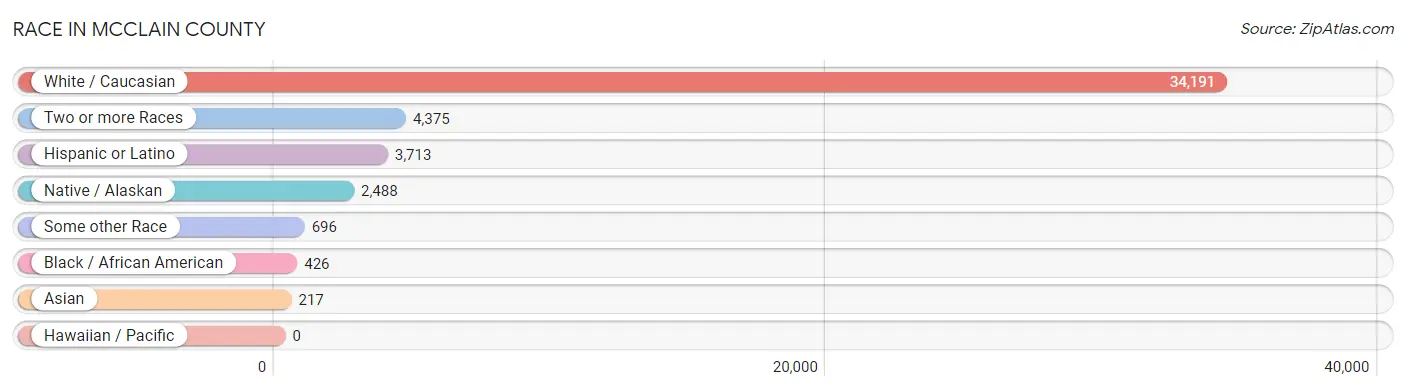
Race in McClain County
The most populous races in McClain County are White / Caucasian (34,191 | 80.6%), Two or more Races (4,375 | 10.3%), and Hispanic or Latino (3,713 | 8.8%).
| Race | # Population | % Population |
| Asian | 217 | 0.5% |
| Black / African American | 426 | 1.0% |
| Hawaiian / Pacific | 0 | 0.0% |
| Hispanic or Latino | 3,713 | 8.8% |
| Native / Alaskan | 2,488 | 5.9% |
| White / Caucasian | 34,191 | 80.6% |
| Two or more Races | 4,375 | 10.3% |
| Some other Race | 696 | 1.6% |
| Total | 42,393 | 100.0% |
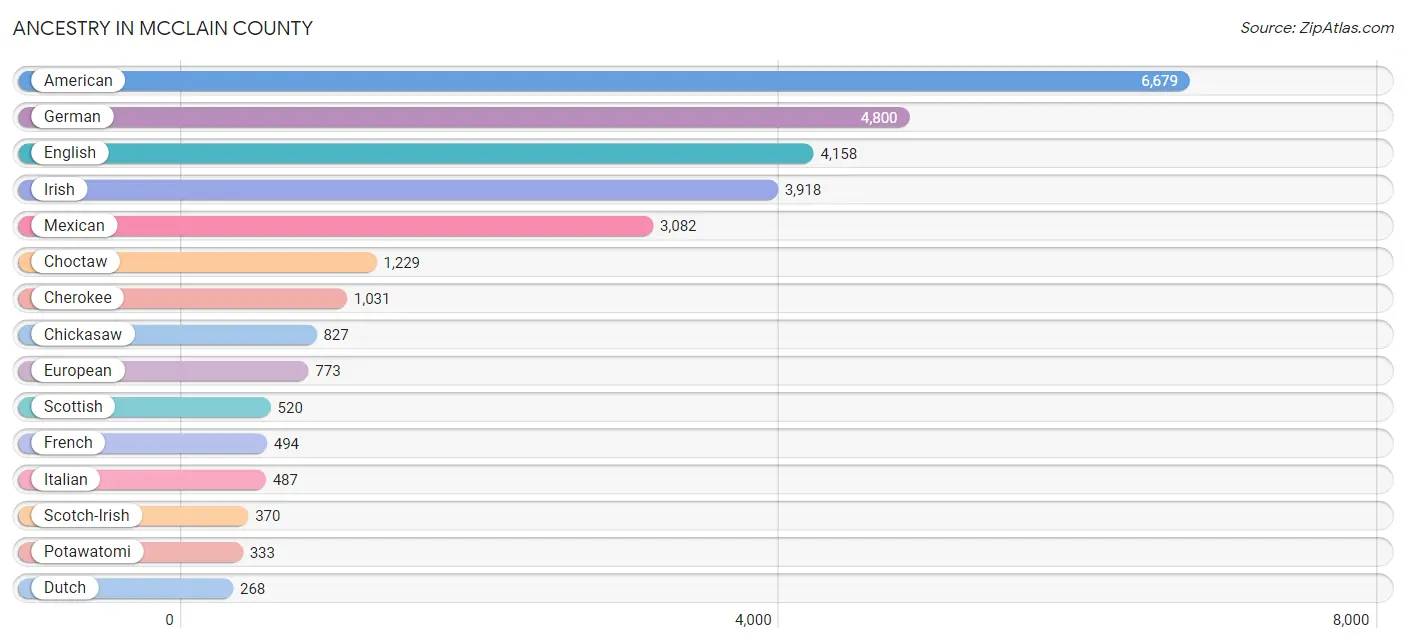
Ancestry in McClain County
The most populous ancestries reported in McClain County are American (6,679 | 15.8%), German (4,800 | 11.3%), English (4,158 | 9.8%), Irish (3,918 | 9.2%), and Mexican (3,082 | 7.3%), together accounting for 53.4% of all McClain County residents.
| Ancestry | # Population | % Population |
| African | 79 | 0.2% |
| Alaskan Athabascan | 112 | 0.3% |
| American | 6,679 | 15.8% |
| Apache | 35 | 0.1% |
| Arab | 10 | 0.0% |
| Arapaho | 2 | 0.0% |
| Australian | 3 | 0.0% |
| Austrian | 19 | 0.0% |
| Belgian | 22 | 0.1% |
| Bhutanese | 61 | 0.1% |
| Brazilian | 22 | 0.1% |
| British | 116 | 0.3% |
| Bulgarian | 16 | 0.0% |
| Burmese | 6 | 0.0% |
| Cajun | 17 | 0.0% |
| Canadian | 5 | 0.0% |
| Celtic | 7 | 0.0% |
| Central American | 105 | 0.3% |
| Cherokee | 1,031 | 2.4% |
| Chickasaw | 827 | 1.9% |
| Choctaw | 1,229 | 2.9% |
| Colombian | 27 | 0.1% |
| Comanche | 15 | 0.0% |
| Creek | 153 | 0.4% |
| Cuban | 28 | 0.1% |
| Czech | 88 | 0.2% |
| Czechoslovakian | 4 | 0.0% |
| Danish | 160 | 0.4% |
| Delaware | 47 | 0.1% |
| Dutch | 268 | 0.6% |
| Dutch West Indian | 54 | 0.1% |
| Eastern European | 70 | 0.2% |
| English | 4,158 | 9.8% |
| European | 773 | 1.8% |
| French | 494 | 1.2% |
| French Canadian | 22 | 0.1% |
| German | 4,800 | 11.3% |
| German Russian | 5 | 0.0% |
| Greek | 88 | 0.2% |
| Guatemalan | 51 | 0.1% |
| Hungarian | 34 | 0.1% |
| Indian (Asian) | 162 | 0.4% |
| Iranian | 46 | 0.1% |
| Irish | 3,918 | 9.2% |
| Italian | 487 | 1.1% |
| Kiowa | 70 | 0.2% |
| Korean | 69 | 0.2% |
| Lithuanian | 51 | 0.1% |
| Mexican | 3,082 | 7.3% |
| Native Hawaiian | 55 | 0.1% |
| Navajo | 47 | 0.1% |
| Northern European | 54 | 0.1% |
| Norwegian | 247 | 0.6% |
| Osage | 122 | 0.3% |
| Panamanian | 21 | 0.1% |
| Pennsylvania German | 13 | 0.0% |
| Polish | 146 | 0.3% |
| Portuguese | 31 | 0.1% |
| Potawatomi | 333 | 0.8% |
| Puerto Rican | 78 | 0.2% |
| Russian | 131 | 0.3% |
| Salvadoran | 33 | 0.1% |
| Samoan | 2 | 0.0% |
| Scandinavian | 71 | 0.2% |
| Scotch-Irish | 370 | 0.9% |
| Scottish | 520 | 1.2% |
| Seminole | 51 | 0.1% |
| Slovak | 1 | 0.0% |
| South African | 36 | 0.1% |
| South American | 27 | 0.1% |
| Spaniard | 49 | 0.1% |
| Spanish | 38 | 0.1% |
| Spanish American | 28 | 0.1% |
| Sri Lankan | 14 | 0.0% |
| Subsaharan African | 153 | 0.4% |
| Swedish | 75 | 0.2% |
| Swiss | 15 | 0.0% |
| Syrian | 10 | 0.0% |
| Thai | 75 | 0.2% |
| Ukrainian | 22 | 0.1% |
| Welsh | 230 | 0.5% | View All 81 Rows |
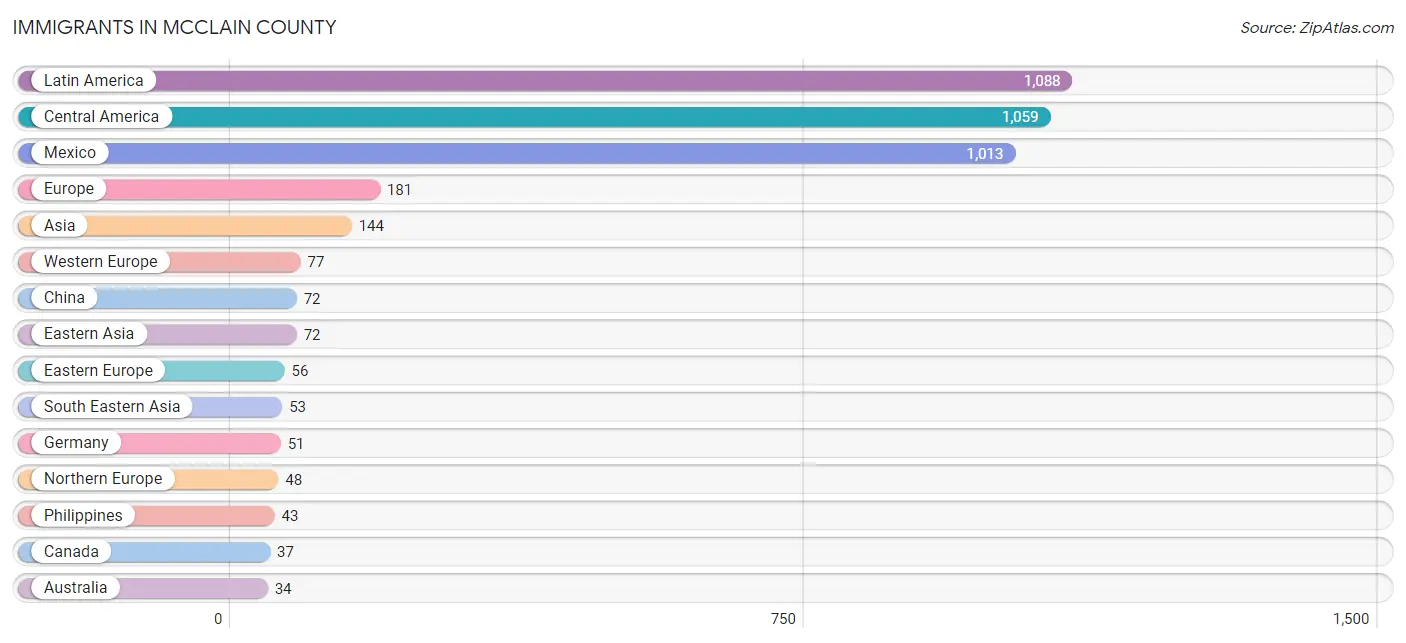
Immigrants in McClain County
The most numerous immigrant groups reported in McClain County came from Latin America (1,088 | 2.6%), Central America (1,059 | 2.5%), Mexico (1,013 | 2.4%), Europe (181 | 0.4%), and Asia (144 | 0.3%), together accounting for 8.2% of all McClain County residents.
| Immigration Origin | # Population | % Population |
| Africa | 20 | 0.1% |
| Asia | 144 | 0.3% |
| Australia | 34 | 0.1% |
| Brazil | 4 | 0.0% |
| Bulgaria | 16 | 0.0% |
| Canada | 37 | 0.1% |
| Caribbean | 20 | 0.1% |
| Central America | 1,059 | 2.5% |
| China | 72 | 0.2% |
| Colombia | 5 | 0.0% |
| Cuba | 20 | 0.1% |
| Czechoslovakia | 29 | 0.1% |
| Eastern Asia | 72 | 0.2% |
| Eastern Europe | 56 | 0.1% |
| El Salvador | 7 | 0.0% |
| Europe | 181 | 0.4% |
| France | 14 | 0.0% |
| Germany | 51 | 0.1% |
| Guatemala | 18 | 0.0% |
| India | 13 | 0.0% |
| Iran | 6 | 0.0% |
| Ireland | 24 | 0.1% |
| Latin America | 1,088 | 2.6% |
| Mexico | 1,013 | 2.4% |
| Netherlands | 12 | 0.0% |
| Northern Europe | 48 | 0.1% |
| Oceania | 34 | 0.1% |
| Panama | 21 | 0.1% |
| Philippines | 43 | 0.1% |
| Russia | 11 | 0.0% |
| South Africa | 20 | 0.1% |
| South America | 9 | 0.0% |
| South Central Asia | 19 | 0.0% |
| South Eastern Asia | 53 | 0.1% |
| Vietnam | 10 | 0.0% |
| Western Europe | 77 | 0.2% | View All 36 Rows |
Sex and Age in McClain County
Sex and Age in McClain County
The most populous age groups in McClain County are 10 to 14 Years (1,834 | 8.6%) for men and 35 to 39 Years (1,600 | 7.6%) for women.
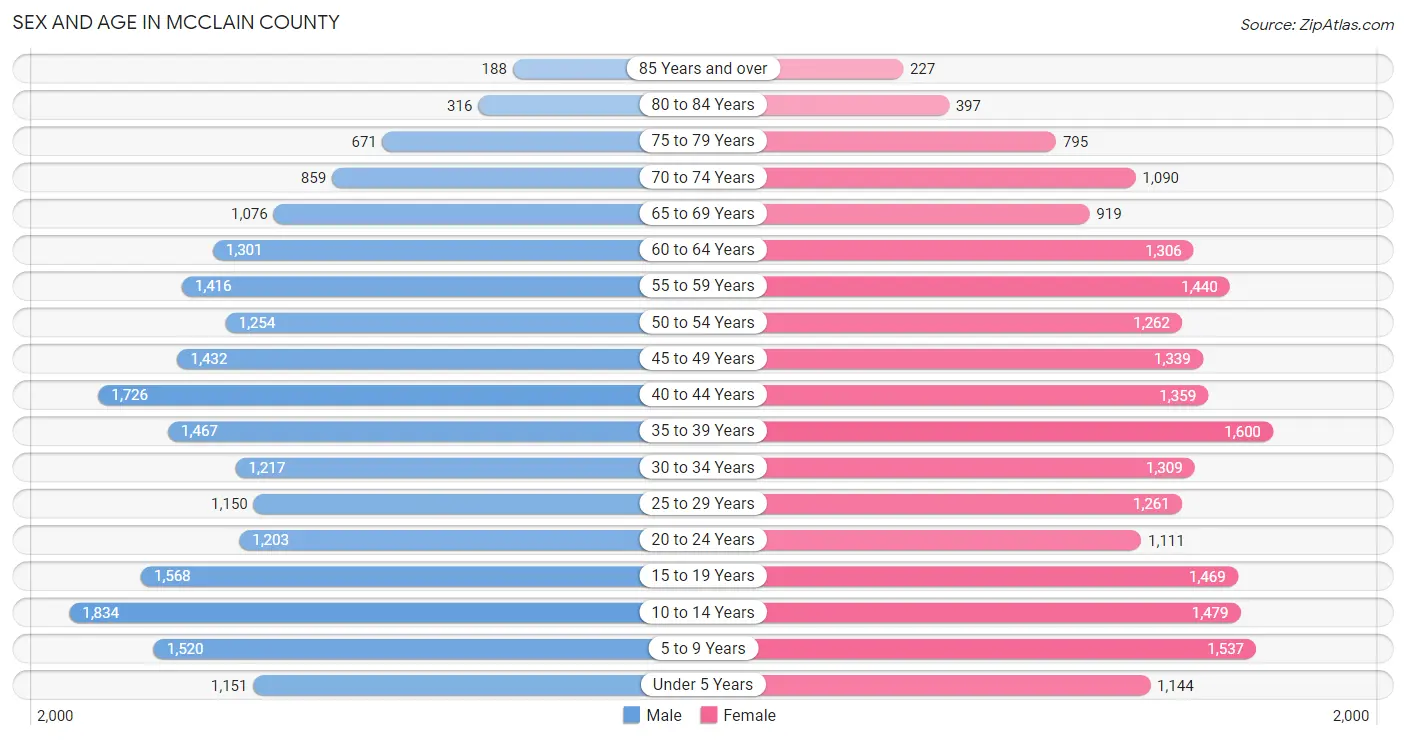
| Age Bracket | Male | Female |
| Under 5 Years | 1,151 (5.4%) | 1,144 (5.4%) |
| 5 to 9 Years | 1,520 (7.1%) | 1,537 (7.3%) |
| 10 to 14 Years | 1,834 (8.6%) | 1,479 (7.0%) |
| 15 to 19 Years | 1,568 (7.3%) | 1,469 (7.0%) |
| 20 to 24 Years | 1,203 (5.6%) | 1,111 (5.3%) |
| 25 to 29 Years | 1,150 (5.4%) | 1,261 (6.0%) |
| 30 to 34 Years | 1,217 (5.7%) | 1,309 (6.2%) |
| 35 to 39 Years | 1,467 (6.9%) | 1,600 (7.6%) |
| 40 to 44 Years | 1,726 (8.1%) | 1,359 (6.5%) |
| 45 to 49 Years | 1,432 (6.7%) | 1,339 (6.4%) |
| 50 to 54 Years | 1,254 (5.9%) | 1,262 (6.0%) |
| 55 to 59 Years | 1,416 (6.6%) | 1,440 (6.8%) |
| 60 to 64 Years | 1,301 (6.1%) | 1,306 (6.2%) |
| 65 to 69 Years | 1,076 (5.0%) | 919 (4.4%) |
| 70 to 74 Years | 859 (4.0%) | 1,090 (5.2%) |
| 75 to 79 Years | 671 (3.1%) | 795 (3.8%) |
| 80 to 84 Years | 316 (1.5%) | 397 (1.9%) |
| 85 Years and over | 188 (0.9%) | 227 (1.1%) |
| Total | 21,349 (100.0%) | 21,044 (100.0%) |
Families and Households in McClain County
Median Family Size in McClain County
The median family size in McClain County is 3.16 persons per family, with single female/mother families (1,306 | 11.2%) accounting for the largest median family size of 3.22 persons per family. On the other hand, single male/father families (722 | 6.2%) represent the smallest median family size with 3.07 persons per family.
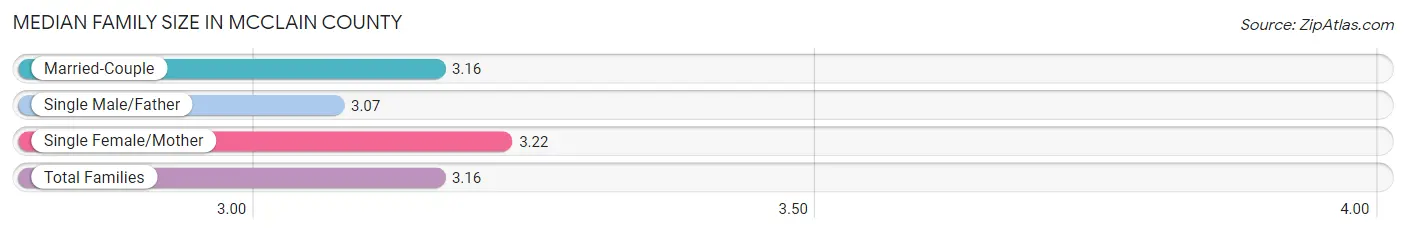
| Family Type | # Families | Family Size |
| Married-Couple | 9,685 (82.7%) | 3.16 |
| Single Male/Father | 722 (6.2%) | 3.07 |
| Single Female/Mother | 1,306 (11.2%) | 3.22 |
| Total Families | 11,713 (100.0%) | 3.16 |
Median Household Size in McClain County
The median household size in McClain County is 2.73 persons per household, with single female/mother households (1,306 | 8.5%) accounting for the largest median household size of 3.45 persons per household. non-family households (3,734 | 24.2%) represent the smallest median household size with 1.15 persons per household.
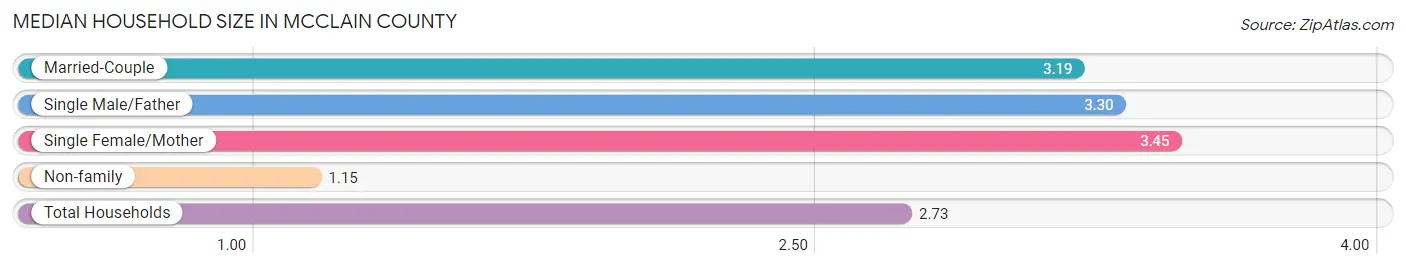
| Household Type | # Households | Household Size |
| Married-Couple | 9,685 (62.7%) | 3.19 |
| Single Male/Father | 722 (4.7%) | 3.30 |
| Single Female/Mother | 1,306 (8.5%) | 3.45 |
| Non-family | 3,734 (24.2%) | 1.15 |
| Total Households | 15,447 (100.0%) | 2.73 |
Household Size by Marriage Status in McClain County
Out of a total of 15,447 households in McClain County, 11,713 (75.8%) are family households, while 3,734 (24.2%) are nonfamily households. The most numerous type of family households are 2-person households, comprising 5,322, and the most common type of nonfamily households are 1-person households, comprising 3,311.
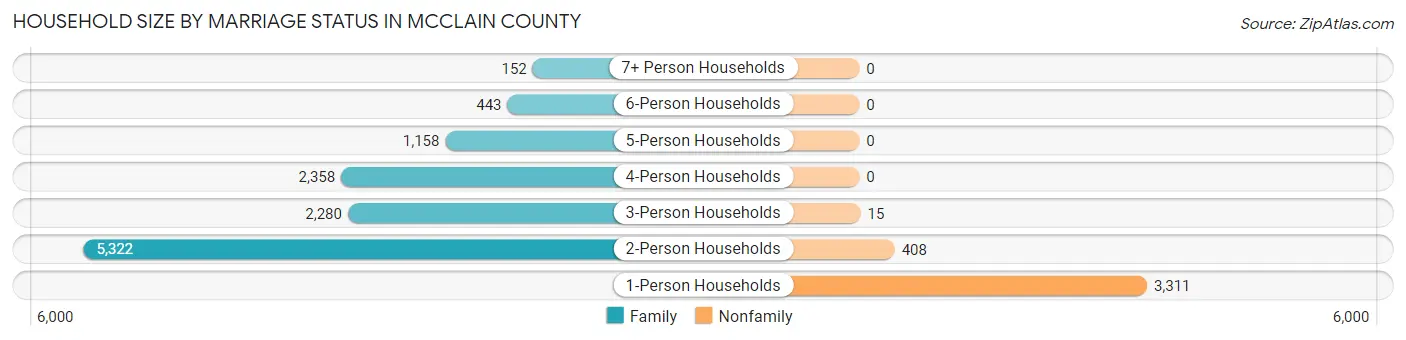
| Household Size | Family Households | Nonfamily Households |
| 1-Person Households | - | 3,311 (21.4%) |
| 2-Person Households | 5,322 (34.4%) | 408 (2.6%) |
| 3-Person Households | 2,280 (14.8%) | 15 (0.1%) |
| 4-Person Households | 2,358 (15.3%) | 0 (0.0%) |
| 5-Person Households | 1,158 (7.5%) | 0 (0.0%) |
| 6-Person Households | 443 (2.9%) | 0 (0.0%) |
| 7+ Person Households | 152 (1.0%) | 0 (0.0%) |
| Total | 11,713 (75.8%) | 3,734 (24.2%) |
Female Fertility in McClain County
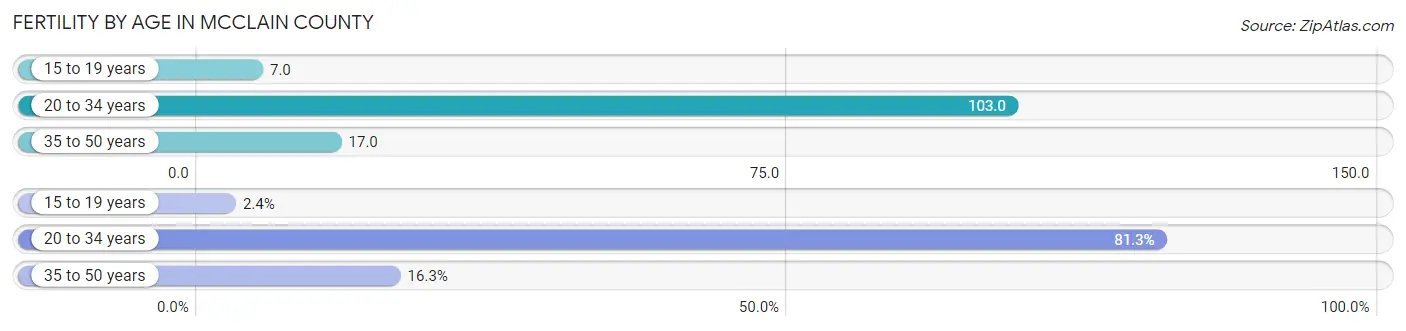
Fertility by Age in McClain County
Average fertility rate in McClain County is 48.0 births per 1,000 women. Women in the age bracket of 20 to 34 years have the highest fertility rate with 103.0 births per 1,000 women. Women in the age bracket of 20 to 34 years acount for 81.3% of all women with births.
| Age Bracket | Women with Births | Births / 1,000 Women |
| 15 to 19 years | 11 (2.4%) | 7.0 |
| 20 to 34 years | 378 (81.3%) | 103.0 |
| 35 to 50 years | 76 (16.3%) | 17.0 |
| Total | 465 (100.0%) | 48.0 |
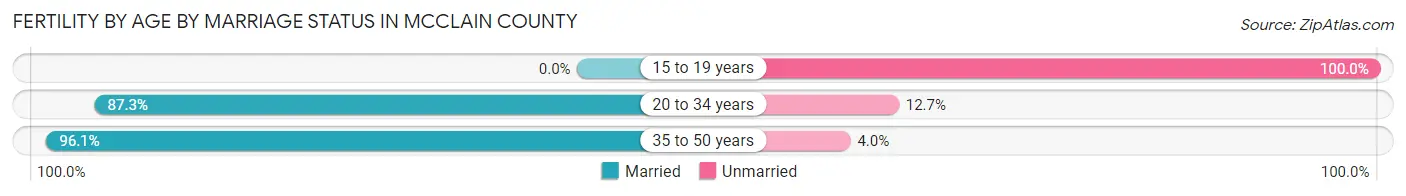
Fertility by Age by Marriage Status in McClain County
86.7% of women with births (465) in McClain County are married. The highest percentage of unmarried women with births falls into 15 to 19 years age bracket with 100.0% of them unmarried at the time of birth, while the lowest percentage of unmarried women with births belong to 35 to 50 years age bracket with 3.9% of them unmarried.
| Age Bracket | Married | Unmarried |
| 15 to 19 years | 0 (0.0%) | 11 (100.0%) |
| 20 to 34 years | 330 (87.3%) | 48 (12.7%) |
| 35 to 50 years | 73 (96.1%) | 3 (4.0%) |
| Total | 403 (86.7%) | 62 (13.3%) |
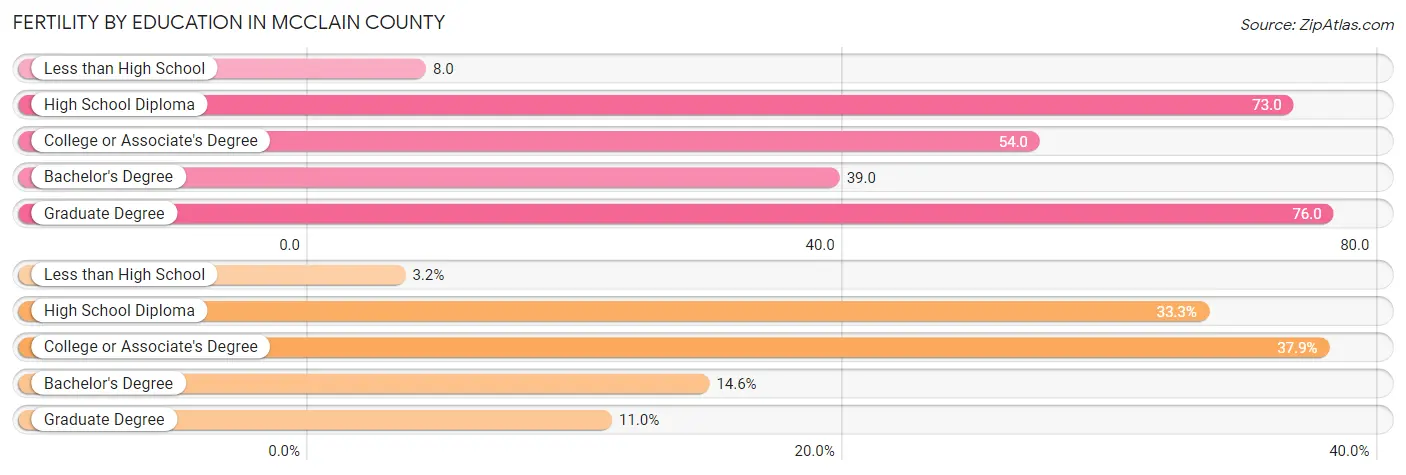
Fertility by Education in McClain County
Average fertility rate in McClain County is 48.0 births per 1,000 women. Women with the education attainment of graduate degree have the highest fertility rate of 76.0 births per 1,000 women, while women with the education attainment of less than high school have the lowest fertility at 8.0 births per 1,000 women. Women with the education attainment of college or associate's degree represent 37.9% of all women with births.
| Educational Attainment | Women with Births | Births / 1,000 Women |
| Less than High School | 15 (3.2%) | 8.0 |
| High School Diploma | 155 (33.3%) | 73.0 |
| College or Associate's Degree | 176 (37.9%) | 54.0 |
| Bachelor's Degree | 68 (14.6%) | 39.0 |
| Graduate Degree | 51 (11.0%) | 76.0 |
| Total | 465 (100.0%) | 48.0 |
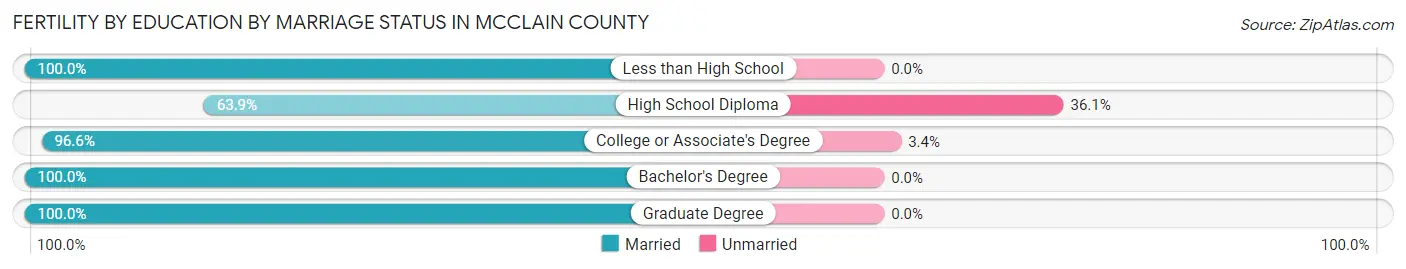
Fertility by Education by Marriage Status in McClain County
13.3% of women with births in McClain County are unmarried. Women with the educational attainment of less than high school are most likely to be married with 100.0% of them married at childbirth, while women with the educational attainment of high school diploma are least likely to be married with 36.1% of them unmarried at childbirth.
| Educational Attainment | Married | Unmarried |
| Less than High School | 15 (100.0%) | 0 (0.0%) |
| High School Diploma | 99 (63.9%) | 56 (36.1%) |
| College or Associate's Degree | 170 (96.6%) | 6 (3.4%) |
| Bachelor's Degree | 68 (100.0%) | 0 (0.0%) |
| Graduate Degree | 51 (100.0%) | 0 (0.0%) |
| Total | 403 (86.7%) | 62 (13.3%) |
Income in McClain County
Income Overview in McClain County
Per Capita Income in McClain County is $39,921, while median incomes of families and households are $90,995 and $80,150 respectively.
| Characteristic | Number | Measure |
| Per Capita Income | 42,393 | $39,921 |
| Median Family Income | 11,713 | $90,995 |
| Mean Family Income | 11,713 | $113,032 |
| Median Household Income | 15,447 | $80,150 |
| Mean Household Income | 15,447 | $102,199 |
| Income Deficit | 11,713 | $11,582 |
| Wage / Income Gap (%) | 42,393 | 36.29% |
| Wage / Income Gap ($) | 42,393 | 63.71¢ per $1 |
| Gini / Inequality Index | 42,393 | 0.42 |
Earnings by Sex in McClain County
Average Earnings in McClain County are $44,544, $54,896 for men and $34,973 for women, a difference of 36.3%.
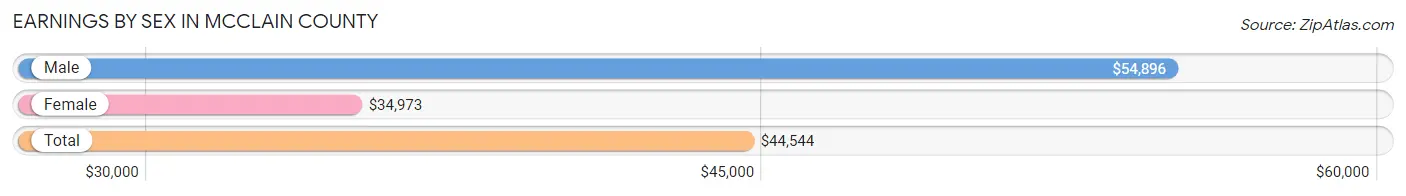
| Sex | Number | Average Earnings |
| Male | 12,321 (55.2%) | $54,896 |
| Female | 10,004 (44.8%) | $34,973 |
| Total | 22,325 (100.0%) | $44,544 |
Earnings by Sex by Income Bracket in McClain County
The most common earnings brackets in McClain County are $100,000+ for men (2,184 | 17.7%) and $75,000 to $99,999 for women (719 | 7.2%).
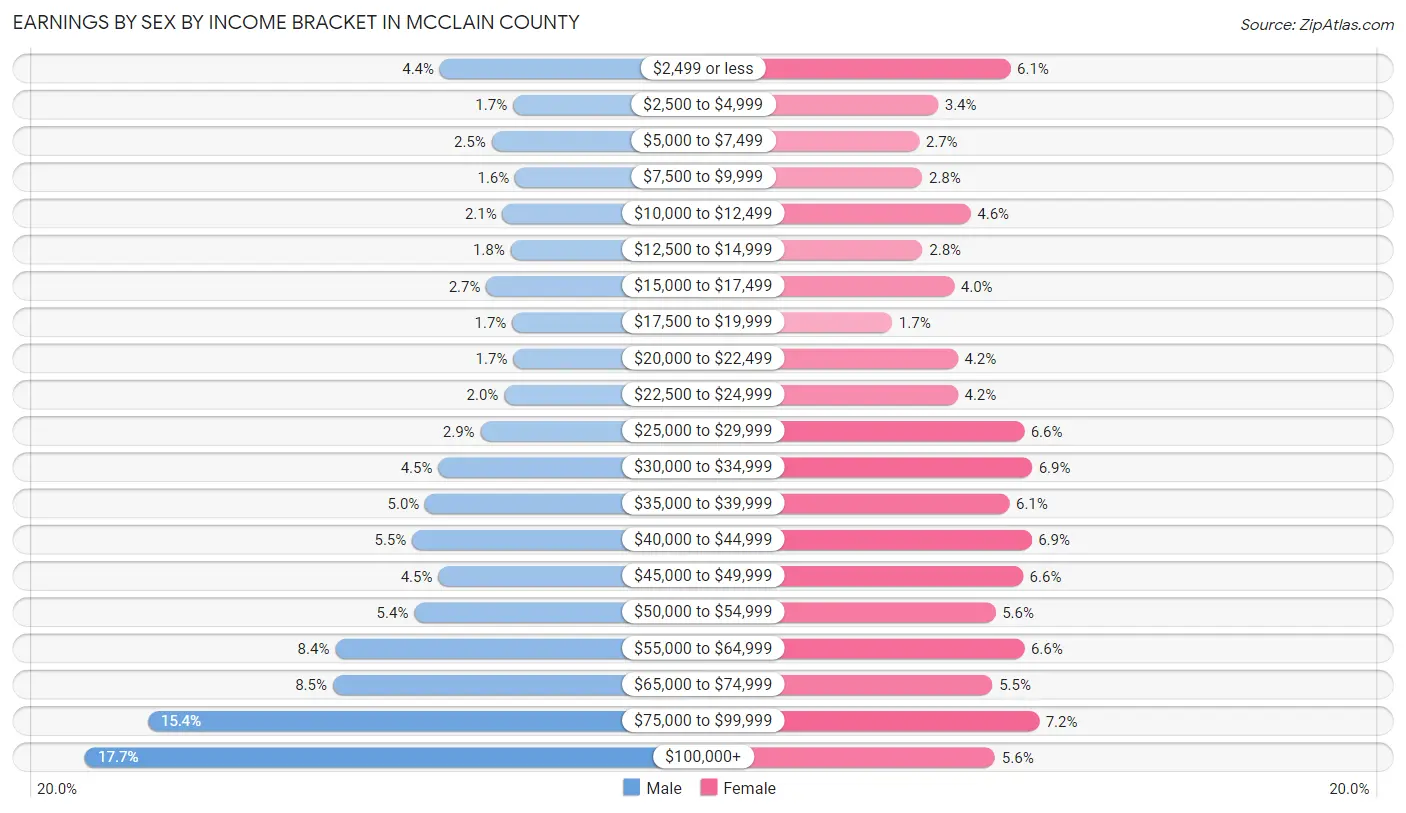
| Income | Male | Female |
| $2,499 or less | 547 (4.4%) | 612 (6.1%) |
| $2,500 to $4,999 | 210 (1.7%) | 341 (3.4%) |
| $5,000 to $7,499 | 308 (2.5%) | 270 (2.7%) |
| $7,500 to $9,999 | 199 (1.6%) | 282 (2.8%) |
| $10,000 to $12,499 | 258 (2.1%) | 463 (4.6%) |
| $12,500 to $14,999 | 220 (1.8%) | 283 (2.8%) |
| $15,000 to $17,499 | 333 (2.7%) | 401 (4.0%) |
| $17,500 to $19,999 | 213 (1.7%) | 169 (1.7%) |
| $20,000 to $22,499 | 208 (1.7%) | 415 (4.2%) |
| $22,500 to $24,999 | 250 (2.0%) | 415 (4.2%) |
| $25,000 to $29,999 | 360 (2.9%) | 663 (6.6%) |
| $30,000 to $34,999 | 555 (4.5%) | 693 (6.9%) |
| $35,000 to $39,999 | 615 (5.0%) | 608 (6.1%) |
| $40,000 to $44,999 | 675 (5.5%) | 691 (6.9%) |
| $45,000 to $49,999 | 555 (4.5%) | 659 (6.6%) |
| $50,000 to $54,999 | 665 (5.4%) | 556 (5.6%) |
| $55,000 to $64,999 | 1,030 (8.4%) | 664 (6.6%) |
| $65,000 to $74,999 | 1,041 (8.5%) | 545 (5.4%) |
| $75,000 to $99,999 | 1,895 (15.4%) | 719 (7.2%) |
| $100,000+ | 2,184 (17.7%) | 555 (5.6%) |
| Total | 12,321 (100.0%) | 10,004 (100.0%) |
Earnings by Sex by Educational Attainment in McClain County
Average earnings in McClain County are $62,361 for men and $39,057 for women, a difference of 37.4%. Men with an educational attainment of bachelor's degree enjoy the highest average annual earnings of $85,870, while those with less than high school education earn the least with $38,750. Women with an educational attainment of graduate degree earn the most with the average annual earnings of $63,103, while those with less than high school education have the smallest earnings of $25,506.
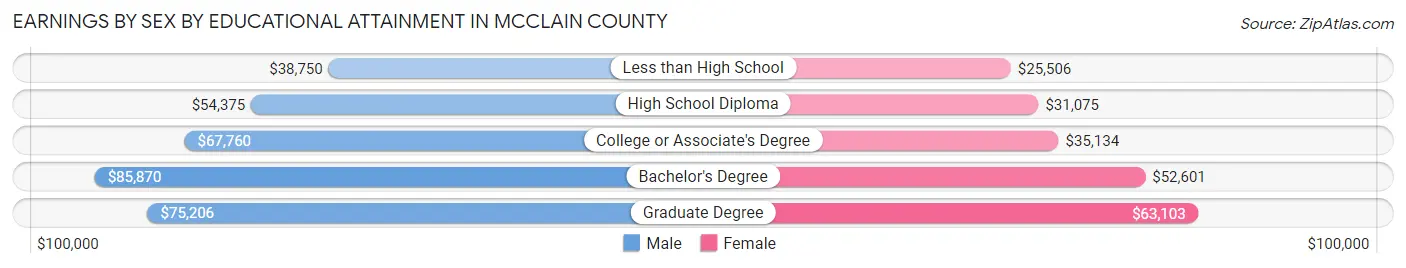
| Educational Attainment | Male Income | Female Income |
| Less than High School | $38,750 | $25,506 |
| High School Diploma | $54,375 | $31,075 |
| College or Associate's Degree | $67,760 | $35,134 |
| Bachelor's Degree | $85,870 | $52,601 |
| Graduate Degree | $75,206 | $63,103 |
| Total | $62,361 | $39,057 |
Family Income in McClain County
Family Income Brackets in McClain County
According to the McClain County family income data, there are 2,905 families falling into the $100,000 to $149,999 income range, which is the most common income bracket and makes up 24.8% of all families. Conversely, the less than $10,000 income bracket is the least frequent group with only 141 families (1.2%) belonging to this category.
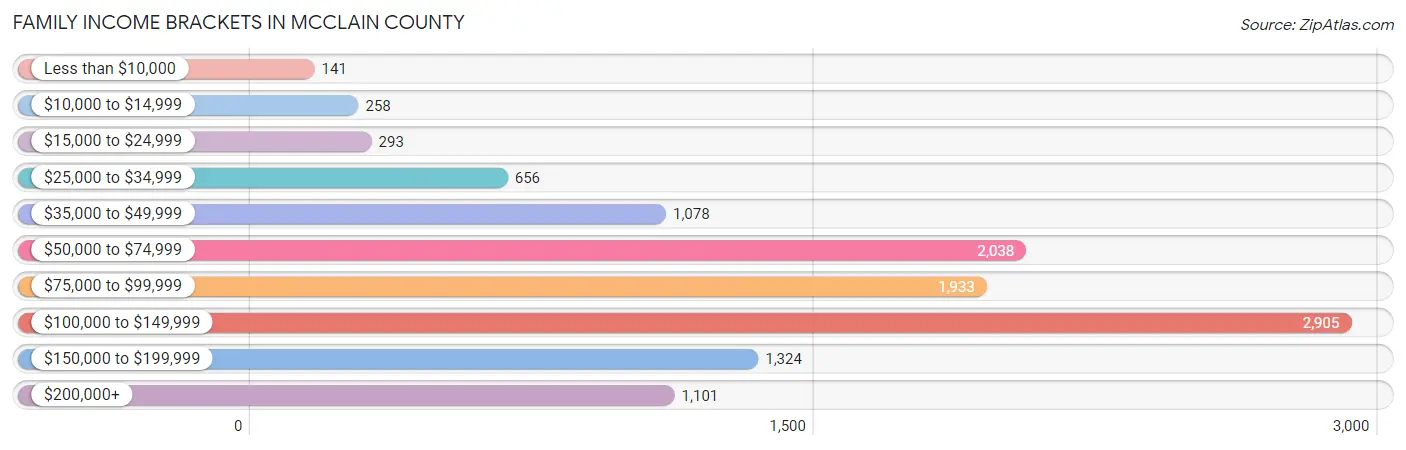
| Income Bracket | # Families | % Families |
| Less than $10,000 | 141 | 1.2% |
| $10,000 to $14,999 | 258 | 2.2% |
| $15,000 to $24,999 | 293 | 2.5% |
| $25,000 to $34,999 | 656 | 5.6% |
| $35,000 to $49,999 | 1,078 | 9.2% |
| $50,000 to $74,999 | 2,038 | 17.4% |
| $75,000 to $99,999 | 1,933 | 16.5% |
| $100,000 to $149,999 | 2,905 | 24.8% |
| $150,000 to $199,999 | 1,324 | 11.3% |
| $200,000+ | 1,101 | 9.4% |
Family Income by Famaliy Size in McClain County
6-person families (432 | 3.7%) account for the highest median family income in McClain County with $115,000 per family, while 2-person families (5,530 | 47.2%) have the highest median income of $39,602 per family member.
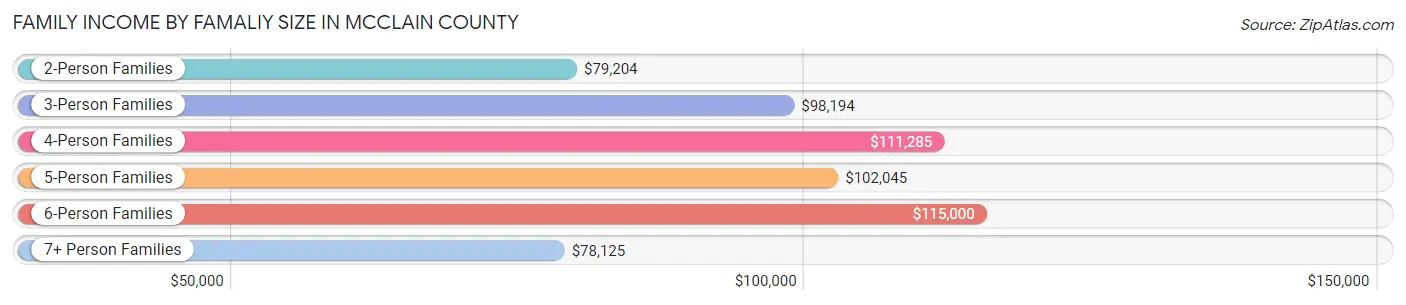
| Income Bracket | # Families | Median Income |
| 2-Person Families | 5,530 (47.2%) | $79,204 |
| 3-Person Families | 2,240 (19.1%) | $98,194 |
| 4-Person Families | 2,340 (20.0%) | $111,285 |
| 5-Person Families | 1,072 (9.1%) | $102,045 |
| 6-Person Families | 432 (3.7%) | $115,000 |
| 7+ Person Families | 99 (0.9%) | $78,125 |
| Total | 11,713 (100.0%) | $90,995 |
Family Income by Number of Earners in McClain County
The median family income in McClain County is $90,995, with families comprising 3+ earners (1,201) having the highest median family income of $145,329, while families with no earners (1,564) have the lowest median family income of $51,614, accounting for 10.2% and 13.4% of families, respectively.
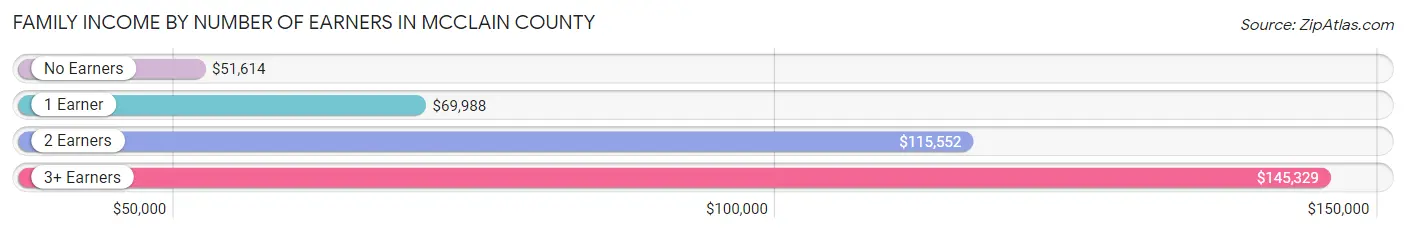
| Number of Earners | # Families | Median Income |
| No Earners | 1,564 (13.4%) | $51,614 |
| 1 Earner | 3,587 (30.6%) | $69,988 |
| 2 Earners | 5,361 (45.8%) | $115,552 |
| 3+ Earners | 1,201 (10.2%) | $145,329 |
| Total | 11,713 (100.0%) | $90,995 |
Household Income in McClain County
Household Income Brackets in McClain County
With 3,228 households falling in the category, the $100,000 to $149,999 income range is the most frequent in McClain County, accounting for 20.9% of all households. In contrast, only 232 households (1.5%) fall into the less than $10,000 income bracket, making it the least populous group.
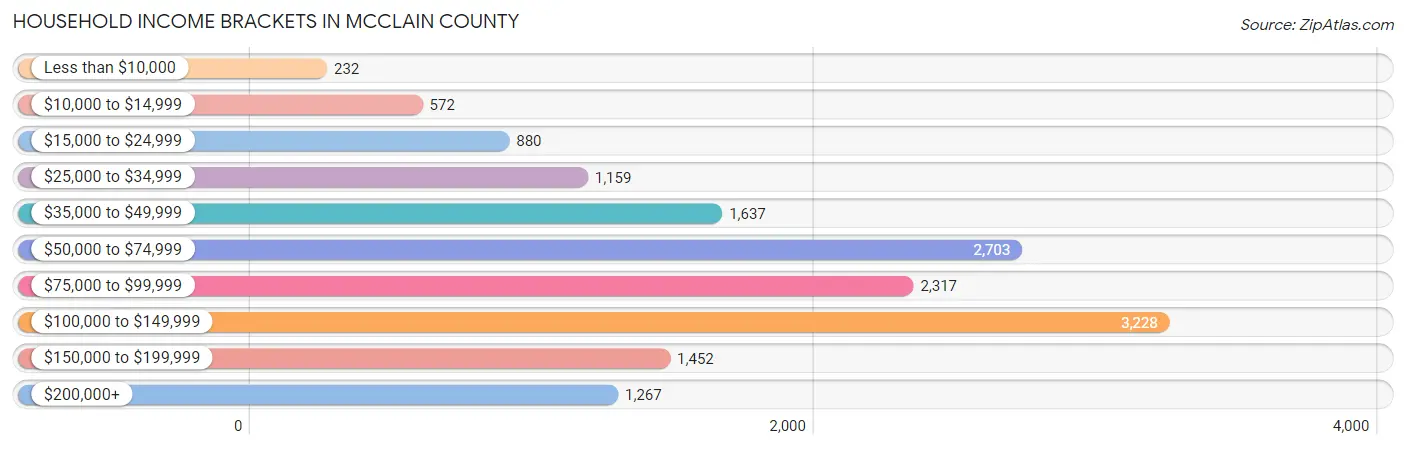
| Income Bracket | # Households | % Households |
| Less than $10,000 | 232 | 1.5% |
| $10,000 to $14,999 | 572 | 3.7% |
| $15,000 to $24,999 | 880 | 5.7% |
| $25,000 to $34,999 | 1,159 | 7.5% |
| $35,000 to $49,999 | 1,637 | 10.6% |
| $50,000 to $74,999 | 2,703 | 17.5% |
| $75,000 to $99,999 | 2,317 | 15.0% |
| $100,000 to $149,999 | 3,228 | 20.9% |
| $150,000 to $199,999 | 1,452 | 9.4% |
| $200,000+ | 1,267 | 8.2% |
Household Income by Householder Age in McClain County
The median household income in McClain County is $80,150, with the highest median household income of $97,326 found in the 45 to 64 years age bracket for the primary householder. A total of 5,571 households (36.1%) fall into this category. Meanwhile, the 15 to 24 years age bracket for the primary householder has the lowest median household income of $43,322, with 586 households (3.8%) in this group.
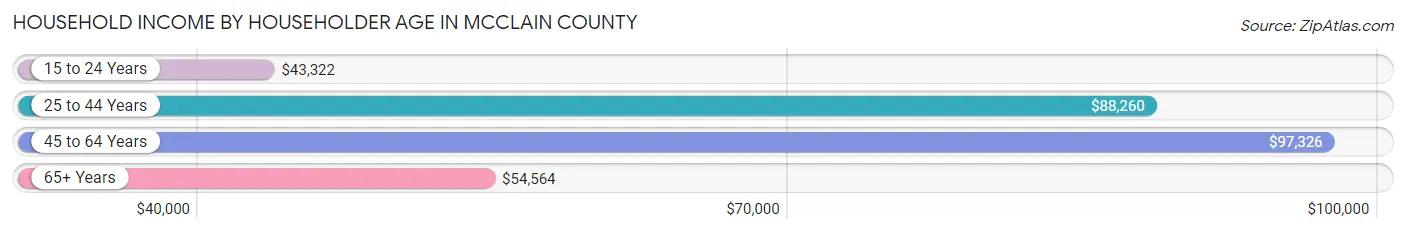
| Income Bracket | # Households | Median Income |
| 15 to 24 Years | 586 (3.8%) | $43,322 |
| 25 to 44 Years | 4,991 (32.3%) | $88,260 |
| 45 to 64 Years | 5,571 (36.1%) | $97,326 |
| 65+ Years | 4,299 (27.8%) | $54,564 |
| Total | 15,447 (100.0%) | $80,150 |
Poverty in McClain County
Income Below Poverty by Sex and Age in McClain County
With 6.7% poverty level for males and 7.4% for females among the residents of McClain County, 18 to 24 year old males and under 5 year old females are the most vulnerable to poverty, with 227 males (12.9%) and 199 females (17.5%) in their respective age groups living below the poverty level.
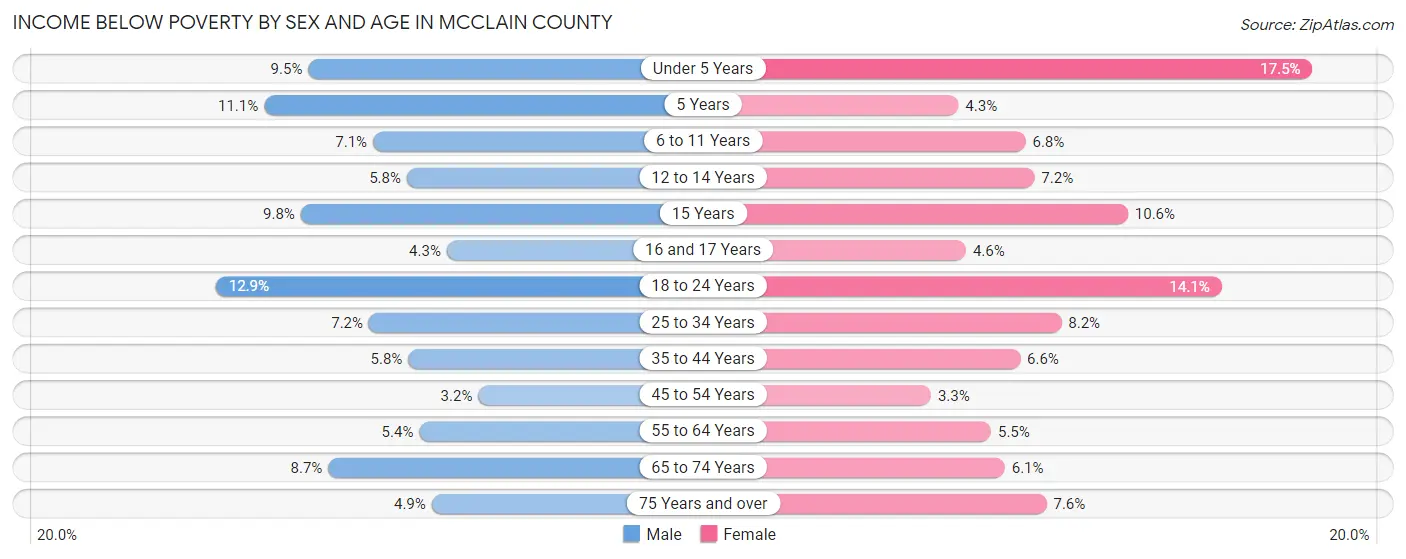
| Age Bracket | Male | Female |
| Under 5 Years | 109 (9.5%) | 199 (17.5%) |
| 5 Years | 29 (11.1%) | 10 (4.3%) |
| 6 to 11 Years | 132 (7.1%) | 124 (6.8%) |
| 12 to 14 Years | 71 (5.8%) | 67 (7.1%) |
| 15 Years | 23 (9.8%) | 43 (10.6%) |
| 16 and 17 Years | 33 (4.3%) | 28 (4.6%) |
| 18 to 24 Years | 227 (12.9%) | 221 (14.1%) |
| 25 to 34 Years | 169 (7.2%) | 209 (8.2%) |
| 35 to 44 Years | 182 (5.8%) | 196 (6.6%) |
| 45 to 54 Years | 85 (3.2%) | 86 (3.3%) |
| 55 to 64 Years | 144 (5.3%) | 151 (5.5%) |
| 65 to 74 Years | 168 (8.7%) | 120 (6.0%) |
| 75 Years and over | 56 (4.9%) | 105 (7.6%) |
| Total | 1,428 (6.7%) | 1,559 (7.4%) |
Income Above Poverty by Sex and Age in McClain County
According to the poverty statistics in McClain County, males aged 45 to 54 years and females aged 45 to 54 years are the age groups that are most secure financially, with 96.8% of males and 96.7% of females in these age groups living above the poverty line.
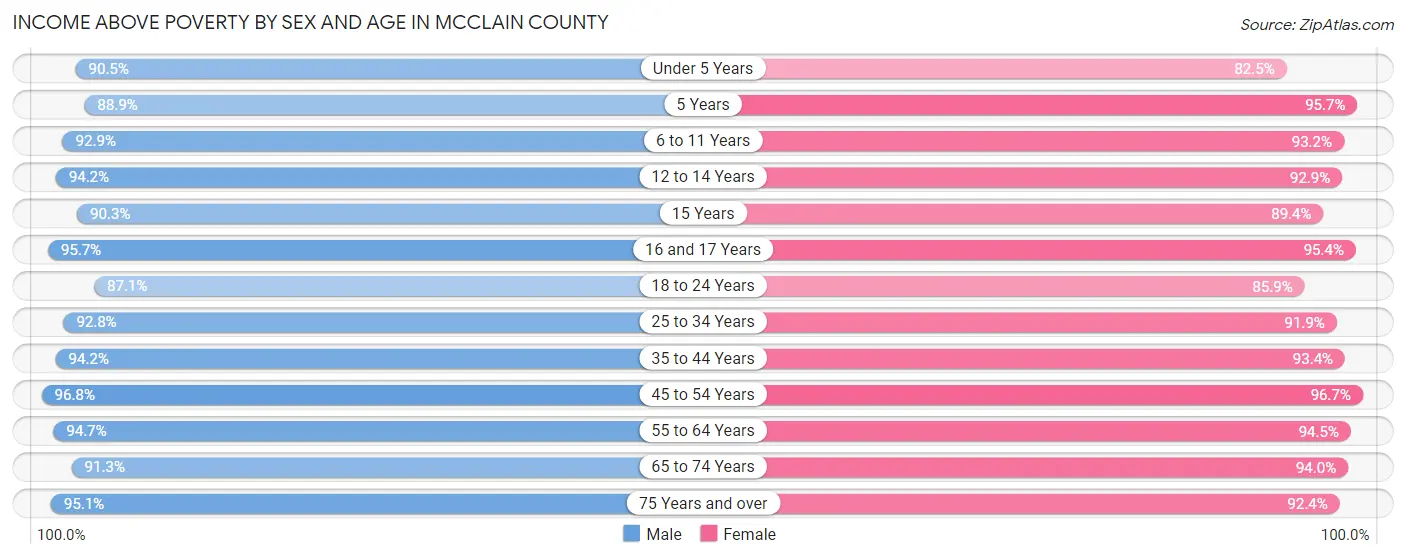
| Age Bracket | Male | Female |
| Under 5 Years | 1,042 (90.5%) | 940 (82.5%) |
| 5 Years | 232 (88.9%) | 221 (95.7%) |
| 6 to 11 Years | 1,736 (92.9%) | 1,693 (93.2%) |
| 12 to 14 Years | 1,151 (94.2%) | 870 (92.8%) |
| 15 Years | 213 (90.2%) | 362 (89.4%) |
| 16 and 17 Years | 730 (95.7%) | 580 (95.4%) |
| 18 to 24 Years | 1,533 (87.1%) | 1,346 (85.9%) |
| 25 to 34 Years | 2,173 (92.8%) | 2,355 (91.8%) |
| 35 to 44 Years | 2,976 (94.2%) | 2,763 (93.4%) |
| 45 to 54 Years | 2,601 (96.8%) | 2,515 (96.7%) |
| 55 to 64 Years | 2,546 (94.7%) | 2,577 (94.5%) |
| 65 to 74 Years | 1,757 (91.3%) | 1,863 (94.0%) |
| 75 Years and over | 1,089 (95.1%) | 1,276 (92.4%) |
| Total | 19,779 (93.3%) | 19,361 (92.5%) |
Income Below Poverty Among Married-Couple Families in McClain County
The poverty statistics for married-couple families in McClain County show that 3.7% or 358 of the total 9,685 families live below the poverty line. Families with 5 or more children have the highest poverty rate of 9.1%, comprising of 4 families. On the other hand, families with no children have the lowest poverty rate of 3.1%, which includes 160 families.
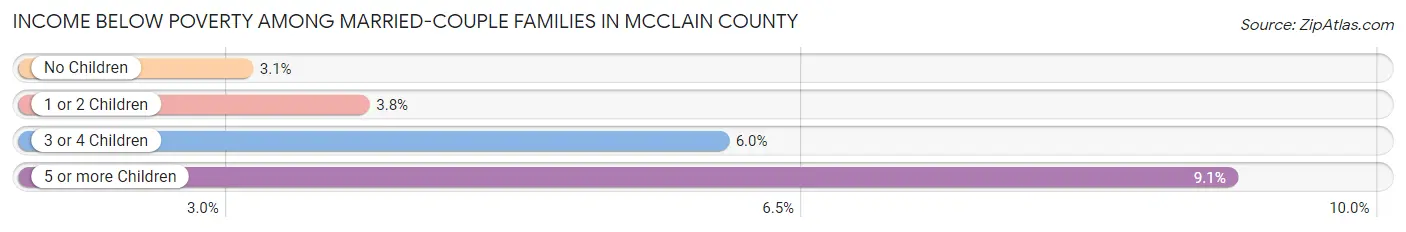
| Children | Above Poverty | Below Poverty |
| No Children | 5,015 (96.9%) | 160 (3.1%) |
| 1 or 2 Children | 3,237 (96.2%) | 128 (3.8%) |
| 3 or 4 Children | 1,035 (94.0%) | 66 (6.0%) |
| 5 or more Children | 40 (90.9%) | 4 (9.1%) |
| Total | 9,327 (96.3%) | 358 (3.7%) |
Income Below Poverty Among Single-Parent Households in McClain County
According to the poverty data in McClain County, 9.7% or 70 single-father households and 15.6% or 204 single-mother households are living below the poverty line. Among single-father households, those with no children have the highest poverty rate, with 30 households (13.8%) experiencing poverty. Likewise, among single-mother households, those with 3 or 4 children have the highest poverty rate, with 49 households (56.3%) falling below the poverty line.
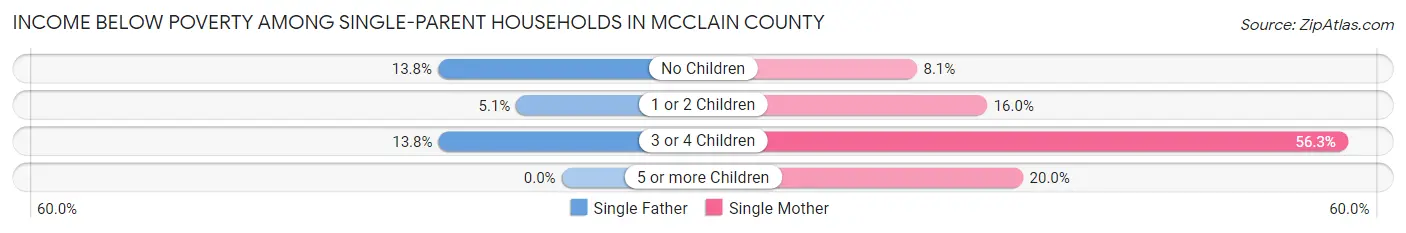
| Children | Single Father | Single Mother |
| No Children | 30 (13.8%) | 42 (8.1%) |
| 1 or 2 Children | 17 (5.1%) | 110 (16.0%) |
| 3 or 4 Children | 23 (13.8%) | 49 (56.3%) |
| 5 or more Children | 0 (0.0%) | 3 (20.0%) |
| Total | 70 (9.7%) | 204 (15.6%) |
Income Below Poverty Among Married-Couple vs Single-Parent Households in McClain County
The poverty data for McClain County shows that 358 of the married-couple family households (3.7%) and 274 of the single-parent households (13.5%) are living below the poverty level. Within the married-couple family households, those with 5 or more children have the highest poverty rate, with 4 households (9.1%) falling below the poverty line. Among the single-parent households, those with 3 or 4 children have the highest poverty rate, with 72 household (28.3%) living below poverty.
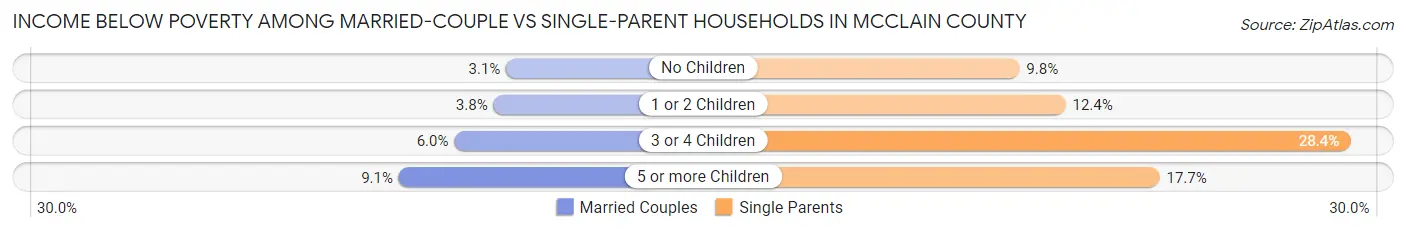
| Children | Married-Couple Families | Single-Parent Households |
| No Children | 160 (3.1%) | 72 (9.8%) |
| 1 or 2 Children | 128 (3.8%) | 127 (12.4%) |
| 3 or 4 Children | 66 (6.0%) | 72 (28.3%) |
| 5 or more Children | 4 (9.1%) | 3 (17.6%) |
| Total | 358 (3.7%) | 274 (13.5%) |
Employment Characteristics in McClain County
Employment by Class of Employer in McClain County
Among the 20,149 employed individuals in McClain County, private company employees (11,893 | 59.0%), state government employees (1,591 | 7.9%), and local government employees (1,570 | 7.8%) make up the most common classes of employment.
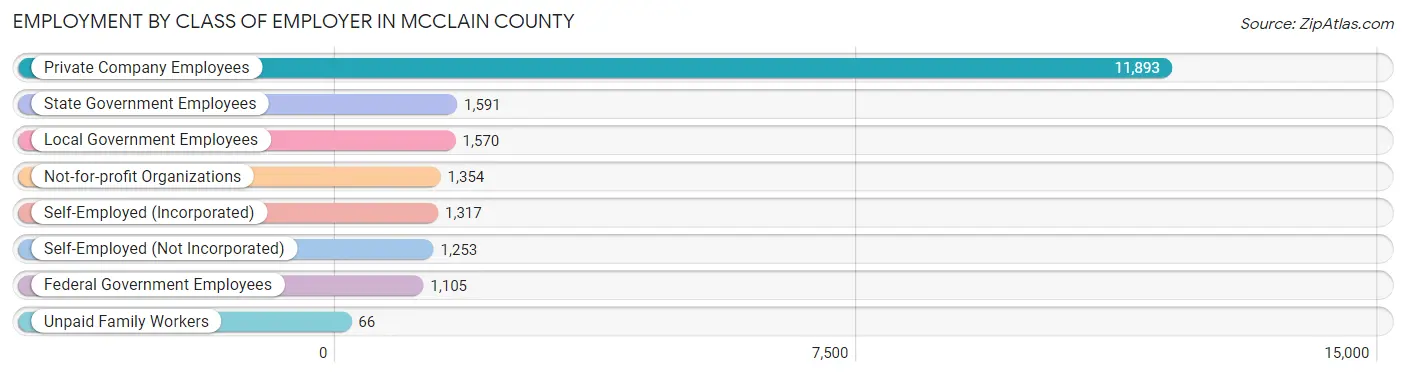
| Employer Class | # Employees | % Employees |
| Private Company Employees | 11,893 | 59.0% |
| Self-Employed (Incorporated) | 1,317 | 6.5% |
| Self-Employed (Not Incorporated) | 1,253 | 6.2% |
| Not-for-profit Organizations | 1,354 | 6.7% |
| Local Government Employees | 1,570 | 7.8% |
| State Government Employees | 1,591 | 7.9% |
| Federal Government Employees | 1,105 | 5.5% |
| Unpaid Family Workers | 66 | 0.3% |
| Total | 20,149 | 100.0% |
Employment Status by Age in McClain County
According to the labor force statistics for McClain County, out of the total population over 16 years of age (33,086), 64.2% or 21,241 individuals are in the labor force, with 4.1% or 871 of them unemployed. The age group with the highest labor force participation rate is 35 to 44 years, with 83.2% or 5,118 individuals in the labor force. Within the labor force, the 16 to 19 years age range has the highest percentage of unemployed individuals, with 11.8% or 106 of them being unemployed.
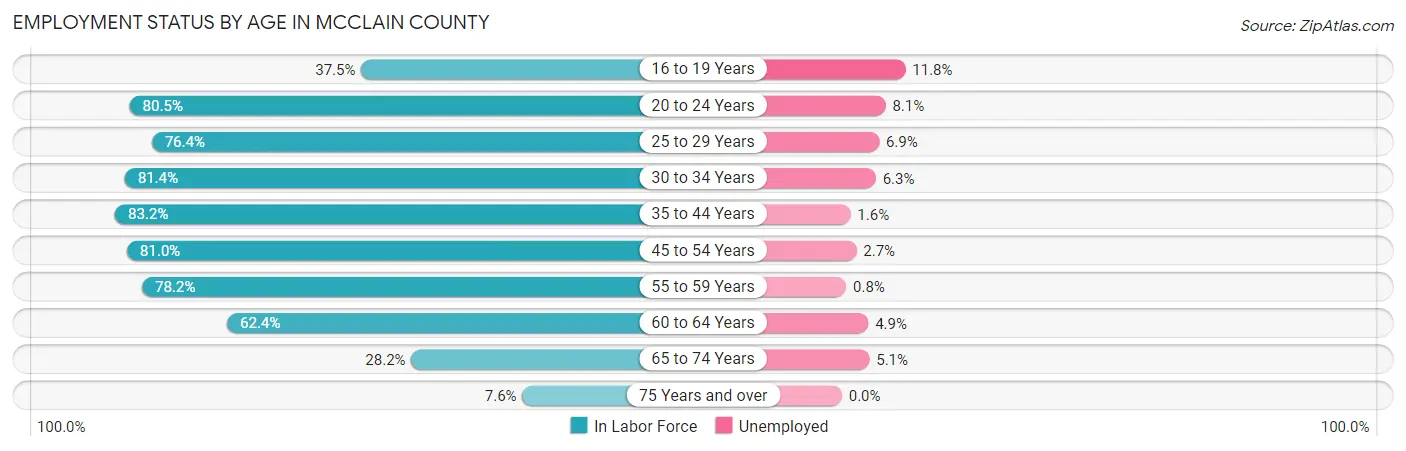
| Age Bracket | In Labor Force | Unemployed |
| 16 to 19 Years | 898 (37.5%) | 106 (11.8%) |
| 20 to 24 Years | 1,863 (80.5%) | 151 (8.1%) |
| 25 to 29 Years | 1,842 (76.4%) | 127 (6.9%) |
| 30 to 34 Years | 2,056 (81.4%) | 130 (6.3%) |
| 35 to 44 Years | 5,118 (83.2%) | 82 (1.6%) |
| 45 to 54 Years | 4,282 (81.0%) | 116 (2.7%) |
| 55 to 59 Years | 2,233 (78.2%) | 18 (0.8%) |
| 60 to 64 Years | 1,627 (62.4%) | 80 (4.9%) |
| 65 to 74 Years | 1,112 (28.2%) | 57 (5.1%) |
| 75 Years and over | 197 (7.6%) | 0 (0.0%) |
| Total | 21,241 (64.2%) | 871 (4.1%) |
Employment Status by Educational Attainment in McClain County
According to labor force statistics for McClain County, 78.6% of individuals (17,165) out of the total population between 25 and 64 years of age (21,839) are in the labor force, with 3.2% or 549 of them being unemployed. The group with the highest labor force participation rate are those with the educational attainment of bachelor's degree or higher, with 85.3% or 5,271 individuals in the labor force. Within the labor force, individuals with college / associate degree education have the highest percentage of unemployment, with 5.0% or 265 of them being unemployed.
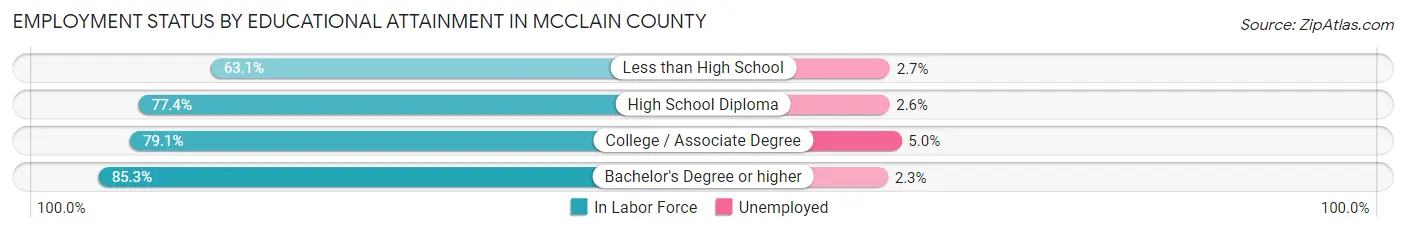
| Educational Attainment | In Labor Force | Unemployed |
| Less than High School | 1,536 (63.1%) | 66 (2.7%) |
| High School Diploma | 5,057 (77.4%) | 170 (2.6%) |
| College / Associate Degree | 5,293 (79.1%) | 335 (5.0%) |
| Bachelor's Degree or higher | 5,271 (85.3%) | 142 (2.3%) |
| Total | 17,165 (78.6%) | 699 (3.2%) |
Employment Occupations by Sex in McClain County
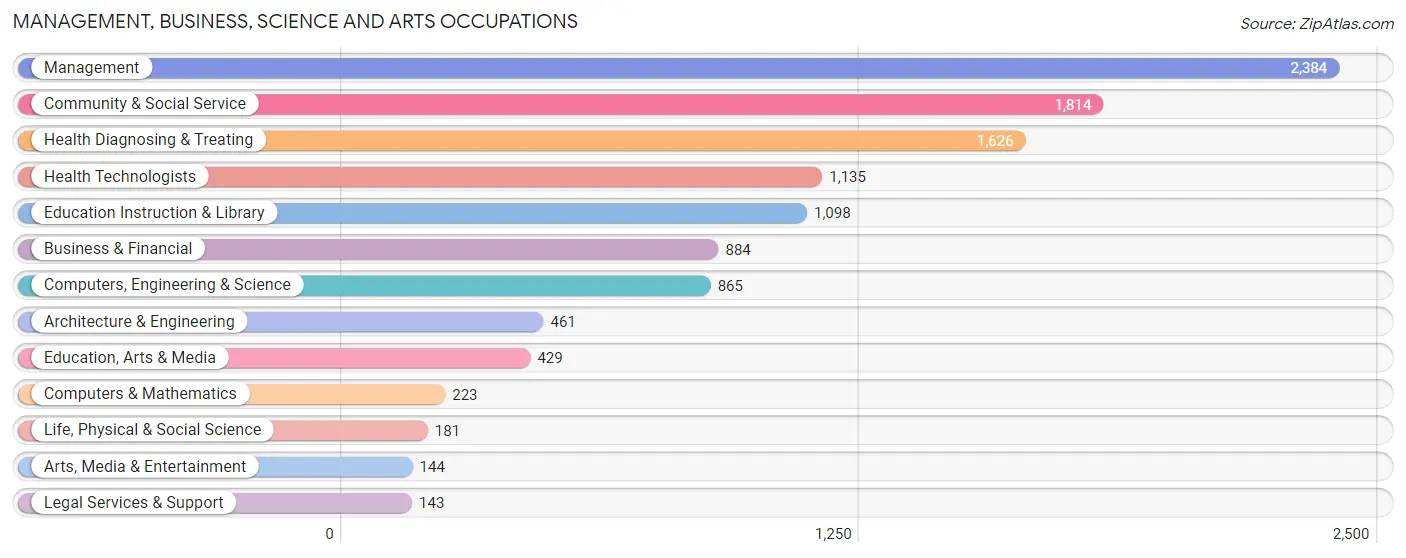
Management, Business, Science and Arts Occupations
The most common Management, Business, Science and Arts occupations in McClain County are Management (2,384 | 11.8%), Community & Social Service (1,814 | 9.0%), Health Diagnosing & Treating (1,626 | 8.1%), Health Technologists (1,135 | 5.6%), and Education Instruction & Library (1,098 | 5.4%).
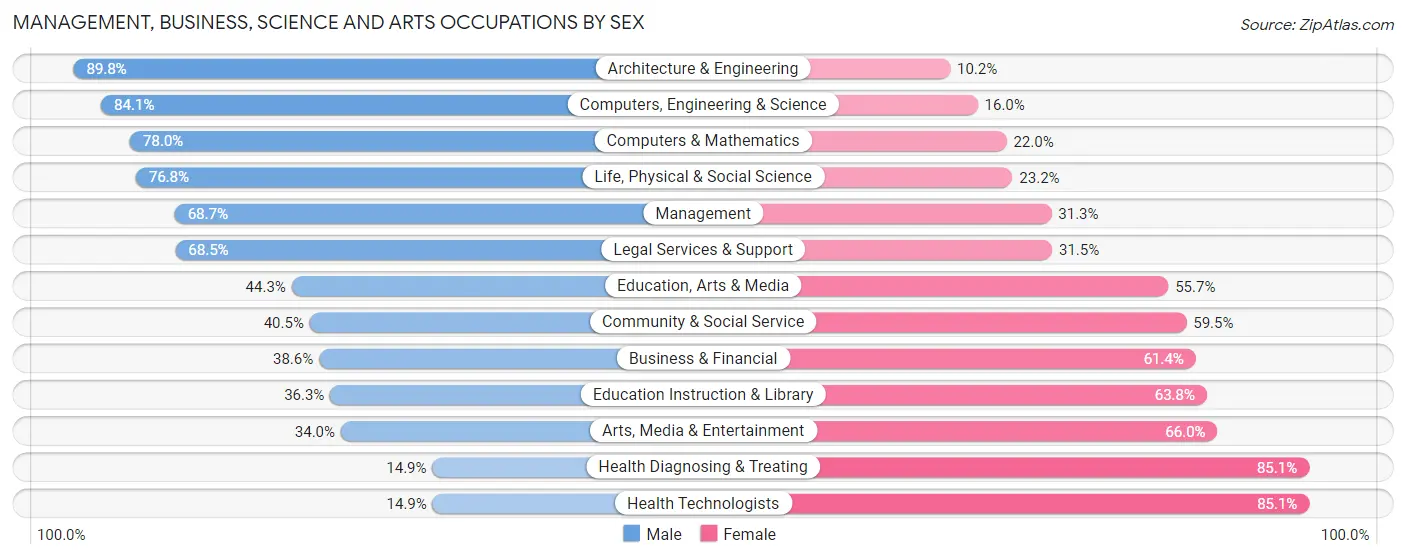
Management, Business, Science and Arts Occupations by Sex
Within the Management, Business, Science and Arts occupations in McClain County, the most male-oriented occupations are Architecture & Engineering (89.8%), Computers, Engineering & Science (84.1%), and Computers & Mathematics (78.0%), while the most female-oriented occupations are Health Technologists (85.1%), Health Diagnosing & Treating (85.1%), and Arts, Media & Entertainment (66.0%).
| Occupation | Male | Female |
| Management | 1,637 (68.7%) | 747 (31.3%) |
| Business & Financial | 341 (38.6%) | 543 (61.4%) |
| Computers, Engineering & Science | 727 (84.1%) | 138 (16.0%) |
| Computers & Mathematics | 174 (78.0%) | 49 (22.0%) |
| Architecture & Engineering | 414 (89.8%) | 47 (10.2%) |
| Life, Physical & Social Science | 139 (76.8%) | 42 (23.2%) |
| Community & Social Service | 735 (40.5%) | 1,079 (59.5%) |
| Education, Arts & Media | 190 (44.3%) | 239 (55.7%) |
| Legal Services & Support | 98 (68.5%) | 45 (31.5%) |
| Education Instruction & Library | 398 (36.2%) | 700 (63.7%) |
| Arts, Media & Entertainment | 49 (34.0%) | 95 (66.0%) |
| Health Diagnosing & Treating | 243 (14.9%) | 1,383 (85.1%) |
| Health Technologists | 169 (14.9%) | 966 (85.1%) |
| Total (Category) | 3,683 (48.6%) | 3,890 (51.4%) |
| Total (Overall) | 11,245 (55.7%) | 8,942 (44.3%) |
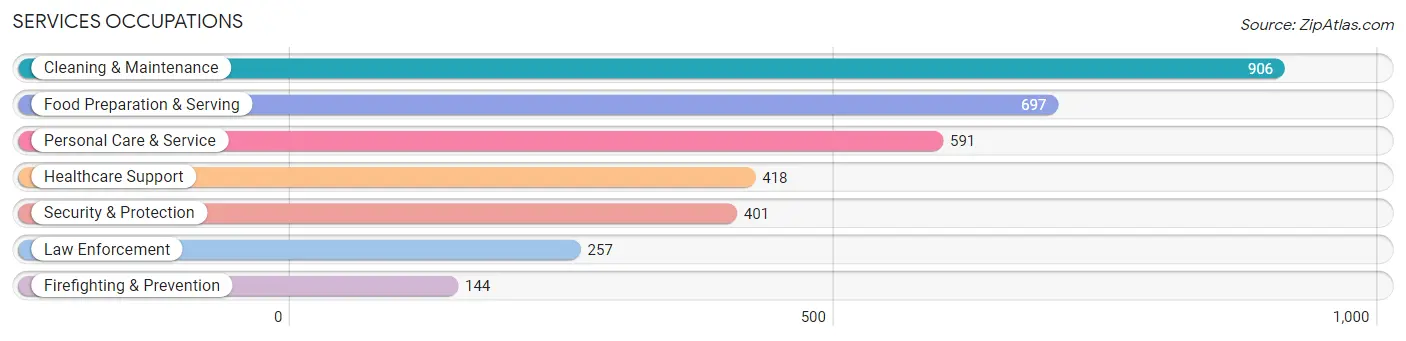
Services Occupations
The most common Services occupations in McClain County are Cleaning & Maintenance (906 | 4.5%), Food Preparation & Serving (697 | 3.5%), Personal Care & Service (591 | 2.9%), Healthcare Support (418 | 2.1%), and Security & Protection (401 | 2.0%).
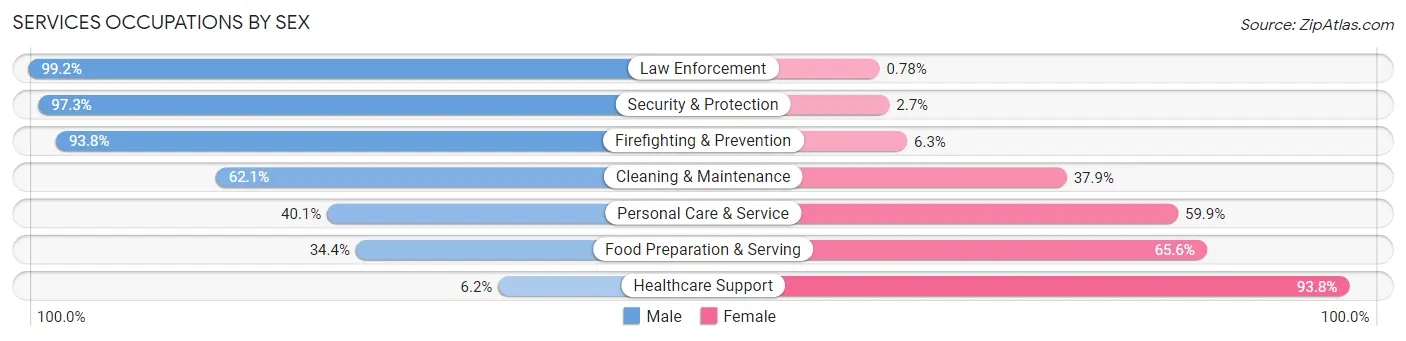
Services Occupations by Sex
Within the Services occupations in McClain County, the most male-oriented occupations are Law Enforcement (99.2%), Security & Protection (97.3%), and Firefighting & Prevention (93.8%), while the most female-oriented occupations are Healthcare Support (93.8%), Food Preparation & Serving (65.6%), and Personal Care & Service (59.9%).
| Occupation | Male | Female |
| Healthcare Support | 26 (6.2%) | 392 (93.8%) |
| Security & Protection | 390 (97.3%) | 11 (2.7%) |
| Firefighting & Prevention | 135 (93.8%) | 9 (6.2%) |
| Law Enforcement | 255 (99.2%) | 2 (0.8%) |
| Food Preparation & Serving | 240 (34.4%) | 457 (65.6%) |
| Cleaning & Maintenance | 563 (62.1%) | 343 (37.9%) |
| Personal Care & Service | 237 (40.1%) | 354 (59.9%) |
| Total (Category) | 1,456 (48.3%) | 1,557 (51.7%) |
| Total (Overall) | 11,245 (55.7%) | 8,942 (44.3%) |
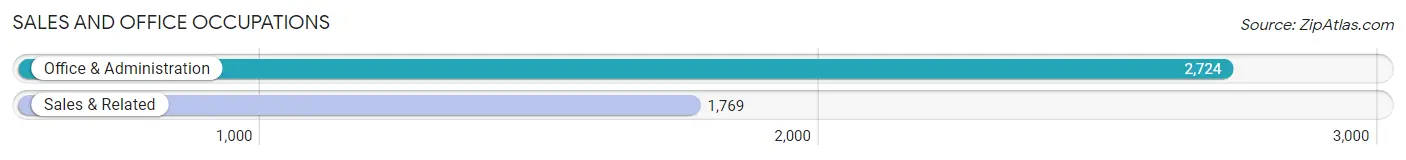
Sales and Office Occupations
The most common Sales and Office occupations in McClain County are Office & Administration (2,724 | 13.5%), and Sales & Related (1,769 | 8.8%).
Sales and Office Occupations by Sex
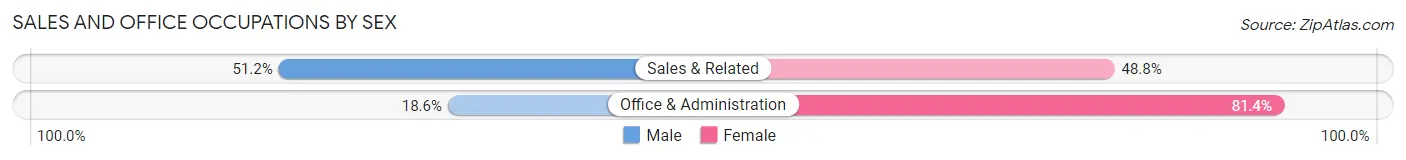
| Occupation | Male | Female |
| Sales & Related | 905 (51.2%) | 864 (48.8%) |
| Office & Administration | 507 (18.6%) | 2,217 (81.4%) |
| Total (Category) | 1,412 (31.4%) | 3,081 (68.6%) |
| Total (Overall) | 11,245 (55.7%) | 8,942 (44.3%) |
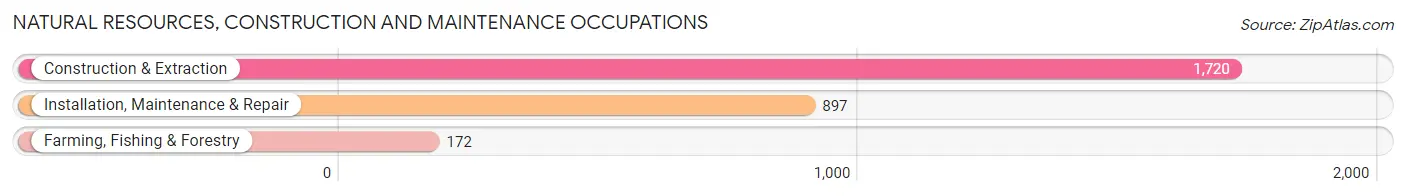
Natural Resources, Construction and Maintenance Occupations
The most common Natural Resources, Construction and Maintenance occupations in McClain County are Construction & Extraction (1,720 | 8.5%), Installation, Maintenance & Repair (897 | 4.4%), and Farming, Fishing & Forestry (172 | 0.9%).
Natural Resources, Construction and Maintenance Occupations by Sex
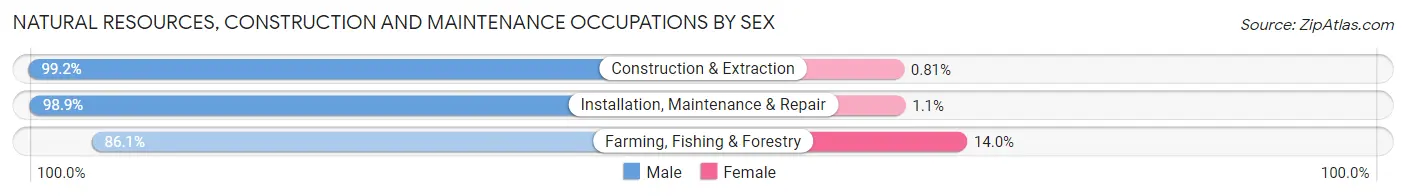
| Occupation | Male | Female |
| Farming, Fishing & Forestry | 148 (86.1%) | 24 (14.0%) |
| Construction & Extraction | 1,706 (99.2%) | 14 (0.8%) |
| Installation, Maintenance & Repair | 887 (98.9%) | 10 (1.1%) |
| Total (Category) | 2,741 (98.3%) | 48 (1.7%) |
| Total (Overall) | 11,245 (55.7%) | 8,942 (44.3%) |
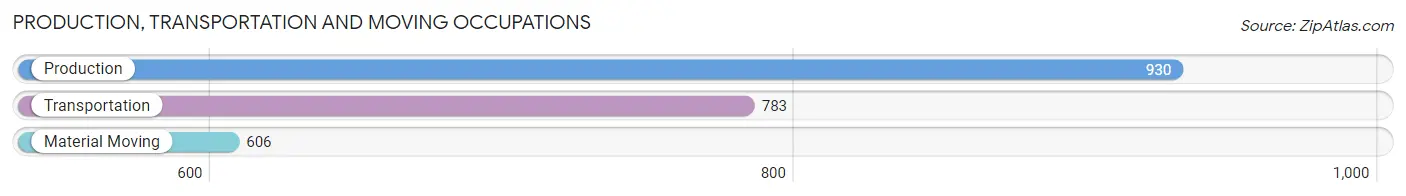
Production, Transportation and Moving Occupations
The most common Production, Transportation and Moving occupations in McClain County are Production (930 | 4.6%), Transportation (783 | 3.9%), and Material Moving (606 | 3.0%).
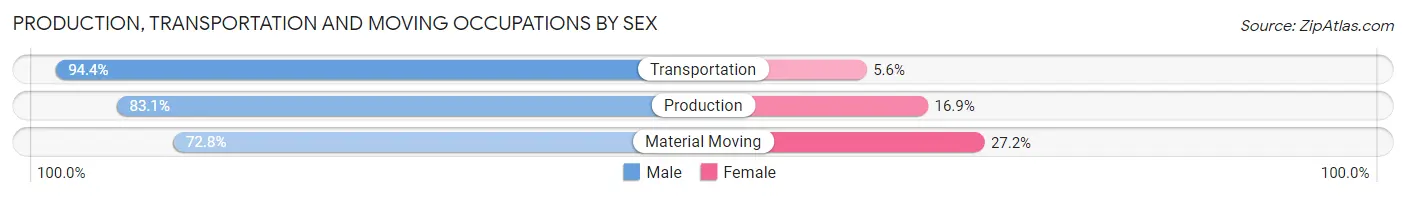
Production, Transportation and Moving Occupations by Sex
| Occupation | Male | Female |
| Production | 773 (83.1%) | 157 (16.9%) |
| Transportation | 739 (94.4%) | 44 (5.6%) |
| Material Moving | 441 (72.8%) | 165 (27.2%) |
| Total (Category) | 1,953 (84.2%) | 366 (15.8%) |
| Total (Overall) | 11,245 (55.7%) | 8,942 (44.3%) |
Employment Industries by Sex in McClain County
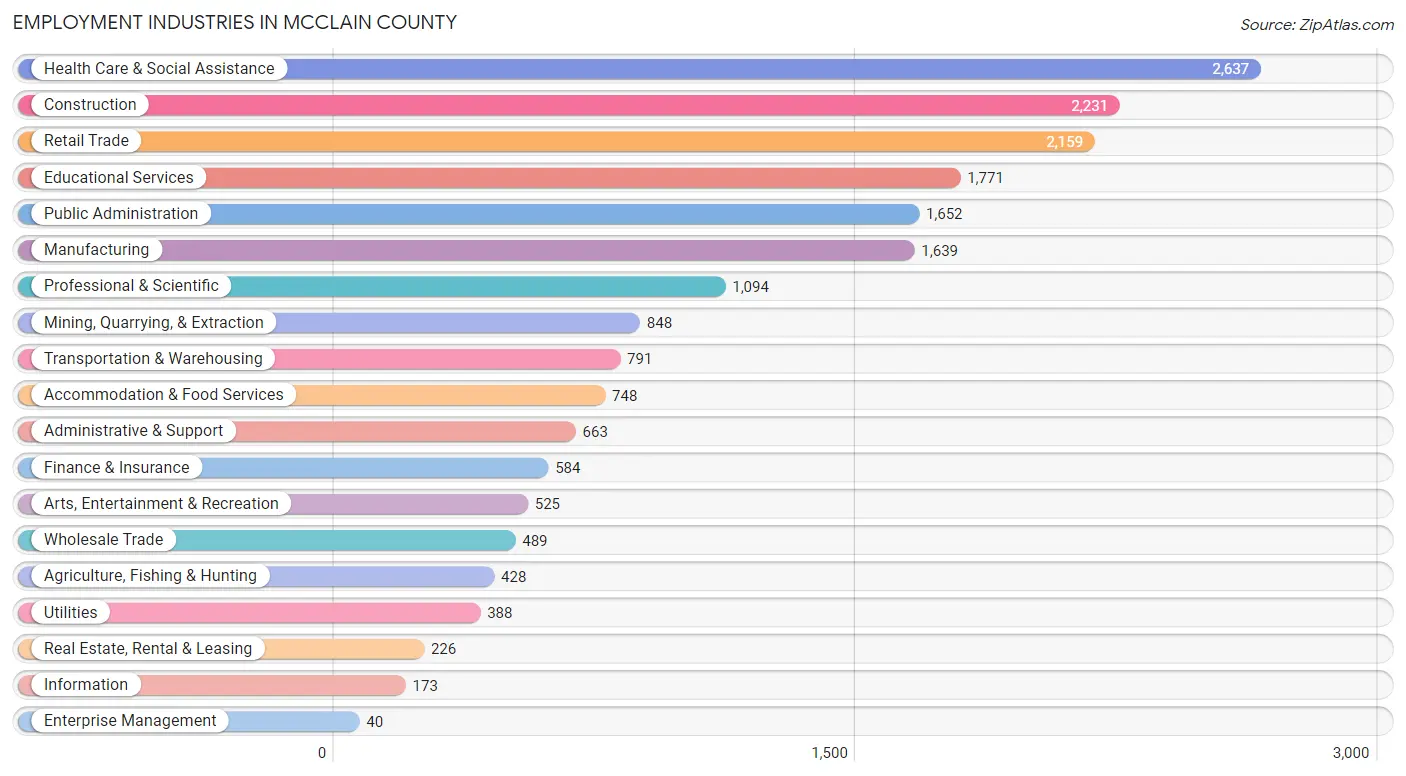
Employment Industries in McClain County
The major employment industries in McClain County include Health Care & Social Assistance (2,637 | 13.1%), Construction (2,231 | 11.1%), Retail Trade (2,159 | 10.7%), Educational Services (1,771 | 8.8%), and Public Administration (1,652 | 8.2%).
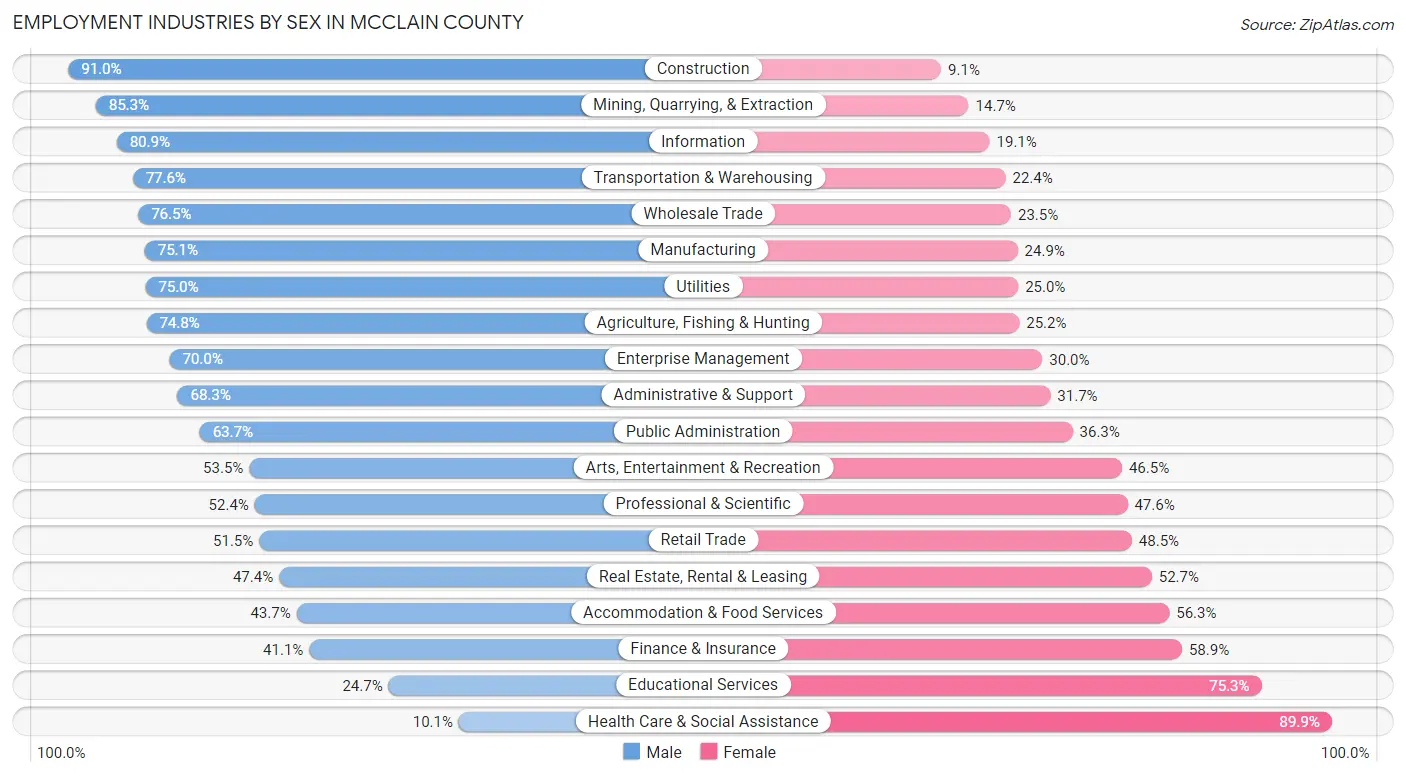
Employment Industries by Sex in McClain County
The McClain County industries that see more men than women are Construction (90.9%), Mining, Quarrying, & Extraction (85.3%), and Information (80.9%), whereas the industries that tend to have a higher number of women are Health Care & Social Assistance (89.9%), Educational Services (75.3%), and Finance & Insurance (58.9%).
| Industry | Male | Female |
| Agriculture, Fishing & Hunting | 320 (74.8%) | 108 (25.2%) |
| Mining, Quarrying, & Extraction | 723 (85.3%) | 125 (14.7%) |
| Construction | 2,029 (90.9%) | 202 (9.0%) |
| Manufacturing | 1,231 (75.1%) | 408 (24.9%) |
| Wholesale Trade | 374 (76.5%) | 115 (23.5%) |
| Retail Trade | 1,111 (51.5%) | 1,048 (48.5%) |
| Transportation & Warehousing | 614 (77.6%) | 177 (22.4%) |
| Utilities | 291 (75.0%) | 97 (25.0%) |
| Information | 140 (80.9%) | 33 (19.1%) |
| Finance & Insurance | 240 (41.1%) | 344 (58.9%) |
| Real Estate, Rental & Leasing | 107 (47.3%) | 119 (52.6%) |
| Professional & Scientific | 573 (52.4%) | 521 (47.6%) |
| Enterprise Management | 28 (70.0%) | 12 (30.0%) |
| Administrative & Support | 453 (68.3%) | 210 (31.7%) |
| Educational Services | 437 (24.7%) | 1,334 (75.3%) |
| Health Care & Social Assistance | 267 (10.1%) | 2,370 (89.9%) |
| Arts, Entertainment & Recreation | 281 (53.5%) | 244 (46.5%) |
| Accommodation & Food Services | 327 (43.7%) | 421 (56.3%) |
| Public Administration | 1,053 (63.7%) | 599 (36.3%) |
| Total | 11,245 (55.7%) | 8,942 (44.3%) |
Education in McClain County
School Enrollment in McClain County
The most common levels of schooling among the 10,610 students in McClain County are high school (2,779 | 26.2%), middle school (2,681 | 25.3%), and elementary school (2,503 | 23.6%).
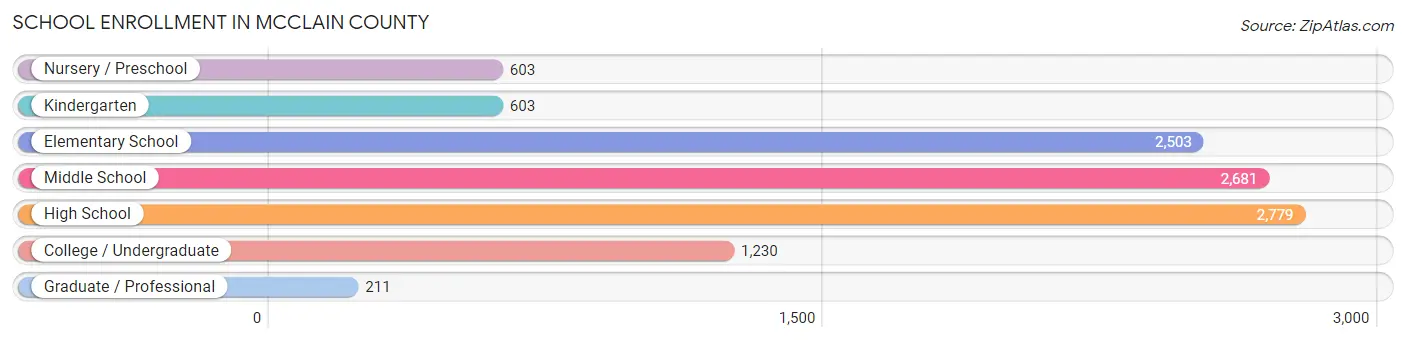
| School Level | # Students | % Students |
| Nursery / Preschool | 603 | 5.7% |
| Kindergarten | 603 | 5.7% |
| Elementary School | 2,503 | 23.6% |
| Middle School | 2,681 | 25.3% |
| High School | 2,779 | 26.2% |
| College / Undergraduate | 1,230 | 11.6% |
| Graduate / Professional | 211 | 2.0% |
| Total | 10,610 | 100.0% |
School Enrollment by Age by Funding Source in McClain County
Out of a total of 10,610 students who are enrolled in schools in McClain County, 1,072 (10.1%) attend a private institution, while the remaining 9,538 (89.9%) are enrolled in public schools. The age group of 25 to 34 year olds has the highest likelihood of being enrolled in private schools, with 90 (29.6% in the age bracket) enrolled. Conversely, the age group of 5 to 9 year old has the lowest likelihood of being enrolled in a private school, with 2,755 (93.4% in the age bracket) attending a public institution.
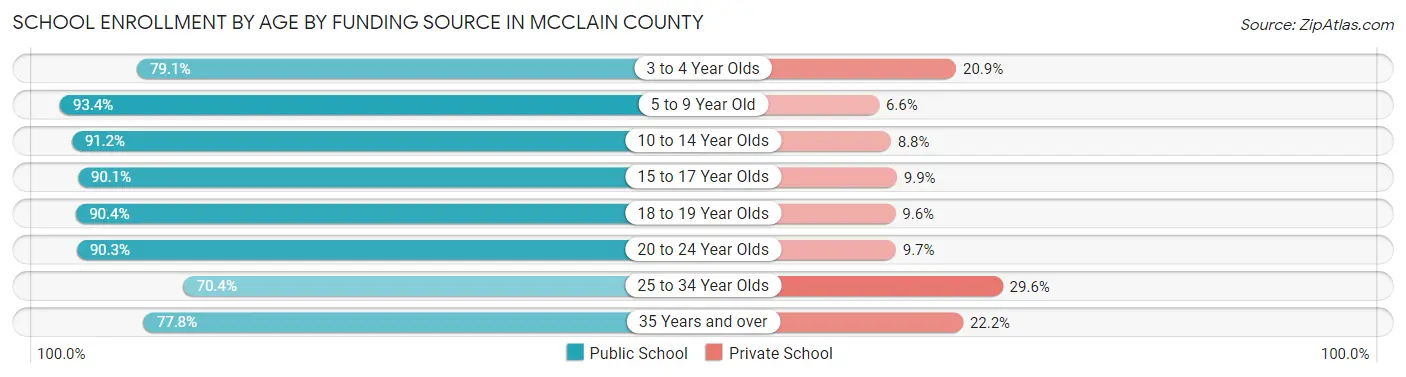
| Age Bracket | Public School | Private School |
| 3 to 4 Year Olds | 302 (79.1%) | 80 (20.9%) |
| 5 to 9 Year Old | 2,755 (93.4%) | 194 (6.6%) |
| 10 to 14 Year Olds | 2,992 (91.2%) | 288 (8.8%) |
| 15 to 17 Year Olds | 1,745 (90.1%) | 192 (9.9%) |
| 18 to 19 Year Olds | 705 (90.4%) | 75 (9.6%) |
| 20 to 24 Year Olds | 493 (90.3%) | 53 (9.7%) |
| 25 to 34 Year Olds | 214 (70.4%) | 90 (29.6%) |
| 35 Years and over | 336 (77.8%) | 96 (22.2%) |
| Total | 9,538 (89.9%) | 1,072 (10.1%) |
Educational Attainment by Field of Study in McClain County
Education (1,498 | 18.4%), business (1,459 | 17.9%), science & technology (1,277 | 15.7%), arts & humanities (835 | 10.3%), and bio, nature & agricultural (486 | 6.0%) are the most common fields of study among 8,129 individuals in McClain County who have obtained a bachelor's degree or higher.
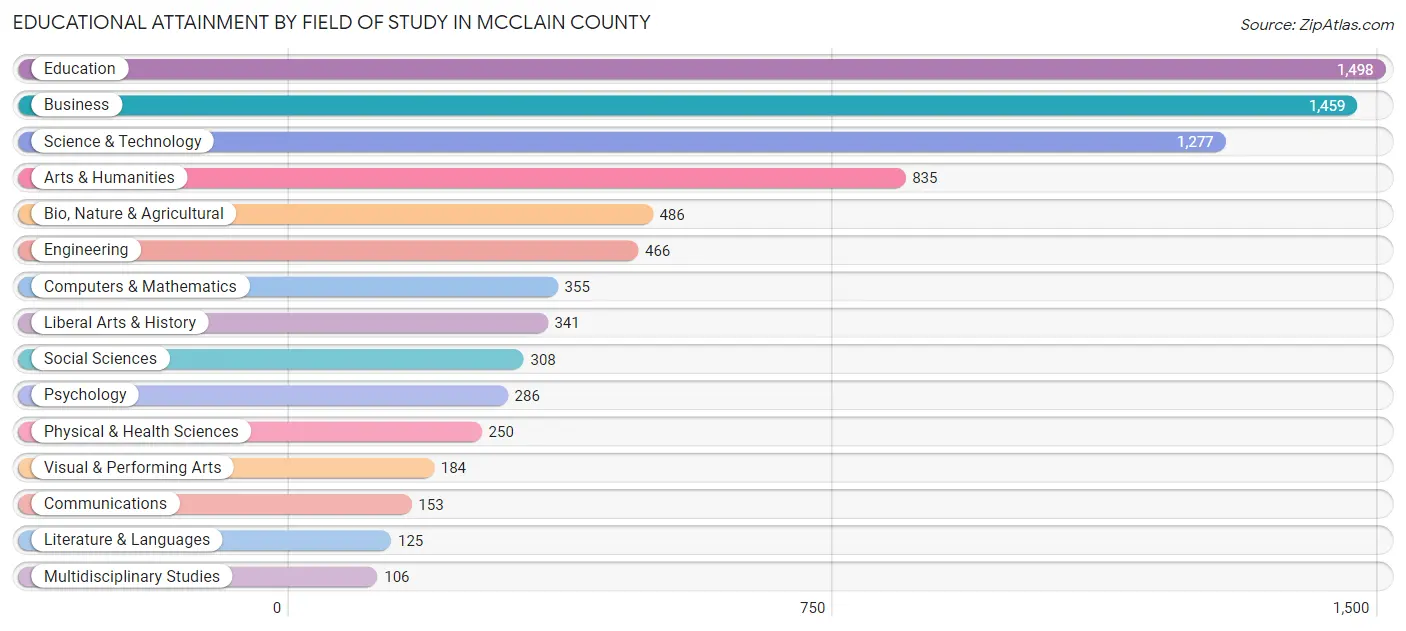
| Field of Study | # Graduates | % Graduates |
| Computers & Mathematics | 355 | 4.4% |
| Bio, Nature & Agricultural | 486 | 6.0% |
| Physical & Health Sciences | 250 | 3.1% |
| Psychology | 286 | 3.5% |
| Social Sciences | 308 | 3.8% |
| Engineering | 466 | 5.7% |
| Multidisciplinary Studies | 106 | 1.3% |
| Science & Technology | 1,277 | 15.7% |
| Business | 1,459 | 17.9% |
| Education | 1,498 | 18.4% |
| Literature & Languages | 125 | 1.5% |
| Liberal Arts & History | 341 | 4.2% |
| Visual & Performing Arts | 184 | 2.3% |
| Communications | 153 | 1.9% |
| Arts & Humanities | 835 | 10.3% |
| Total | 8,129 | 100.0% |
Transportation & Commute in McClain County
Vehicle Availability by Sex in McClain County
The most prevalent vehicle ownership categories in McClain County are males with 2 vehicles (4,666, accounting for 41.2%) and females with 2 vehicles (4,101, making up 53.1%).
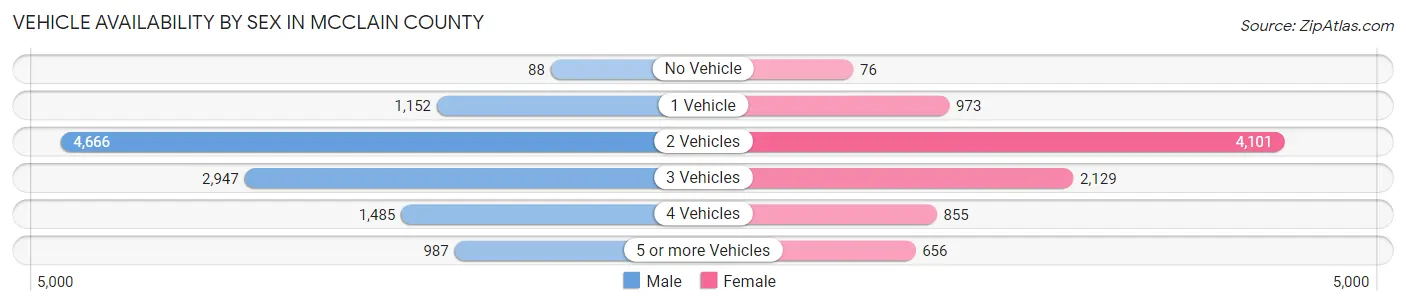
| Vehicles Available | Male | Female |
| No Vehicle | 88 (0.8%) | 76 (0.9%) |
| 1 Vehicle | 1,152 (10.2%) | 973 (11.1%) |
| 2 Vehicles | 4,666 (41.2%) | 4,101 (46.7%) |
| 3 Vehicles | 2,947 (26.0%) | 2,129 (24.2%) |
| 4 Vehicles | 1,485 (13.1%) | 855 (9.7%) |
| 5 or more Vehicles | 987 (8.7%) | 656 (7.5%) |
| Total | 11,325 (100.0%) | 8,790 (100.0%) |
Commute Time in McClain County
The most frequently occuring commute durations in McClain County are 30 to 34 minutes (2,980 commuters, 16.1%), 20 to 24 minutes (2,698 commuters, 14.6%), and 45 to 59 minutes (2,212 commuters, 12.0%).
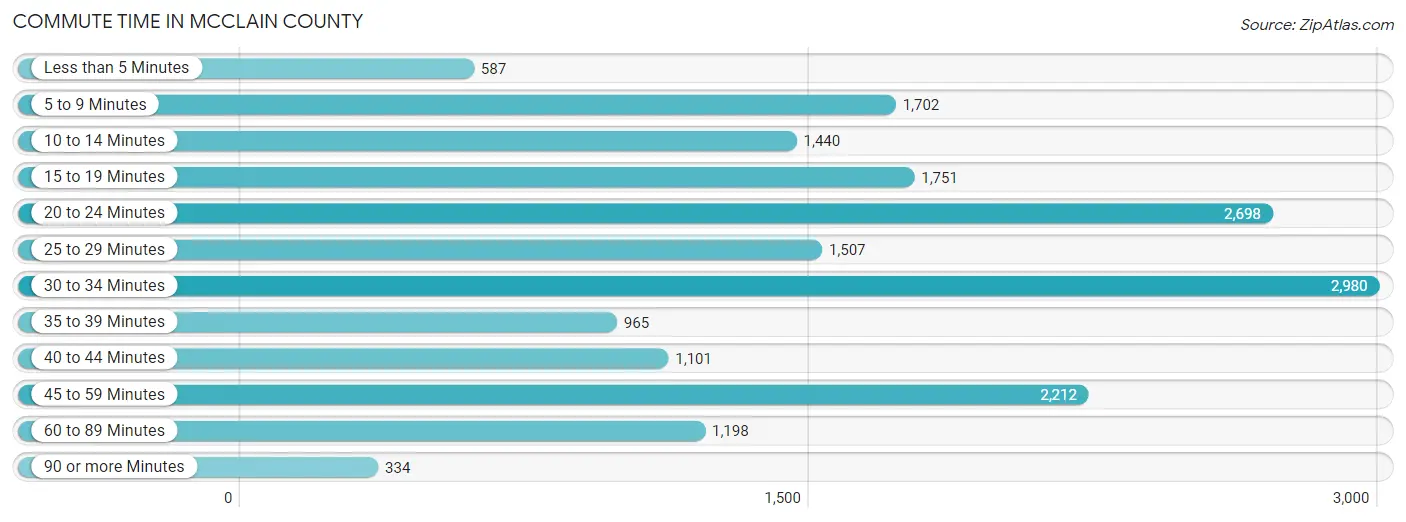
| Commute Time | # Commuters | % Commuters |
| Less than 5 Minutes | 587 | 3.2% |
| 5 to 9 Minutes | 1,702 | 9.2% |
| 10 to 14 Minutes | 1,440 | 7.8% |
| 15 to 19 Minutes | 1,751 | 9.5% |
| 20 to 24 Minutes | 2,698 | 14.6% |
| 25 to 29 Minutes | 1,507 | 8.2% |
| 30 to 34 Minutes | 2,980 | 16.1% |
| 35 to 39 Minutes | 965 | 5.2% |
| 40 to 44 Minutes | 1,101 | 6.0% |
| 45 to 59 Minutes | 2,212 | 12.0% |
| 60 to 89 Minutes | 1,198 | 6.5% |
| 90 or more Minutes | 334 | 1.8% |
Commute Time by Sex in McClain County
The most common commute times in McClain County are 30 to 34 minutes (1,741 commuters, 16.9%) for males and 20 to 24 minutes (1,331 commuters, 16.3%) for females.
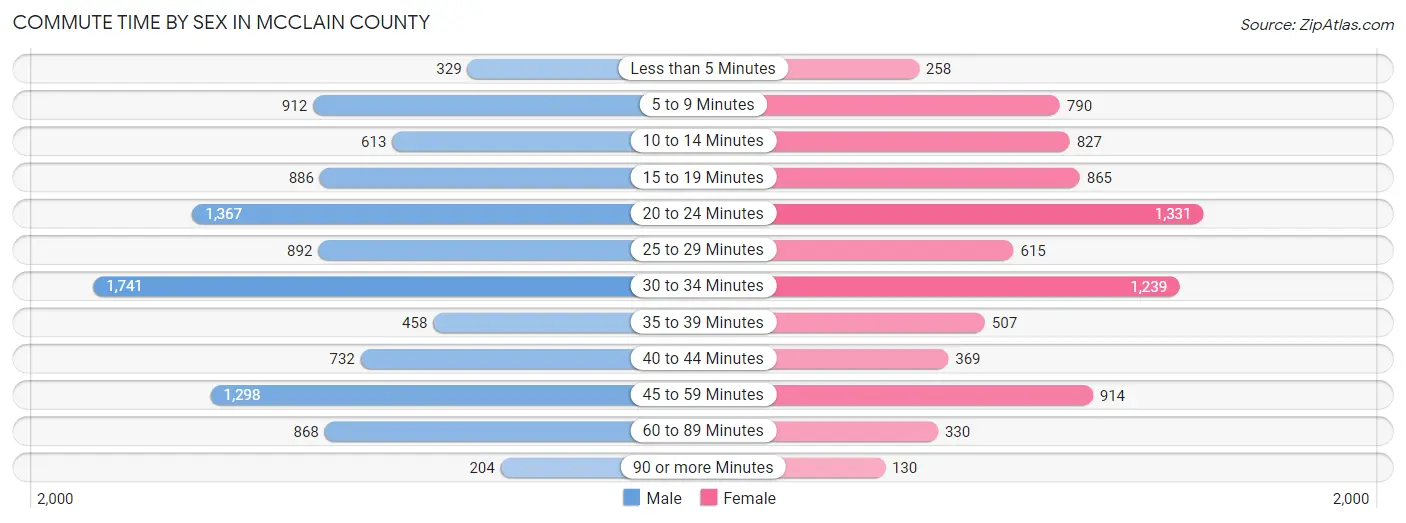
| Commute Time | Male | Female |
| Less than 5 Minutes | 329 (3.2%) | 258 (3.2%) |
| 5 to 9 Minutes | 912 (8.8%) | 790 (9.7%) |
| 10 to 14 Minutes | 613 (5.9%) | 827 (10.1%) |
| 15 to 19 Minutes | 886 (8.6%) | 865 (10.6%) |
| 20 to 24 Minutes | 1,367 (13.3%) | 1,331 (16.3%) |
| 25 to 29 Minutes | 892 (8.7%) | 615 (7.5%) |
| 30 to 34 Minutes | 1,741 (16.9%) | 1,239 (15.2%) |
| 35 to 39 Minutes | 458 (4.4%) | 507 (6.2%) |
| 40 to 44 Minutes | 732 (7.1%) | 369 (4.5%) |
| 45 to 59 Minutes | 1,298 (12.6%) | 914 (11.2%) |
| 60 to 89 Minutes | 868 (8.4%) | 330 (4.0%) |
| 90 or more Minutes | 204 (2.0%) | 130 (1.6%) |
Time of Departure to Work by Sex in McClain County
The most frequent times of departure to work in McClain County are 6:00 AM to 6:29 AM (1,781, 17.3%) for males and 7:00 AM to 7:29 AM (1,840, 22.5%) for females.
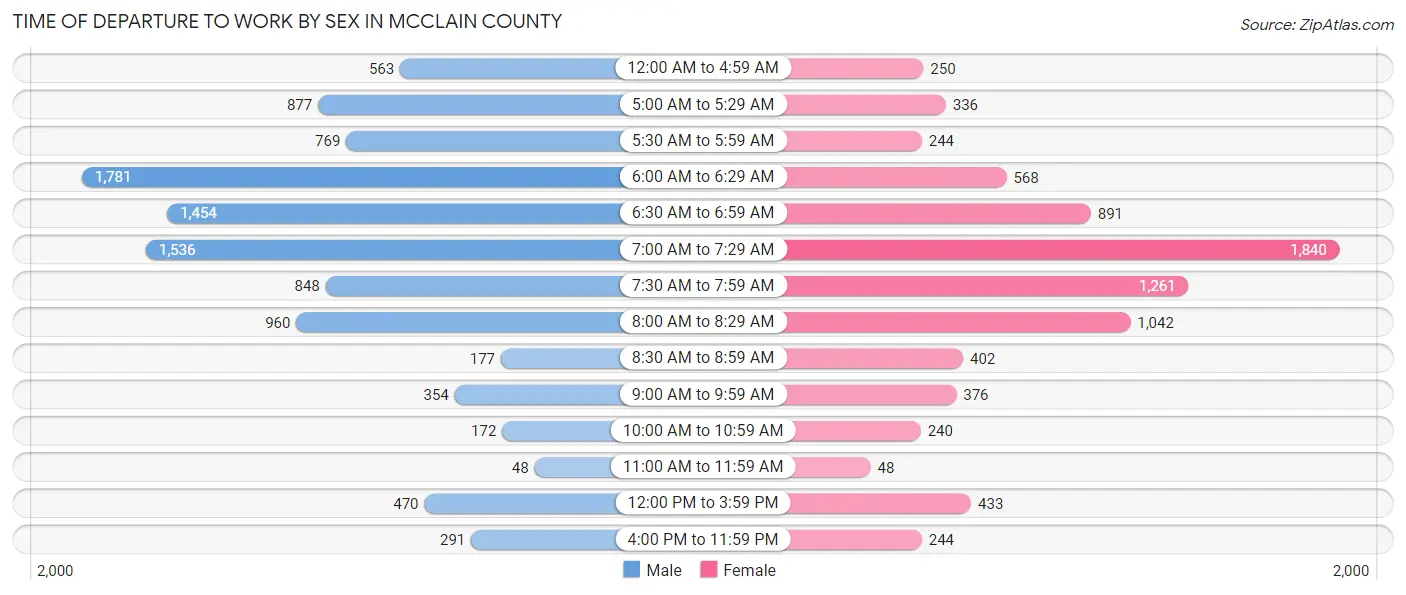
| Time of Departure | Male | Female |
| 12:00 AM to 4:59 AM | 563 (5.5%) | 250 (3.1%) |
| 5:00 AM to 5:29 AM | 877 (8.5%) | 336 (4.1%) |
| 5:30 AM to 5:59 AM | 769 (7.5%) | 244 (3.0%) |
| 6:00 AM to 6:29 AM | 1,781 (17.3%) | 568 (7.0%) |
| 6:30 AM to 6:59 AM | 1,454 (14.1%) | 891 (10.9%) |
| 7:00 AM to 7:29 AM | 1,536 (14.9%) | 1,840 (22.5%) |
| 7:30 AM to 7:59 AM | 848 (8.2%) | 1,261 (15.4%) |
| 8:00 AM to 8:29 AM | 960 (9.3%) | 1,042 (12.8%) |
| 8:30 AM to 8:59 AM | 177 (1.7%) | 402 (4.9%) |
| 9:00 AM to 9:59 AM | 354 (3.4%) | 376 (4.6%) |
| 10:00 AM to 10:59 AM | 172 (1.7%) | 240 (2.9%) |
| 11:00 AM to 11:59 AM | 48 (0.5%) | 48 (0.6%) |
| 12:00 PM to 3:59 PM | 470 (4.6%) | 433 (5.3%) |
| 4:00 PM to 11:59 PM | 291 (2.8%) | 244 (3.0%) |
| Total | 10,300 (100.0%) | 8,175 (100.0%) |
Housing Occupancy in McClain County
Occupancy by Ownership in McClain County
Of the total 15,447 dwellings in McClain County, owner-occupied units account for 12,261 (79.4%), while renter-occupied units make up 3,186 (20.6%).
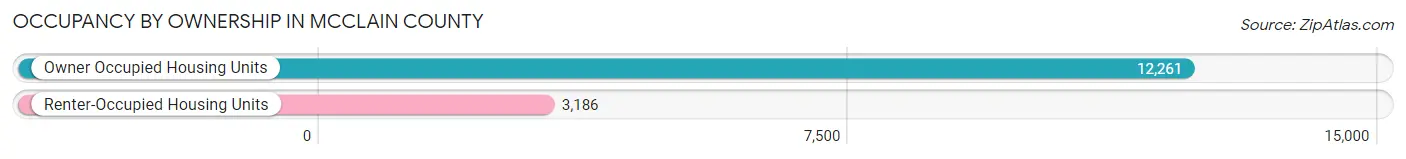
| Occupancy | # Housing Units | % Housing Units |
| Owner Occupied Housing Units | 12,261 | 79.4% |
| Renter-Occupied Housing Units | 3,186 | 20.6% |
| Total Occupied Housing Units | 15,447 | 100.0% |
Occupancy by Household Size in McClain County
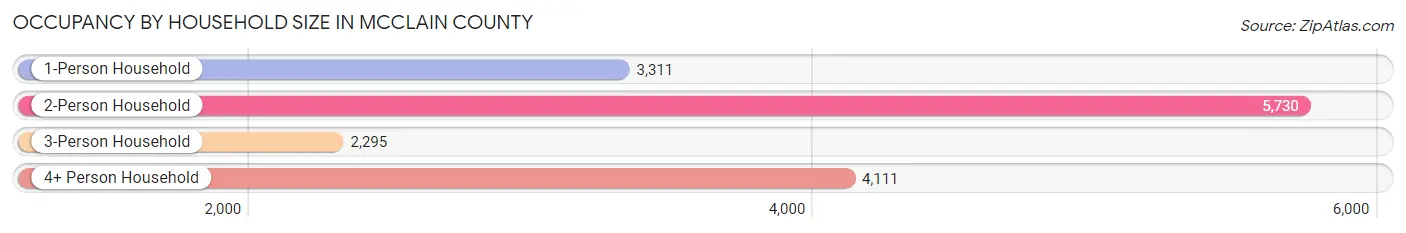
| Household Size | # Housing Units | % Housing Units |
| 1-Person Household | 3,311 | 21.4% |
| 2-Person Household | 5,730 | 37.1% |
| 3-Person Household | 2,295 | 14.9% |
| 4+ Person Household | 4,111 | 26.6% |
| Total Housing Units | 15,447 | 100.0% |
Occupancy by Ownership by Household Size in McClain County
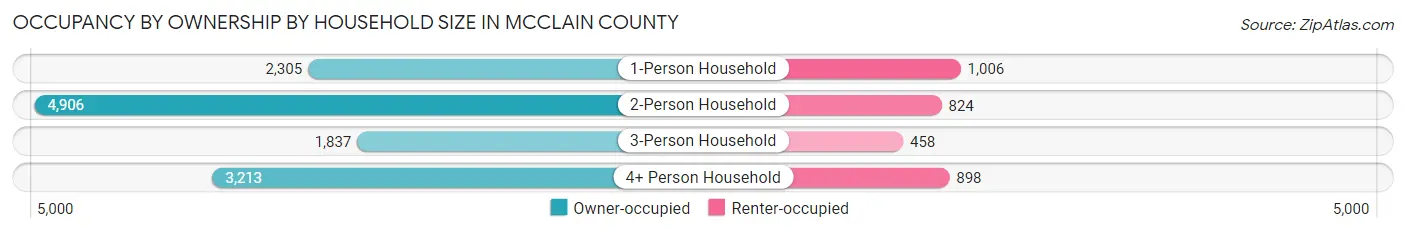
| Household Size | Owner-occupied | Renter-occupied |
| 1-Person Household | 2,305 (69.6%) | 1,006 (30.4%) |
| 2-Person Household | 4,906 (85.6%) | 824 (14.4%) |
| 3-Person Household | 1,837 (80.0%) | 458 (20.0%) |
| 4+ Person Household | 3,213 (78.2%) | 898 (21.8%) |
| Total Housing Units | 12,261 (79.4%) | 3,186 (20.6%) |
Occupancy by Educational Attainment in McClain County
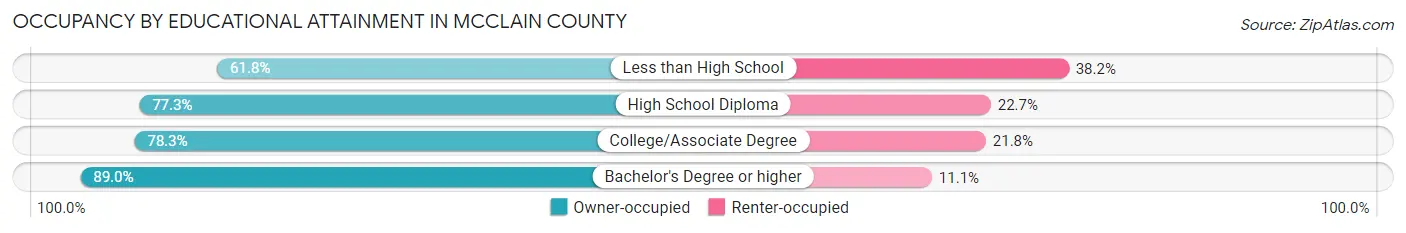
| Household Size | Owner-occupied | Renter-occupied |
| Less than High School | 1,028 (61.8%) | 635 (38.2%) |
| High School Diploma | 3,403 (77.3%) | 1,001 (22.7%) |
| College/Associate Degree | 3,756 (78.2%) | 1,044 (21.7%) |
| Bachelor's Degree or higher | 4,074 (88.9%) | 506 (11.1%) |
Occupancy by Age of Householder in McClain County
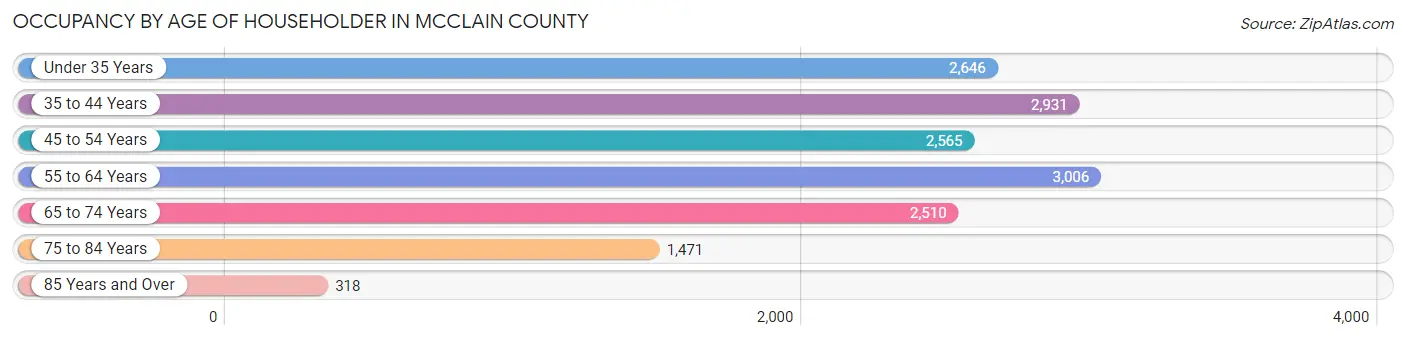
| Age Bracket | # Households | % Households |
| Under 35 Years | 2,646 | 17.1% |
| 35 to 44 Years | 2,931 | 19.0% |
| 45 to 54 Years | 2,565 | 16.6% |
| 55 to 64 Years | 3,006 | 19.5% |
| 65 to 74 Years | 2,510 | 16.3% |
| 75 to 84 Years | 1,471 | 9.5% |
| 85 Years and Over | 318 | 2.1% |
| Total | 15,447 | 100.0% |
Housing Finances in McClain County
Median Income by Occupancy in McClain County
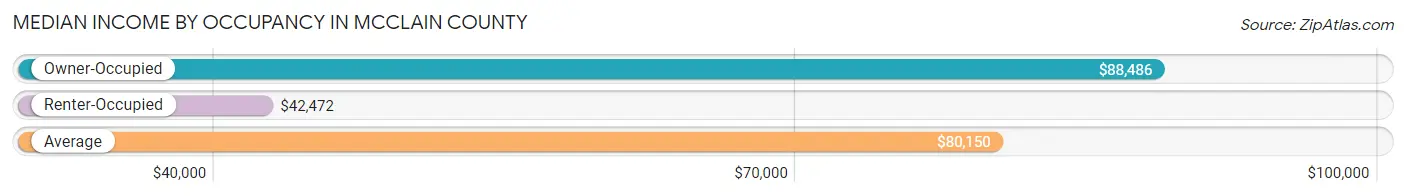
| Occupancy Type | # Households | Median Income |
| Owner-Occupied | 12,261 (79.4%) | $88,486 |
| Renter-Occupied | 3,186 (20.6%) | $42,472 |
| Average | 15,447 (100.0%) | $80,150 |
Occupancy by Householder Income Bracket in McClain County
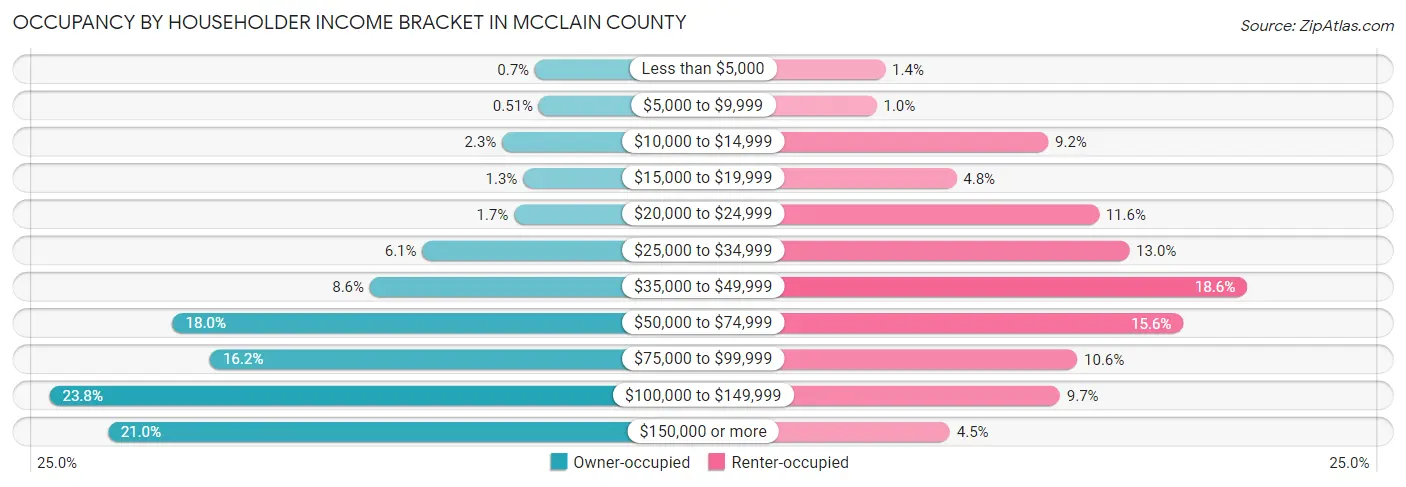
| Income Bracket | Owner-occupied | Renter-occupied |
| Less than $5,000 | 86 (0.7%) | 45 (1.4%) |
| $5,000 to $9,999 | 63 (0.5%) | 32 (1.0%) |
| $10,000 to $14,999 | 277 (2.3%) | 292 (9.2%) |
| $15,000 to $19,999 | 154 (1.3%) | 153 (4.8%) |
| $20,000 to $24,999 | 207 (1.7%) | 369 (11.6%) |
| $25,000 to $34,999 | 743 (6.1%) | 415 (13.0%) |
| $35,000 to $49,999 | 1,049 (8.6%) | 594 (18.6%) |
| $50,000 to $74,999 | 2,201 (17.9%) | 497 (15.6%) |
| $75,000 to $99,999 | 1,982 (16.2%) | 336 (10.5%) |
| $100,000 to $149,999 | 2,919 (23.8%) | 310 (9.7%) |
| $150,000 or more | 2,580 (21.0%) | 143 (4.5%) |
| Total | 12,261 (100.0%) | 3,186 (100.0%) |
Monthly Housing Cost Tiers in McClain County
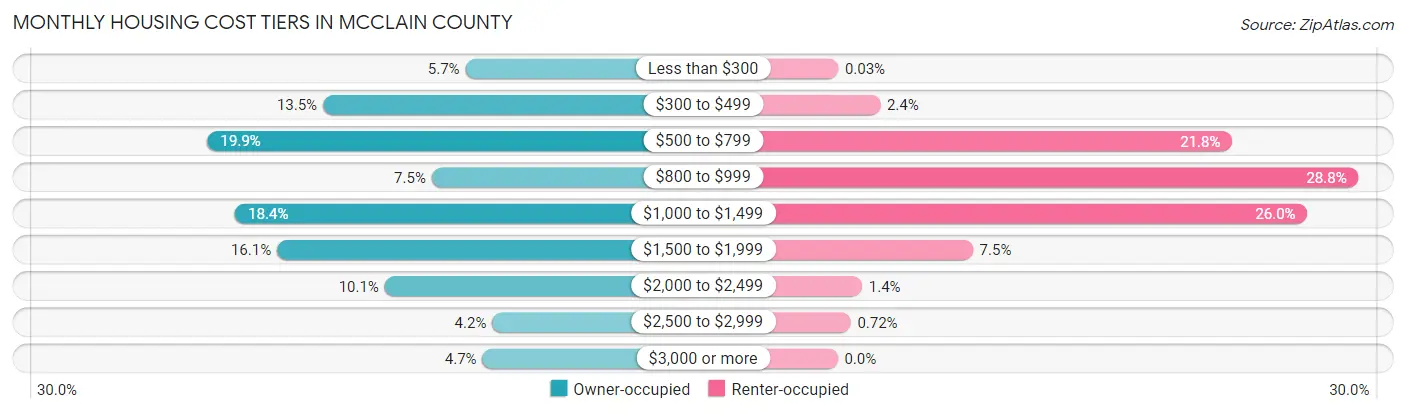
| Monthly Cost | Owner-occupied | Renter-occupied |
| Less than $300 | 693 (5.7%) | 1 (0.0%) |
| $300 to $499 | 1,658 (13.5%) | 75 (2.4%) |
| $500 to $799 | 2,440 (19.9%) | 695 (21.8%) |
| $800 to $999 | 921 (7.5%) | 917 (28.8%) |
| $1,000 to $1,499 | 2,252 (18.4%) | 827 (26.0%) |
| $1,500 to $1,999 | 1,969 (16.1%) | 238 (7.5%) |
| $2,000 to $2,499 | 1,240 (10.1%) | 43 (1.3%) |
| $2,500 to $2,999 | 511 (4.2%) | 23 (0.7%) |
| $3,000 or more | 577 (4.7%) | 0 (0.0%) |
| Total | 12,261 (100.0%) | 3,186 (100.0%) |
Physical Housing Characteristics in McClain County
Housing Structures in McClain County
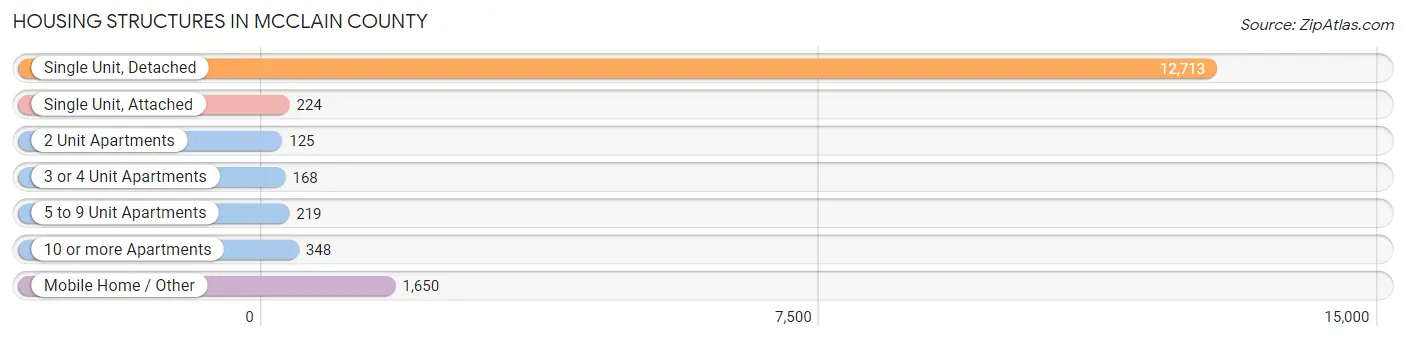
| Structure Type | # Housing Units | % Housing Units |
| Single Unit, Detached | 12,713 | 82.3% |
| Single Unit, Attached | 224 | 1.5% |
| 2 Unit Apartments | 125 | 0.8% |
| 3 or 4 Unit Apartments | 168 | 1.1% |
| 5 to 9 Unit Apartments | 219 | 1.4% |
| 10 or more Apartments | 348 | 2.2% |
| Mobile Home / Other | 1,650 | 10.7% |
| Total | 15,447 | 100.0% |
Housing Structures by Occupancy in McClain County
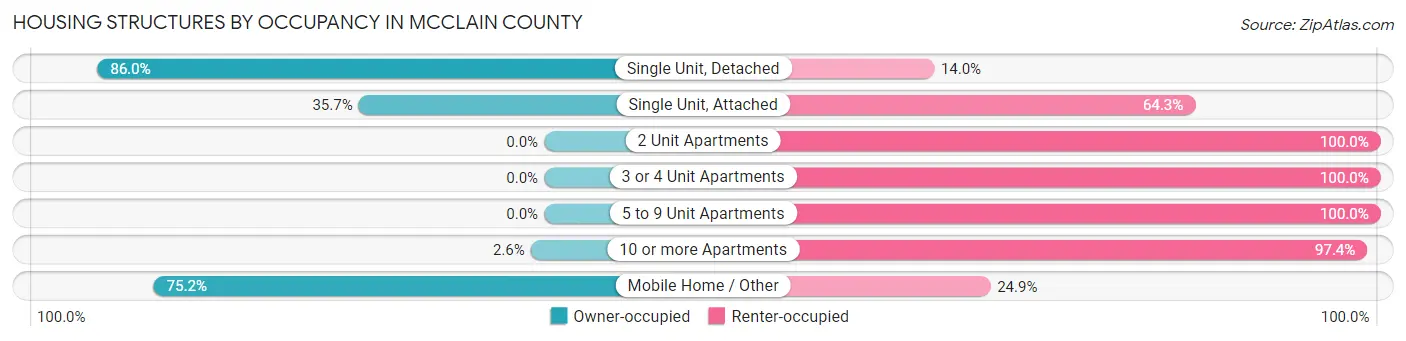
| Structure Type | Owner-occupied | Renter-occupied |
| Single Unit, Detached | 10,932 (86.0%) | 1,781 (14.0%) |
| Single Unit, Attached | 80 (35.7%) | 144 (64.3%) |
| 2 Unit Apartments | 0 (0.0%) | 125 (100.0%) |
| 3 or 4 Unit Apartments | 0 (0.0%) | 168 (100.0%) |
| 5 to 9 Unit Apartments | 0 (0.0%) | 219 (100.0%) |
| 10 or more Apartments | 9 (2.6%) | 339 (97.4%) |
| Mobile Home / Other | 1,240 (75.1%) | 410 (24.8%) |
| Total | 12,261 (79.4%) | 3,186 (20.6%) |
Housing Structures by Number of Rooms in McClain County
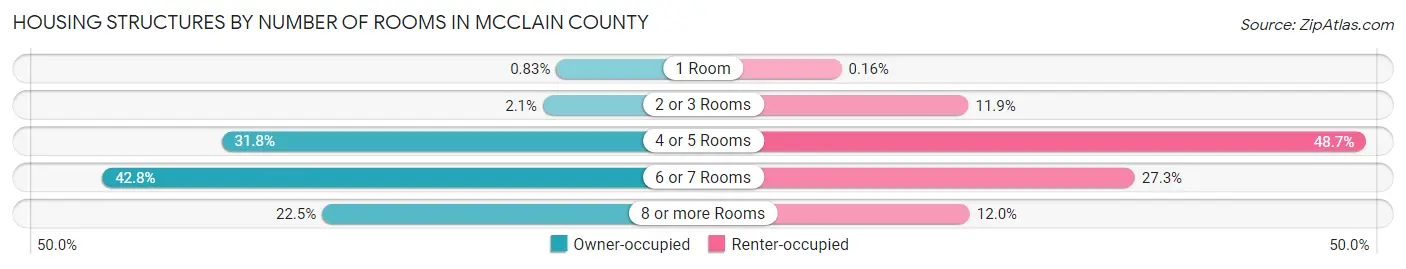
| Number of Rooms | Owner-occupied | Renter-occupied |
| 1 Room | 102 (0.8%) | 5 (0.2%) |
| 2 or 3 Rooms | 254 (2.1%) | 379 (11.9%) |
| 4 or 5 Rooms | 3,898 (31.8%) | 1,550 (48.6%) |
| 6 or 7 Rooms | 5,250 (42.8%) | 869 (27.3%) |
| 8 or more Rooms | 2,757 (22.5%) | 383 (12.0%) |
| Total | 12,261 (100.0%) | 3,186 (100.0%) |
Housing Structure by Heating Type in McClain County
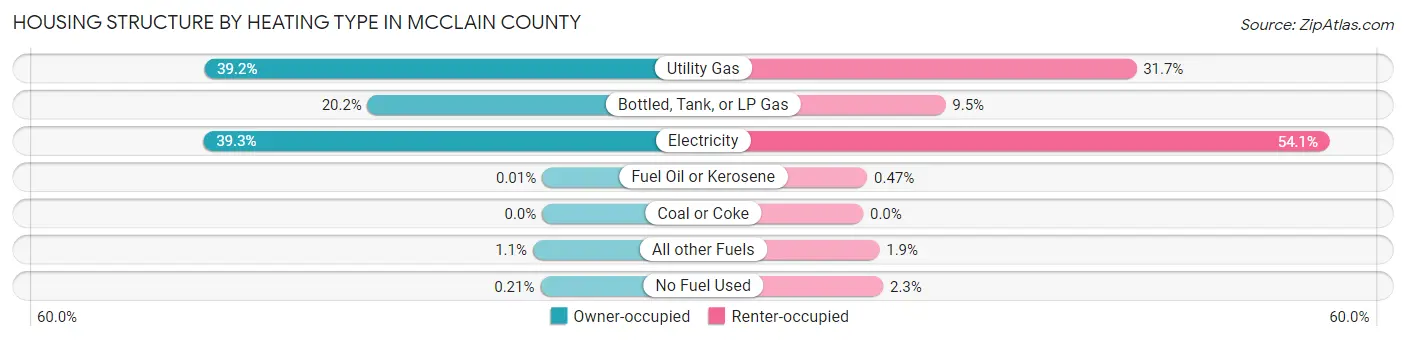
| Heating Type | Owner-occupied | Renter-occupied |
| Utility Gas | 4,806 (39.2%) | 1,009 (31.7%) |
| Bottled, Tank, or LP Gas | 2,479 (20.2%) | 304 (9.5%) |
| Electricity | 4,817 (39.3%) | 1,724 (54.1%) |
| Fuel Oil or Kerosene | 1 (0.0%) | 15 (0.5%) |
| Coal or Coke | 0 (0.0%) | 0 (0.0%) |
| All other Fuels | 132 (1.1%) | 60 (1.9%) |
| No Fuel Used | 26 (0.2%) | 74 (2.3%) |
| Total | 12,261 (100.0%) | 3,186 (100.0%) |
Household Vehicle Usage in McClain County
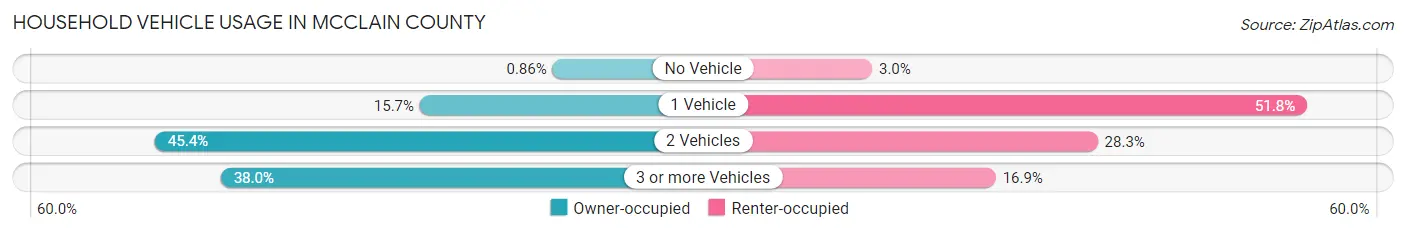
| Vehicles per Household | Owner-occupied | Renter-occupied |
| No Vehicle | 105 (0.9%) | 97 (3.0%) |
| 1 Vehicle | 1,927 (15.7%) | 1,649 (51.8%) |
| 2 Vehicles | 5,566 (45.4%) | 902 (28.3%) |
| 3 or more Vehicles | 4,663 (38.0%) | 538 (16.9%) |
| Total | 12,261 (100.0%) | 3,186 (100.0%) |
Real Estate & Mortgages in McClain County
Real Estate and Mortgage Overview in McClain County
| Characteristic | Without Mortgage | With Mortgage |
| Housing Units | 5,113 | 7,148 |
| Median Property Value | $188,600 | $231,600 |
| Median Household Income | $67,809 | $1,780 |
| Monthly Housing Costs | $533 | $574 |
| Real Estate Taxes | $1,197 | $344 |
Property Value by Mortgage Status in McClain County
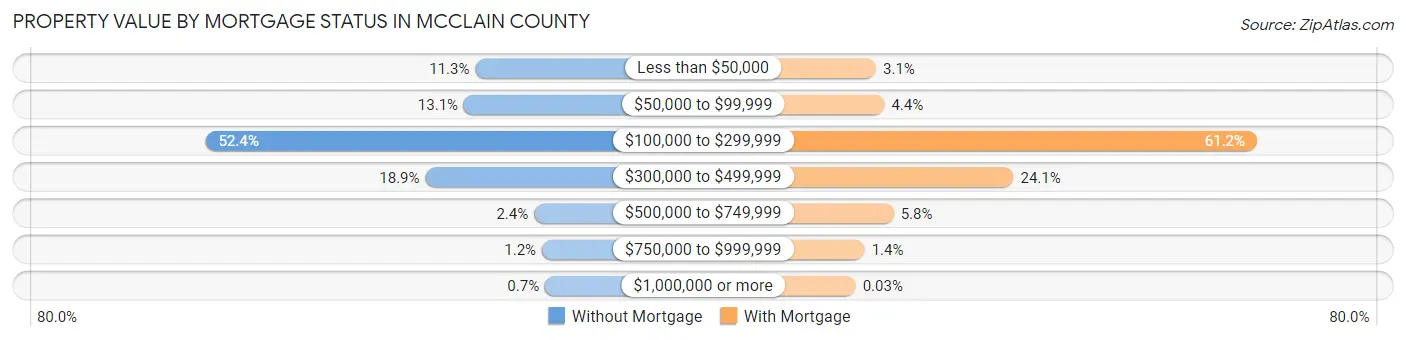
| Property Value | Without Mortgage | With Mortgage |
| Less than $50,000 | 579 (11.3%) | 224 (3.1%) |
| $50,000 to $99,999 | 668 (13.1%) | 315 (4.4%) |
| $100,000 to $299,999 | 2,681 (52.4%) | 4,371 (61.2%) |
| $300,000 to $499,999 | 968 (18.9%) | 1,721 (24.1%) |
| $500,000 to $749,999 | 121 (2.4%) | 415 (5.8%) |
| $750,000 to $999,999 | 60 (1.2%) | 100 (1.4%) |
| $1,000,000 or more | 36 (0.7%) | 2 (0.0%) |
| Total | 5,113 (100.0%) | 7,148 (100.0%) |
Household Income by Mortgage Status in McClain County
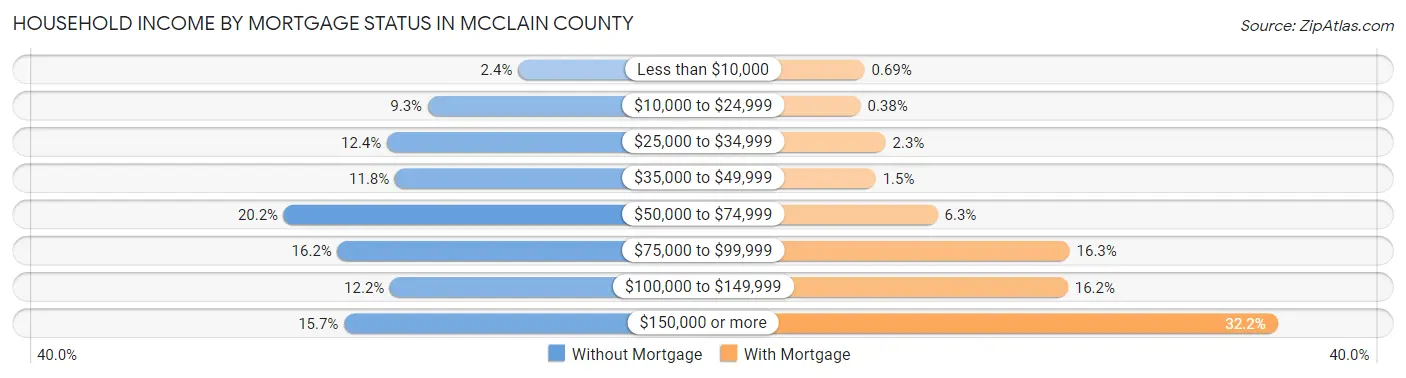
| Household Income | Without Mortgage | With Mortgage |
| Less than $10,000 | 122 (2.4%) | 49 (0.7%) |
| $10,000 to $24,999 | 474 (9.3%) | 27 (0.4%) |
| $25,000 to $34,999 | 633 (12.4%) | 164 (2.3%) |
| $35,000 to $49,999 | 602 (11.8%) | 110 (1.5%) |
| $50,000 to $74,999 | 1,035 (20.2%) | 447 (6.2%) |
| $75,000 to $99,999 | 826 (16.2%) | 1,166 (16.3%) |
| $100,000 to $149,999 | 621 (12.1%) | 1,156 (16.2%) |
| $150,000 or more | 800 (15.7%) | 2,298 (32.2%) |
| Total | 5,113 (100.0%) | 7,148 (100.0%) |
Property Value to Household Income Ratio in McClain County
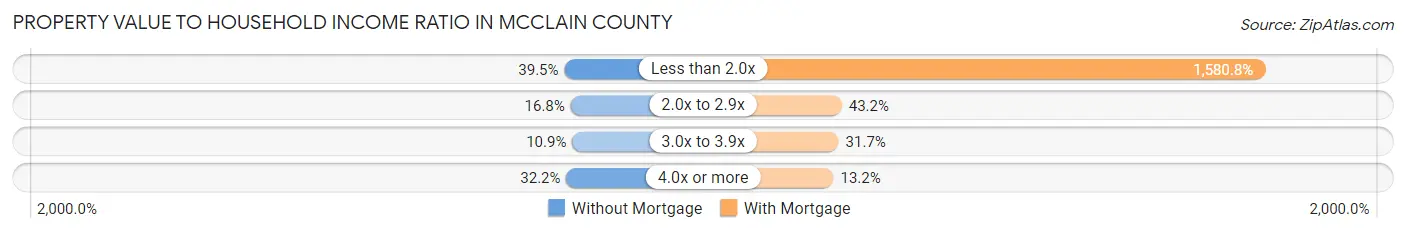
| Value-to-Income Ratio | Without Mortgage | With Mortgage |
| Less than 2.0x | 2,019 (39.5%) | 112,992 (1,580.7%) |
| 2.0x to 2.9x | 857 (16.8%) | 3,086 (43.2%) |
| 3.0x to 3.9x | 555 (10.8%) | 2,267 (31.7%) |
| 4.0x or more | 1,645 (32.2%) | 943 (13.2%) |
| Total | 5,113 (100.0%) | 7,148 (100.0%) |
Real Estate Taxes by Mortgage Status in McClain County
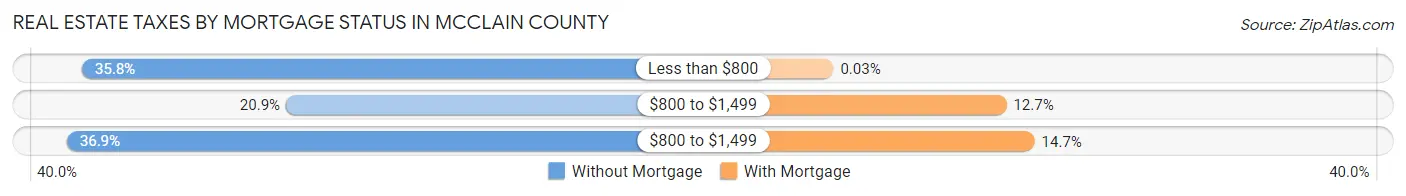
| Property Taxes | Without Mortgage | With Mortgage |
| Less than $800 | 1,831 (35.8%) | 2 (0.0%) |
| $800 to $1,499 | 1,069 (20.9%) | 906 (12.7%) |
| $800 to $1,499 | 1,887 (36.9%) | 1,053 (14.7%) |
| Total | 5,113 (100.0%) | 7,148 (100.0%) |
Health & Disability in McClain County
Health Insurance Coverage by Age in McClain County
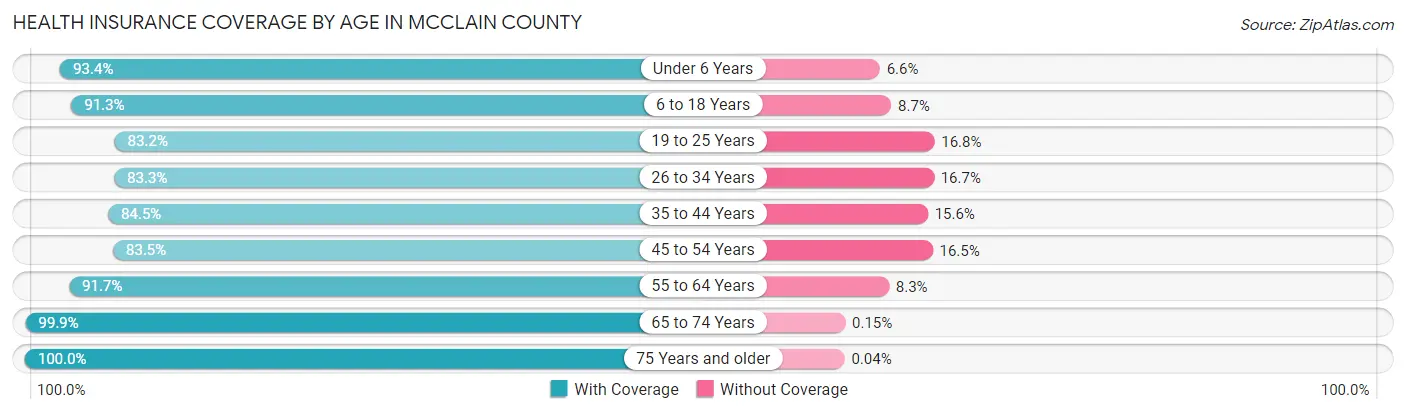
| Age Bracket | With Coverage | Without Coverage |
| Under 6 Years | 2,603 (93.4%) | 184 (6.6%) |
| 6 to 18 Years | 7,789 (91.3%) | 744 (8.7%) |
| 19 to 25 Years | 2,475 (83.2%) | 499 (16.8%) |
| 26 to 34 Years | 3,771 (83.3%) | 755 (16.7%) |
| 35 to 44 Years | 5,095 (84.5%) | 938 (15.5%) |
| 45 to 54 Years | 4,405 (83.5%) | 868 (16.5%) |
| 55 to 64 Years | 4,968 (91.7%) | 450 (8.3%) |
| 65 to 74 Years | 3,902 (99.9%) | 6 (0.2%) |
| 75 Years and older | 2,525 (100.0%) | 1 (0.0%) |
| Total | 37,533 (89.4%) | 4,445 (10.6%) |
Health Insurance Coverage by Citizenship Status in McClain County
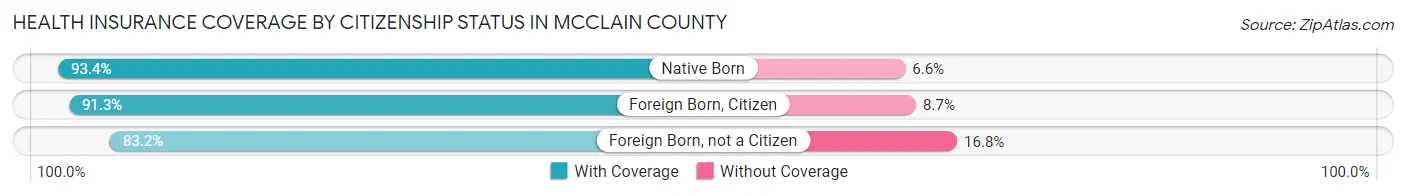
| Citizenship Status | With Coverage | Without Coverage |
| Native Born | 2,603 (93.4%) | 184 (6.6%) |
| Foreign Born, Citizen | 7,789 (91.3%) | 744 (8.7%) |
| Foreign Born, not a Citizen | 2,475 (83.2%) | 499 (16.8%) |
Health Insurance Coverage by Household Income in McClain County
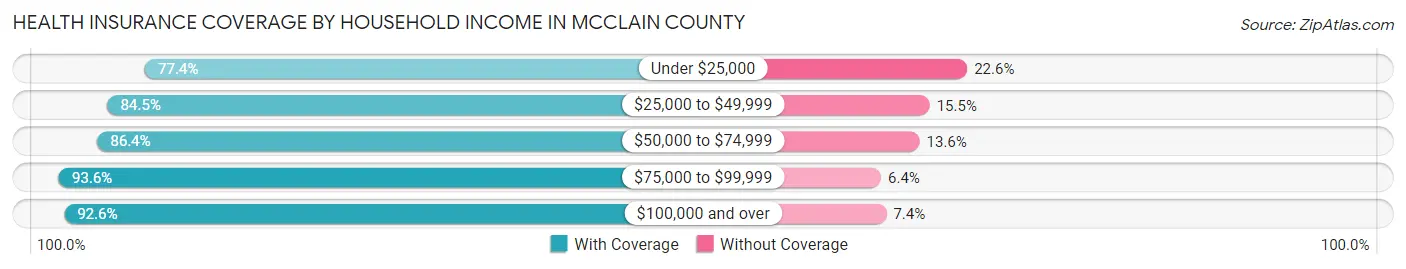
| Household Income | With Coverage | Without Coverage |
| Under $25,000 | 2,418 (77.4%) | 705 (22.6%) |
| $25,000 to $49,999 | 5,433 (84.5%) | 1,000 (15.5%) |
| $50,000 to $74,999 | 5,580 (86.4%) | 881 (13.6%) |
| $75,000 to $99,999 | 6,472 (93.6%) | 445 (6.4%) |
| $100,000 and over | 17,570 (92.6%) | 1,410 (7.4%) |
Public vs Private Health Insurance Coverage by Age in McClain County
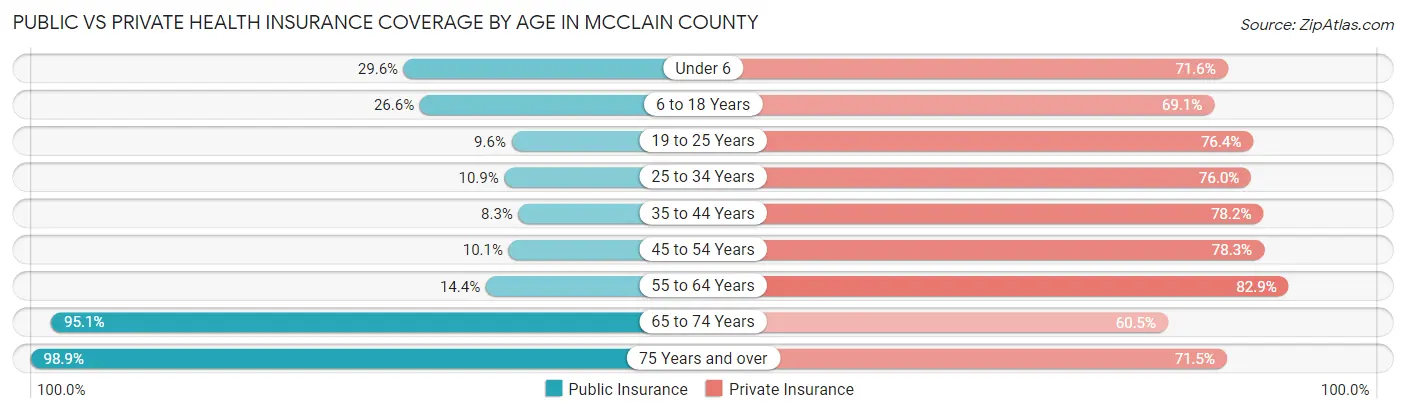
| Age Bracket | Public Insurance | Private Insurance |
| Under 6 | 825 (29.6%) | 1,995 (71.6%) |
| 6 to 18 Years | 2,271 (26.6%) | 5,895 (69.1%) |
| 19 to 25 Years | 285 (9.6%) | 2,271 (76.4%) |
| 25 to 34 Years | 494 (10.9%) | 3,439 (76.0%) |
| 35 to 44 Years | 500 (8.3%) | 4,719 (78.2%) |
| 45 to 54 Years | 534 (10.1%) | 4,131 (78.3%) |
| 55 to 64 Years | 778 (14.4%) | 4,492 (82.9%) |
| 65 to 74 Years | 3,715 (95.1%) | 2,365 (60.5%) |
| 75 Years and over | 2,498 (98.9%) | 1,805 (71.5%) |
| Total | 11,900 (28.3%) | 31,112 (74.1%) |
Disability Status by Sex by Age in McClain County
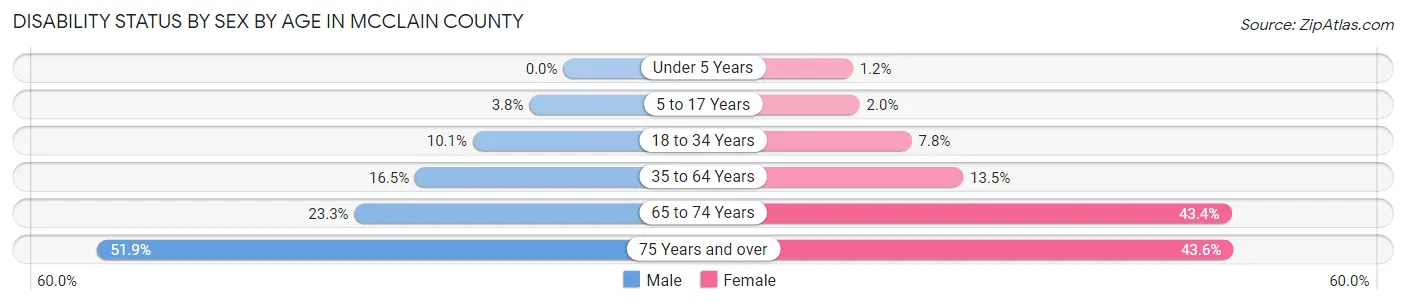
| Age Bracket | Male | Female |
| Under 5 Years | 0 (0.0%) | 14 (1.2%) |
| 5 to 17 Years | 165 (3.8%) | 80 (2.0%) |
| 18 to 34 Years | 406 (10.1%) | 320 (7.8%) |
| 35 to 64 Years | 1,395 (16.5%) | 1,118 (13.5%) |
| 65 to 74 Years | 448 (23.3%) | 860 (43.4%) |
| 75 Years and over | 594 (51.9%) | 602 (43.6%) |
Disability Class by Sex by Age in McClain County
Disability Class: Hearing Difficulty
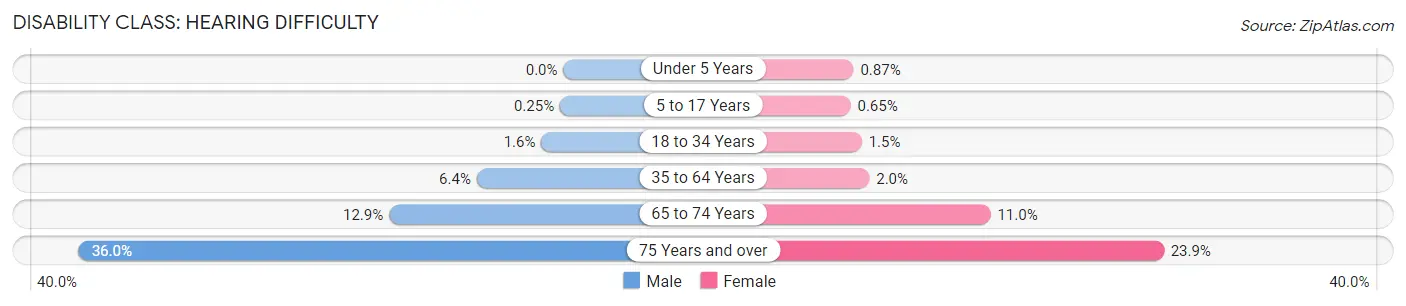
| Age Bracket | Male | Female |
| Under 5 Years | 0 (0.0%) | 10 (0.9%) |
| 5 to 17 Years | 11 (0.3%) | 26 (0.6%) |
| 18 to 34 Years | 66 (1.6%) | 61 (1.5%) |
| 35 to 64 Years | 543 (6.4%) | 169 (2.0%) |
| 65 to 74 Years | 249 (12.9%) | 219 (11.0%) |
| 75 Years and over | 412 (36.0%) | 330 (23.9%) |
Disability Class: Vision Difficulty
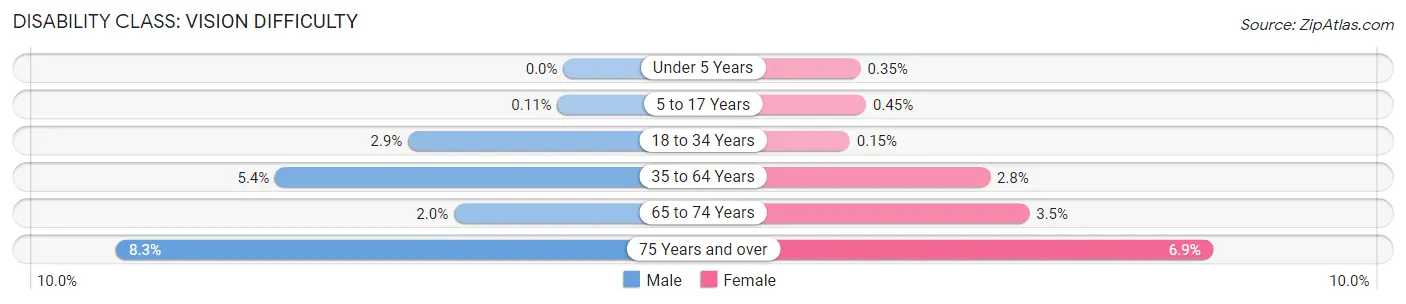
| Age Bracket | Male | Female |
| Under 5 Years | 0 (0.0%) | 4 (0.4%) |
| 5 to 17 Years | 5 (0.1%) | 18 (0.4%) |
| 18 to 34 Years | 116 (2.9%) | 6 (0.2%) |
| 35 to 64 Years | 452 (5.3%) | 228 (2.8%) |
| 65 to 74 Years | 39 (2.0%) | 69 (3.5%) |
| 75 Years and over | 95 (8.3%) | 95 (6.9%) |
Disability Class: Cognitive Difficulty
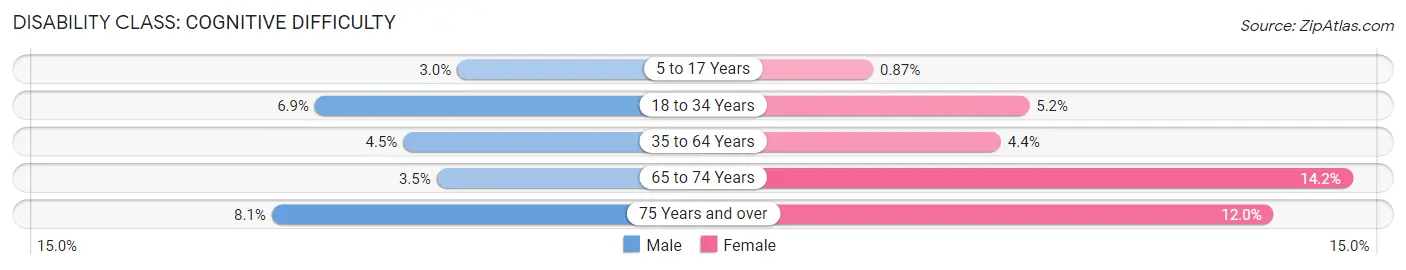
| Age Bracket | Male | Female |
| 5 to 17 Years | 129 (3.0%) | 35 (0.9%) |
| 18 to 34 Years | 279 (6.9%) | 215 (5.2%) |
| 35 to 64 Years | 377 (4.5%) | 367 (4.4%) |
| 65 to 74 Years | 68 (3.5%) | 282 (14.2%) |
| 75 Years and over | 93 (8.1%) | 166 (12.0%) |
Disability Class: Ambulatory Difficulty
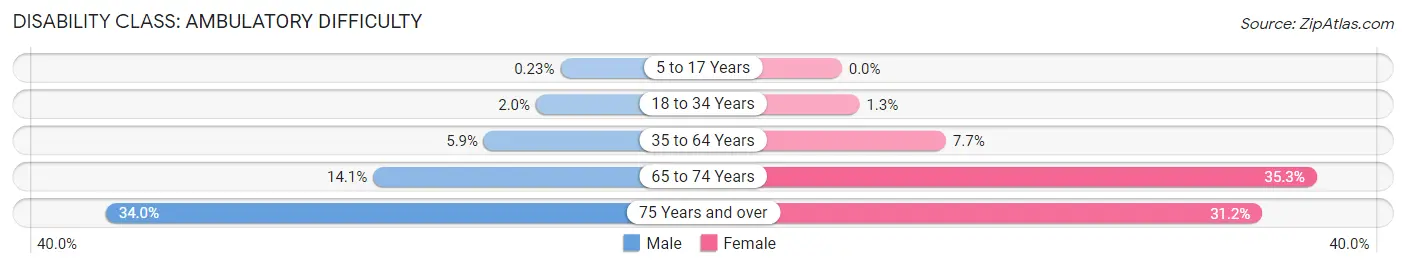
| Age Bracket | Male | Female |
| 5 to 17 Years | 10 (0.2%) | 0 (0.0%) |
| 18 to 34 Years | 82 (2.0%) | 54 (1.3%) |
| 35 to 64 Years | 498 (5.9%) | 640 (7.7%) |
| 65 to 74 Years | 272 (14.1%) | 699 (35.2%) |
| 75 Years and over | 389 (34.0%) | 431 (31.2%) |
Disability Class: Self-Care Difficulty
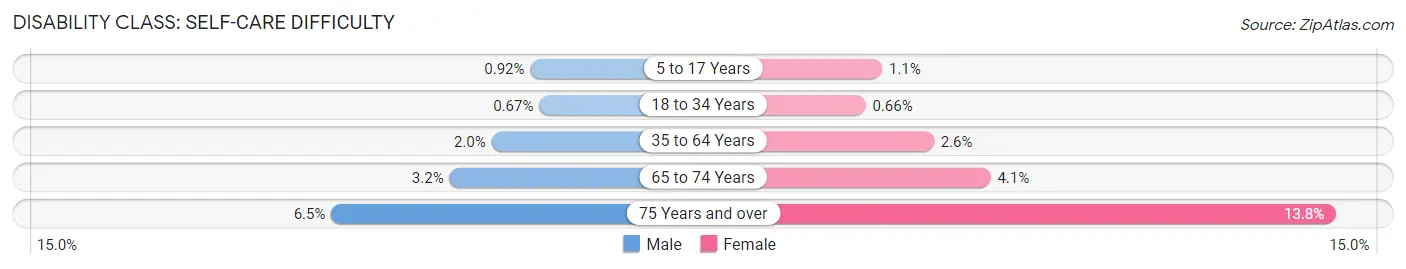
| Age Bracket | Male | Female |
| 5 to 17 Years | 40 (0.9%) | 45 (1.1%) |
| 18 to 34 Years | 27 (0.7%) | 27 (0.7%) |
| 35 to 64 Years | 169 (2.0%) | 212 (2.6%) |
| 65 to 74 Years | 61 (3.2%) | 82 (4.1%) |
| 75 Years and over | 74 (6.5%) | 190 (13.8%) |
Technology Access in McClain County
Computing Device Access in McClain County
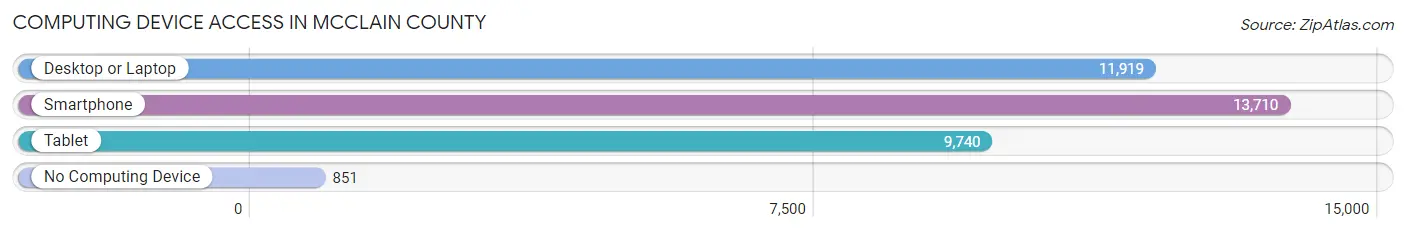
| Device Type | # Households | % Households |
| Desktop or Laptop | 11,919 | 77.2% |
| Smartphone | 13,710 | 88.8% |
| Tablet | 9,740 | 63.0% |
| No Computing Device | 851 | 5.5% |
| Total | 15,447 | 100.0% |
Internet Access in McClain County
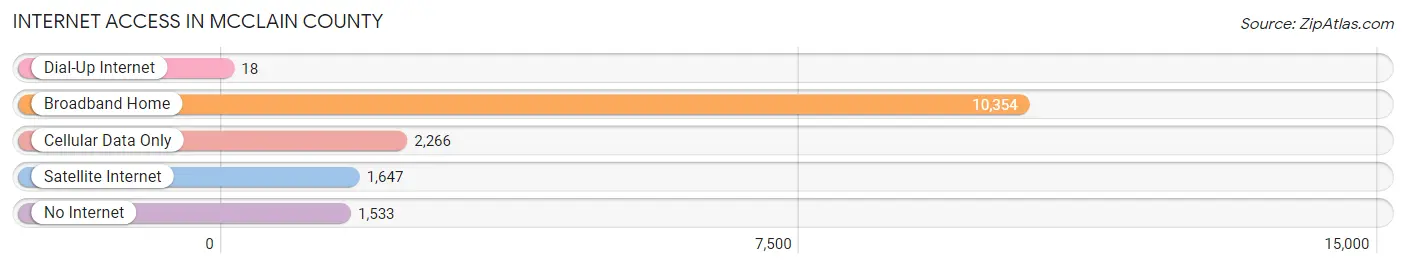
| Internet Type | # Households | % Households |
| Dial-Up Internet | 18 | 0.1% |
| Broadband Home | 10,354 | 67.0% |
| Cellular Data Only | 2,266 | 14.7% |
| Satellite Internet | 1,647 | 10.7% |
| No Internet | 1,533 | 9.9% |
| Total | 15,447 | 100.0% |
McClain County Summary
Mcclain County is located in the central part of Oklahoma, and is bordered by Cleveland, Garvin, Grady, Pontotoc, and Pottawatomie counties. The county seat is Purcell, and the county was named after Charles M. McClain, a former state legislator. The county has a total area of 590 square miles, and a population of 34,506 as of the 2010 census.
Geography
Mcclain County is located in the central part of Oklahoma, and is bordered by Cleveland, Garvin, Grady, Pontotoc, and Pottawatomie counties. The county is mostly flat, with some rolling hills in the northern and western parts. The Washita River runs through the county, and there are several small lakes and ponds scattered throughout. The county is mostly rural, with some small towns and cities, including Purcell, Blanchard, Dibble, and Wayne.
Climate
Mcclain County has a humid subtropical climate, with hot summers and mild winters. The average annual temperature is around 64°F, and the average annual precipitation is around 37 inches.
Demographics
As of the 2010 census, there were 34,506 people, 12,945 households, and 9,072 families living in the county. The population density was 58.5 people per square mile. The racial makeup of the county was 81.2% White, 8.2% African American, 4.2% Native American, 0.5% Asian, 0.1% Pacific Islander, 2.7% from other races, and 2.9% from two or more races. Hispanic or Latino of any race were 6.3% of the population.
Economy
Mcclain County's economy is largely based on agriculture, with the main crops being cotton, corn, wheat, and soybeans. The county also has a strong manufacturing sector, with companies such as Purcell Tire and Rubber Company, Purcell Manufacturing Company, and Purcell Plastics Corporation. The county also has a growing tourism industry, with attractions such as the McClain County Historical Museum, the McClain County Courthouse, and the McClain County Fairgrounds.
Conclusion
Mcclain County is a rural county located in the central part of Oklahoma. The county has a humid subtropical climate, and a population of 34,506 as of the 2010 census. The economy is largely based on agriculture, with some manufacturing and tourism. The county has several attractions, including the McClain County Historical Museum, the McClain County Courthouse, and the McClain County Fairgrounds.
Common Questions
What is the Total Population of McClain County?
Total Population of McClain County is 42,393.
What is the Total Male Population of McClain County?
Total Male Population of McClain County is 21,349.
What is the Total Female Population of McClain County?
Total Female Population of McClain County is 21,044.
What is the Ratio of Males per 100 Females in McClain County?
There are 101.45 Males per 100 Females in McClain County.
What is the Ratio of Females per 100 Males in McClain County?
There are 98.57 Females per 100 Males in McClain County.
What is the Median Population Age in McClain County?
Median Population Age in McClain County is 38.8 Years.
What is the Average Family Size in McClain County
Average Family Size in McClain County is 3.2 People.
What is the Average Household Size in McClain County
Average Household Size in McClain County is 2.7 People.
What is Per Capita Income in McClain County?
Per Capita income in McClain County is $39,921.
What is the Median Family Income in McClain County?
Median Family Income in McClain County is $90,995.
What is the Median Household income in McClain County?
Median Household Income in McClain County is $80,150.
What is Income or Wage Gap in McClain County?
Income or Wage Gap in McClain County is 36.3%.
Women in McClain County earn 63.7 cents for every dollar earned by a man.
What is Family Income Deficit in McClain County?
Family Income Deficit in McClain County is $11,582.
Families that are below poverty line in McClain County earn $11,582 less on average than the poverty threshold level.
What is Inequality or Gini Index in McClain County?
Inequality or Gini Index in McClain County is 0.42.
How Large is the Labor Force in McClain County?
There are 21,241 People in the Labor Forcein in McClain County.
What is the Percentage of People in the Labor Force in McClain County?
64.2% of People are in the Labor Force in McClain County.
What is the Unemployment Rate in McClain County?
Unemployment Rate in McClain County is 4.1%.