Le Flore County, OK
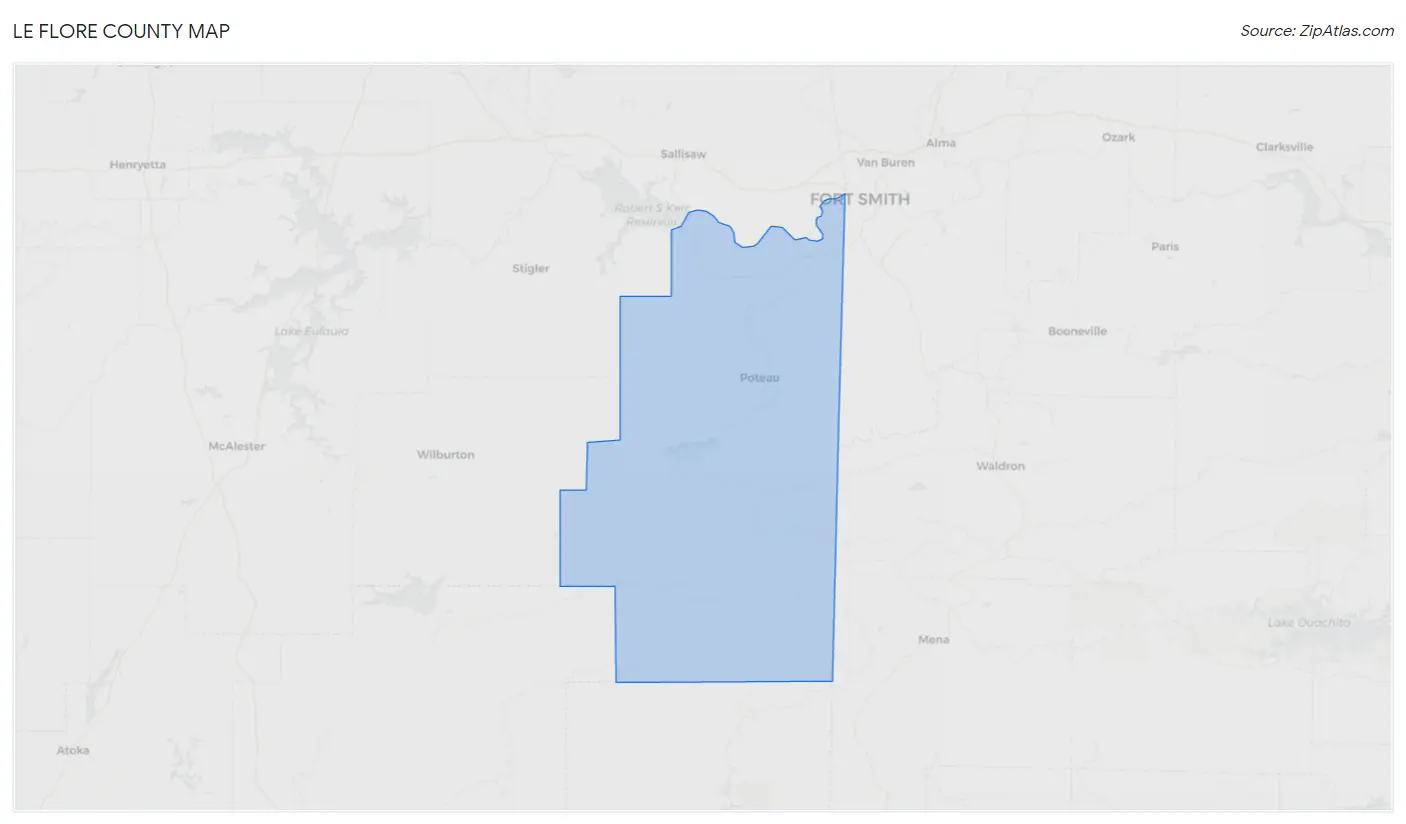
Le Flore County Map
Le Flore County Overview
48,525
TOTAL POPULATION
24,544
MALE POPULATION
23,981
FEMALE POPULATION
102.35
MALES / 100 FEMALES
97.71
FEMALES / 100 MALES
38.8
MEDIAN AGE
3.2
AVG FAMILY SIZE
2.6
AVG HOUSEHOLD SIZE
$23,718
PER CAPITA INCOME
$59,125
AVG FAMILY INCOME
$46,750
AVG HOUSEHOLD INCOME
33.0%
WAGE / INCOME GAP [ % ]
67.0¢/ $1
WAGE / INCOME GAP [ $ ]
$10,515
FAMILY INCOME DEFICIT
0.44
INEQUALITY / GINI INDEX
19,812
LABOR FORCE [ PEOPLE ]
51.7%
PERCENT IN LABOR FORCE
5.2%
UNEMPLOYMENT RATE
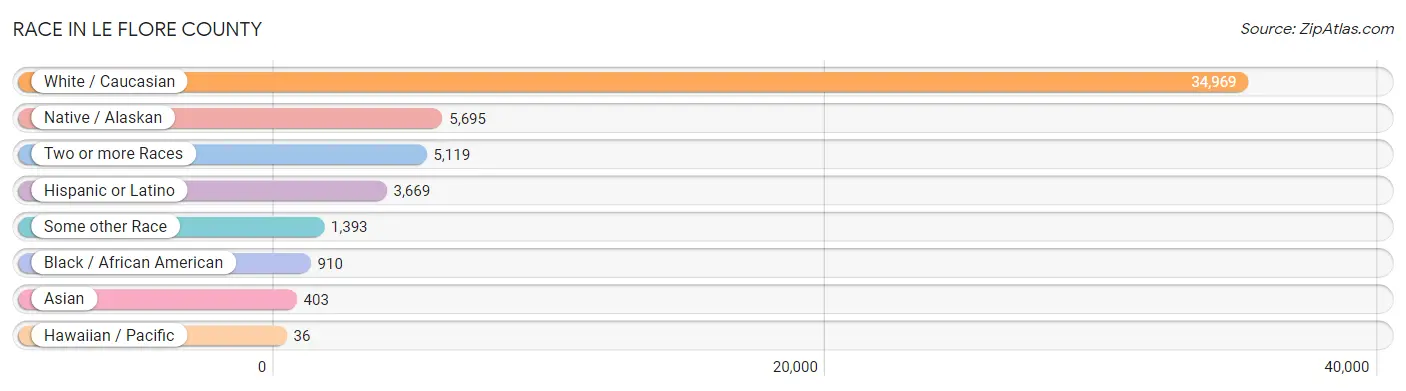
Race in Le Flore County
The most populous races in Le Flore County are White / Caucasian (34,969 | 72.1%), Native / Alaskan (5,695 | 11.7%), and Two or more Races (5,119 | 10.5%).
| Race | # Population | % Population |
| Asian | 403 | 0.8% |
| Black / African American | 910 | 1.9% |
| Hawaiian / Pacific | 36 | 0.1% |
| Hispanic or Latino | 3,669 | 7.6% |
| Native / Alaskan | 5,695 | 11.7% |
| White / Caucasian | 34,969 | 72.1% |
| Two or more Races | 5,119 | 10.5% |
| Some other Race | 1,393 | 2.9% |
| Total | 48,525 | 100.0% |
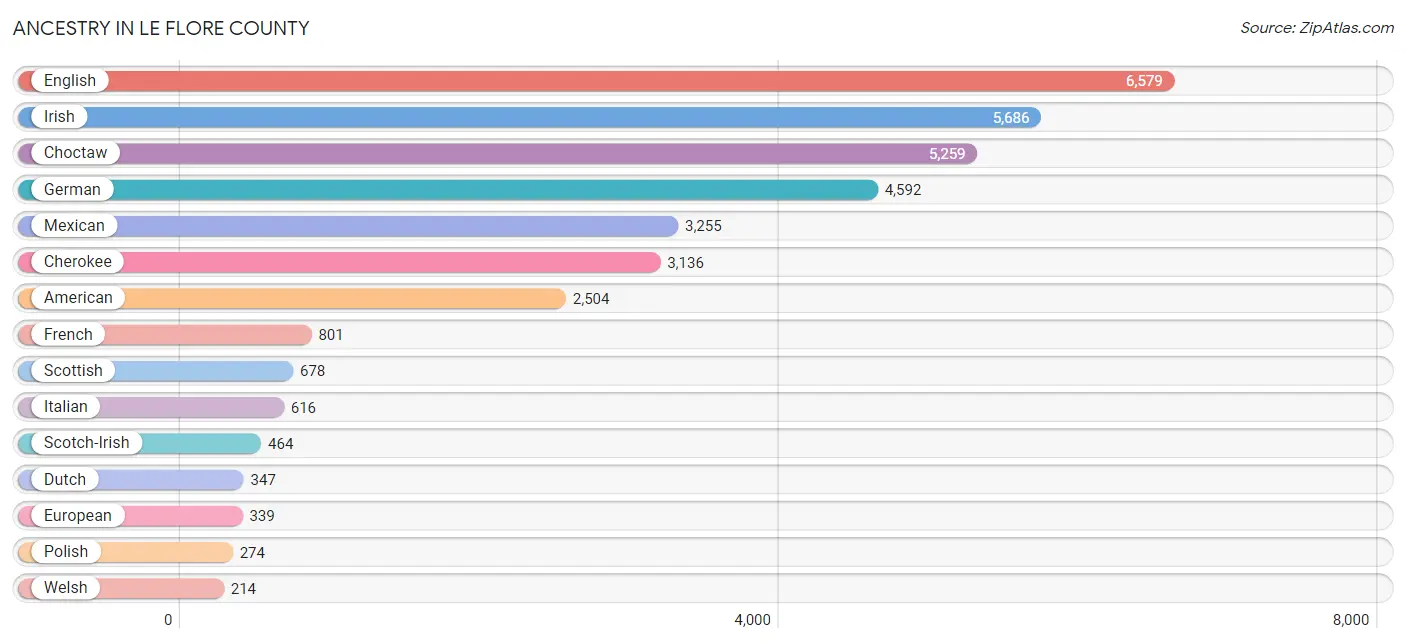
Ancestry in Le Flore County
The most populous ancestries reported in Le Flore County are English (6,579 | 13.6%), Irish (5,686 | 11.7%), Choctaw (5,259 | 10.8%), German (4,592 | 9.5%), and Mexican (3,255 | 6.7%), together accounting for 52.3% of all Le Flore County residents.
| Ancestry | # Population | % Population |
| African | 12 | 0.0% |
| Alaska Native | 9 | 0.0% |
| Aleut | 12 | 0.0% |
| American | 2,504 | 5.2% |
| Apache | 59 | 0.1% |
| Arab | 10 | 0.0% |
| Arapaho | 16 | 0.0% |
| Argentinean | 24 | 0.1% |
| Australian | 8 | 0.0% |
| Austrian | 25 | 0.1% |
| Bangladeshi | 15 | 0.0% |
| Bhutanese | 48 | 0.1% |
| Blackfeet | 23 | 0.1% |
| Brazilian | 2 | 0.0% |
| British | 147 | 0.3% |
| Burmese | 81 | 0.2% |
| Cajun | 6 | 0.0% |
| Canadian | 15 | 0.0% |
| Central American | 47 | 0.1% |
| Cherokee | 3,136 | 6.5% |
| Cheyenne | 4 | 0.0% |
| Chickasaw | 213 | 0.4% |
| Chippewa | 5 | 0.0% |
| Choctaw | 5,259 | 10.8% |
| Colombian | 27 | 0.1% |
| Comanche | 5 | 0.0% |
| Creek | 121 | 0.3% |
| Cuban | 41 | 0.1% |
| Czech | 22 | 0.1% |
| Czechoslovakian | 25 | 0.1% |
| Danish | 22 | 0.1% |
| Delaware | 2 | 0.0% |
| Dutch | 347 | 0.7% |
| Dutch West Indian | 205 | 0.4% |
| Eastern European | 67 | 0.1% |
| Egyptian | 6 | 0.0% |
| English | 6,579 | 13.6% |
| European | 339 | 0.7% |
| Filipino | 18 | 0.0% |
| Finnish | 59 | 0.1% |
| French | 801 | 1.7% |
| French American Indian | 2 | 0.0% |
| French Canadian | 116 | 0.2% |
| German | 4,592 | 9.5% |
| Greek | 41 | 0.1% |
| Guatemalan | 5 | 0.0% |
| Honduran | 5 | 0.0% |
| Hungarian | 6 | 0.0% |
| Indian (Asian) | 11 | 0.0% |
| Inupiat | 11 | 0.0% |
| Irish | 5,686 | 11.7% |
| Iroquois | 19 | 0.0% |
| Italian | 616 | 1.3% |
| Kiowa | 10 | 0.0% |
| Korean | 122 | 0.3% |
| Lithuanian | 5 | 0.0% |
| Malaysian | 138 | 0.3% |
| Mexican | 3,255 | 6.7% |
| Mexican American Indian | 94 | 0.2% |
| Native Hawaiian | 24 | 0.1% |
| Navajo | 7 | 0.0% |
| Nicaraguan | 3 | 0.0% |
| Nigerian | 25 | 0.1% |
| Northern European | 31 | 0.1% |
| Norwegian | 169 | 0.4% |
| Osage | 37 | 0.1% |
| Pakistani | 7 | 0.0% |
| Pennsylvania German | 42 | 0.1% |
| Peruvian | 1 | 0.0% |
| Polish | 274 | 0.6% |
| Portuguese | 91 | 0.2% |
| Potawatomi | 44 | 0.1% |
| Pueblo | 5 | 0.0% |
| Puerto Rican | 66 | 0.1% |
| Romanian | 7 | 0.0% |
| Russian | 58 | 0.1% |
| Salvadoran | 34 | 0.1% |
| Samoan | 16 | 0.0% |
| Scandinavian | 40 | 0.1% |
| Scotch-Irish | 464 | 1.0% |
| Scottish | 678 | 1.4% |
| Seminole | 22 | 0.1% |
| Sioux | 25 | 0.1% |
| Slavic | 12 | 0.0% |
| South American | 64 | 0.1% |
| Spaniard | 31 | 0.1% |
| Spanish | 88 | 0.2% |
| Sri Lankan | 87 | 0.2% |
| Subsaharan African | 55 | 0.1% |
| Swedish | 108 | 0.2% |
| Swiss | 41 | 0.1% |
| Syrian | 4 | 0.0% |
| Thai | 10 | 0.0% |
| Tongan | 43 | 0.1% |
| Ukrainian | 16 | 0.0% |
| Ute | 3 | 0.0% |
| Venezuelan | 12 | 0.0% |
| Welsh | 214 | 0.4% |
| Yugoslavian | 5 | 0.0% | View All 99 Rows |
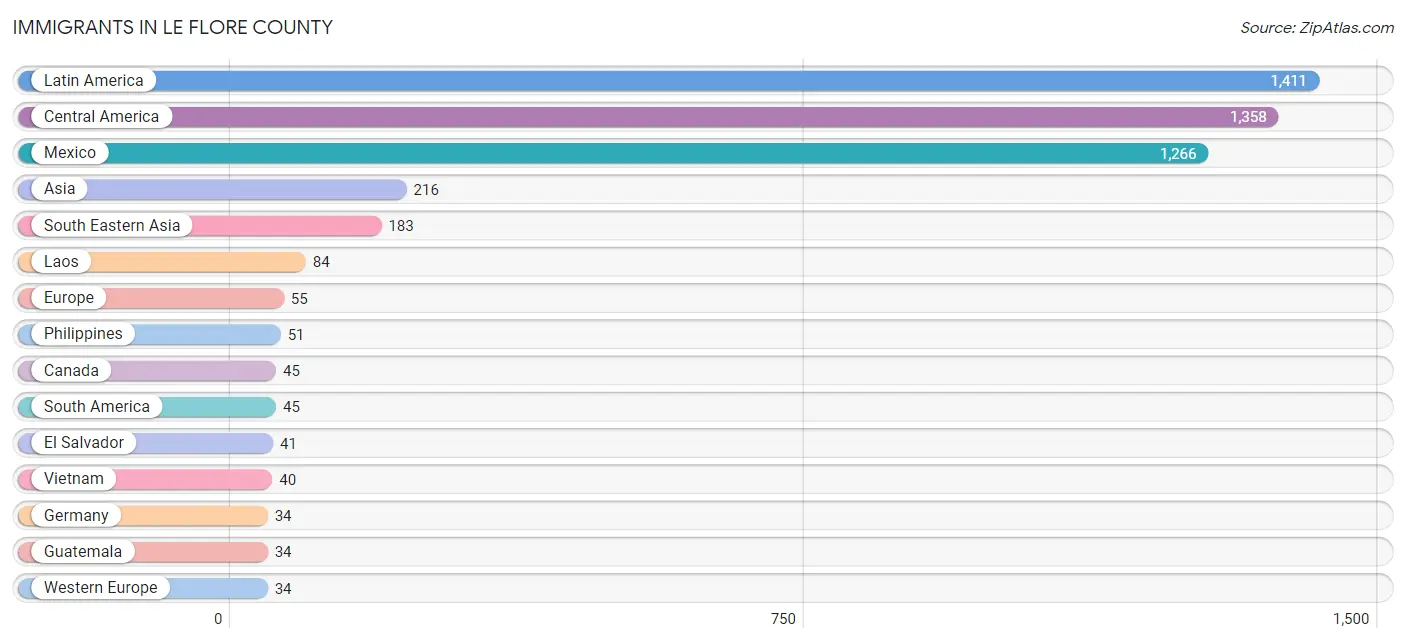
Immigrants in Le Flore County
The most numerous immigrant groups reported in Le Flore County came from Latin America (1,411 | 2.9%), Central America (1,358 | 2.8%), Mexico (1,266 | 2.6%), Asia (216 | 0.4%), and South Eastern Asia (183 | 0.4%), together accounting for 9.1% of all Le Flore County residents.
| Immigration Origin | # Population | % Population |
| Africa | 11 | 0.0% |
| Argentina | 14 | 0.0% |
| Asia | 216 | 0.4% |
| Brazil | 2 | 0.0% |
| Canada | 45 | 0.1% |
| Caribbean | 8 | 0.0% |
| Central America | 1,358 | 2.8% |
| China | 6 | 0.0% |
| Colombia | 9 | 0.0% |
| Cuba | 8 | 0.0% |
| Eastern Africa | 5 | 0.0% |
| Eastern Asia | 11 | 0.0% |
| Eastern Europe | 3 | 0.0% |
| Egypt | 6 | 0.0% |
| El Salvador | 41 | 0.1% |
| England | 7 | 0.0% |
| Europe | 55 | 0.1% |
| Germany | 34 | 0.1% |
| Guatemala | 34 | 0.1% |
| Honduras | 14 | 0.0% |
| Hungary | 3 | 0.0% |
| Italy | 7 | 0.0% |
| Japan | 5 | 0.0% |
| Laos | 84 | 0.2% |
| Latin America | 1,411 | 2.9% |
| Mexico | 1,266 | 2.6% |
| Nicaragua | 3 | 0.0% |
| Northern Africa | 6 | 0.0% |
| Northern Europe | 9 | 0.0% |
| Pakistan | 22 | 0.1% |
| Philippines | 51 | 0.1% |
| Portugal | 2 | 0.0% |
| South America | 45 | 0.1% |
| South Central Asia | 22 | 0.1% |
| South Eastern Asia | 183 | 0.4% |
| Southern Europe | 9 | 0.0% |
| Thailand | 8 | 0.0% |
| Venezuela | 20 | 0.0% |
| Vietnam | 40 | 0.1% |
| Western Europe | 34 | 0.1% | View All 40 Rows |
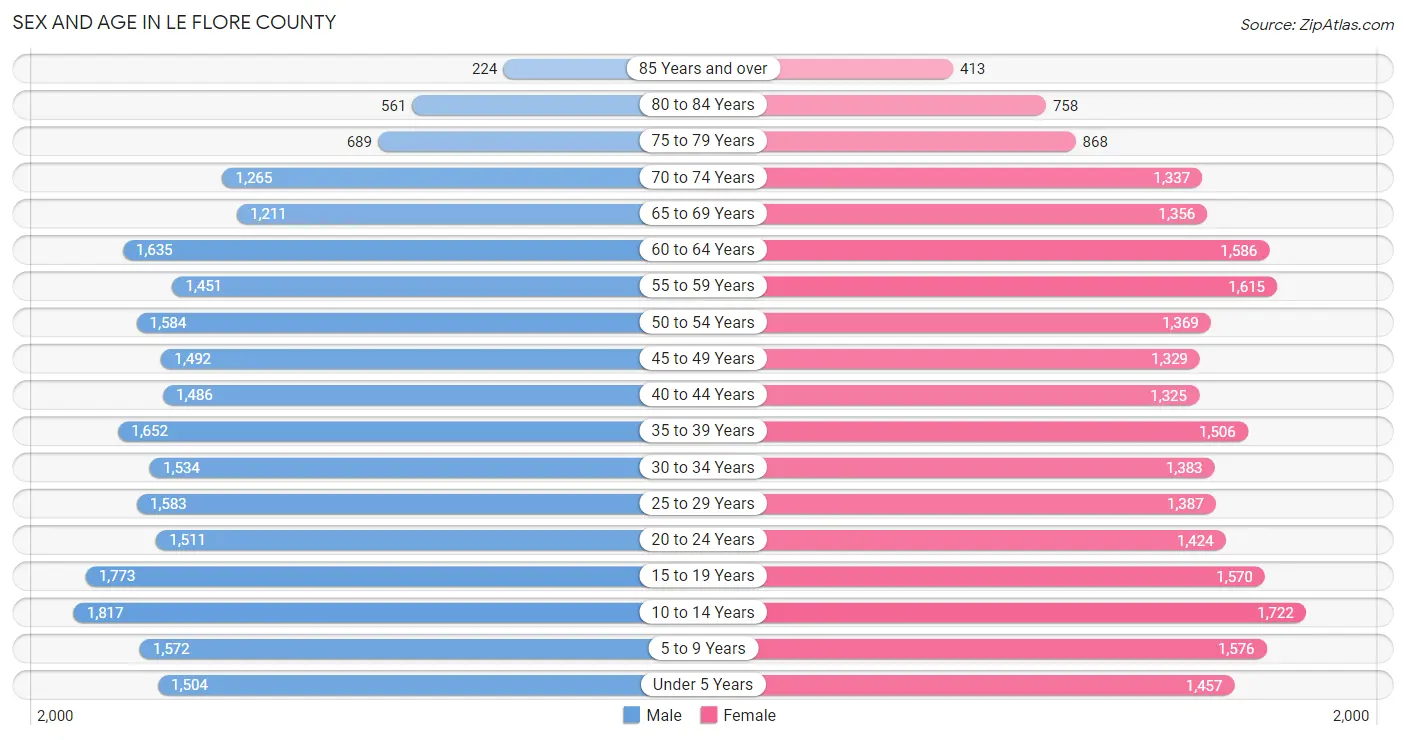
Sex and Age in Le Flore County
Sex and Age in Le Flore County
The most populous age groups in Le Flore County are 10 to 14 Years (1,817 | 7.4%) for men and 10 to 14 Years (1,722 | 7.2%) for women.
| Age Bracket | Male | Female |
| Under 5 Years | 1,504 (6.1%) | 1,457 (6.1%) |
| 5 to 9 Years | 1,572 (6.4%) | 1,576 (6.6%) |
| 10 to 14 Years | 1,817 (7.4%) | 1,722 (7.2%) |
| 15 to 19 Years | 1,773 (7.2%) | 1,570 (6.6%) |
| 20 to 24 Years | 1,511 (6.2%) | 1,424 (5.9%) |
| 25 to 29 Years | 1,583 (6.5%) | 1,387 (5.8%) |
| 30 to 34 Years | 1,534 (6.2%) | 1,383 (5.8%) |
| 35 to 39 Years | 1,652 (6.7%) | 1,506 (6.3%) |
| 40 to 44 Years | 1,486 (6.0%) | 1,325 (5.5%) |
| 45 to 49 Years | 1,492 (6.1%) | 1,329 (5.5%) |
| 50 to 54 Years | 1,584 (6.5%) | 1,369 (5.7%) |
| 55 to 59 Years | 1,451 (5.9%) | 1,615 (6.7%) |
| 60 to 64 Years | 1,635 (6.7%) | 1,586 (6.6%) |
| 65 to 69 Years | 1,211 (4.9%) | 1,356 (5.7%) |
| 70 to 74 Years | 1,265 (5.1%) | 1,337 (5.6%) |
| 75 to 79 Years | 689 (2.8%) | 868 (3.6%) |
| 80 to 84 Years | 561 (2.3%) | 758 (3.2%) |
| 85 Years and over | 224 (0.9%) | 413 (1.7%) |
| Total | 24,544 (100.0%) | 23,981 (100.0%) |
Families and Households in Le Flore County
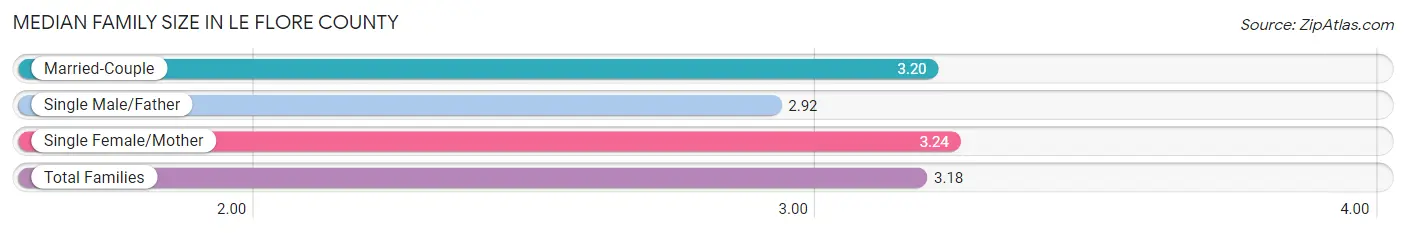
Median Family Size in Le Flore County
The median family size in Le Flore County is 3.18 persons per family, with single female/mother families (2,361 | 19.4%) accounting for the largest median family size of 3.24 persons per family. On the other hand, single male/father families (1,131 | 9.3%) represent the smallest median family size with 2.92 persons per family.
| Family Type | # Families | Family Size |
| Married-Couple | 8,687 (71.3%) | 3.20 |
| Single Male/Father | 1,131 (9.3%) | 2.92 |
| Single Female/Mother | 2,361 (19.4%) | 3.24 |
| Total Families | 12,179 (100.0%) | 3.18 |
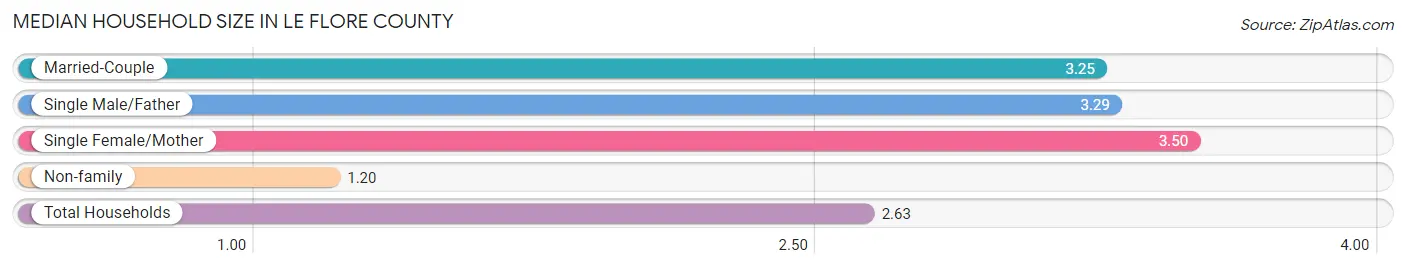
Median Household Size in Le Flore County
The median household size in Le Flore County is 2.63 persons per household, with single female/mother households (2,361 | 13.2%) accounting for the largest median household size of 3.5 persons per household. non-family households (5,656 | 31.7%) represent the smallest median household size with 1.20 persons per household.
| Household Type | # Households | Household Size |
| Married-Couple | 8,687 (48.7%) | 3.25 |
| Single Male/Father | 1,131 (6.3%) | 3.29 |
| Single Female/Mother | 2,361 (13.2%) | 3.50 |
| Non-family | 5,656 (31.7%) | 1.20 |
| Total Households | 17,835 (100.0%) | 2.63 |
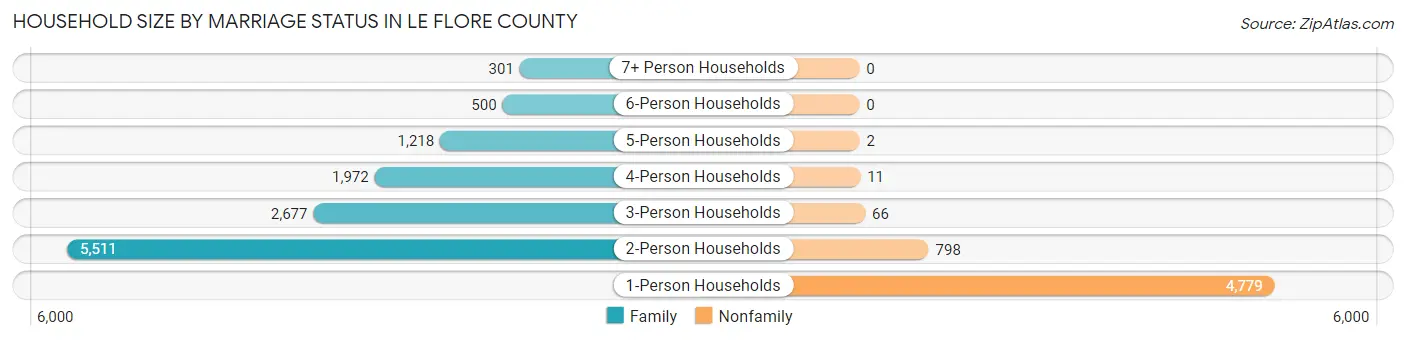
Household Size by Marriage Status in Le Flore County
Out of a total of 17,835 households in Le Flore County, 12,179 (68.3%) are family households, while 5,656 (31.7%) are nonfamily households. The most numerous type of family households are 2-person households, comprising 5,511, and the most common type of nonfamily households are 1-person households, comprising 4,779.
| Household Size | Family Households | Nonfamily Households |
| 1-Person Households | - | 4,779 (26.8%) |
| 2-Person Households | 5,511 (30.9%) | 798 (4.5%) |
| 3-Person Households | 2,677 (15.0%) | 66 (0.4%) |
| 4-Person Households | 1,972 (11.1%) | 11 (0.1%) |
| 5-Person Households | 1,218 (6.8%) | 2 (0.0%) |
| 6-Person Households | 500 (2.8%) | 0 (0.0%) |
| 7+ Person Households | 301 (1.7%) | 0 (0.0%) |
| Total | 12,179 (68.3%) | 5,656 (31.7%) |
Female Fertility in Le Flore County
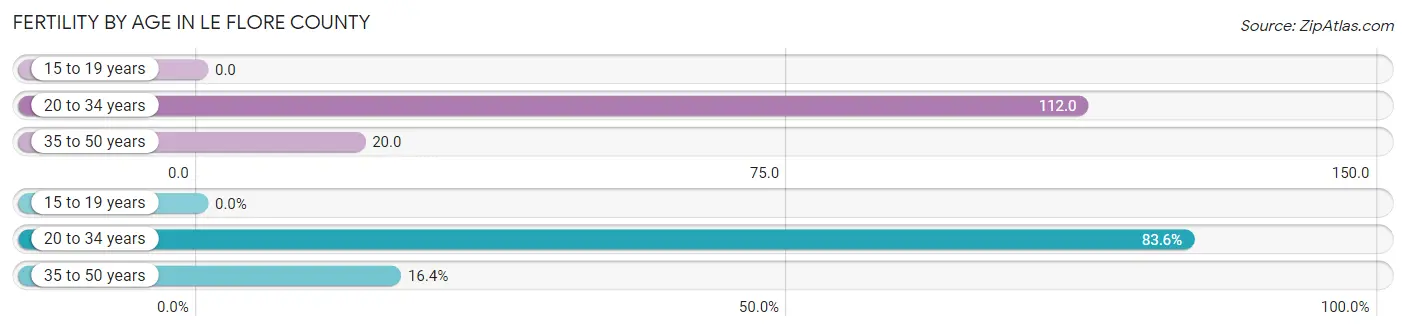
Fertility by Age in Le Flore County
Average fertility rate in Le Flore County is 55.0 births per 1,000 women. Women in the age bracket of 20 to 34 years have the highest fertility rate with 112.0 births per 1,000 women. Women in the age bracket of 20 to 34 years acount for 83.6% of all women with births.
| Age Bracket | Women with Births | Births / 1,000 Women |
| 15 to 19 years | 0 (0.0%) | 0.0 |
| 20 to 34 years | 470 (83.6%) | 112.0 |
| 35 to 50 years | 92 (16.4%) | 20.0 |
| Total | 562 (100.0%) | 55.0 |
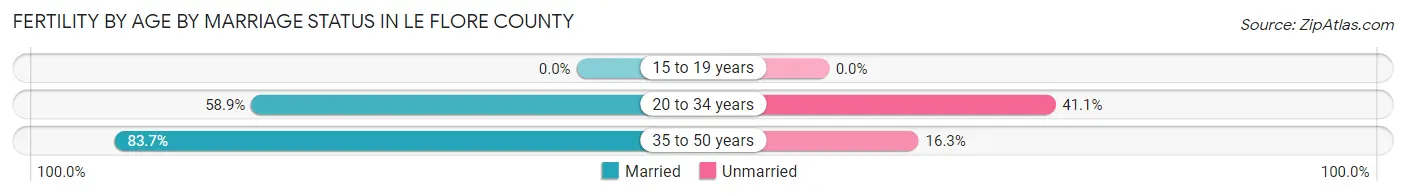
Fertility by Age by Marriage Status in Le Flore County
63.0% of women with births (562) in Le Flore County are married. The highest percentage of unmarried women with births falls into 20 to 34 years age bracket with 41.1% of them unmarried at the time of birth, while the lowest percentage of unmarried women with births belong to 35 to 50 years age bracket with 16.3% of them unmarried.
| Age Bracket | Married | Unmarried |
| 15 to 19 years | 0 (0.0%) | 0 (0.0%) |
| 20 to 34 years | 277 (58.9%) | 193 (41.1%) |
| 35 to 50 years | 77 (83.7%) | 15 (16.3%) |
| Total | 354 (63.0%) | 208 (37.0%) |
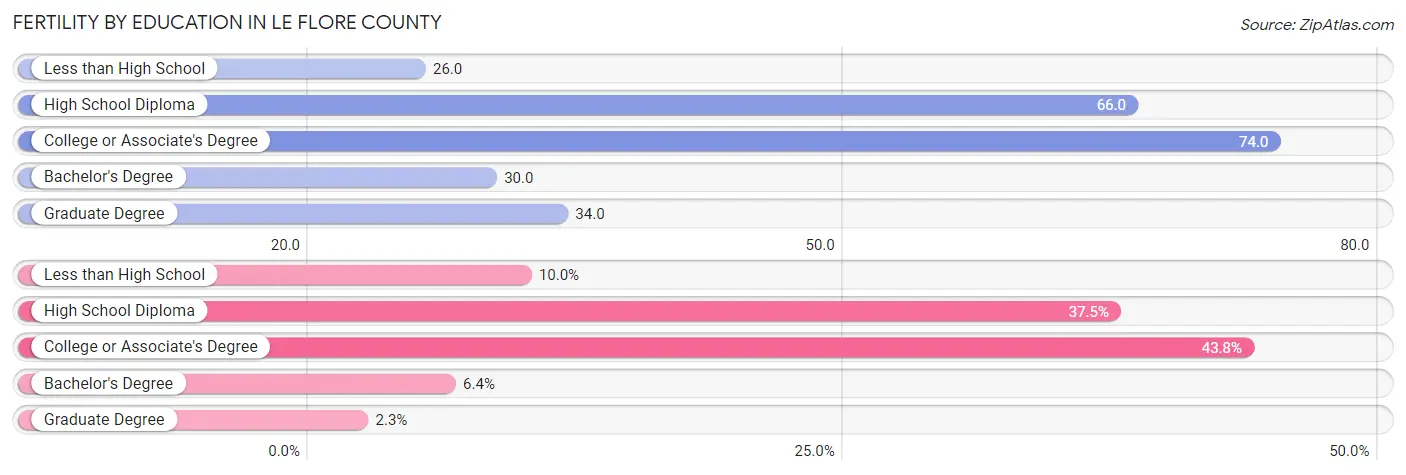
Fertility by Education in Le Flore County
Average fertility rate in Le Flore County is 55.0 births per 1,000 women. Women with the education attainment of college or associate's degree have the highest fertility rate of 74.0 births per 1,000 women, while women with the education attainment of less than high school have the lowest fertility at 26.0 births per 1,000 women. Women with the education attainment of college or associate's degree represent 43.8% of all women with births.
| Educational Attainment | Women with Births | Births / 1,000 Women |
| Less than High School | 56 (10.0%) | 26.0 |
| High School Diploma | 211 (37.5%) | 66.0 |
| College or Associate's Degree | 246 (43.8%) | 74.0 |
| Bachelor's Degree | 36 (6.4%) | 30.0 |
| Graduate Degree | 13 (2.3%) | 34.0 |
| Total | 562 (100.0%) | 55.0 |
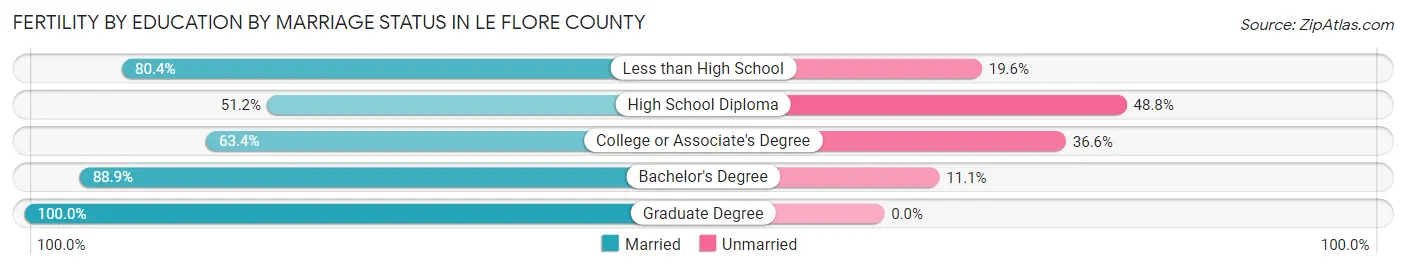
Fertility by Education by Marriage Status in Le Flore County
37.0% of women with births in Le Flore County are unmarried. Women with the educational attainment of graduate degree are most likely to be married with 100.0% of them married at childbirth, while women with the educational attainment of high school diploma are least likely to be married with 48.8% of them unmarried at childbirth.
| Educational Attainment | Married | Unmarried |
| Less than High School | 45 (80.4%) | 11 (19.6%) |
| High School Diploma | 108 (51.2%) | 103 (48.8%) |
| College or Associate's Degree | 156 (63.4%) | 90 (36.6%) |
| Bachelor's Degree | 32 (88.9%) | 4 (11.1%) |
| Graduate Degree | 13 (100.0%) | 0 (0.0%) |
| Total | 354 (63.0%) | 208 (37.0%) |
Income in Le Flore County
Income Overview in Le Flore County
Per Capita Income in Le Flore County is $23,718, while median incomes of families and households are $59,125 and $46,750 respectively.
| Characteristic | Number | Measure |
| Per Capita Income | 48,525 | $23,718 |
| Median Family Income | 12,179 | $59,125 |
| Mean Family Income | 12,179 | $71,560 |
| Median Household Income | 17,835 | $46,750 |
| Mean Household Income | 17,835 | $61,348 |
| Income Deficit | 12,179 | $10,515 |
| Wage / Income Gap (%) | 48,525 | 33.00% |
| Wage / Income Gap ($) | 48,525 | 67.00¢ per $1 |
| Gini / Inequality Index | 48,525 | 0.44 |
Earnings by Sex in Le Flore County
Average Earnings in Le Flore County are $31,323, $37,369 for men and $25,037 for women, a difference of 33.0%.
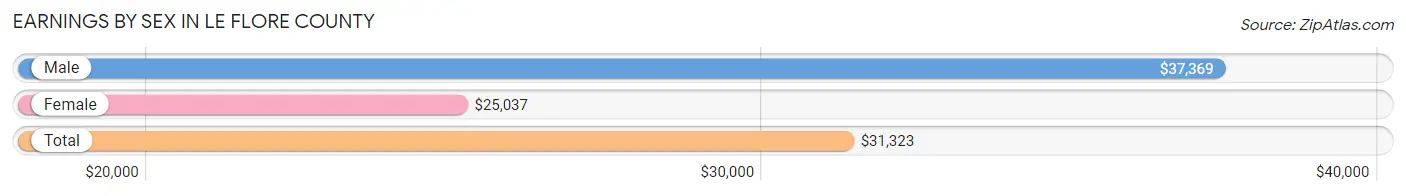
| Sex | Number | Average Earnings |
| Male | 11,042 (53.6%) | $37,369 |
| Female | 9,542 (46.4%) | $25,037 |
| Total | 20,584 (100.0%) | $31,323 |
Earnings by Sex by Income Bracket in Le Flore County
The most common earnings brackets in Le Flore County are $55,000 to $64,999 for men (979 | 8.9%) and $25,000 to $29,999 for women (912 | 9.6%).
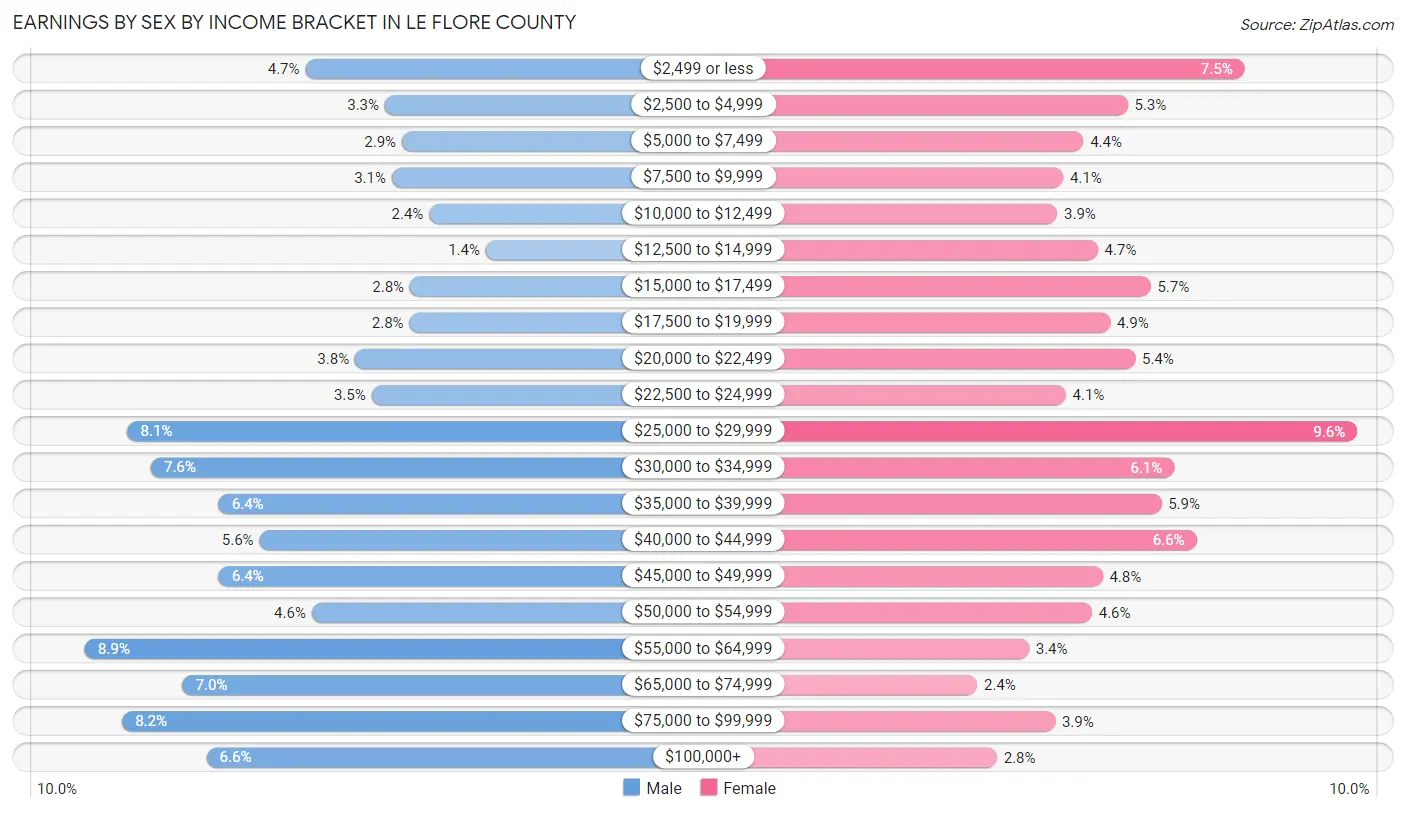
| Income | Male | Female |
| $2,499 or less | 523 (4.7%) | 711 (7.4%) |
| $2,500 to $4,999 | 359 (3.3%) | 502 (5.3%) |
| $5,000 to $7,499 | 323 (2.9%) | 423 (4.4%) |
| $7,500 to $9,999 | 345 (3.1%) | 386 (4.1%) |
| $10,000 to $12,499 | 267 (2.4%) | 376 (3.9%) |
| $12,500 to $14,999 | 150 (1.4%) | 448 (4.7%) |
| $15,000 to $17,499 | 307 (2.8%) | 543 (5.7%) |
| $17,500 to $19,999 | 308 (2.8%) | 470 (4.9%) |
| $20,000 to $22,499 | 421 (3.8%) | 515 (5.4%) |
| $22,500 to $24,999 | 387 (3.5%) | 391 (4.1%) |
| $25,000 to $29,999 | 891 (8.1%) | 912 (9.6%) |
| $30,000 to $34,999 | 843 (7.6%) | 585 (6.1%) |
| $35,000 to $39,999 | 702 (6.4%) | 562 (5.9%) |
| $40,000 to $44,999 | 618 (5.6%) | 625 (6.6%) |
| $45,000 to $49,999 | 702 (6.4%) | 457 (4.8%) |
| $50,000 to $54,999 | 510 (4.6%) | 438 (4.6%) |
| $55,000 to $64,999 | 979 (8.9%) | 325 (3.4%) |
| $65,000 to $74,999 | 777 (7.0%) | 233 (2.4%) |
| $75,000 to $99,999 | 902 (8.2%) | 372 (3.9%) |
| $100,000+ | 728 (6.6%) | 268 (2.8%) |
| Total | 11,042 (100.0%) | 9,542 (100.0%) |
Earnings by Sex by Educational Attainment in Le Flore County
Average earnings in Le Flore County are $42,290 for men and $28,019 for women, a difference of 33.8%. Men with an educational attainment of graduate degree enjoy the highest average annual earnings of $69,375, while those with less than high school education earn the least with $30,840. Women with an educational attainment of graduate degree earn the most with the average annual earnings of $57,986, while those with less than high school education have the smallest earnings of $21,188.
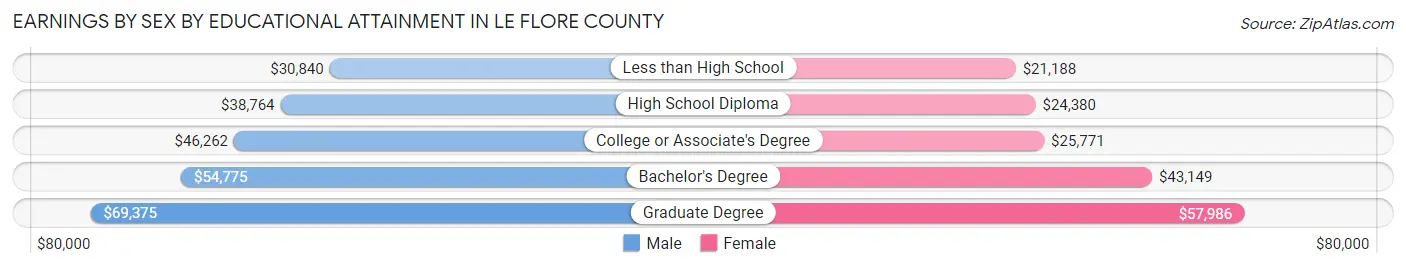
| Educational Attainment | Male Income | Female Income |
| Less than High School | $30,840 | $21,188 |
| High School Diploma | $38,764 | $24,380 |
| College or Associate's Degree | $46,262 | $25,771 |
| Bachelor's Degree | $54,775 | $43,149 |
| Graduate Degree | $69,375 | $57,986 |
| Total | $42,290 | $28,019 |
Family Income in Le Flore County
Family Income Brackets in Le Flore County
According to the Le Flore County family income data, there are 2,485 families falling into the $50,000 to $74,999 income range, which is the most common income bracket and makes up 20.4% of all families. Conversely, the $200,000+ income bracket is the least frequent group with only 378 families (3.1%) belonging to this category.
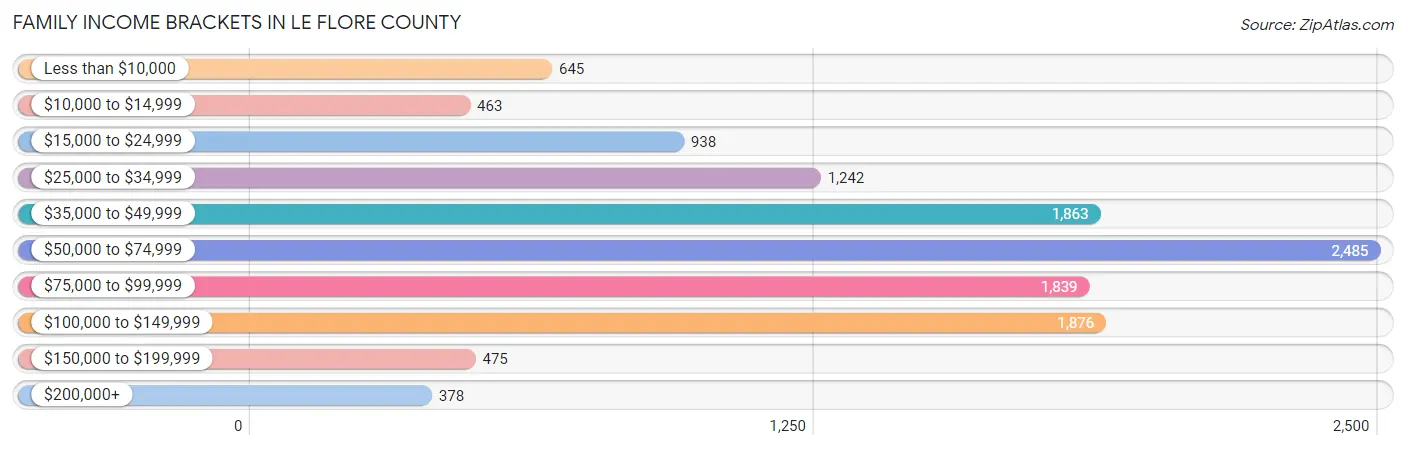
| Income Bracket | # Families | % Families |
| Less than $10,000 | 645 | 5.3% |
| $10,000 to $14,999 | 463 | 3.8% |
| $15,000 to $24,999 | 938 | 7.7% |
| $25,000 to $34,999 | 1,242 | 10.2% |
| $35,000 to $49,999 | 1,863 | 15.3% |
| $50,000 to $74,999 | 2,485 | 20.4% |
| $75,000 to $99,999 | 1,839 | 15.1% |
| $100,000 to $149,999 | 1,876 | 15.4% |
| $150,000 to $199,999 | 475 | 3.9% |
| $200,000+ | 378 | 3.1% |
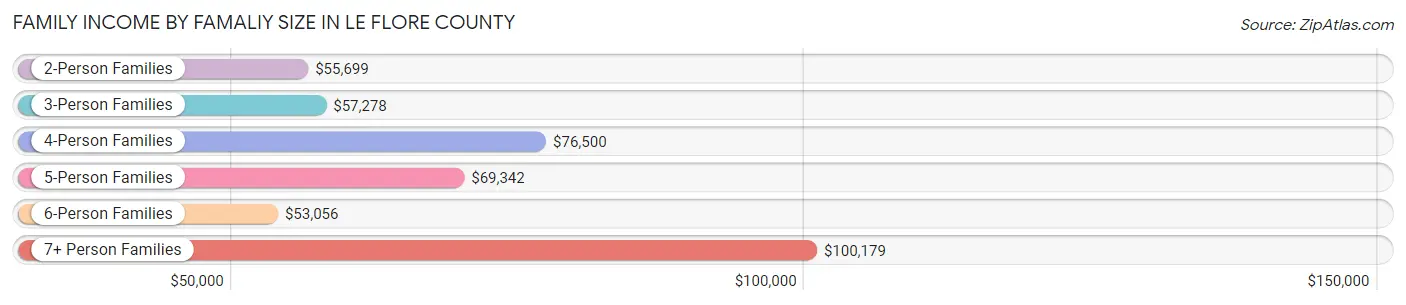
Family Income by Famaliy Size in Le Flore County
7+ person families (251 | 2.1%) account for the highest median family income in Le Flore County with $100,179 per family, while 2-person families (5,943 | 48.8%) have the highest median income of $27,850 per family member.
| Income Bracket | # Families | Median Income |
| 2-Person Families | 5,943 (48.8%) | $55,699 |
| 3-Person Families | 2,573 (21.1%) | $57,278 |
| 4-Person Families | 1,996 (16.4%) | $76,500 |
| 5-Person Families | 924 (7.6%) | $69,342 |
| 6-Person Families | 492 (4.0%) | $53,056 |
| 7+ Person Families | 251 (2.1%) | $100,179 |
| Total | 12,179 (100.0%) | $59,125 |
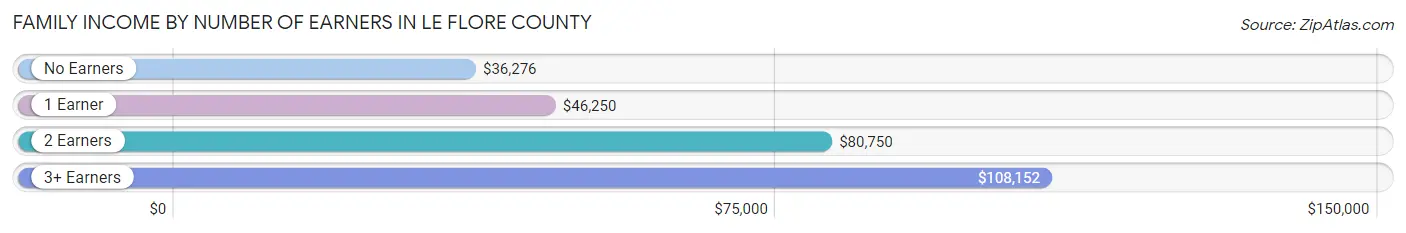
Family Income by Number of Earners in Le Flore County
The median family income in Le Flore County is $59,125, with families comprising 3+ earners (978) having the highest median family income of $108,152, while families with no earners (2,990) have the lowest median family income of $36,276, accounting for 8.0% and 24.5% of families, respectively.
| Number of Earners | # Families | Median Income |
| No Earners | 2,990 (24.5%) | $36,276 |
| 1 Earner | 4,077 (33.5%) | $46,250 |
| 2 Earners | 4,134 (33.9%) | $80,750 |
| 3+ Earners | 978 (8.0%) | $108,152 |
| Total | 12,179 (100.0%) | $59,125 |
Household Income in Le Flore County
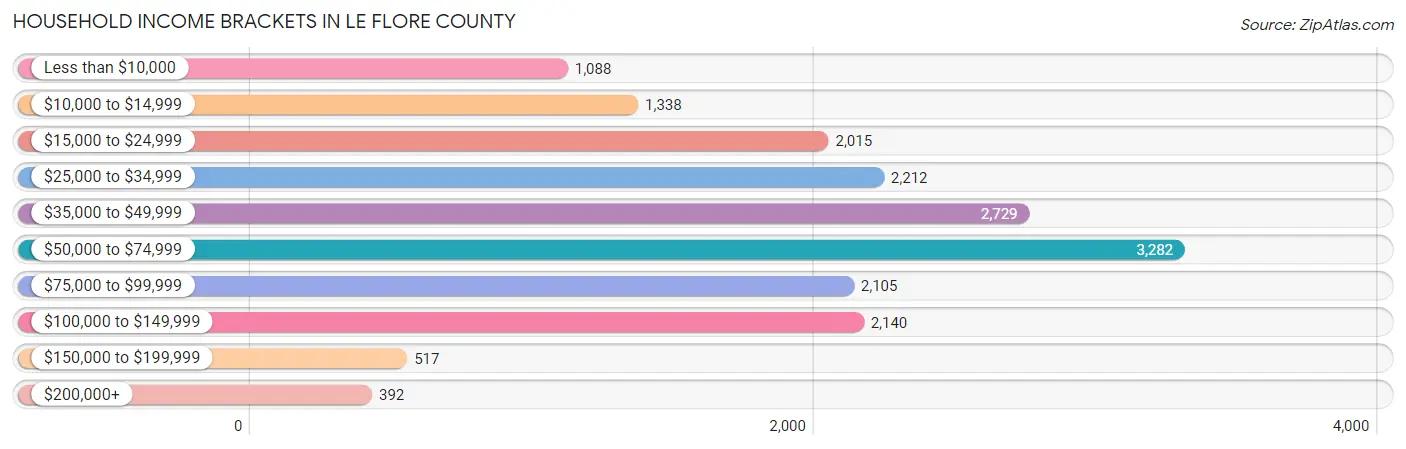
Household Income Brackets in Le Flore County
With 3,282 households falling in the category, the $50,000 to $74,999 income range is the most frequent in Le Flore County, accounting for 18.4% of all households. In contrast, only 392 households (2.2%) fall into the $200,000+ income bracket, making it the least populous group.
| Income Bracket | # Households | % Households |
| Less than $10,000 | 1,088 | 6.1% |
| $10,000 to $14,999 | 1,338 | 7.5% |
| $15,000 to $24,999 | 2,015 | 11.3% |
| $25,000 to $34,999 | 2,212 | 12.4% |
| $35,000 to $49,999 | 2,729 | 15.3% |
| $50,000 to $74,999 | 3,282 | 18.4% |
| $75,000 to $99,999 | 2,105 | 11.8% |
| $100,000 to $149,999 | 2,140 | 12.0% |
| $150,000 to $199,999 | 517 | 2.9% |
| $200,000+ | 392 | 2.2% |
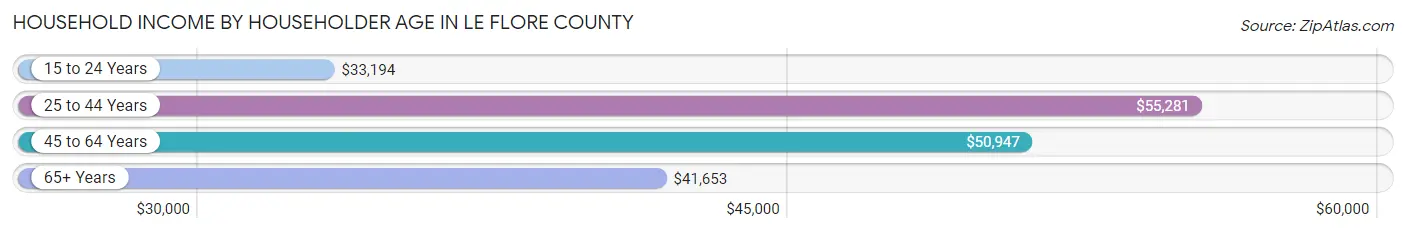
Household Income by Householder Age in Le Flore County
The median household income in Le Flore County is $46,750, with the highest median household income of $55,281 found in the 25 to 44 years age bracket for the primary householder. A total of 5,344 households (30.0%) fall into this category. Meanwhile, the 15 to 24 years age bracket for the primary householder has the lowest median household income of $33,194, with 685 households (3.8%) in this group.
| Income Bracket | # Households | Median Income |
| 15 to 24 Years | 685 (3.8%) | $33,194 |
| 25 to 44 Years | 5,344 (30.0%) | $55,281 |
| 45 to 64 Years | 6,240 (35.0%) | $50,947 |
| 65+ Years | 5,566 (31.2%) | $41,653 |
| Total | 17,835 (100.0%) | $46,750 |
Poverty in Le Flore County
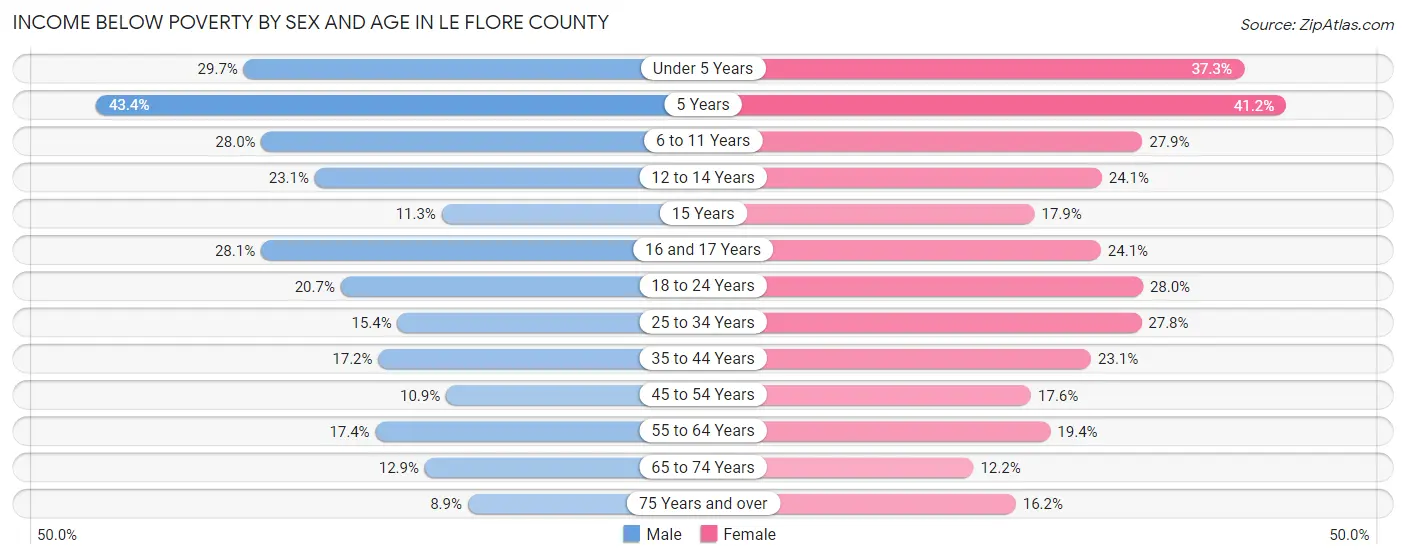
Income Below Poverty by Sex and Age in Le Flore County
With 18.0% poverty level for males and 22.7% for females among the residents of Le Flore County, 5 year old males and 5 year old females are the most vulnerable to poverty, with 108 males (43.4%) and 167 females (41.2%) in their respective age groups living below the poverty level.
| Age Bracket | Male | Female |
| Under 5 Years | 435 (29.7%) | 530 (37.3%) |
| 5 Years | 108 (43.4%) | 167 (41.2%) |
| 6 to 11 Years | 526 (28.0%) | 531 (27.9%) |
| 12 to 14 Years | 257 (23.1%) | 223 (24.1%) |
| 15 Years | 35 (11.3%) | 44 (17.9%) |
| 16 and 17 Years | 211 (28.1%) | 178 (24.0%) |
| 18 to 24 Years | 428 (20.7%) | 545 (28.0%) |
| 25 to 34 Years | 460 (15.4%) | 770 (27.8%) |
| 35 to 44 Years | 470 (17.2%) | 655 (23.1%) |
| 45 to 54 Years | 317 (10.9%) | 474 (17.6%) |
| 55 to 64 Years | 527 (17.4%) | 616 (19.4%) |
| 65 to 74 Years | 315 (12.9%) | 321 (12.2%) |
| 75 Years and over | 124 (8.9%) | 300 (16.2%) |
| Total | 4,213 (18.0%) | 5,354 (22.7%) |
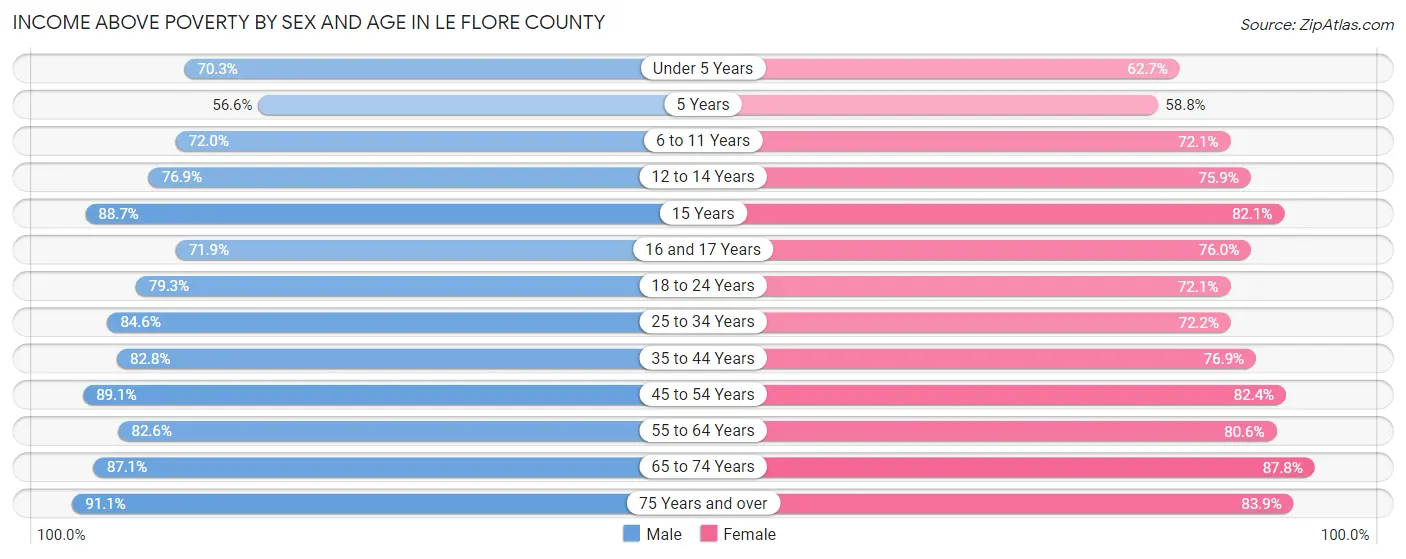
Income Above Poverty by Sex and Age in Le Flore County
According to the poverty statistics in Le Flore County, males aged 75 years and over and females aged 65 to 74 years are the age groups that are most secure financially, with 91.1% of males and 87.8% of females in these age groups living above the poverty line.
| Age Bracket | Male | Female |
| Under 5 Years | 1,031 (70.3%) | 891 (62.7%) |
| 5 Years | 141 (56.6%) | 238 (58.8%) |
| 6 to 11 Years | 1,351 (72.0%) | 1,373 (72.1%) |
| 12 to 14 Years | 857 (76.9%) | 701 (75.9%) |
| 15 Years | 275 (88.7%) | 202 (82.1%) |
| 16 and 17 Years | 541 (71.9%) | 562 (75.9%) |
| 18 to 24 Years | 1,644 (79.3%) | 1,405 (72.1%) |
| 25 to 34 Years | 2,529 (84.6%) | 2,000 (72.2%) |
| 35 to 44 Years | 2,267 (82.8%) | 2,176 (76.9%) |
| 45 to 54 Years | 2,593 (89.1%) | 2,224 (82.4%) |
| 55 to 64 Years | 2,494 (82.6%) | 2,565 (80.6%) |
| 65 to 74 Years | 2,134 (87.1%) | 2,305 (87.8%) |
| 75 Years and over | 1,274 (91.1%) | 1,558 (83.9%) |
| Total | 19,131 (82.0%) | 18,200 (77.3%) |
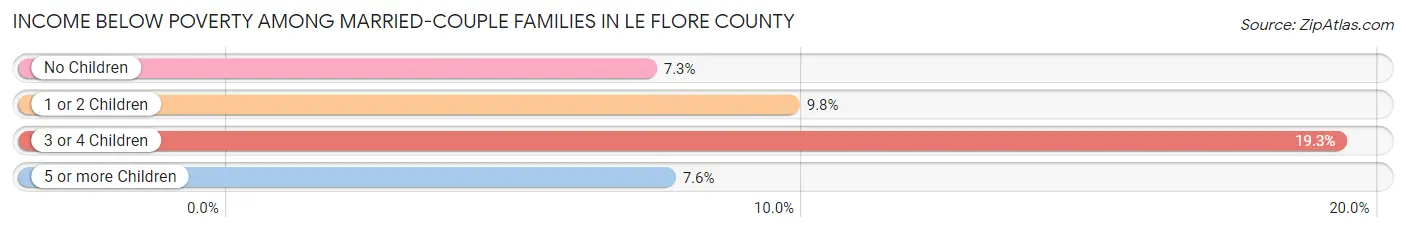
Income Below Poverty Among Married-Couple Families in Le Flore County
The poverty statistics for married-couple families in Le Flore County show that 9.2% or 797 of the total 8,687 families live below the poverty line. Families with 3 or 4 children have the highest poverty rate of 19.3%, comprising of 163 families. On the other hand, families with no children have the lowest poverty rate of 7.3%, which includes 383 families.
| Children | Above Poverty | Below Poverty |
| No Children | 4,870 (92.7%) | 383 (7.3%) |
| 1 or 2 Children | 2,242 (90.2%) | 243 (9.8%) |
| 3 or 4 Children | 681 (80.7%) | 163 (19.3%) |
| 5 or more Children | 97 (92.4%) | 8 (7.6%) |
| Total | 7,890 (90.8%) | 797 (9.2%) |
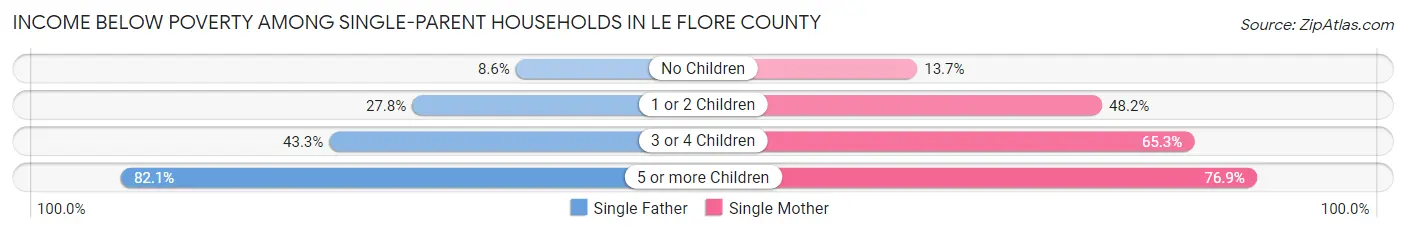
Income Below Poverty Among Single-Parent Households in Le Flore County
According to the poverty data in Le Flore County, 22.6% or 256 single-father households and 38.8% or 915 single-mother households are living below the poverty line. Among single-father households, those with 5 or more children have the highest poverty rate, with 32 households (82.1%) experiencing poverty. Likewise, among single-mother households, those with 5 or more children have the highest poverty rate, with 10 households (76.9%) falling below the poverty line.
| Children | Single Father | Single Mother |
| No Children | 40 (8.6%) | 114 (13.7%) |
| 1 or 2 Children | 155 (27.8%) | 560 (48.1%) |
| 3 or 4 Children | 29 (43.3%) | 231 (65.2%) |
| 5 or more Children | 32 (82.1%) | 10 (76.9%) |
| Total | 256 (22.6%) | 915 (38.8%) |
Income Below Poverty Among Married-Couple vs Single-Parent Households in Le Flore County
The poverty data for Le Flore County shows that 797 of the married-couple family households (9.2%) and 1,171 of the single-parent households (33.5%) are living below the poverty level. Within the married-couple family households, those with 3 or 4 children have the highest poverty rate, with 163 households (19.3%) falling below the poverty line. Among the single-parent households, those with 5 or more children have the highest poverty rate, with 42 household (80.8%) living below poverty.
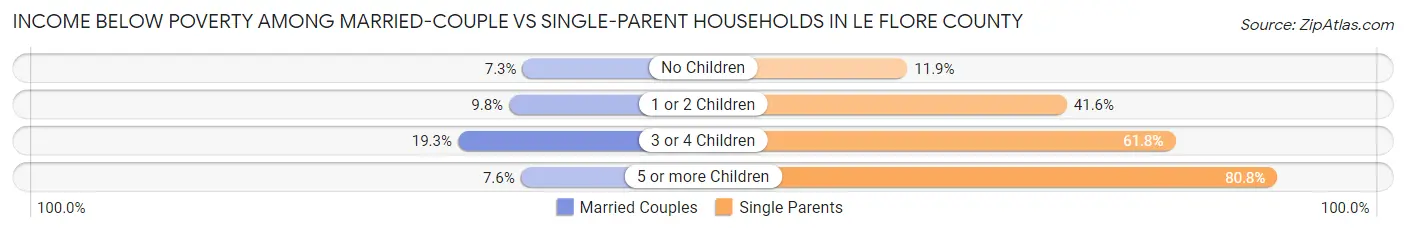
| Children | Married-Couple Families | Single-Parent Households |
| No Children | 383 (7.3%) | 154 (11.9%) |
| 1 or 2 Children | 243 (9.8%) | 715 (41.6%) |
| 3 or 4 Children | 163 (19.3%) | 260 (61.8%) |
| 5 or more Children | 8 (7.6%) | 42 (80.8%) |
| Total | 797 (9.2%) | 1,171 (33.5%) |
Employment Characteristics in Le Flore County
Employment by Class of Employer in Le Flore County
Among the 18,627 employed individuals in Le Flore County, private company employees (11,966 | 64.2%), self-employed (not incorporated) (1,481 | 8.0%), and state government employees (1,479 | 7.9%) make up the most common classes of employment.
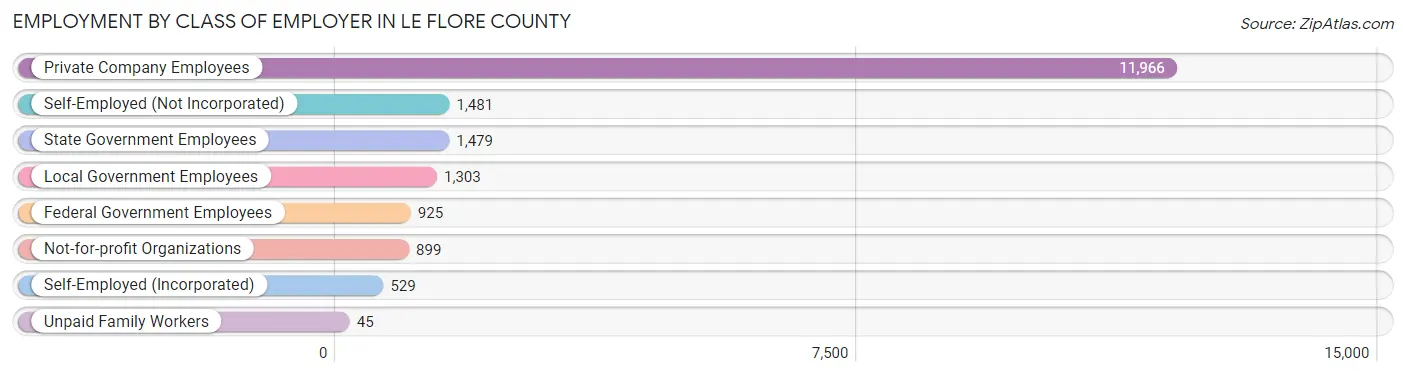
| Employer Class | # Employees | % Employees |
| Private Company Employees | 11,966 | 64.2% |
| Self-Employed (Incorporated) | 529 | 2.8% |
| Self-Employed (Not Incorporated) | 1,481 | 8.0% |
| Not-for-profit Organizations | 899 | 4.8% |
| Local Government Employees | 1,303 | 7.0% |
| State Government Employees | 1,479 | 7.9% |
| Federal Government Employees | 925 | 5.0% |
| Unpaid Family Workers | 45 | 0.2% |
| Total | 18,627 | 100.0% |
Employment Status by Age in Le Flore County
According to the labor force statistics for Le Flore County, out of the total population over 16 years of age (38,321), 51.7% or 19,812 individuals are in the labor force, with 5.2% or 1,030 of them unemployed. The age group with the highest labor force participation rate is 25 to 29 years, with 75.8% or 2,251 individuals in the labor force. Within the labor force, the 16 to 19 years age range has the highest percentage of unemployed individuals, with 10.9% or 98 of them being unemployed.
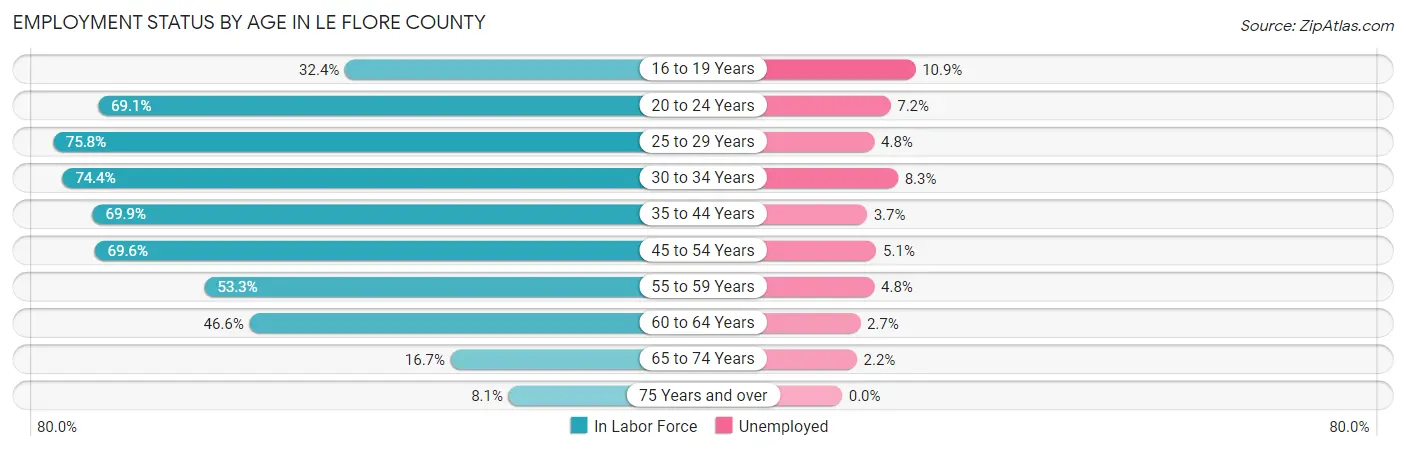
| Age Bracket | In Labor Force | Unemployed |
| 16 to 19 Years | 903 (32.4%) | 98 (10.9%) |
| 20 to 24 Years | 2,028 (69.1%) | 146 (7.2%) |
| 25 to 29 Years | 2,251 (75.8%) | 108 (4.8%) |
| 30 to 34 Years | 2,170 (74.4%) | 180 (8.3%) |
| 35 to 44 Years | 4,172 (69.9%) | 154 (3.7%) |
| 45 to 54 Years | 4,019 (69.6%) | 205 (5.1%) |
| 55 to 59 Years | 1,634 (53.3%) | 78 (4.8%) |
| 60 to 64 Years | 1,501 (46.6%) | 41 (2.7%) |
| 65 to 74 Years | 863 (16.7%) | 19 (2.2%) |
| 75 Years and over | 285 (8.1%) | 0 (0.0%) |
| Total | 19,812 (51.7%) | 1,030 (5.2%) |
Employment Status by Educational Attainment in Le Flore County
According to labor force statistics for Le Flore County, 65.8% of individuals (15,737) out of the total population between 25 and 64 years of age (23,917) are in the labor force, with 4.8% or 755 of them being unemployed. The group with the highest labor force participation rate are those with the educational attainment of bachelor's degree or higher, with 80.9% or 2,858 individuals in the labor force. Within the labor force, individuals with less than high school education have the highest percentage of unemployment, with 7.0% or 116 of them being unemployed.
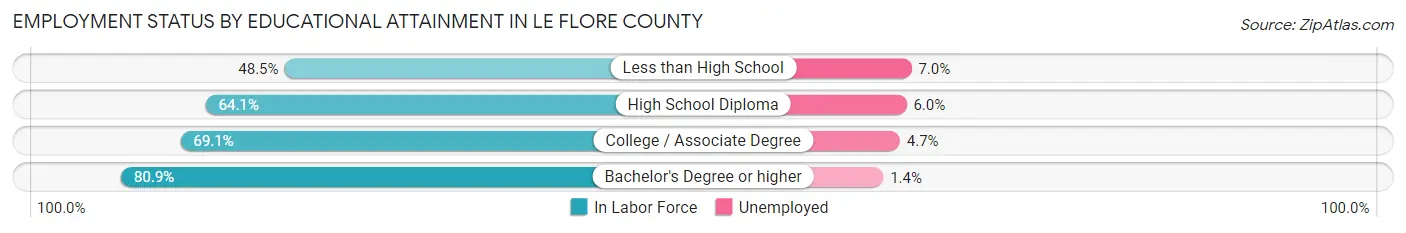
| Educational Attainment | In Labor Force | Unemployed |
| Less than High School | 1,657 (48.5%) | 239 (7.0%) |
| High School Diploma | 6,304 (64.1%) | 590 (6.0%) |
| College / Associate Degree | 4,929 (69.1%) | 335 (4.7%) |
| Bachelor's Degree or higher | 2,858 (80.9%) | 49 (1.4%) |
| Total | 15,737 (65.8%) | 1,148 (4.8%) |
Employment Occupations by Sex in Le Flore County
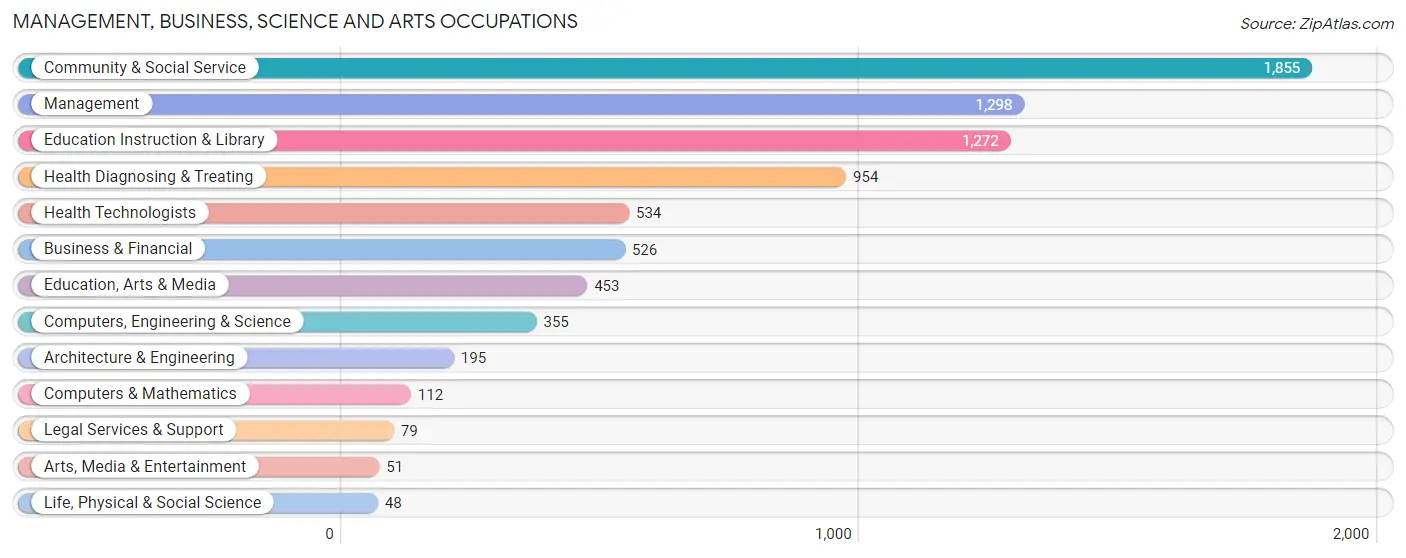
Management, Business, Science and Arts Occupations
The most common Management, Business, Science and Arts occupations in Le Flore County are Community & Social Service (1,855 | 9.9%), Management (1,298 | 7.0%), Education Instruction & Library (1,272 | 6.8%), Health Diagnosing & Treating (954 | 5.1%), and Health Technologists (534 | 2.9%).
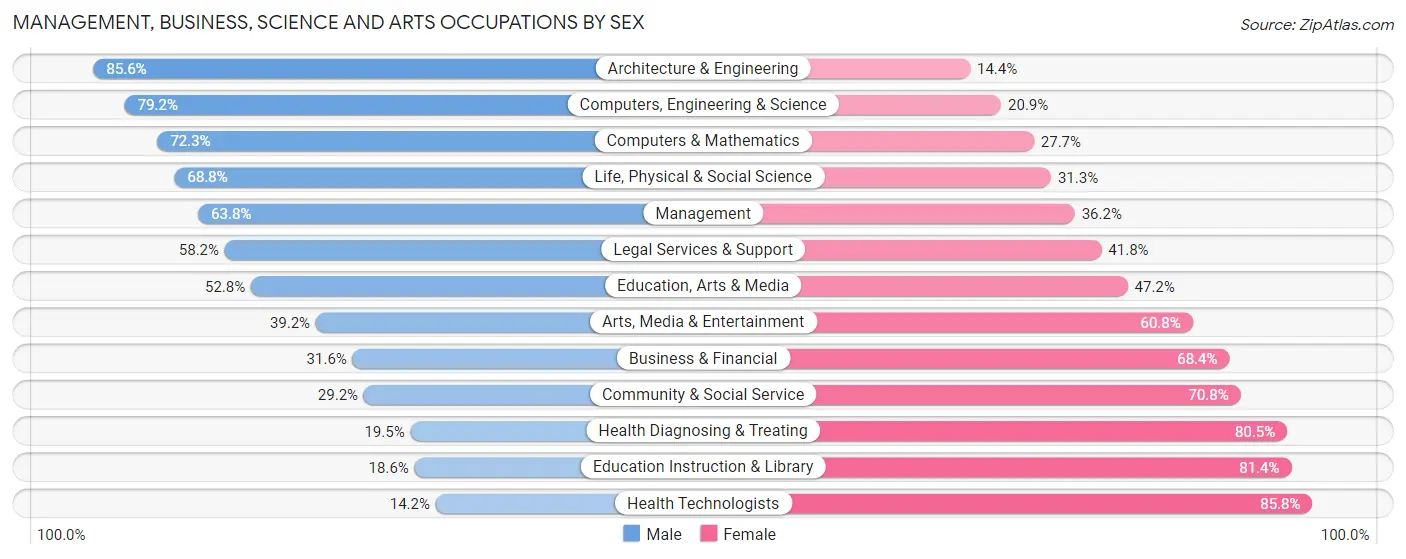
Management, Business, Science and Arts Occupations by Sex
Within the Management, Business, Science and Arts occupations in Le Flore County, the most male-oriented occupations are Architecture & Engineering (85.6%), Computers, Engineering & Science (79.1%), and Computers & Mathematics (72.3%), while the most female-oriented occupations are Health Technologists (85.8%), Education Instruction & Library (81.4%), and Health Diagnosing & Treating (80.5%).
| Occupation | Male | Female |
| Management | 828 (63.8%) | 470 (36.2%) |
| Business & Financial | 166 (31.6%) | 360 (68.4%) |
| Computers, Engineering & Science | 281 (79.1%) | 74 (20.8%) |
| Computers & Mathematics | 81 (72.3%) | 31 (27.7%) |
| Architecture & Engineering | 167 (85.6%) | 28 (14.4%) |
| Life, Physical & Social Science | 33 (68.8%) | 15 (31.2%) |
| Community & Social Service | 542 (29.2%) | 1,313 (70.8%) |
| Education, Arts & Media | 239 (52.8%) | 214 (47.2%) |
| Legal Services & Support | 46 (58.2%) | 33 (41.8%) |
| Education Instruction & Library | 237 (18.6%) | 1,035 (81.4%) |
| Arts, Media & Entertainment | 20 (39.2%) | 31 (60.8%) |
| Health Diagnosing & Treating | 186 (19.5%) | 768 (80.5%) |
| Health Technologists | 76 (14.2%) | 458 (85.8%) |
| Total (Category) | 2,003 (40.2%) | 2,985 (59.8%) |
| Total (Overall) | 10,058 (53.9%) | 8,607 (46.1%) |
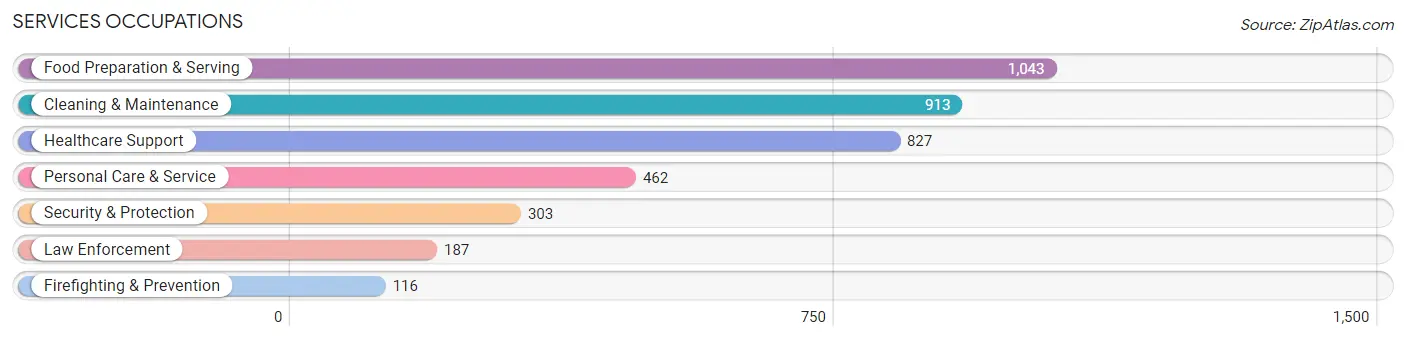
Services Occupations
The most common Services occupations in Le Flore County are Food Preparation & Serving (1,043 | 5.6%), Cleaning & Maintenance (913 | 4.9%), Healthcare Support (827 | 4.4%), Personal Care & Service (462 | 2.5%), and Security & Protection (303 | 1.6%).
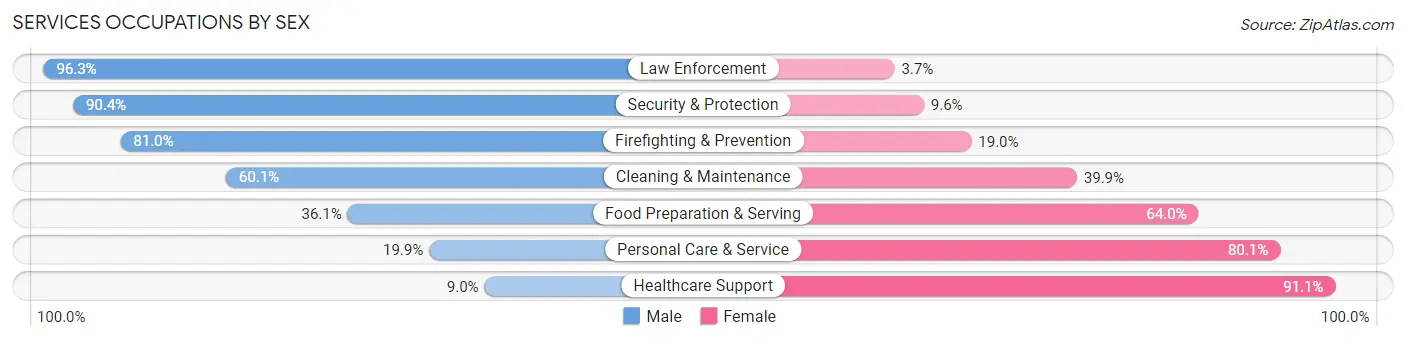
Services Occupations by Sex
Within the Services occupations in Le Flore County, the most male-oriented occupations are Law Enforcement (96.3%), Security & Protection (90.4%), and Firefighting & Prevention (81.0%), while the most female-oriented occupations are Healthcare Support (91.0%), Personal Care & Service (80.1%), and Food Preparation & Serving (63.9%).
| Occupation | Male | Female |
| Healthcare Support | 74 (8.9%) | 753 (91.0%) |
| Security & Protection | 274 (90.4%) | 29 (9.6%) |
| Firefighting & Prevention | 94 (81.0%) | 22 (19.0%) |
| Law Enforcement | 180 (96.3%) | 7 (3.7%) |
| Food Preparation & Serving | 376 (36.0%) | 667 (63.9%) |
| Cleaning & Maintenance | 549 (60.1%) | 364 (39.9%) |
| Personal Care & Service | 92 (19.9%) | 370 (80.1%) |
| Total (Category) | 1,365 (38.5%) | 2,183 (61.5%) |
| Total (Overall) | 10,058 (53.9%) | 8,607 (46.1%) |
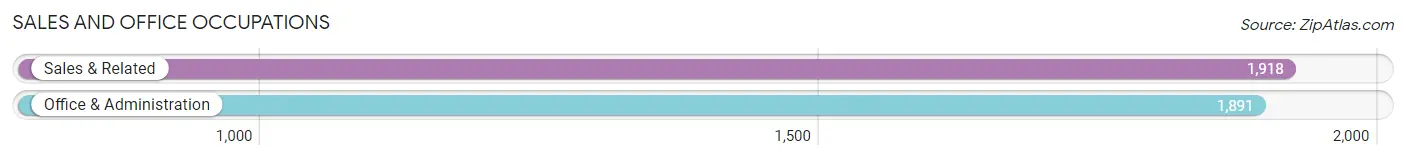
Sales and Office Occupations
The most common Sales and Office occupations in Le Flore County are Sales & Related (1,918 | 10.3%), and Office & Administration (1,891 | 10.1%).
Sales and Office Occupations by Sex
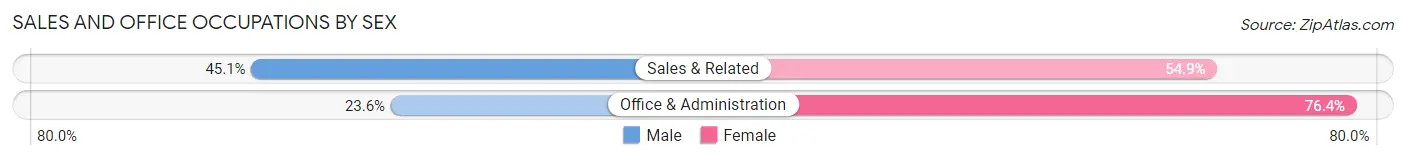
| Occupation | Male | Female |
| Sales & Related | 865 (45.1%) | 1,053 (54.9%) |
| Office & Administration | 447 (23.6%) | 1,444 (76.4%) |
| Total (Category) | 1,312 (34.4%) | 2,497 (65.6%) |
| Total (Overall) | 10,058 (53.9%) | 8,607 (46.1%) |
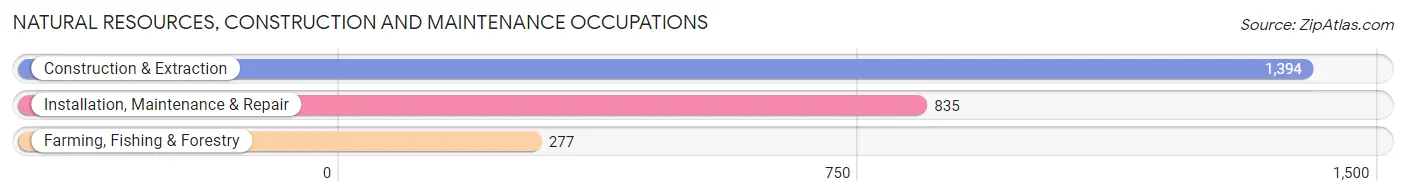
Natural Resources, Construction and Maintenance Occupations
The most common Natural Resources, Construction and Maintenance occupations in Le Flore County are Construction & Extraction (1,394 | 7.5%), Installation, Maintenance & Repair (835 | 4.5%), and Farming, Fishing & Forestry (277 | 1.5%).
Natural Resources, Construction and Maintenance Occupations by Sex
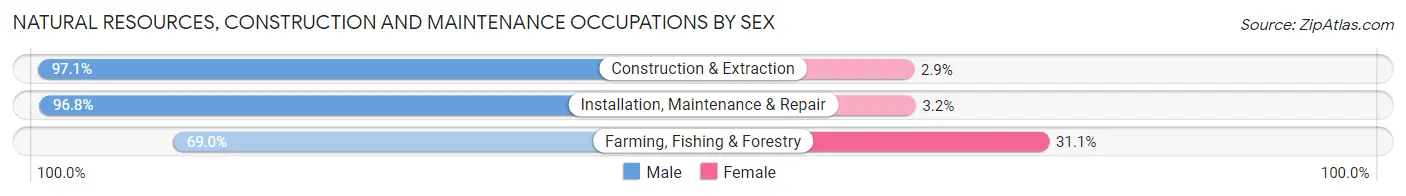
| Occupation | Male | Female |
| Farming, Fishing & Forestry | 191 (69.0%) | 86 (31.0%) |
| Construction & Extraction | 1,353 (97.1%) | 41 (2.9%) |
| Installation, Maintenance & Repair | 808 (96.8%) | 27 (3.2%) |
| Total (Category) | 2,352 (93.9%) | 154 (6.1%) |
| Total (Overall) | 10,058 (53.9%) | 8,607 (46.1%) |
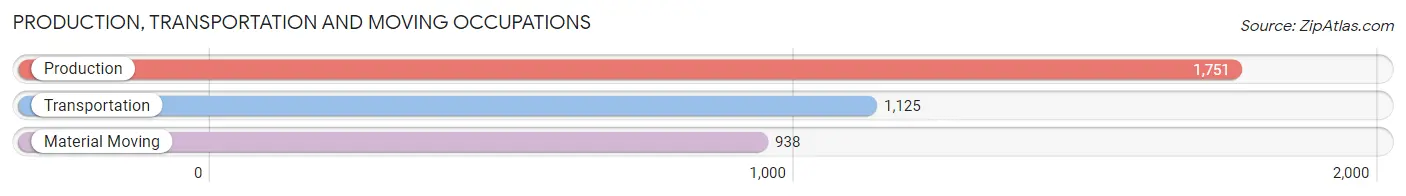
Production, Transportation and Moving Occupations
The most common Production, Transportation and Moving occupations in Le Flore County are Production (1,751 | 9.4%), Transportation (1,125 | 6.0%), and Material Moving (938 | 5.0%).
Production, Transportation and Moving Occupations by Sex
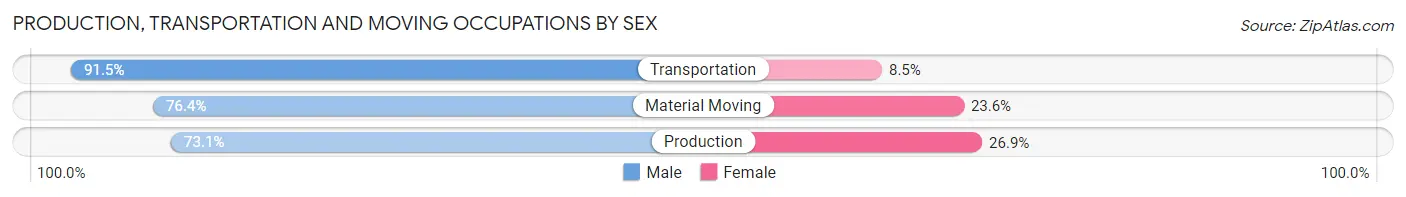
| Occupation | Male | Female |
| Production | 1,280 (73.1%) | 471 (26.9%) |
| Transportation | 1,029 (91.5%) | 96 (8.5%) |
| Material Moving | 717 (76.4%) | 221 (23.6%) |
| Total (Category) | 3,026 (79.3%) | 788 (20.7%) |
| Total (Overall) | 10,058 (53.9%) | 8,607 (46.1%) |
Employment Industries by Sex in Le Flore County
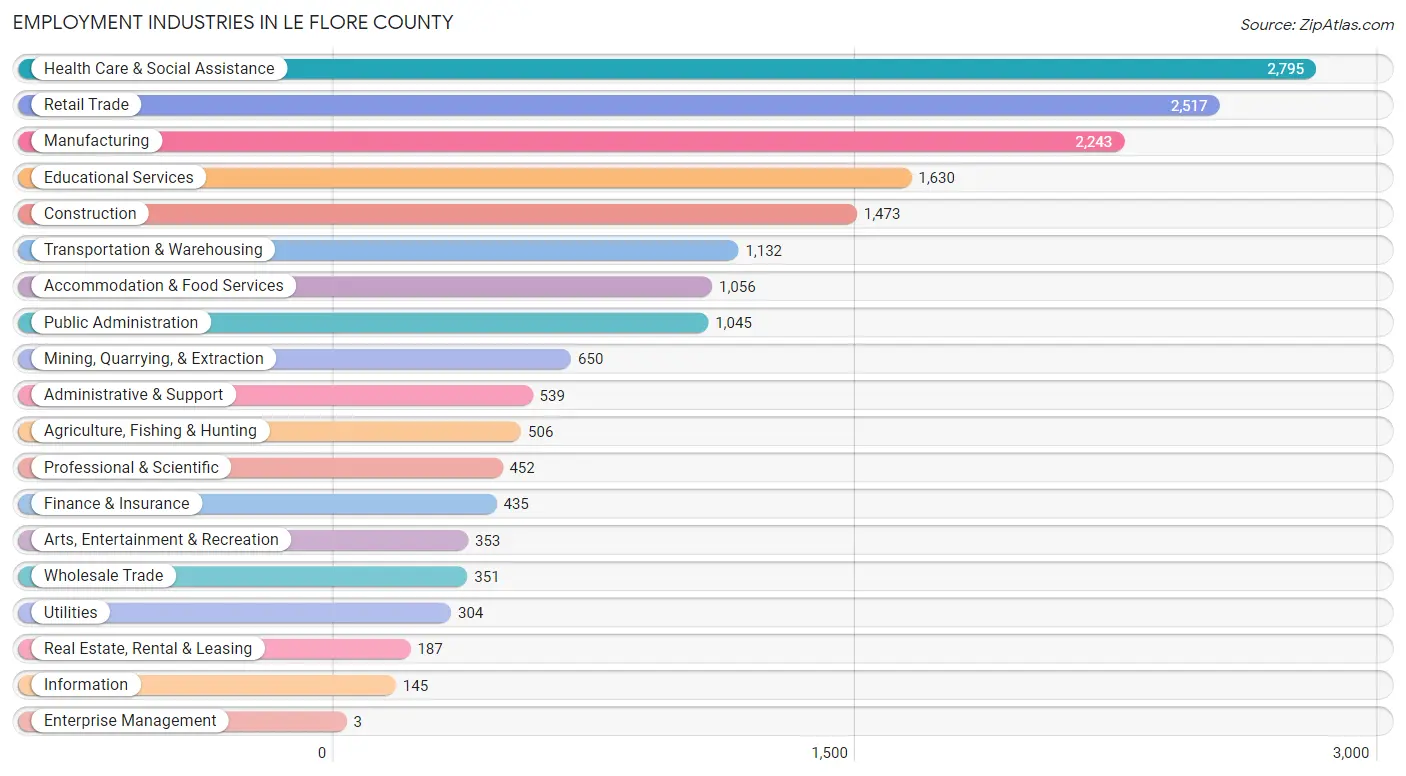
Employment Industries in Le Flore County
The major employment industries in Le Flore County include Health Care & Social Assistance (2,795 | 15.0%), Retail Trade (2,517 | 13.5%), Manufacturing (2,243 | 12.0%), Educational Services (1,630 | 8.7%), and Construction (1,473 | 7.9%).
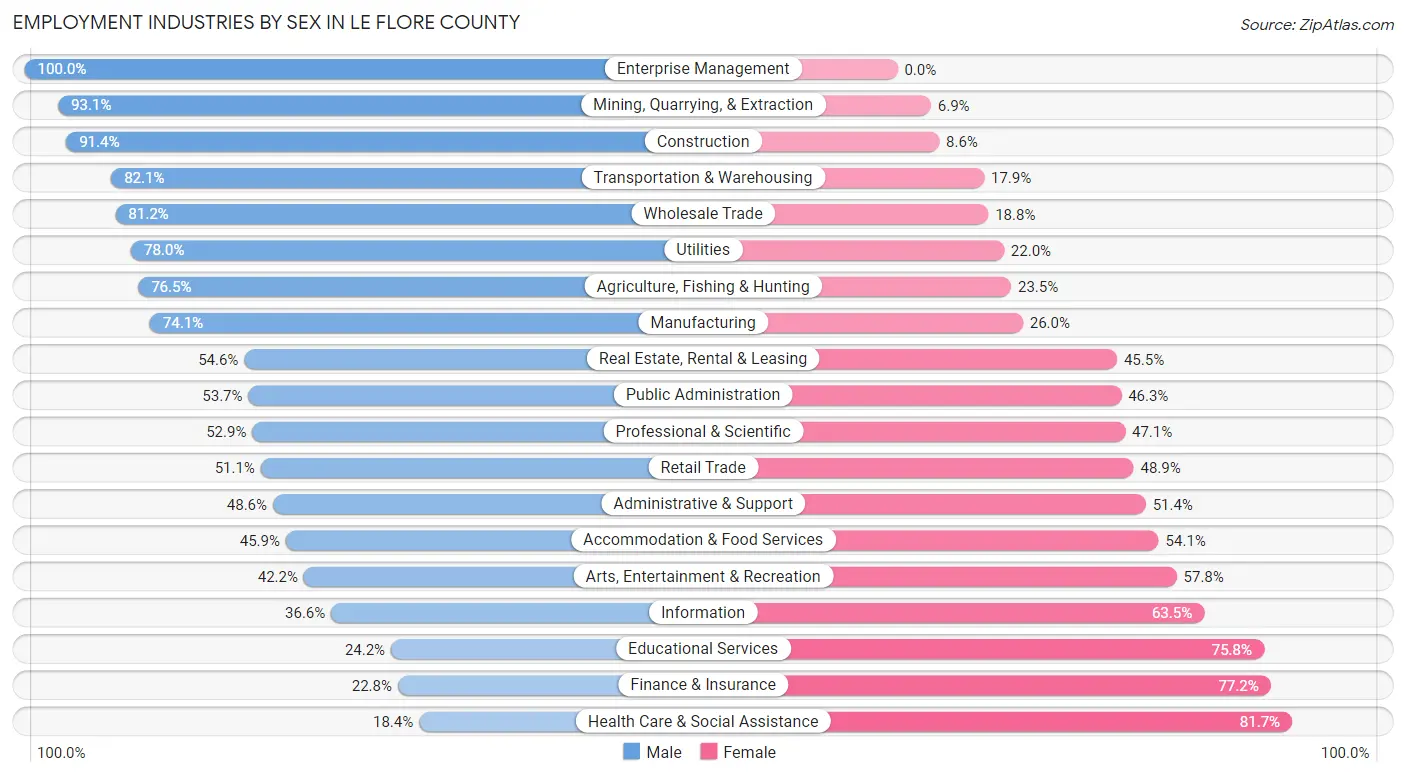
Employment Industries by Sex in Le Flore County
The Le Flore County industries that see more men than women are Enterprise Management (100.0%), Mining, Quarrying, & Extraction (93.1%), and Construction (91.4%), whereas the industries that tend to have a higher number of women are Health Care & Social Assistance (81.7%), Finance & Insurance (77.2%), and Educational Services (75.8%).
| Industry | Male | Female |
| Agriculture, Fishing & Hunting | 387 (76.5%) | 119 (23.5%) |
| Mining, Quarrying, & Extraction | 605 (93.1%) | 45 (6.9%) |
| Construction | 1,346 (91.4%) | 127 (8.6%) |
| Manufacturing | 1,661 (74.1%) | 582 (26.0%) |
| Wholesale Trade | 285 (81.2%) | 66 (18.8%) |
| Retail Trade | 1,287 (51.1%) | 1,230 (48.9%) |
| Transportation & Warehousing | 929 (82.1%) | 203 (17.9%) |
| Utilities | 237 (78.0%) | 67 (22.0%) |
| Information | 53 (36.5%) | 92 (63.4%) |
| Finance & Insurance | 99 (22.8%) | 336 (77.2%) |
| Real Estate, Rental & Leasing | 102 (54.5%) | 85 (45.5%) |
| Professional & Scientific | 239 (52.9%) | 213 (47.1%) |
| Enterprise Management | 3 (100.0%) | 0 (0.0%) |
| Administrative & Support | 262 (48.6%) | 277 (51.4%) |
| Educational Services | 394 (24.2%) | 1,236 (75.8%) |
| Health Care & Social Assistance | 513 (18.3%) | 2,282 (81.7%) |
| Arts, Entertainment & Recreation | 149 (42.2%) | 204 (57.8%) |
| Accommodation & Food Services | 485 (45.9%) | 571 (54.1%) |
| Public Administration | 561 (53.7%) | 484 (46.3%) |
| Total | 10,058 (53.9%) | 8,607 (46.1%) |
Education in Le Flore County
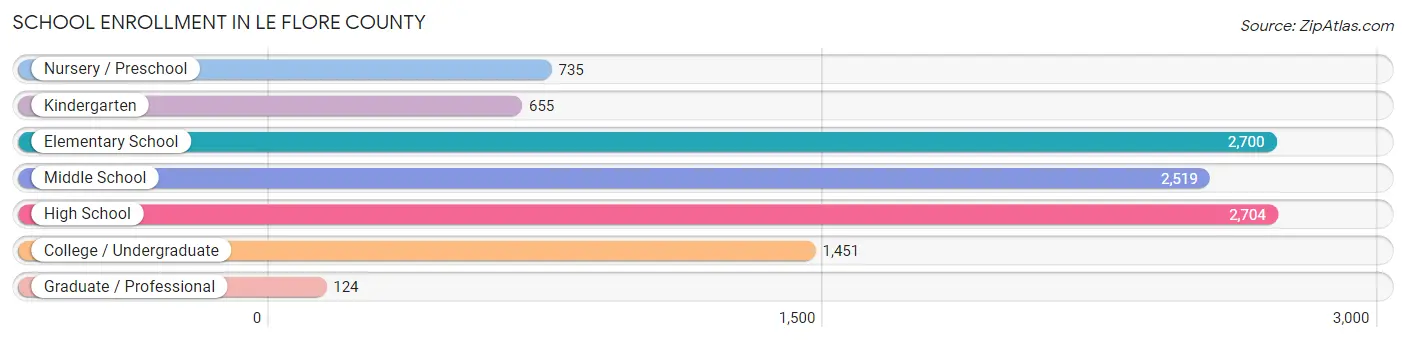
School Enrollment in Le Flore County
The most common levels of schooling among the 10,888 students in Le Flore County are high school (2,704 | 24.8%), elementary school (2,700 | 24.8%), and middle school (2,519 | 23.1%).
| School Level | # Students | % Students |
| Nursery / Preschool | 735 | 6.8% |
| Kindergarten | 655 | 6.0% |
| Elementary School | 2,700 | 24.8% |
| Middle School | 2,519 | 23.1% |
| High School | 2,704 | 24.8% |
| College / Undergraduate | 1,451 | 13.3% |
| Graduate / Professional | 124 | 1.1% |
| Total | 10,888 | 100.0% |
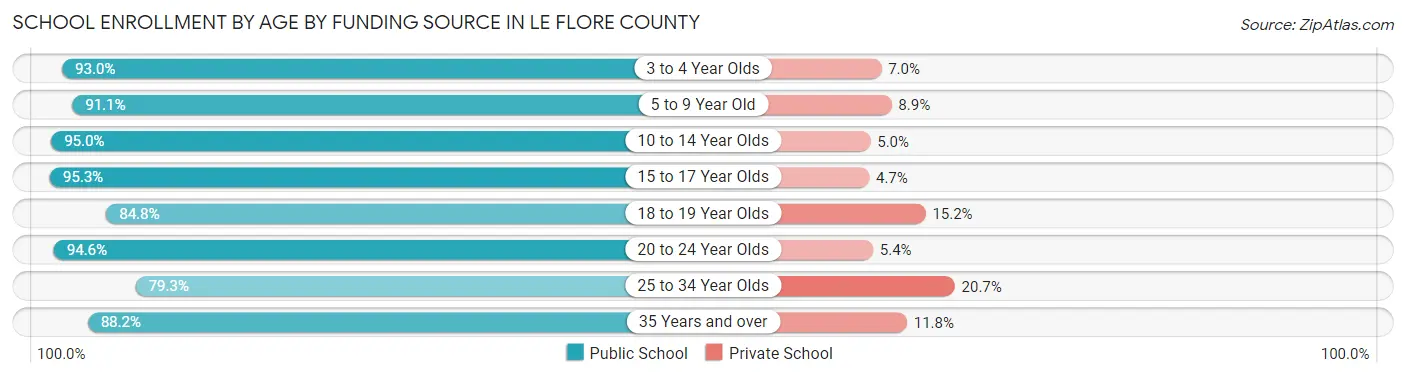
School Enrollment by Age by Funding Source in Le Flore County
Out of a total of 10,888 students who are enrolled in schools in Le Flore County, 838 (7.7%) attend a private institution, while the remaining 10,050 (92.3%) are enrolled in public schools. The age group of 25 to 34 year olds has the highest likelihood of being enrolled in private schools, with 75 (20.7% in the age bracket) enrolled. Conversely, the age group of 15 to 17 year olds has the lowest likelihood of being enrolled in a private school, with 1,796 (95.3% in the age bracket) attending a public institution.
| Age Bracket | Public School | Private School |
| 3 to 4 Year Olds | 519 (93.0%) | 39 (7.0%) |
| 5 to 9 Year Old | 2,697 (91.1%) | 263 (8.9%) |
| 10 to 14 Year Olds | 3,161 (95.0%) | 165 (5.0%) |
| 15 to 17 Year Olds | 1,796 (95.3%) | 89 (4.7%) |
| 18 to 19 Year Olds | 679 (84.8%) | 122 (15.2%) |
| 20 to 24 Year Olds | 539 (94.6%) | 31 (5.4%) |
| 25 to 34 Year Olds | 288 (79.3%) | 75 (20.7%) |
| 35 Years and over | 375 (88.2%) | 50 (11.8%) |
| Total | 10,050 (92.3%) | 838 (7.7%) |
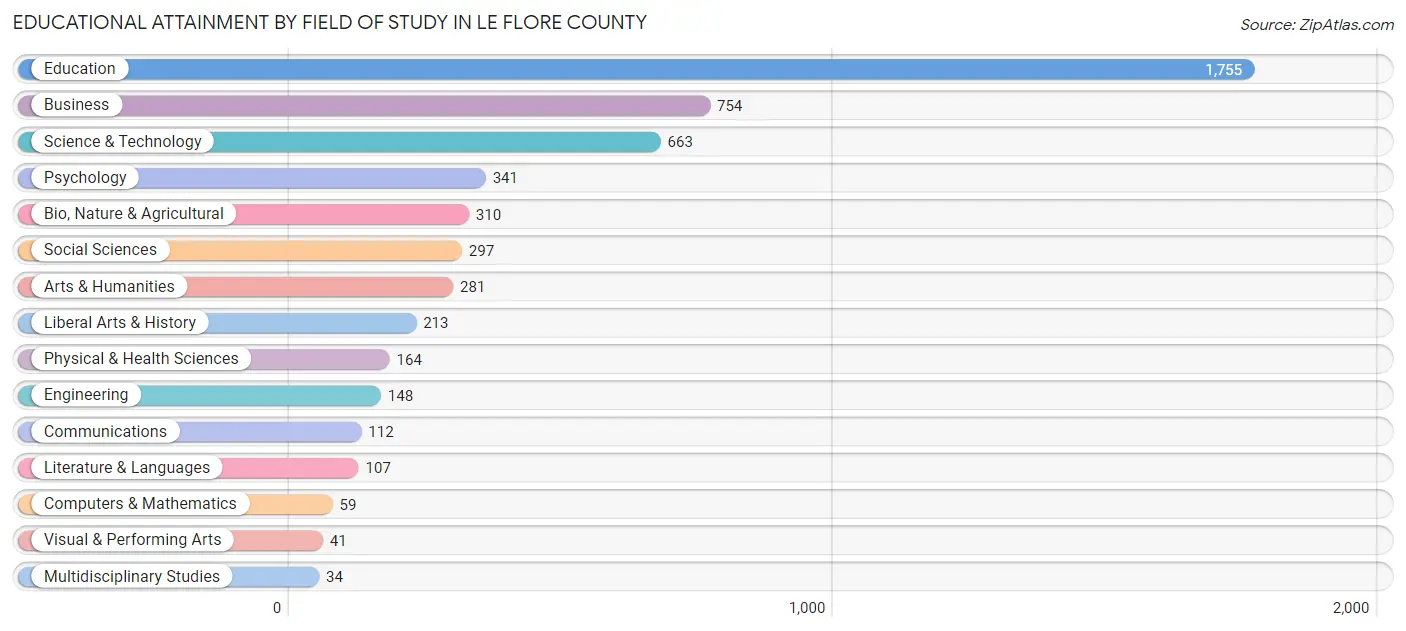
Educational Attainment by Field of Study in Le Flore County
Education (1,755 | 33.2%), business (754 | 14.3%), science & technology (663 | 12.6%), psychology (341 | 6.5%), and bio, nature & agricultural (310 | 5.9%) are the most common fields of study among 5,279 individuals in Le Flore County who have obtained a bachelor's degree or higher.
| Field of Study | # Graduates | % Graduates |
| Computers & Mathematics | 59 | 1.1% |
| Bio, Nature & Agricultural | 310 | 5.9% |
| Physical & Health Sciences | 164 | 3.1% |
| Psychology | 341 | 6.5% |
| Social Sciences | 297 | 5.6% |
| Engineering | 148 | 2.8% |
| Multidisciplinary Studies | 34 | 0.6% |
| Science & Technology | 663 | 12.6% |
| Business | 754 | 14.3% |
| Education | 1,755 | 33.2% |
| Literature & Languages | 107 | 2.0% |
| Liberal Arts & History | 213 | 4.0% |
| Visual & Performing Arts | 41 | 0.8% |
| Communications | 112 | 2.1% |
| Arts & Humanities | 281 | 5.3% |
| Total | 5,279 | 100.0% |
Transportation & Commute in Le Flore County
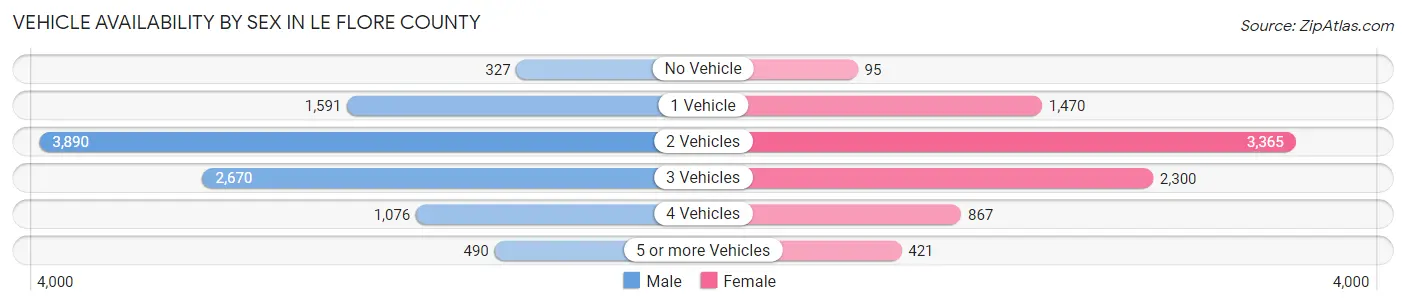
Vehicle Availability by Sex in Le Flore County
The most prevalent vehicle ownership categories in Le Flore County are males with 2 vehicles (3,890, accounting for 38.7%) and females with 2 vehicles (3,365, making up 45.7%).
| Vehicles Available | Male | Female |
| No Vehicle | 327 (3.3%) | 95 (1.1%) |
| 1 Vehicle | 1,591 (15.8%) | 1,470 (17.3%) |
| 2 Vehicles | 3,890 (38.7%) | 3,365 (39.5%) |
| 3 Vehicles | 2,670 (26.6%) | 2,300 (27.0%) |
| 4 Vehicles | 1,076 (10.7%) | 867 (10.2%) |
| 5 or more Vehicles | 490 (4.9%) | 421 (4.9%) |
| Total | 10,044 (100.0%) | 8,518 (100.0%) |
Commute Time in Le Flore County
The most frequently occuring commute durations in Le Flore County are 15 to 19 minutes (2,885 commuters, 16.2%), 5 to 9 minutes (2,633 commuters, 14.8%), and 10 to 14 minutes (2,586 commuters, 14.5%).

| Commute Time | # Commuters | % Commuters |
| Less than 5 Minutes | 754 | 4.2% |
| 5 to 9 Minutes | 2,633 | 14.8% |
| 10 to 14 Minutes | 2,586 | 14.5% |
| 15 to 19 Minutes | 2,885 | 16.2% |
| 20 to 24 Minutes | 2,167 | 12.2% |
| 25 to 29 Minutes | 1,015 | 5.7% |
| 30 to 34 Minutes | 2,021 | 11.4% |
| 35 to 39 Minutes | 650 | 3.6% |
| 40 to 44 Minutes | 693 | 3.9% |
| 45 to 59 Minutes | 1,031 | 5.8% |
| 60 to 89 Minutes | 683 | 3.8% |
| 90 or more Minutes | 680 | 3.8% |
Commute Time by Sex in Le Flore County
The most common commute times in Le Flore County are 15 to 19 minutes (1,495 commuters, 15.4%) for males and 15 to 19 minutes (1,390 commuters, 17.2%) for females.
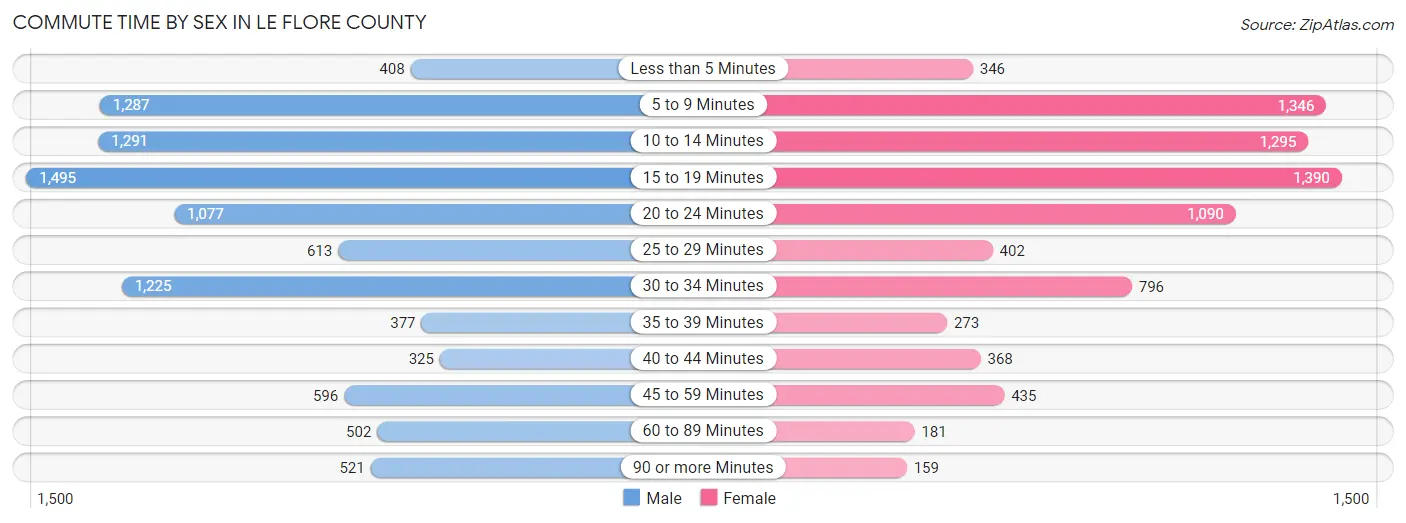
| Commute Time | Male | Female |
| Less than 5 Minutes | 408 (4.2%) | 346 (4.3%) |
| 5 to 9 Minutes | 1,287 (13.2%) | 1,346 (16.7%) |
| 10 to 14 Minutes | 1,291 (13.3%) | 1,295 (16.0%) |
| 15 to 19 Minutes | 1,495 (15.4%) | 1,390 (17.2%) |
| 20 to 24 Minutes | 1,077 (11.1%) | 1,090 (13.5%) |
| 25 to 29 Minutes | 613 (6.3%) | 402 (5.0%) |
| 30 to 34 Minutes | 1,225 (12.6%) | 796 (9.9%) |
| 35 to 39 Minutes | 377 (3.9%) | 273 (3.4%) |
| 40 to 44 Minutes | 325 (3.3%) | 368 (4.5%) |
| 45 to 59 Minutes | 596 (6.1%) | 435 (5.4%) |
| 60 to 89 Minutes | 502 (5.2%) | 181 (2.2%) |
| 90 or more Minutes | 521 (5.4%) | 159 (2.0%) |
Time of Departure to Work by Sex in Le Flore County
The most frequent times of departure to work in Le Flore County are 7:00 AM to 7:29 AM (1,789, 18.4%) for males and 7:00 AM to 7:29 AM (1,618, 20.0%) for females.
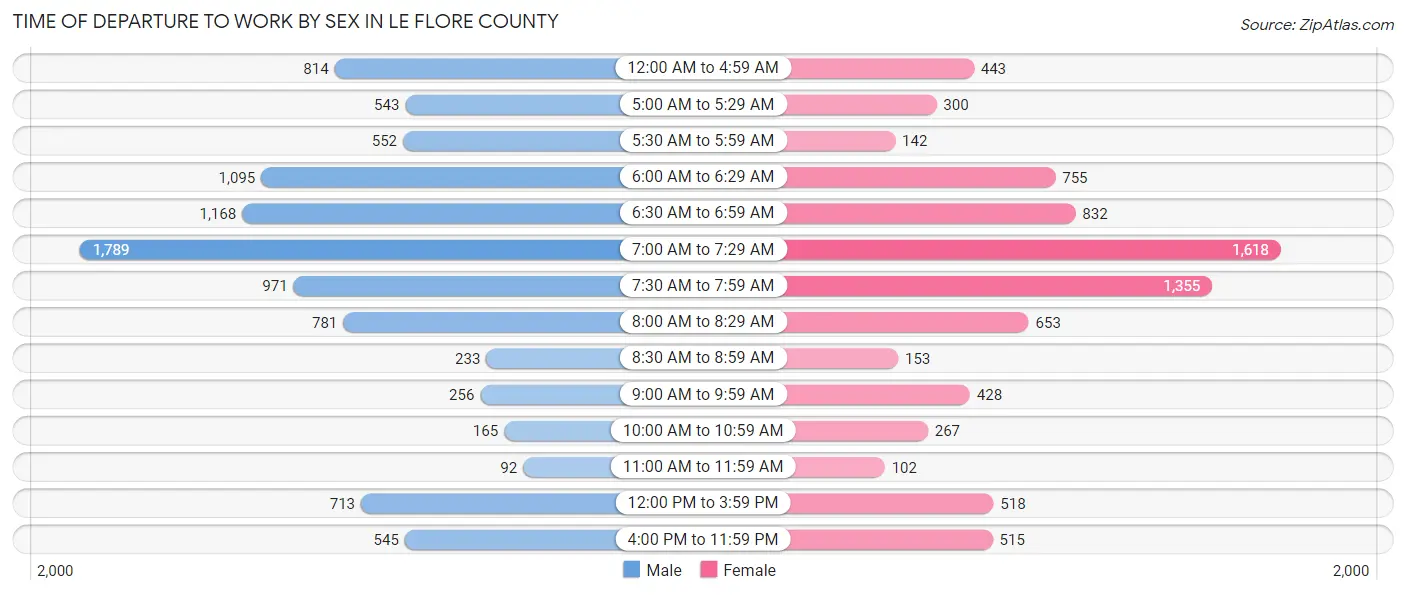
| Time of Departure | Male | Female |
| 12:00 AM to 4:59 AM | 814 (8.4%) | 443 (5.5%) |
| 5:00 AM to 5:29 AM | 543 (5.6%) | 300 (3.7%) |
| 5:30 AM to 5:59 AM | 552 (5.7%) | 142 (1.8%) |
| 6:00 AM to 6:29 AM | 1,095 (11.3%) | 755 (9.3%) |
| 6:30 AM to 6:59 AM | 1,168 (12.0%) | 832 (10.3%) |
| 7:00 AM to 7:29 AM | 1,789 (18.4%) | 1,618 (20.0%) |
| 7:30 AM to 7:59 AM | 971 (10.0%) | 1,355 (16.8%) |
| 8:00 AM to 8:29 AM | 781 (8.0%) | 653 (8.1%) |
| 8:30 AM to 8:59 AM | 233 (2.4%) | 153 (1.9%) |
| 9:00 AM to 9:59 AM | 256 (2.6%) | 428 (5.3%) |
| 10:00 AM to 10:59 AM | 165 (1.7%) | 267 (3.3%) |
| 11:00 AM to 11:59 AM | 92 (0.9%) | 102 (1.3%) |
| 12:00 PM to 3:59 PM | 713 (7.3%) | 518 (6.4%) |
| 4:00 PM to 11:59 PM | 545 (5.6%) | 515 (6.4%) |
| Total | 9,717 (100.0%) | 8,081 (100.0%) |
Housing Occupancy in Le Flore County
Occupancy by Ownership in Le Flore County
Of the total 17,835 dwellings in Le Flore County, owner-occupied units account for 12,643 (70.9%), while renter-occupied units make up 5,192 (29.1%).
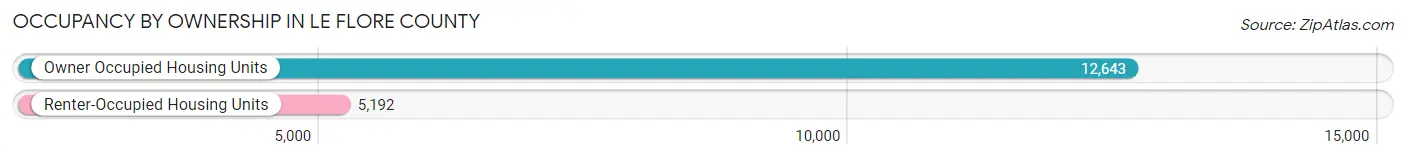
| Occupancy | # Housing Units | % Housing Units |
| Owner Occupied Housing Units | 12,643 | 70.9% |
| Renter-Occupied Housing Units | 5,192 | 29.1% |
| Total Occupied Housing Units | 17,835 | 100.0% |
Occupancy by Household Size in Le Flore County
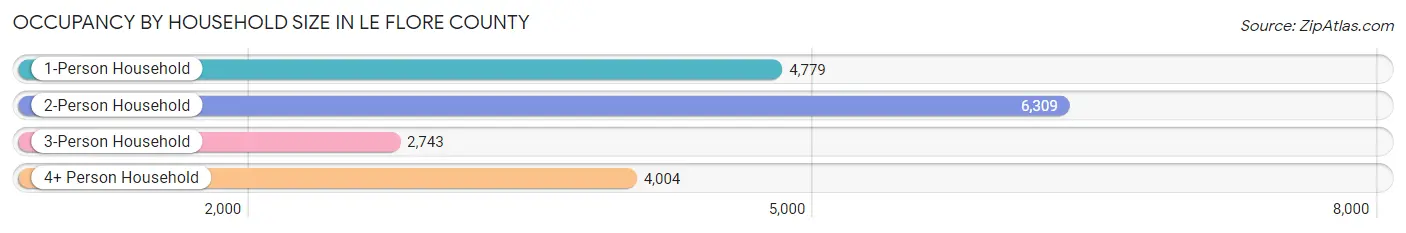
| Household Size | # Housing Units | % Housing Units |
| 1-Person Household | 4,779 | 26.8% |
| 2-Person Household | 6,309 | 35.4% |
| 3-Person Household | 2,743 | 15.4% |
| 4+ Person Household | 4,004 | 22.5% |
| Total Housing Units | 17,835 | 100.0% |
Occupancy by Ownership by Household Size in Le Flore County
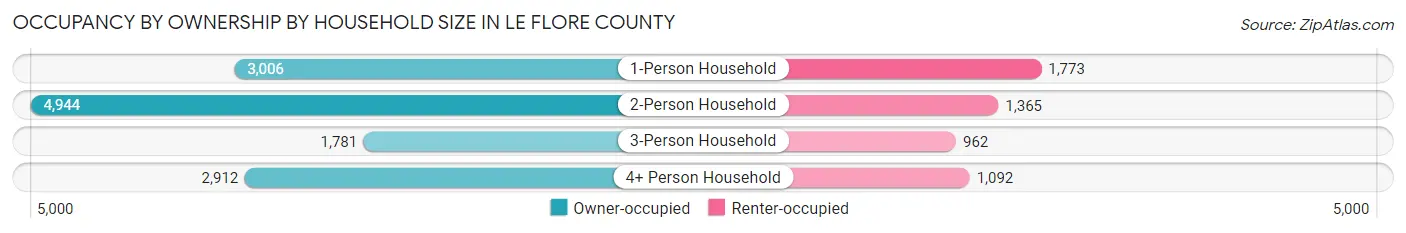
| Household Size | Owner-occupied | Renter-occupied |
| 1-Person Household | 3,006 (62.9%) | 1,773 (37.1%) |
| 2-Person Household | 4,944 (78.4%) | 1,365 (21.6%) |
| 3-Person Household | 1,781 (64.9%) | 962 (35.1%) |
| 4+ Person Household | 2,912 (72.7%) | 1,092 (27.3%) |
| Total Housing Units | 12,643 (70.9%) | 5,192 (29.1%) |
Occupancy by Educational Attainment in Le Flore County
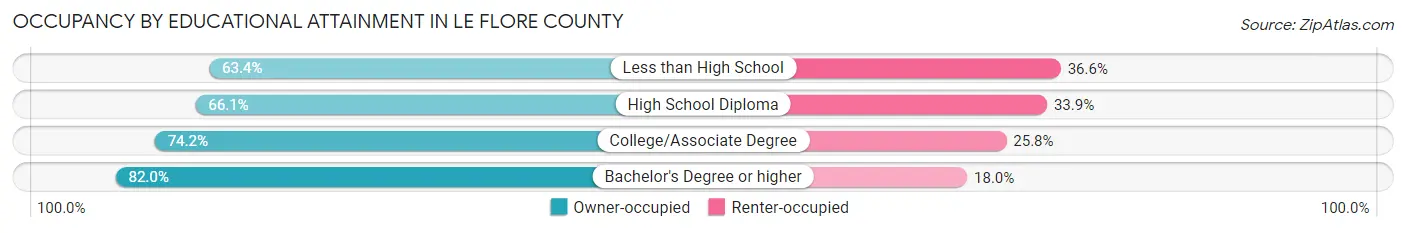
| Household Size | Owner-occupied | Renter-occupied |
| Less than High School | 1,646 (63.4%) | 950 (36.6%) |
| High School Diploma | 4,344 (66.1%) | 2,225 (33.9%) |
| College/Associate Degree | 4,326 (74.2%) | 1,505 (25.8%) |
| Bachelor's Degree or higher | 2,327 (82.0%) | 512 (18.0%) |
Occupancy by Age of Householder in Le Flore County
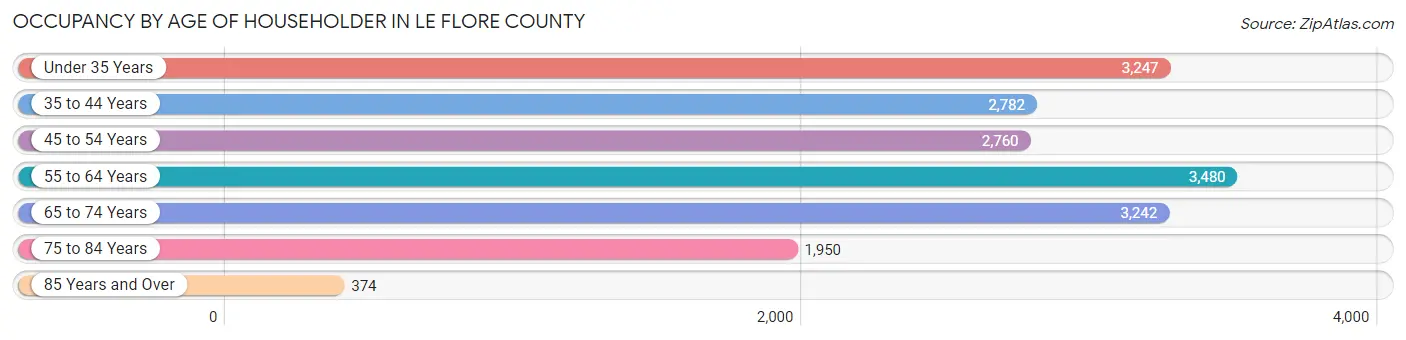
| Age Bracket | # Households | % Households |
| Under 35 Years | 3,247 | 18.2% |
| 35 to 44 Years | 2,782 | 15.6% |
| 45 to 54 Years | 2,760 | 15.5% |
| 55 to 64 Years | 3,480 | 19.5% |
| 65 to 74 Years | 3,242 | 18.2% |
| 75 to 84 Years | 1,950 | 10.9% |
| 85 Years and Over | 374 | 2.1% |
| Total | 17,835 | 100.0% |
Housing Finances in Le Flore County
Median Income by Occupancy in Le Flore County
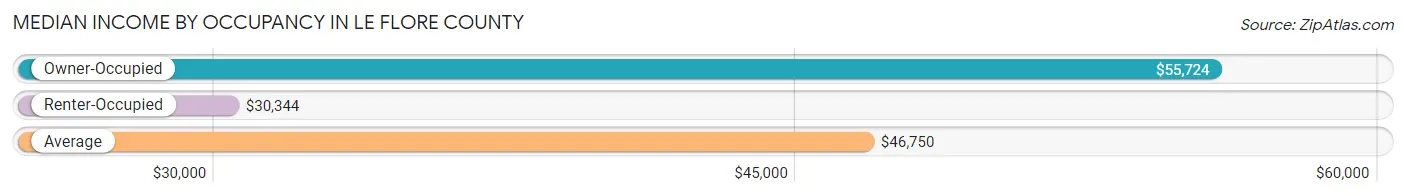
| Occupancy Type | # Households | Median Income |
| Owner-Occupied | 12,643 (70.9%) | $55,724 |
| Renter-Occupied | 5,192 (29.1%) | $30,344 |
| Average | 17,835 (100.0%) | $46,750 |
Occupancy by Householder Income Bracket in Le Flore County
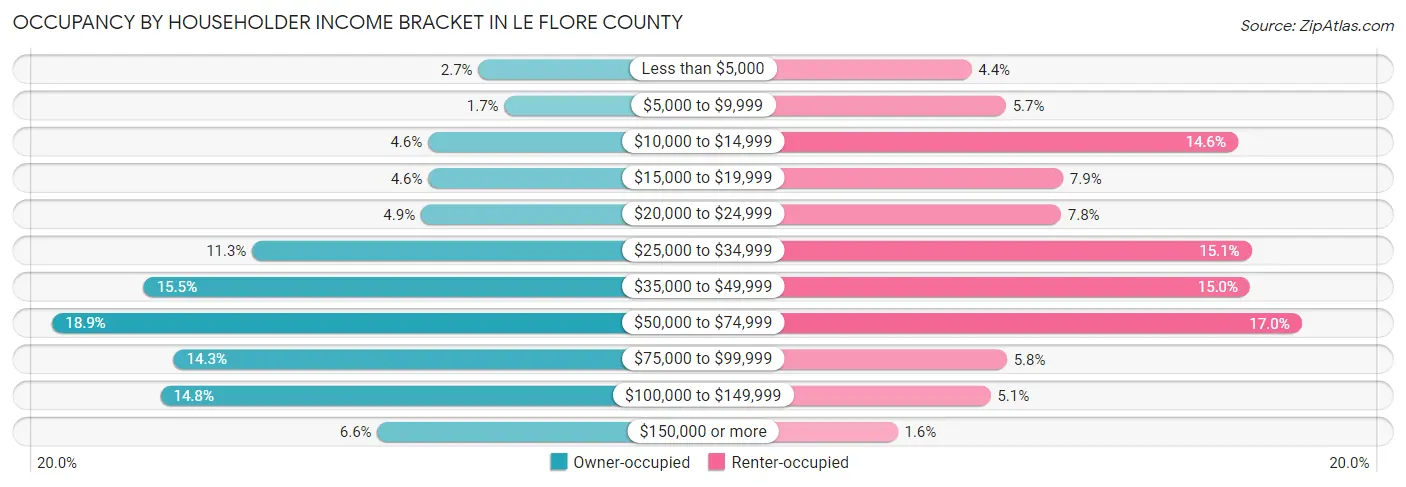
| Income Bracket | Owner-occupied | Renter-occupied |
| Less than $5,000 | 342 (2.7%) | 229 (4.4%) |
| $5,000 to $9,999 | 218 (1.7%) | 297 (5.7%) |
| $10,000 to $14,999 | 585 (4.6%) | 756 (14.6%) |
| $15,000 to $19,999 | 584 (4.6%) | 410 (7.9%) |
| $20,000 to $24,999 | 619 (4.9%) | 406 (7.8%) |
| $25,000 to $34,999 | 1,432 (11.3%) | 783 (15.1%) |
| $35,000 to $49,999 | 1,955 (15.5%) | 780 (15.0%) |
| $50,000 to $74,999 | 2,394 (18.9%) | 882 (17.0%) |
| $75,000 to $99,999 | 1,810 (14.3%) | 299 (5.8%) |
| $100,000 to $149,999 | 1,874 (14.8%) | 267 (5.1%) |
| $150,000 or more | 830 (6.6%) | 83 (1.6%) |
| Total | 12,643 (100.0%) | 5,192 (100.0%) |
Monthly Housing Cost Tiers in Le Flore County
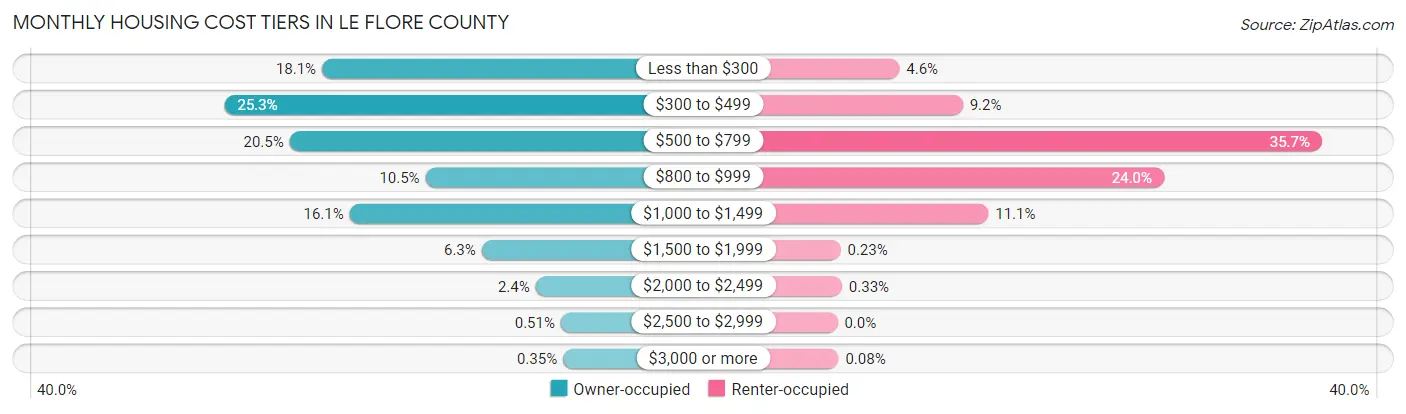
| Monthly Cost | Owner-occupied | Renter-occupied |
| Less than $300 | 2,288 (18.1%) | 237 (4.6%) |
| $300 to $499 | 3,198 (25.3%) | 479 (9.2%) |
| $500 to $799 | 2,591 (20.5%) | 1,852 (35.7%) |
| $800 to $999 | 1,325 (10.5%) | 1,248 (24.0%) |
| $1,000 to $1,499 | 2,032 (16.1%) | 577 (11.1%) |
| $1,500 to $1,999 | 801 (6.3%) | 12 (0.2%) |
| $2,000 to $2,499 | 300 (2.4%) | 17 (0.3%) |
| $2,500 to $2,999 | 64 (0.5%) | 0 (0.0%) |
| $3,000 or more | 44 (0.4%) | 4 (0.1%) |
| Total | 12,643 (100.0%) | 5,192 (100.0%) |
Physical Housing Characteristics in Le Flore County
Housing Structures in Le Flore County
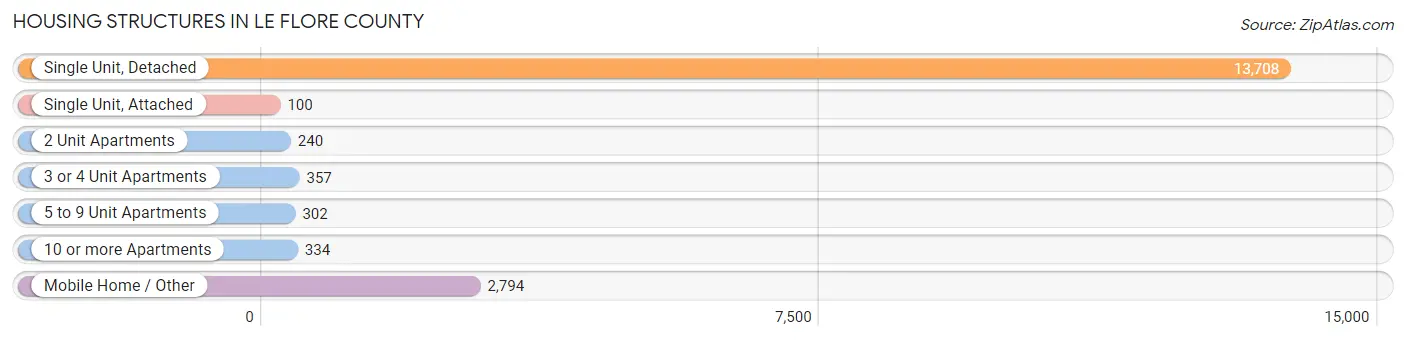
| Structure Type | # Housing Units | % Housing Units |
| Single Unit, Detached | 13,708 | 76.9% |
| Single Unit, Attached | 100 | 0.6% |
| 2 Unit Apartments | 240 | 1.3% |
| 3 or 4 Unit Apartments | 357 | 2.0% |
| 5 to 9 Unit Apartments | 302 | 1.7% |
| 10 or more Apartments | 334 | 1.9% |
| Mobile Home / Other | 2,794 | 15.7% |
| Total | 17,835 | 100.0% |
Housing Structures by Occupancy in Le Flore County
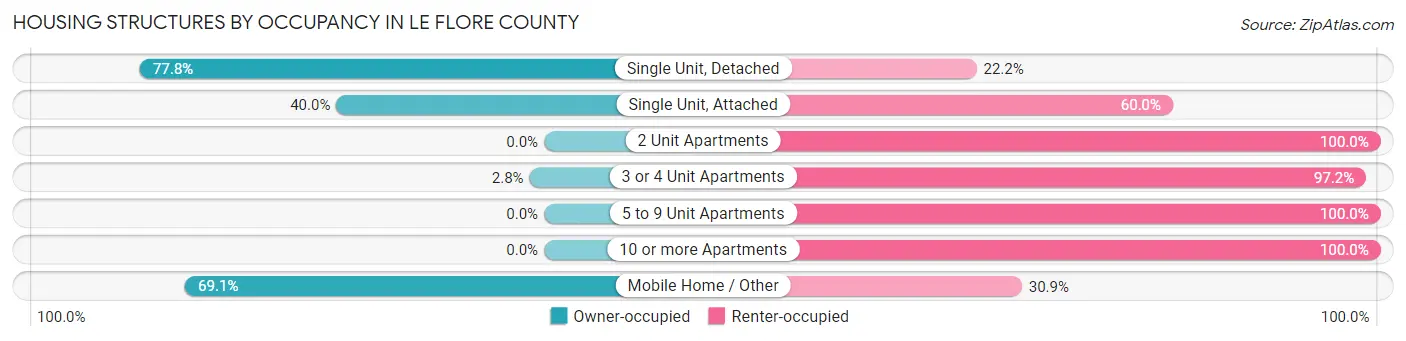
| Structure Type | Owner-occupied | Renter-occupied |
| Single Unit, Detached | 10,663 (77.8%) | 3,045 (22.2%) |
| Single Unit, Attached | 40 (40.0%) | 60 (60.0%) |
| 2 Unit Apartments | 0 (0.0%) | 240 (100.0%) |
| 3 or 4 Unit Apartments | 10 (2.8%) | 347 (97.2%) |
| 5 to 9 Unit Apartments | 0 (0.0%) | 302 (100.0%) |
| 10 or more Apartments | 0 (0.0%) | 334 (100.0%) |
| Mobile Home / Other | 1,930 (69.1%) | 864 (30.9%) |
| Total | 12,643 (70.9%) | 5,192 (29.1%) |
Housing Structures by Number of Rooms in Le Flore County
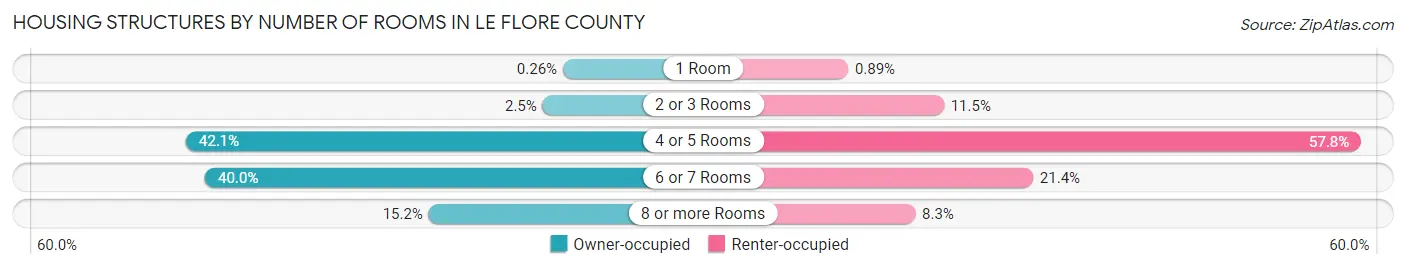
| Number of Rooms | Owner-occupied | Renter-occupied |
| 1 Room | 33 (0.3%) | 46 (0.9%) |
| 2 or 3 Rooms | 317 (2.5%) | 598 (11.5%) |
| 4 or 5 Rooms | 5,323 (42.1%) | 3,003 (57.8%) |
| 6 or 7 Rooms | 5,054 (40.0%) | 1,112 (21.4%) |
| 8 or more Rooms | 1,916 (15.1%) | 433 (8.3%) |
| Total | 12,643 (100.0%) | 5,192 (100.0%) |
Housing Structure by Heating Type in Le Flore County
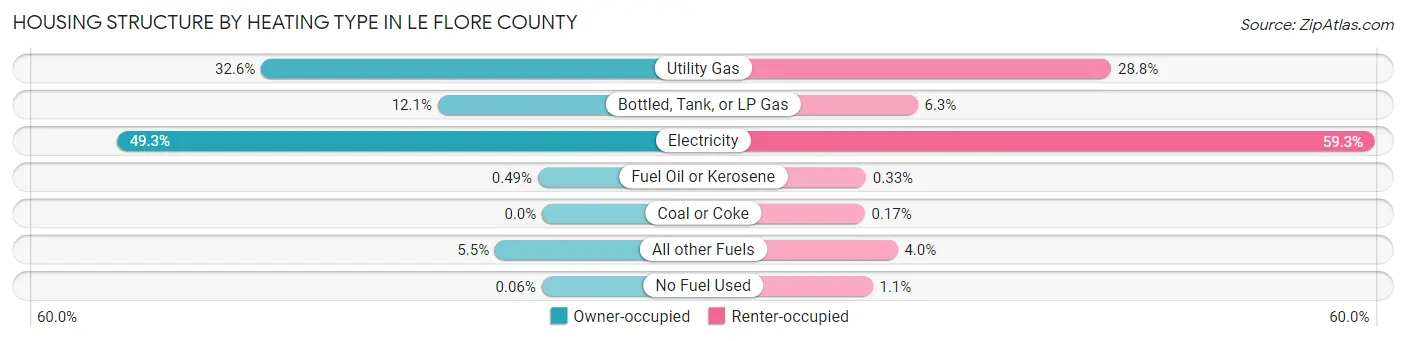
| Heating Type | Owner-occupied | Renter-occupied |
| Utility Gas | 4,119 (32.6%) | 1,493 (28.8%) |
| Bottled, Tank, or LP Gas | 1,530 (12.1%) | 328 (6.3%) |
| Electricity | 6,235 (49.3%) | 3,081 (59.3%) |
| Fuel Oil or Kerosene | 62 (0.5%) | 17 (0.3%) |
| Coal or Coke | 0 (0.0%) | 9 (0.2%) |
| All other Fuels | 690 (5.5%) | 207 (4.0%) |
| No Fuel Used | 7 (0.1%) | 57 (1.1%) |
| Total | 12,643 (100.0%) | 5,192 (100.0%) |
Household Vehicle Usage in Le Flore County
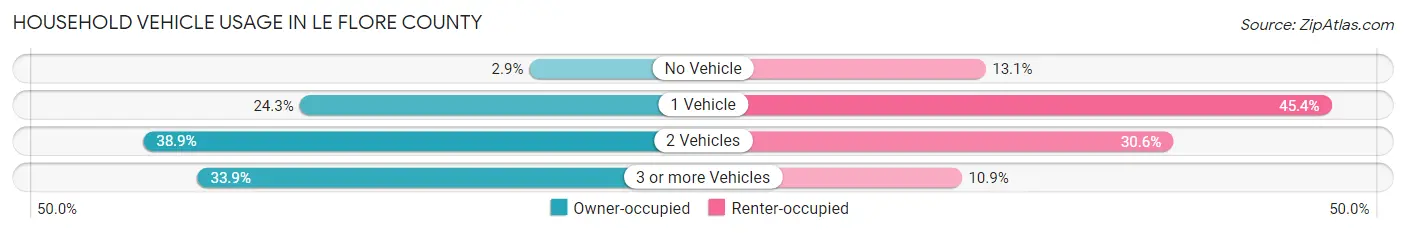
| Vehicles per Household | Owner-occupied | Renter-occupied |
| No Vehicle | 365 (2.9%) | 680 (13.1%) |
| 1 Vehicle | 3,077 (24.3%) | 2,357 (45.4%) |
| 2 Vehicles | 4,921 (38.9%) | 1,590 (30.6%) |
| 3 or more Vehicles | 4,280 (33.9%) | 565 (10.9%) |
| Total | 12,643 (100.0%) | 5,192 (100.0%) |
Real Estate & Mortgages in Le Flore County
Real Estate and Mortgage Overview in Le Flore County
| Characteristic | Without Mortgage | With Mortgage |
| Housing Units | 6,948 | 5,695 |
| Median Property Value | $94,500 | $134,000 |
| Median Household Income | $46,523 | $528 |
| Monthly Housing Costs | $375 | $44 |
| Real Estate Taxes | $583 | $346 |
Property Value by Mortgage Status in Le Flore County
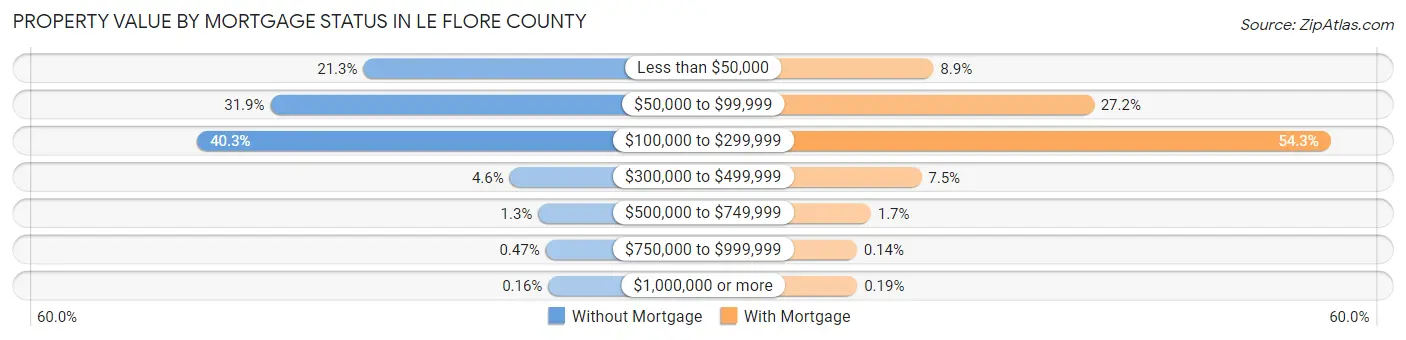
| Property Value | Without Mortgage | With Mortgage |
| Less than $50,000 | 1,479 (21.3%) | 507 (8.9%) |
| $50,000 to $99,999 | 2,218 (31.9%) | 1,550 (27.2%) |
| $100,000 to $299,999 | 2,798 (40.3%) | 3,092 (54.3%) |
| $300,000 to $499,999 | 318 (4.6%) | 428 (7.5%) |
| $500,000 to $749,999 | 91 (1.3%) | 99 (1.7%) |
| $750,000 to $999,999 | 33 (0.5%) | 8 (0.1%) |
| $1,000,000 or more | 11 (0.2%) | 11 (0.2%) |
| Total | 6,948 (100.0%) | 5,695 (100.0%) |
Household Income by Mortgage Status in Le Flore County
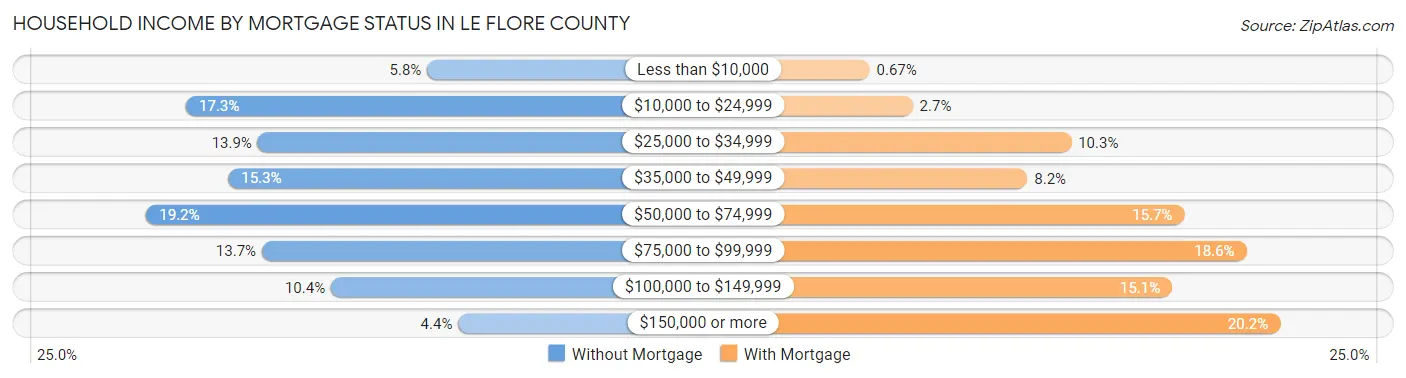
| Household Income | Without Mortgage | With Mortgage |
| Less than $10,000 | 405 (5.8%) | 38 (0.7%) |
| $10,000 to $24,999 | 1,203 (17.3%) | 155 (2.7%) |
| $25,000 to $34,999 | 966 (13.9%) | 585 (10.3%) |
| $35,000 to $49,999 | 1,063 (15.3%) | 466 (8.2%) |
| $50,000 to $74,999 | 1,334 (19.2%) | 892 (15.7%) |
| $75,000 to $99,999 | 952 (13.7%) | 1,060 (18.6%) |
| $100,000 to $149,999 | 723 (10.4%) | 858 (15.1%) |
| $150,000 or more | 302 (4.3%) | 1,151 (20.2%) |
| Total | 6,948 (100.0%) | 5,695 (100.0%) |
Property Value to Household Income Ratio in Le Flore County
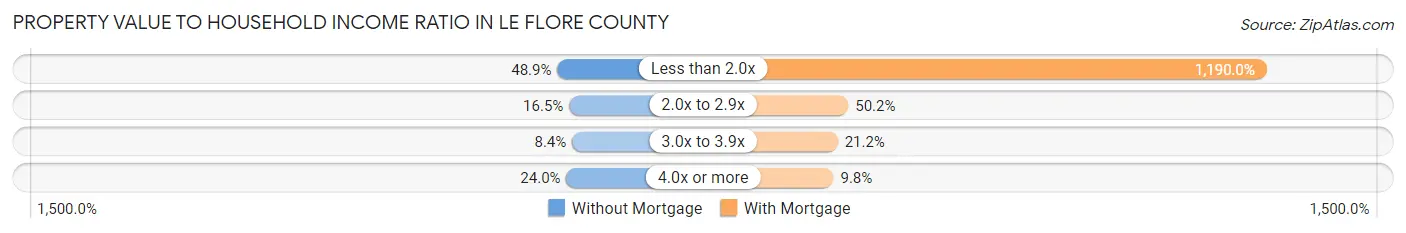
| Value-to-Income Ratio | Without Mortgage | With Mortgage |
| Less than 2.0x | 3,397 (48.9%) | 67,768 (1,190.0%) |
| 2.0x to 2.9x | 1,147 (16.5%) | 2,857 (50.2%) |
| 3.0x to 3.9x | 586 (8.4%) | 1,206 (21.2%) |
| 4.0x or more | 1,667 (24.0%) | 558 (9.8%) |
| Total | 6,948 (100.0%) | 5,695 (100.0%) |
Real Estate Taxes by Mortgage Status in Le Flore County
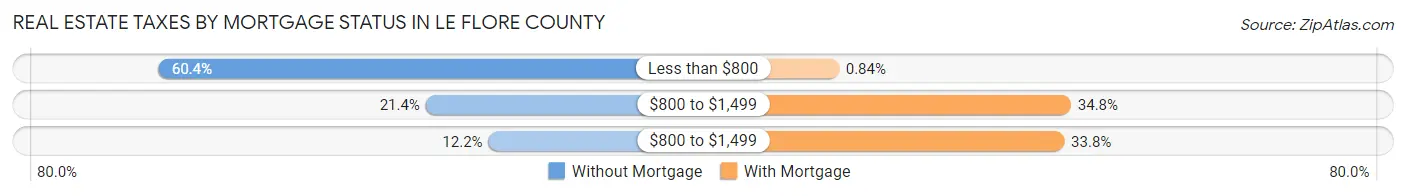
| Property Taxes | Without Mortgage | With Mortgage |
| Less than $800 | 4,195 (60.4%) | 48 (0.8%) |
| $800 to $1,499 | 1,486 (21.4%) | 1,979 (34.7%) |
| $800 to $1,499 | 850 (12.2%) | 1,923 (33.8%) |
| Total | 6,948 (100.0%) | 5,695 (100.0%) |
Health & Disability in Le Flore County
Health Insurance Coverage by Age in Le Flore County
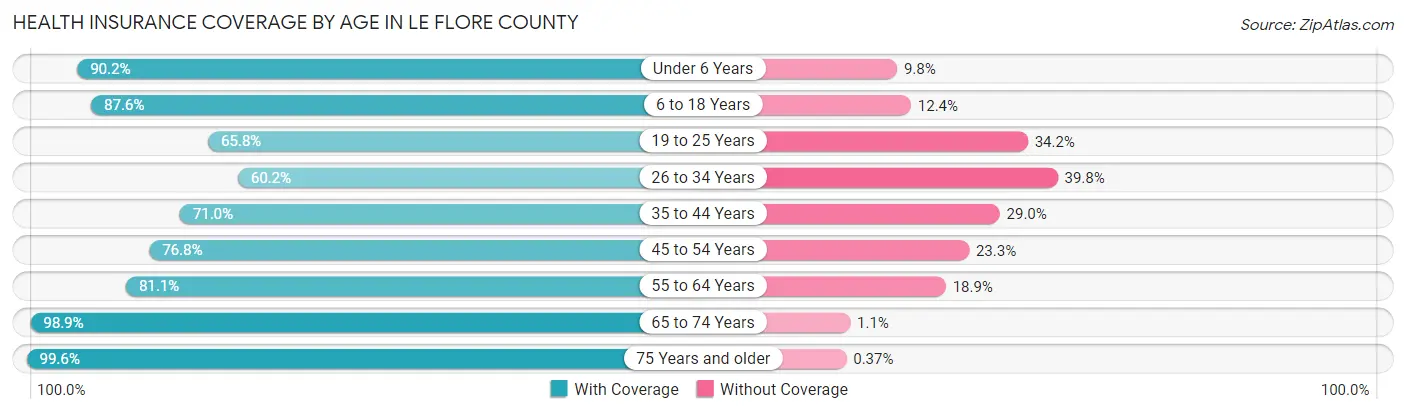
| Age Bracket | With Coverage | Without Coverage |
| Under 6 Years | 3,297 (90.2%) | 359 (9.8%) |
| 6 to 18 Years | 7,671 (87.6%) | 1,087 (12.4%) |
| 19 to 25 Years | 2,620 (65.8%) | 1,362 (34.2%) |
| 26 to 34 Years | 3,061 (60.2%) | 2,020 (39.8%) |
| 35 to 44 Years | 3,929 (71.0%) | 1,602 (29.0%) |
| 45 to 54 Years | 4,304 (76.7%) | 1,304 (23.3%) |
| 55 to 64 Years | 5,029 (81.1%) | 1,173 (18.9%) |
| 65 to 74 Years | 5,020 (98.9%) | 55 (1.1%) |
| 75 Years and older | 3,244 (99.6%) | 12 (0.4%) |
| Total | 38,175 (81.0%) | 8,974 (19.0%) |
Health Insurance Coverage by Citizenship Status in Le Flore County
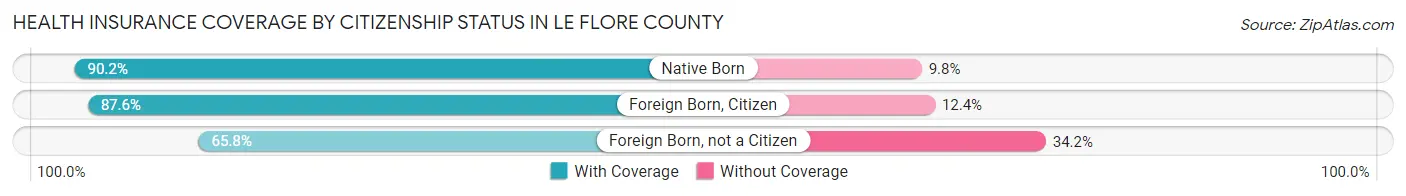
| Citizenship Status | With Coverage | Without Coverage |
| Native Born | 3,297 (90.2%) | 359 (9.8%) |
| Foreign Born, Citizen | 7,671 (87.6%) | 1,087 (12.4%) |
| Foreign Born, not a Citizen | 2,620 (65.8%) | 1,362 (34.2%) |
Health Insurance Coverage by Household Income in Le Flore County
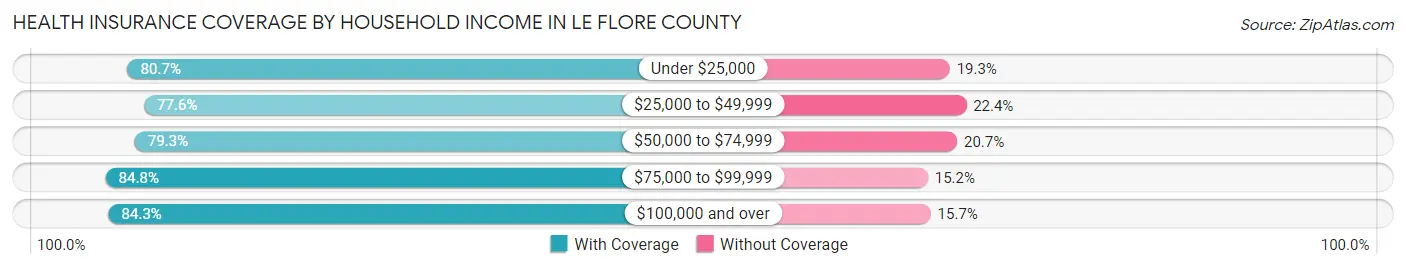
| Household Income | With Coverage | Without Coverage |
| Under $25,000 | 6,869 (80.7%) | 1,641 (19.3%) |
| $25,000 to $49,999 | 9,381 (77.6%) | 2,703 (22.4%) |
| $50,000 to $74,999 | 7,446 (79.3%) | 1,939 (20.7%) |
| $75,000 to $99,999 | 5,516 (84.8%) | 987 (15.2%) |
| $100,000 and over | 8,738 (84.3%) | 1,629 (15.7%) |
Public vs Private Health Insurance Coverage by Age in Le Flore County
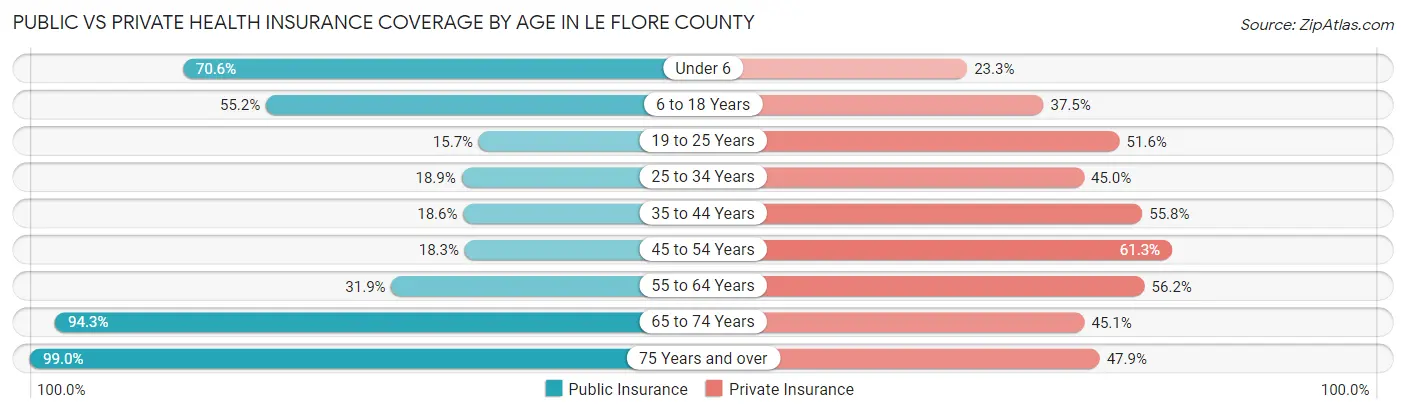
| Age Bracket | Public Insurance | Private Insurance |
| Under 6 | 2,582 (70.6%) | 851 (23.3%) |
| 6 to 18 Years | 4,833 (55.2%) | 3,280 (37.4%) |
| 19 to 25 Years | 624 (15.7%) | 2,054 (51.6%) |
| 25 to 34 Years | 960 (18.9%) | 2,285 (45.0%) |
| 35 to 44 Years | 1,027 (18.6%) | 3,085 (55.8%) |
| 45 to 54 Years | 1,026 (18.3%) | 3,436 (61.3%) |
| 55 to 64 Years | 1,979 (31.9%) | 3,487 (56.2%) |
| 65 to 74 Years | 4,787 (94.3%) | 2,287 (45.1%) |
| 75 Years and over | 3,222 (99.0%) | 1,559 (47.9%) |
| Total | 21,040 (44.6%) | 22,324 (47.3%) |
Disability Status by Sex by Age in Le Flore County
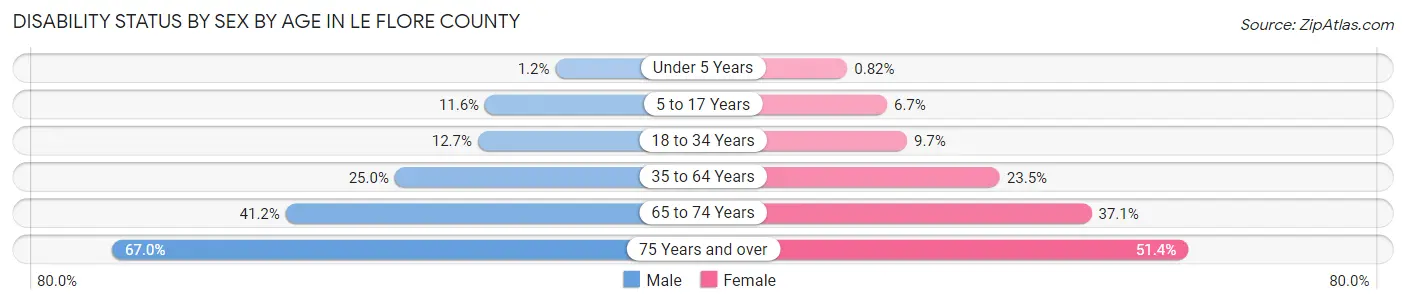
| Age Bracket | Male | Female |
| Under 5 Years | 18 (1.2%) | 12 (0.8%) |
| 5 to 17 Years | 518 (11.6%) | 288 (6.7%) |
| 18 to 34 Years | 643 (12.7%) | 457 (9.7%) |
| 35 to 64 Years | 2,161 (25.0%) | 2,045 (23.5%) |
| 65 to 74 Years | 1,010 (41.2%) | 974 (37.1%) |
| 75 Years and over | 937 (67.0%) | 955 (51.4%) |
Disability Class by Sex by Age in Le Flore County
Disability Class: Hearing Difficulty
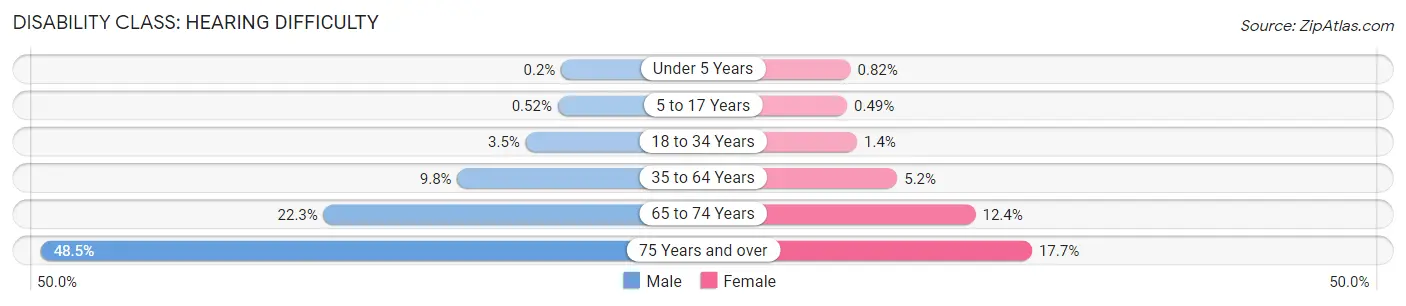
| Age Bracket | Male | Female |
| Under 5 Years | 3 (0.2%) | 12 (0.8%) |
| 5 to 17 Years | 23 (0.5%) | 21 (0.5%) |
| 18 to 34 Years | 177 (3.5%) | 67 (1.4%) |
| 35 to 64 Years | 848 (9.8%) | 449 (5.1%) |
| 65 to 74 Years | 545 (22.3%) | 326 (12.4%) |
| 75 Years and over | 678 (48.5%) | 328 (17.6%) |
Disability Class: Vision Difficulty
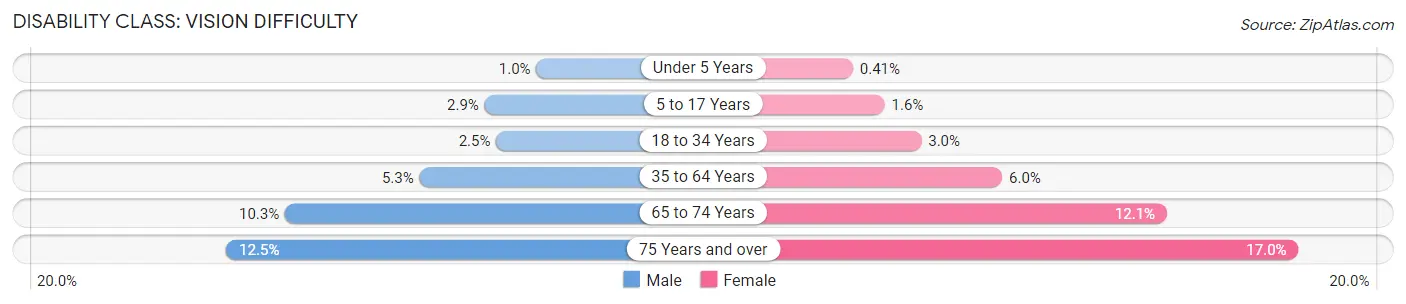
| Age Bracket | Male | Female |
| Under 5 Years | 15 (1.0%) | 6 (0.4%) |
| 5 to 17 Years | 130 (2.9%) | 68 (1.6%) |
| 18 to 34 Years | 126 (2.5%) | 139 (2.9%) |
| 35 to 64 Years | 461 (5.3%) | 518 (5.9%) |
| 65 to 74 Years | 253 (10.3%) | 317 (12.1%) |
| 75 Years and over | 175 (12.5%) | 315 (17.0%) |
Disability Class: Cognitive Difficulty
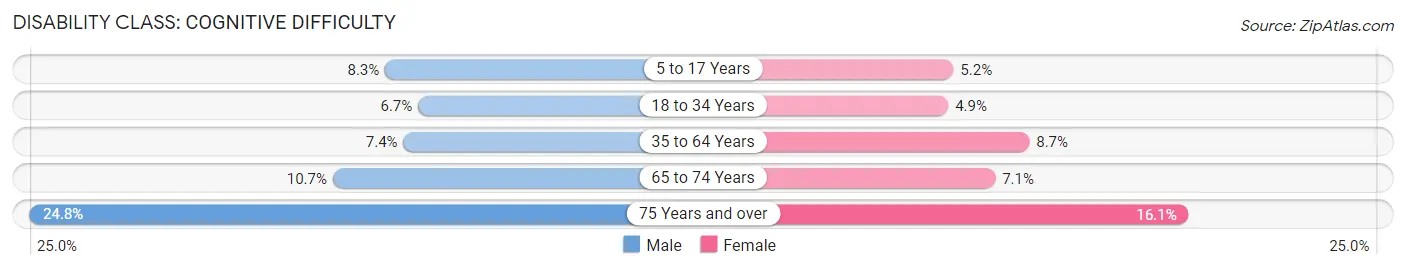
| Age Bracket | Male | Female |
| 5 to 17 Years | 368 (8.3%) | 222 (5.2%) |
| 18 to 34 Years | 341 (6.7%) | 233 (4.9%) |
| 35 to 64 Years | 640 (7.4%) | 758 (8.7%) |
| 65 to 74 Years | 262 (10.7%) | 187 (7.1%) |
| 75 Years and over | 346 (24.7%) | 299 (16.1%) |
Disability Class: Ambulatory Difficulty
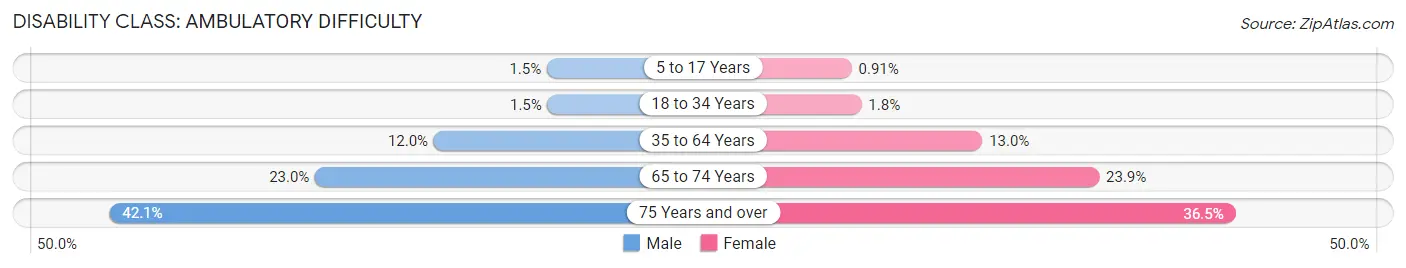
| Age Bracket | Male | Female |
| 5 to 17 Years | 67 (1.5%) | 39 (0.9%) |
| 18 to 34 Years | 74 (1.5%) | 86 (1.8%) |
| 35 to 64 Years | 1,037 (12.0%) | 1,135 (13.0%) |
| 65 to 74 Years | 564 (23.0%) | 627 (23.9%) |
| 75 Years and over | 589 (42.1%) | 679 (36.5%) |
Disability Class: Self-Care Difficulty
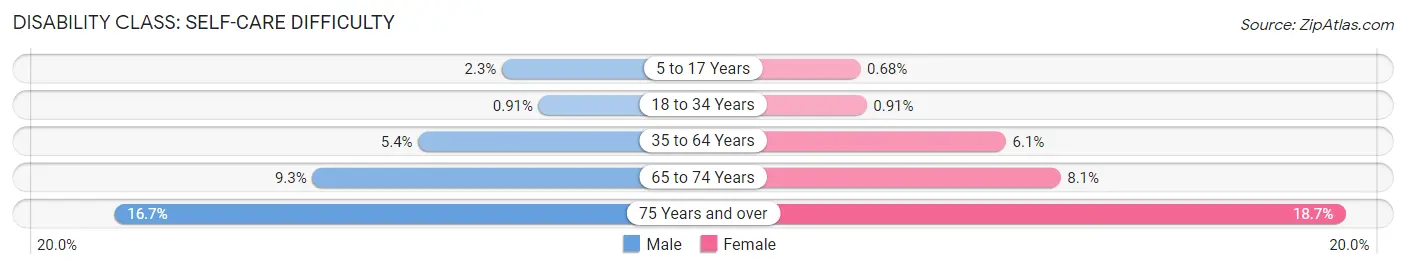
| Age Bracket | Male | Female |
| 5 to 17 Years | 101 (2.3%) | 29 (0.7%) |
| 18 to 34 Years | 46 (0.9%) | 43 (0.9%) |
| 35 to 64 Years | 464 (5.4%) | 530 (6.1%) |
| 65 to 74 Years | 228 (9.3%) | 213 (8.1%) |
| 75 Years and over | 233 (16.7%) | 347 (18.7%) |
Technology Access in Le Flore County
Computing Device Access in Le Flore County
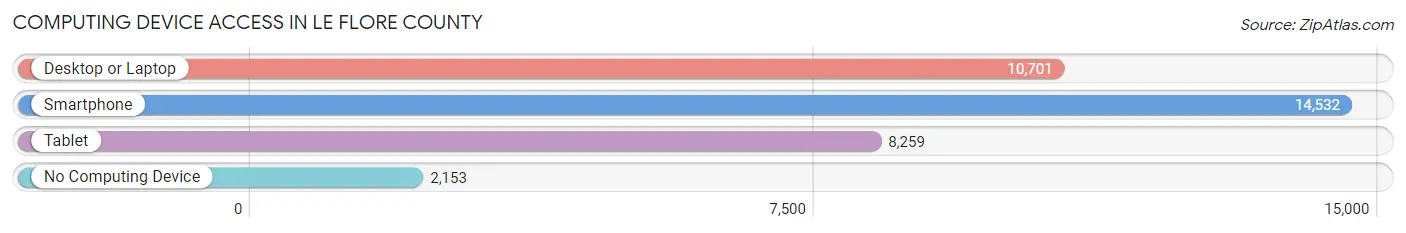
| Device Type | # Households | % Households |
| Desktop or Laptop | 10,701 | 60.0% |
| Smartphone | 14,532 | 81.5% |
| Tablet | 8,259 | 46.3% |
| No Computing Device | 2,153 | 12.1% |
| Total | 17,835 | 100.0% |
Internet Access in Le Flore County
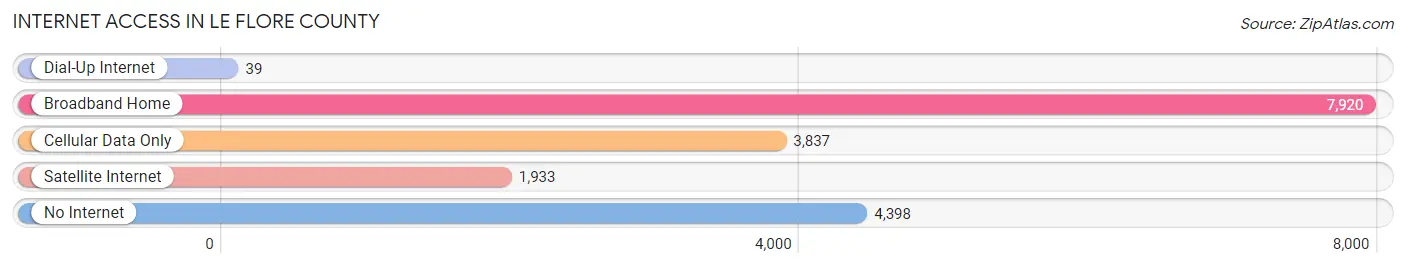
| Internet Type | # Households | % Households |
| Dial-Up Internet | 39 | 0.2% |
| Broadband Home | 7,920 | 44.4% |
| Cellular Data Only | 3,837 | 21.5% |
| Satellite Internet | 1,933 | 10.8% |
| No Internet | 4,398 | 24.7% |
| Total | 17,835 | 100.0% |
Le Flore County Summary
Flore County, Oklahoma is located in the south-central part of the state, and is bordered by Caddo, Grady, Stephens, Garvin, and McClain counties. The county seat is located in the city of Duncan, which is the largest city in the county. The county was established in 1907 and named after the daughter of a local rancher, Florence Grady-Fisher.
Geography
Flore County covers an area of 845 square miles, making it the 33rd largest county in Oklahoma. The terrain is mostly flat, with some rolling hills in the northern part of the county. The county is drained by the Washita River, which flows through the county from north to south. The county is also home to several small lakes, including Lake Humphreys, Lake Humphreys, and Lake Humphreys.
The climate of Flore County is characterized by hot, humid summers and mild winters. The average annual temperature is around 65°F, with average highs in the summer reaching into the mid-90s and lows in the winter dipping into the mid-30s. The average annual precipitation is around 35 inches, with most of it falling in the spring and summer months.
Demographics
As of the 2010 census, the population of Flore County was 45,837, making it the 33rd most populous county in Oklahoma. The population density was 54 people per square mile. The racial makeup of the county was 81.3% White, 8.2% African American, 4.2% Native American, 0.7% Asian, 0.1% Pacific Islander, and 4.5% from other races. Hispanic or Latino of any race made up 8.3% of the population.
The median income for a household in the county was $41,945, and the median income for a family was $50,945. The per capita income for the county was $20,945. About 14.3% of the population was below the poverty line.
Economy
The economy of Flore County is largely based on agriculture, with the main crops being cotton, wheat, and sorghum. The county is also home to several oil and gas fields, which provide jobs for many of the county's residents. The county is also home to several manufacturing companies, including a paper mill, a steel mill, and a plastics plant.
The county is served by two major highways, US Highway 81 and US Highway 277. The county is also served by the Duncan Municipal Airport, which provides air service to the county.
Flore County is home to several educational institutions, including Cameron University, Red River Technology Center, and Duncan Public Schools. The county is also home to several museums, including the Chisholm Trail Museum and the Stephens County Historical Museum.
Flore County is a great place to live, work, and play. With its rich history, diverse economy, and friendly people, it is a great place to call home.
Common Questions
What is the Total Population of Le Flore County?
Total Population of Le Flore County is 48,525.
What is the Total Male Population of Le Flore County?
Total Male Population of Le Flore County is 24,544.
What is the Total Female Population of Le Flore County?
Total Female Population of Le Flore County is 23,981.
What is the Ratio of Males per 100 Females in Le Flore County?
There are 102.35 Males per 100 Females in Le Flore County.
What is the Ratio of Females per 100 Males in Le Flore County?
There are 97.71 Females per 100 Males in Le Flore County.
What is the Median Population Age in Le Flore County?
Median Population Age in Le Flore County is 38.8 Years.
What is the Average Family Size in Le Flore County
Average Family Size in Le Flore County is 3.2 People.
What is the Average Household Size in Le Flore County
Average Household Size in Le Flore County is 2.6 People.
What is Per Capita Income in Le Flore County?
Per Capita income in Le Flore County is $23,718.
What is the Median Family Income in Le Flore County?
Median Family Income in Le Flore County is $59,125.
What is the Median Household income in Le Flore County?
Median Household Income in Le Flore County is $46,750.
What is Income or Wage Gap in Le Flore County?
Income or Wage Gap in Le Flore County is 33.0%.
Women in Le Flore County earn 67.0 cents for every dollar earned by a man.
What is Family Income Deficit in Le Flore County?
Family Income Deficit in Le Flore County is $10,515.
Families that are below poverty line in Le Flore County earn $10,515 less on average than the poverty threshold level.
What is Inequality or Gini Index in Le Flore County?
Inequality or Gini Index in Le Flore County is 0.44.
How Large is the Labor Force in Le Flore County?
There are 19,812 People in the Labor Forcein in Le Flore County.
What is the Percentage of People in the Labor Force in Le Flore County?
51.7% of People are in the Labor Force in Le Flore County.
What is the Unemployment Rate in Le Flore County?
Unemployment Rate in Le Flore County is 5.2%.