Harper County, OK
Harper County Map
Harper County Overview
3,272
TOTAL POPULATION
1,613
MALE POPULATION
1,659
FEMALE POPULATION
97.23
MALES / 100 FEMALES
102.85
FEMALES / 100 MALES
39.7
MEDIAN AGE
3.1
AVG FAMILY SIZE
2.6
AVG HOUSEHOLD SIZE
$26,279
PER CAPITA INCOME
$69,896
AVG FAMILY INCOME
$59,934
AVG HOUSEHOLD INCOME
30.4%
WAGE / INCOME GAP [ % ]
69.6¢/ $1
WAGE / INCOME GAP [ $ ]
0.36
INEQUALITY / GINI INDEX
1,454
LABOR FORCE [ PEOPLE ]
56.8%
PERCENT IN LABOR FORCE
2.6%
UNEMPLOYMENT RATE
Harper County Area Codes
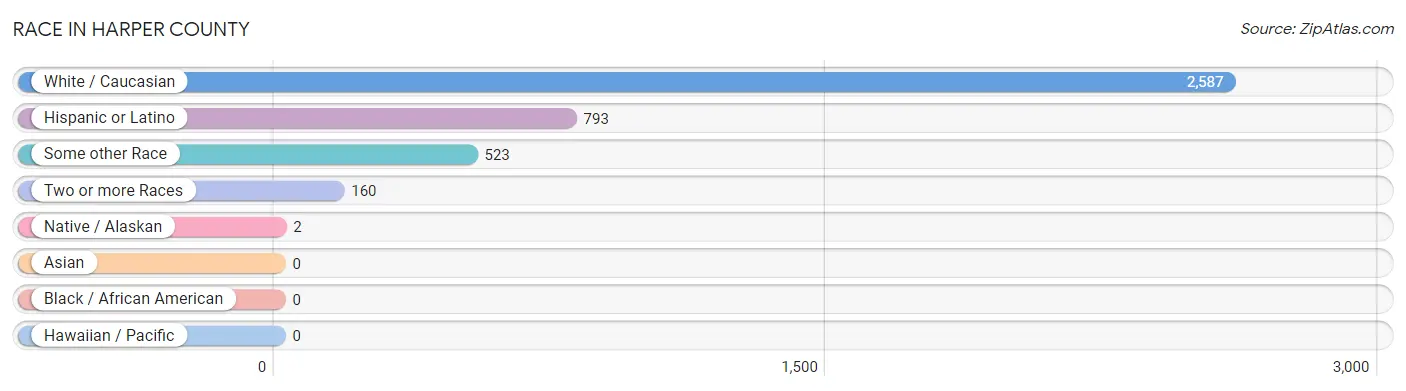
Race in Harper County
The most populous races in Harper County are White / Caucasian (2,587 | 79.1%), Hispanic or Latino (793 | 24.2%), and Some other Race (523 | 16.0%).
| Race | # Population | % Population |
| Asian | 0 | 0.0% |
| Black / African American | 0 | 0.0% |
| Hawaiian / Pacific | 0 | 0.0% |
| Hispanic or Latino | 793 | 24.2% |
| Native / Alaskan | 2 | 0.1% |
| White / Caucasian | 2,587 | 79.1% |
| Two or more Races | 160 | 4.9% |
| Some other Race | 523 | 16.0% |
| Total | 3,272 | 100.0% |
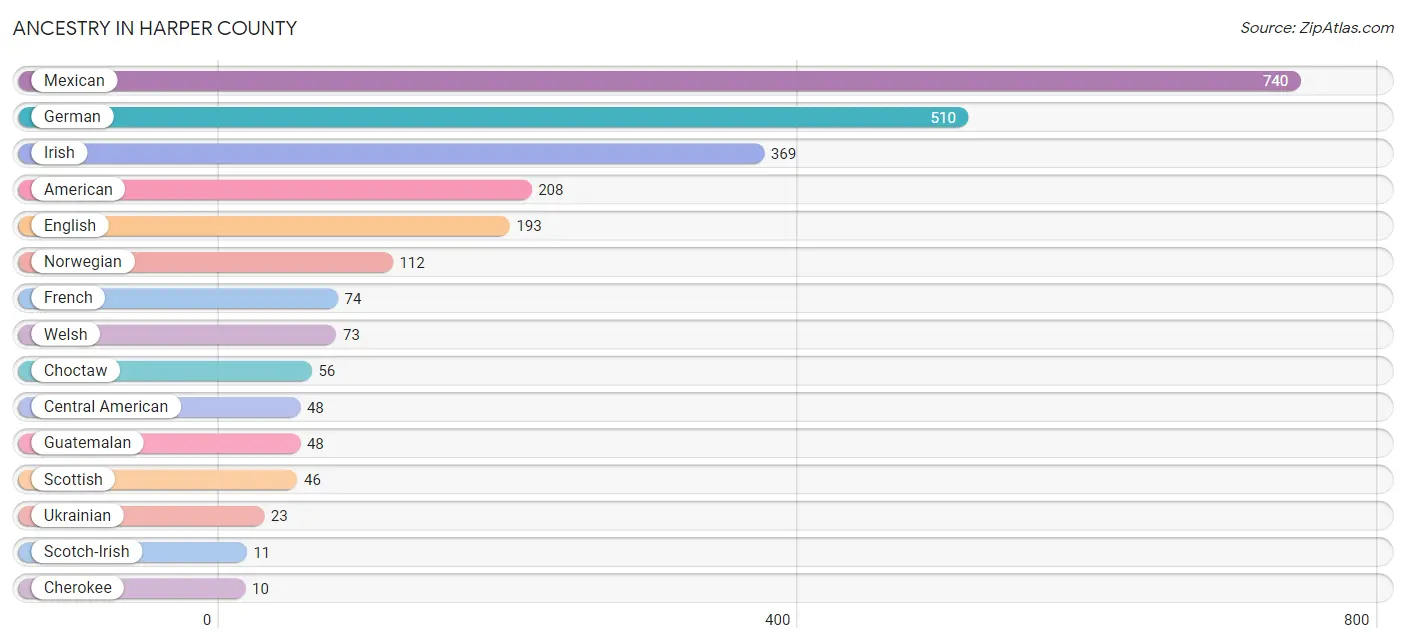
Ancestry in Harper County
The most populous ancestries reported in Harper County are Mexican (740 | 22.6%), German (510 | 15.6%), Irish (369 | 11.3%), American (208 | 6.4%), and English (193 | 5.9%), together accounting for 61.7% of all Harper County residents.
| Ancestry | # Population | % Population |
| American | 208 | 6.4% |
| British | 1 | 0.0% |
| Central American | 48 | 1.5% |
| Cherokee | 10 | 0.3% |
| Chippewa | 6 | 0.2% |
| Choctaw | 56 | 1.7% |
| Cuban | 5 | 0.2% |
| Czech | 9 | 0.3% |
| Dutch | 9 | 0.3% |
| English | 193 | 5.9% |
| French | 74 | 2.3% |
| French Canadian | 6 | 0.2% |
| German | 510 | 15.6% |
| Guatemalan | 48 | 1.5% |
| Irish | 369 | 11.3% |
| Italian | 10 | 0.3% |
| Mexican | 740 | 22.6% |
| Norwegian | 112 | 3.4% |
| Scotch-Irish | 11 | 0.3% |
| Scottish | 46 | 1.4% |
| Swedish | 7 | 0.2% |
| Swiss | 5 | 0.2% |
| Ukrainian | 23 | 0.7% |
| Welsh | 73 | 2.2% | View All 24 Rows |
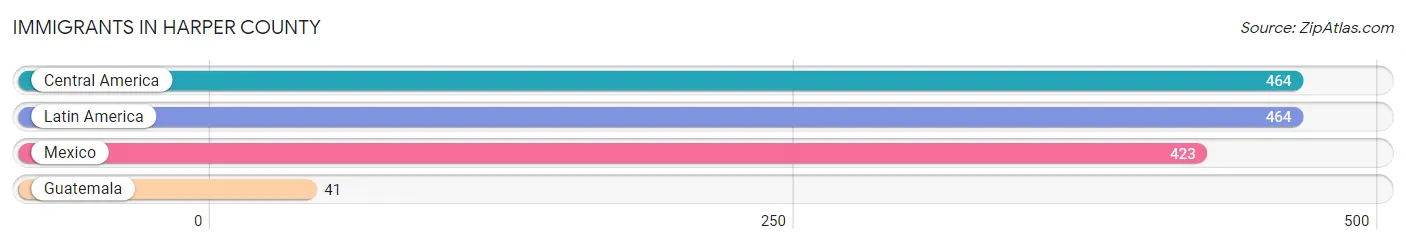
Immigrants in Harper County
The most numerous immigrant groups reported in Harper County came from Central America (464 | 14.2%), Latin America (464 | 14.2%), Mexico (423 | 12.9%), and Guatemala (41 | 1.3%), together accounting for 42.5% of all Harper County residents.
| Immigration Origin | # Population | % Population |
| Central America | 464 | 14.2% |
| Guatemala | 41 | 1.3% |
| Latin America | 464 | 14.2% |
| Mexico | 423 | 12.9% | View All 4 Rows |
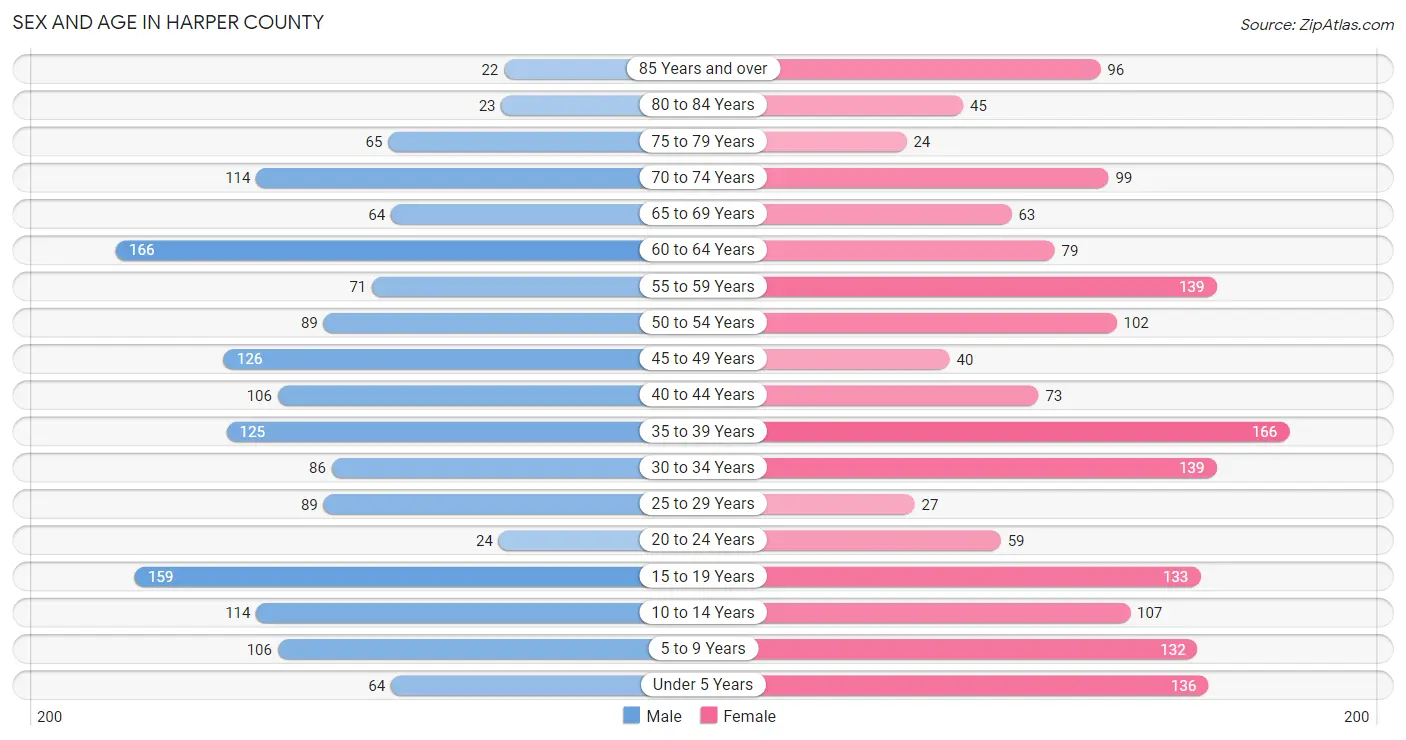
Sex and Age in Harper County
Sex and Age in Harper County
The most populous age groups in Harper County are 60 to 64 Years (166 | 10.3%) for men and 35 to 39 Years (166 | 10.0%) for women.
| Age Bracket | Male | Female |
| Under 5 Years | 64 (4.0%) | 136 (8.2%) |
| 5 to 9 Years | 106 (6.6%) | 132 (8.0%) |
| 10 to 14 Years | 114 (7.1%) | 107 (6.5%) |
| 15 to 19 Years | 159 (9.9%) | 133 (8.0%) |
| 20 to 24 Years | 24 (1.5%) | 59 (3.6%) |
| 25 to 29 Years | 89 (5.5%) | 27 (1.6%) |
| 30 to 34 Years | 86 (5.3%) | 139 (8.4%) |
| 35 to 39 Years | 125 (7.7%) | 166 (10.0%) |
| 40 to 44 Years | 106 (6.6%) | 73 (4.4%) |
| 45 to 49 Years | 126 (7.8%) | 40 (2.4%) |
| 50 to 54 Years | 89 (5.5%) | 102 (6.1%) |
| 55 to 59 Years | 71 (4.4%) | 139 (8.4%) |
| 60 to 64 Years | 166 (10.3%) | 79 (4.8%) |
| 65 to 69 Years | 64 (4.0%) | 63 (3.8%) |
| 70 to 74 Years | 114 (7.1%) | 99 (6.0%) |
| 75 to 79 Years | 65 (4.0%) | 24 (1.5%) |
| 80 to 84 Years | 23 (1.4%) | 45 (2.7%) |
| 85 Years and over | 22 (1.4%) | 96 (5.8%) |
| Total | 1,613 (100.0%) | 1,659 (100.0%) |
Families and Households in Harper County
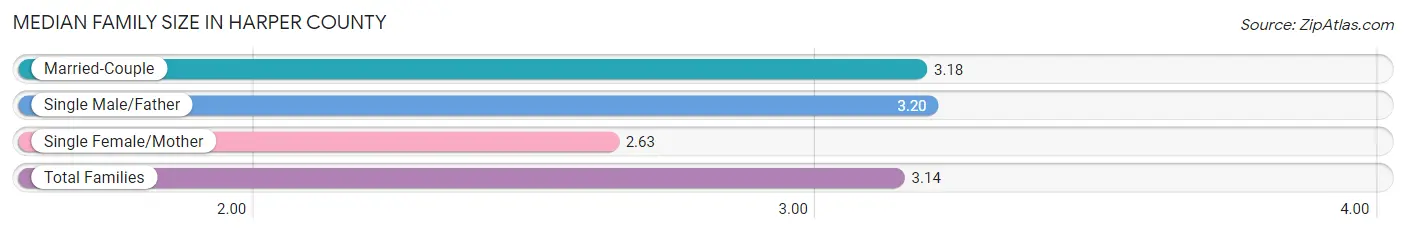
Median Family Size in Harper County
The median family size in Harper County is 3.14 persons per family, with single male/father families (65 | 7.8%) accounting for the largest median family size of 3.2 persons per family. On the other hand, single female/mother families (56 | 6.7%) represent the smallest median family size with 2.63 persons per family.
| Family Type | # Families | Family Size |
| Married-Couple | 713 (85.5%) | 3.18 |
| Single Male/Father | 65 (7.8%) | 3.20 |
| Single Female/Mother | 56 (6.7%) | 2.63 |
| Total Families | 834 (100.0%) | 3.14 |
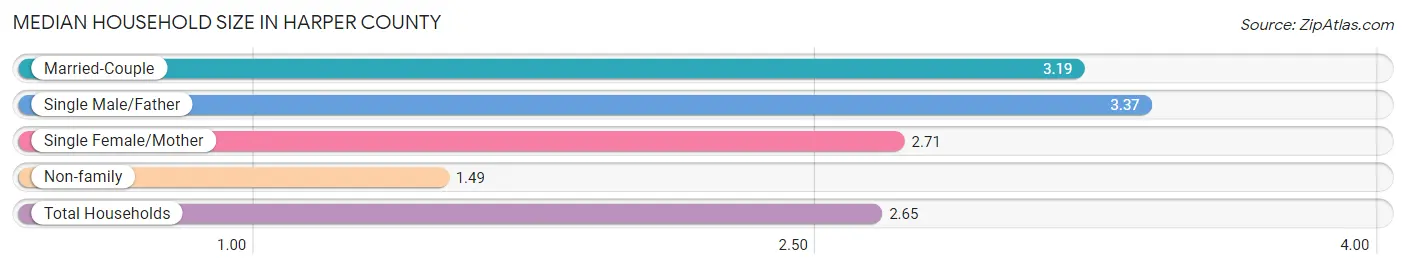
Median Household Size in Harper County
The median household size in Harper County is 2.65 persons per household, with single male/father households (65 | 5.3%) accounting for the largest median household size of 3.37 persons per household. non-family households (381 | 31.4%) represent the smallest median household size with 1.49 persons per household.
| Household Type | # Households | Household Size |
| Married-Couple | 713 (58.7%) | 3.19 |
| Single Male/Father | 65 (5.3%) | 3.37 |
| Single Female/Mother | 56 (4.6%) | 2.71 |
| Non-family | 381 (31.4%) | 1.49 |
| Total Households | 1,215 (100.0%) | 2.65 |
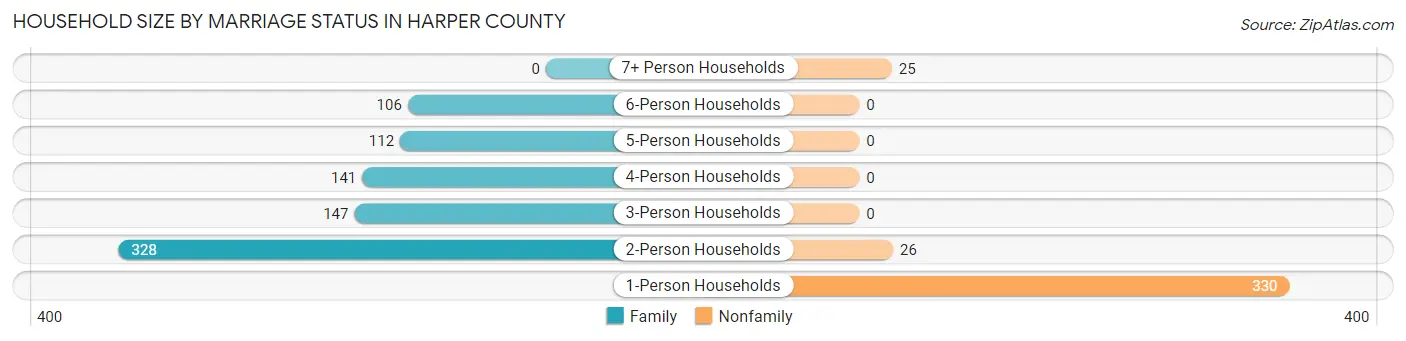
Household Size by Marriage Status in Harper County
Out of a total of 1,215 households in Harper County, 834 (68.6%) are family households, while 381 (31.4%) are nonfamily households. The most numerous type of family households are 2-person households, comprising 328, and the most common type of nonfamily households are 1-person households, comprising 330.
| Household Size | Family Households | Nonfamily Households |
| 1-Person Households | - | 330 (27.2%) |
| 2-Person Households | 328 (27.0%) | 26 (2.1%) |
| 3-Person Households | 147 (12.1%) | 0 (0.0%) |
| 4-Person Households | 141 (11.6%) | 0 (0.0%) |
| 5-Person Households | 112 (9.2%) | 0 (0.0%) |
| 6-Person Households | 106 (8.7%) | 0 (0.0%) |
| 7+ Person Households | 0 (0.0%) | 25 (2.1%) |
| Total | 834 (68.6%) | 381 (31.4%) |
Female Fertility in Harper County
Fertility by Age in Harper County
Average fertility rate in Harper County is 56.0 births per 1,000 women. Women in the age bracket of 20 to 34 years have the highest fertility rate with 164.0 births per 1,000 women. Women in the age bracket of 20 to 34 years acount for 100.0% of all women with births.

| Age Bracket | Women with Births | Births / 1,000 Women |
| 15 to 19 years | 0 (0.0%) | 0.0 |
| 20 to 34 years | 37 (100.0%) | 164.0 |
| 35 to 50 years | 0 (0.0%) | 0.0 |
| Total | 37 (100.0%) | 56.0 |
Fertility by Age by Marriage Status in Harper County
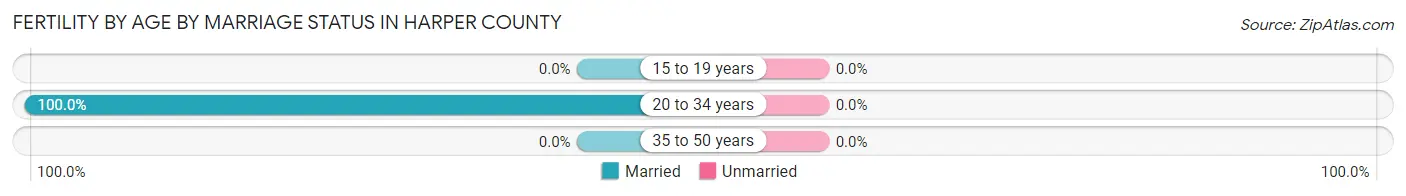
| Age Bracket | Married | Unmarried |
| 15 to 19 years | 0 (0.0%) | 0 (0.0%) |
| 20 to 34 years | 37 (100.0%) | 0 (0.0%) |
| 35 to 50 years | 0 (0.0%) | 0 (0.0%) |
| Total | 37 (100.0%) | 0 (0.0%) |
Fertility by Education in Harper County
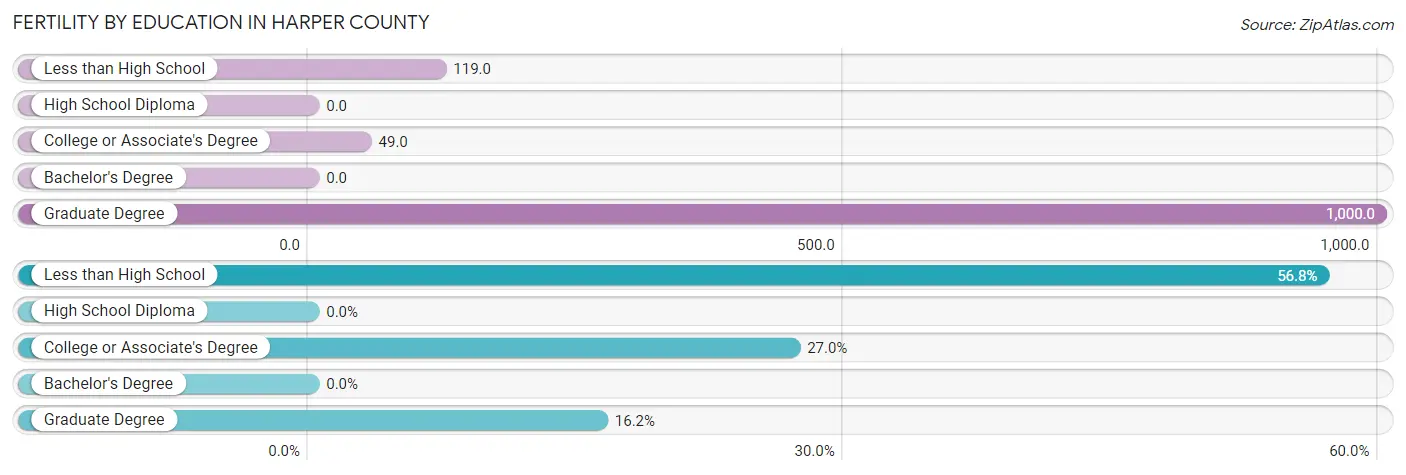
| Educational Attainment | Women with Births | Births / 1,000 Women |
| Less than High School | 21 (56.8%) | 119.0 |
| High School Diploma | 0 (0.0%) | 0.0 |
| College or Associate's Degree | 10 (27.0%) | 49.0 |
| Bachelor's Degree | 0 (0.0%) | 0.0 |
| Graduate Degree | 6 (16.2%) | 1,000.0 |
| Total | 37 (100.0%) | 56.0 |
Fertility by Education by Marriage Status in Harper County
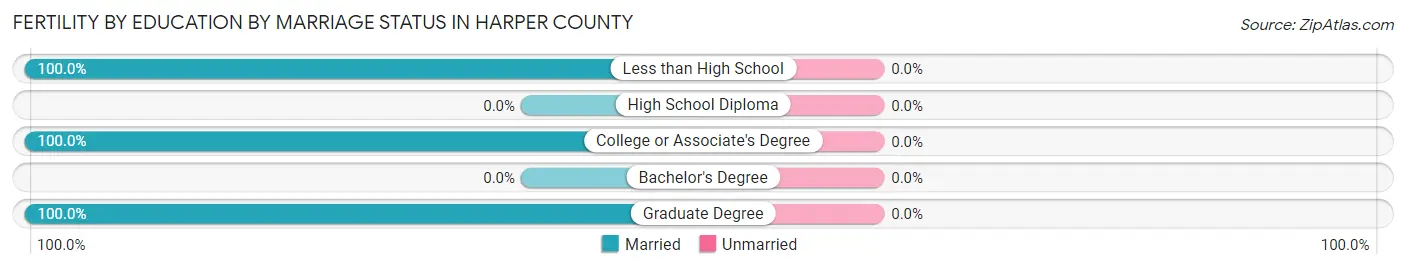
| Educational Attainment | Married | Unmarried |
| Less than High School | 21 (100.0%) | 0 (0.0%) |
| High School Diploma | 0 (0.0%) | 0 (0.0%) |
| College or Associate's Degree | 10 (100.0%) | 0 (0.0%) |
| Bachelor's Degree | 0 (0.0%) | 0 (0.0%) |
| Graduate Degree | 6 (100.0%) | 0 (0.0%) |
| Total | 37 (100.0%) | 0 (0.0%) |
Income in Harper County
Income Overview in Harper County
Per Capita Income in Harper County is $26,279, while median incomes of families and households are $69,896 and $59,934 respectively.
| Characteristic | Number | Measure |
| Per Capita Income | 3,272 | $26,279 |
| Median Family Income | 834 | $69,896 |
| Mean Family Income | 834 | $78,506 |
| Median Household Income | 1,215 | $59,934 |
| Mean Household Income | 1,215 | $69,105 |
| Income Deficit | 834 | $0 |
| Wage / Income Gap (%) | 3,272 | 30.43% |
| Wage / Income Gap ($) | 3,272 | 69.57¢ per $1 |
| Gini / Inequality Index | 3,272 | 0.36 |
Earnings by Sex in Harper County
Average Earnings in Harper County are $34,880, $43,676 for men and $30,386 for women, a difference of 30.4%.
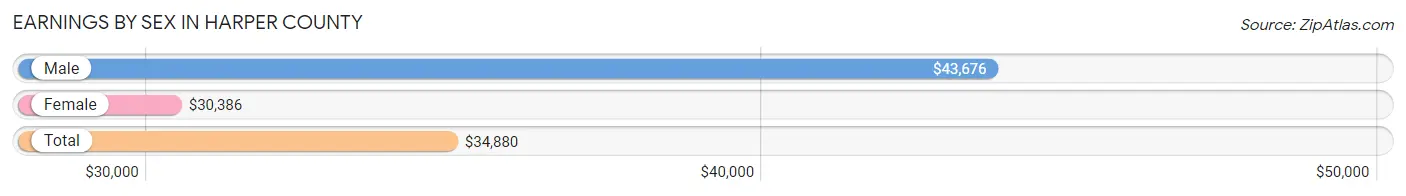
| Sex | Number | Average Earnings |
| Male | 890 (56.9%) | $43,676 |
| Female | 673 (43.1%) | $30,386 |
| Total | 1,563 (100.0%) | $34,880 |
Earnings by Sex by Income Bracket in Harper County
The most common earnings brackets in Harper County are $45,000 to $49,999 for men (102 | 11.5%) and $30,000 to $34,999 for women (100 | 14.9%).
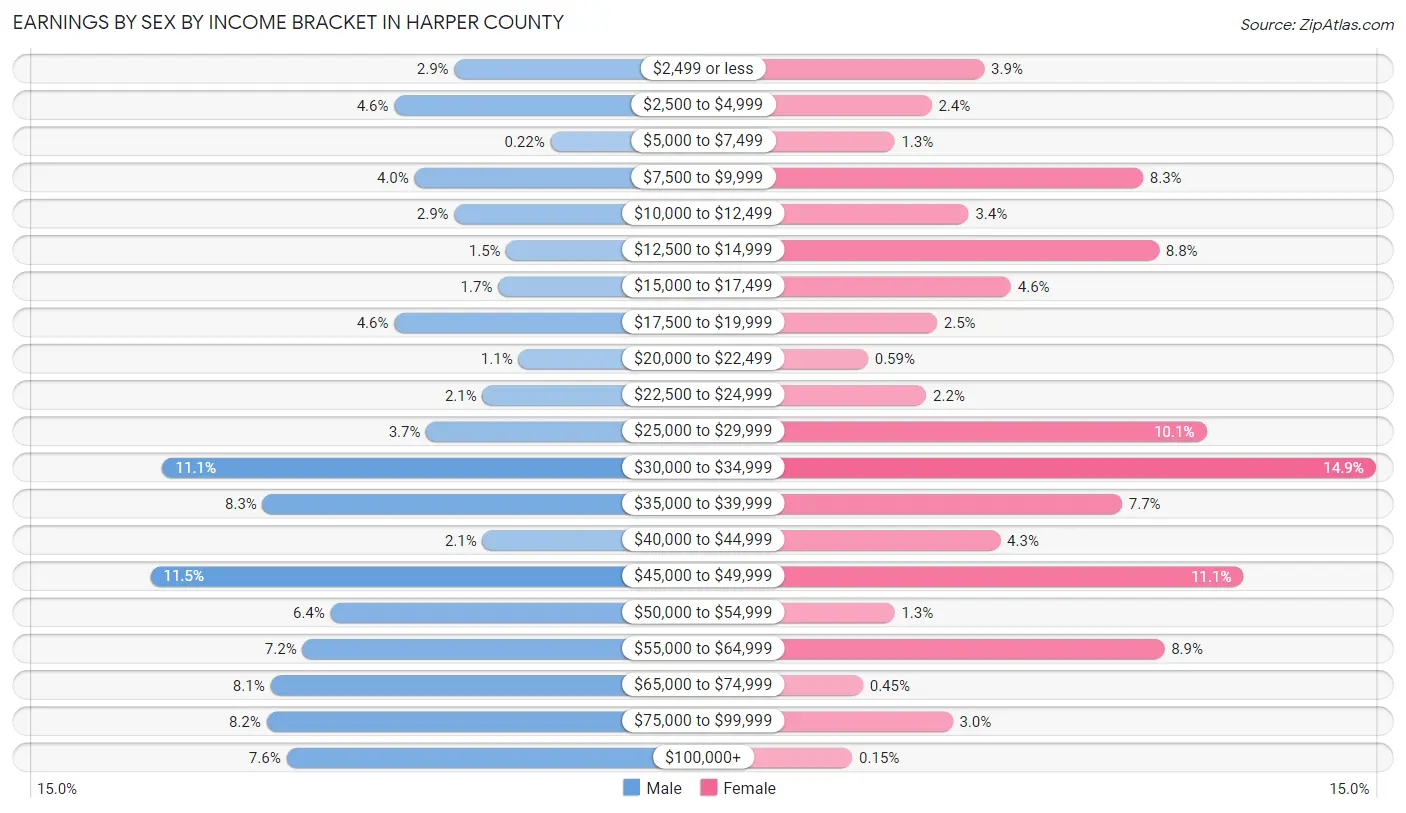
| Income | Male | Female |
| $2,499 or less | 26 (2.9%) | 26 (3.9%) |
| $2,500 to $4,999 | 41 (4.6%) | 16 (2.4%) |
| $5,000 to $7,499 | 2 (0.2%) | 9 (1.3%) |
| $7,500 to $9,999 | 36 (4.0%) | 56 (8.3%) |
| $10,000 to $12,499 | 26 (2.9%) | 23 (3.4%) |
| $12,500 to $14,999 | 13 (1.5%) | 59 (8.8%) |
| $15,000 to $17,499 | 15 (1.7%) | 31 (4.6%) |
| $17,500 to $19,999 | 41 (4.6%) | 17 (2.5%) |
| $20,000 to $22,499 | 10 (1.1%) | 4 (0.6%) |
| $22,500 to $24,999 | 19 (2.1%) | 15 (2.2%) |
| $25,000 to $29,999 | 33 (3.7%) | 68 (10.1%) |
| $30,000 to $34,999 | 99 (11.1%) | 100 (14.9%) |
| $35,000 to $39,999 | 74 (8.3%) | 52 (7.7%) |
| $40,000 to $44,999 | 19 (2.1%) | 29 (4.3%) |
| $45,000 to $49,999 | 102 (11.5%) | 75 (11.1%) |
| $50,000 to $54,999 | 57 (6.4%) | 9 (1.3%) |
| $55,000 to $64,999 | 64 (7.2%) | 60 (8.9%) |
| $65,000 to $74,999 | 72 (8.1%) | 3 (0.4%) |
| $75,000 to $99,999 | 73 (8.2%) | 20 (3.0%) |
| $100,000+ | 68 (7.6%) | 1 (0.2%) |
| Total | 890 (100.0%) | 673 (100.0%) |
Earnings by Sex by Educational Attainment in Harper County
Average earnings in Harper County are $46,149 for men and $31,466 for women, a difference of 31.8%. Men with an educational attainment of high school diploma enjoy the highest average annual earnings of $48,686, while those with less than high school education earn the least with $36,250. Women with an educational attainment of graduate degree earn the most with the average annual earnings of $63,333, while those with less than high school education have the smallest earnings of $14,250.

| Educational Attainment | Male Income | Female Income |
| Less than High School | $36,250 | $14,250 |
| High School Diploma | $48,686 | $39,833 |
| College or Associate's Degree | $46,445 | $27,361 |
| Bachelor's Degree | $47,750 | $42,321 |
| Graduate Degree | - | - |
| Total | $46,149 | $31,466 |
Family Income in Harper County
Family Income Brackets in Harper County
According to the Harper County family income data, there are 192 families falling into the $50,000 to $74,999 income range, which is the most common income bracket and makes up 23.0% of all families. Conversely, the less than $10,000 income bracket is the least frequent group with only 6 families (0.7%) belonging to this category.
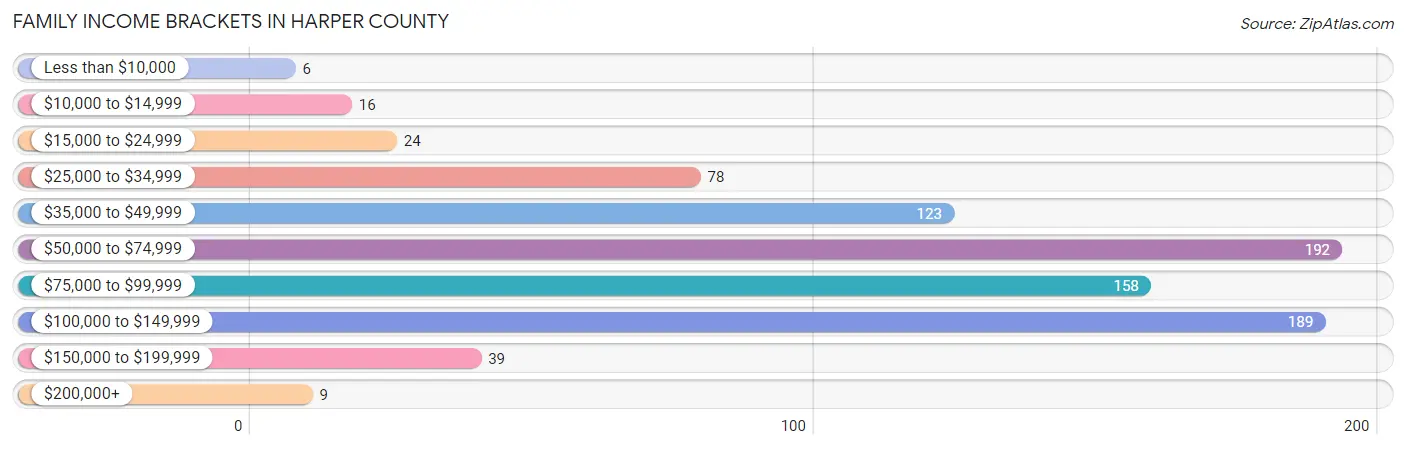
| Income Bracket | # Families | % Families |
| Less than $10,000 | 6 | 0.7% |
| $10,000 to $14,999 | 16 | 1.9% |
| $15,000 to $24,999 | 24 | 2.9% |
| $25,000 to $34,999 | 78 | 9.4% |
| $35,000 to $49,999 | 123 | 14.7% |
| $50,000 to $74,999 | 192 | 23.0% |
| $75,000 to $99,999 | 158 | 18.9% |
| $100,000 to $149,999 | 189 | 22.7% |
| $150,000 to $199,999 | 39 | 4.7% |
| $200,000+ | 9 | 1.1% |
Family Income by Famaliy Size in Harper County
4-person families (141 | 16.9%) account for the highest median family income in Harper County with $88,625 per family, while 2-person families (328 | 39.3%) have the highest median income of $33,750 per family member.
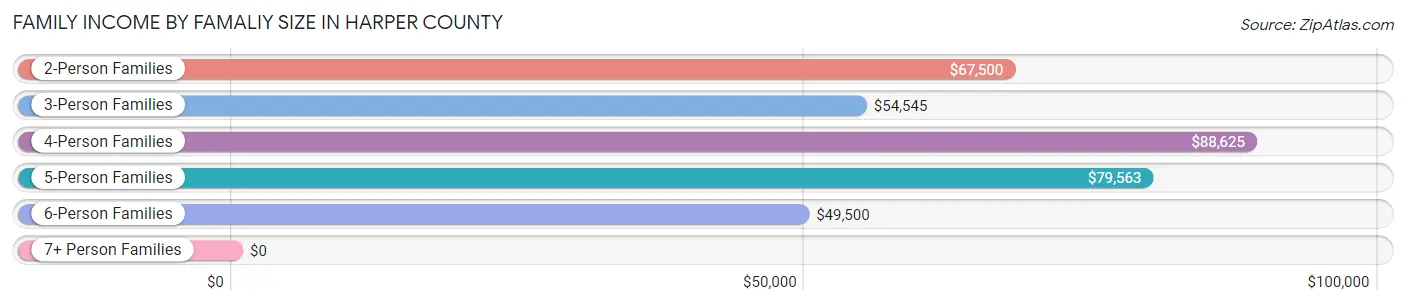
| Income Bracket | # Families | Median Income |
| 2-Person Families | 328 (39.3%) | $67,500 |
| 3-Person Families | 160 (19.2%) | $54,545 |
| 4-Person Families | 141 (16.9%) | $88,625 |
| 5-Person Families | 99 (11.9%) | $79,563 |
| 6-Person Families | 106 (12.7%) | $49,500 |
| 7+ Person Families | 0 (0.0%) | $0 |
| Total | 834 (100.0%) | $69,896 |
Family Income by Number of Earners in Harper County
The median family income in Harper County is $69,896, with families comprising 2 earners (446) having the highest median family income of $98,833, while families with 1 earner (245) have the lowest median family income of $42,961, accounting for 53.5% and 29.4% of families, respectively.
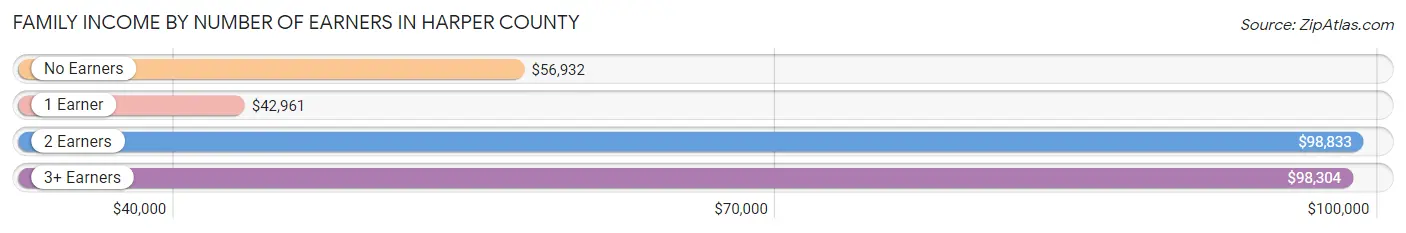
| Number of Earners | # Families | Median Income |
| No Earners | 86 (10.3%) | $56,932 |
| 1 Earner | 245 (29.4%) | $42,961 |
| 2 Earners | 446 (53.5%) | $98,833 |
| 3+ Earners | 57 (6.8%) | $98,304 |
| Total | 834 (100.0%) | $69,896 |
Household Income in Harper County
Household Income Brackets in Harper County
With 219 households falling in the category, the $50,000 to $74,999 income range is the most frequent in Harper County, accounting for 18.0% of all households. In contrast, only 9 households (0.7%) fall into the $200,000+ income bracket, making it the least populous group.

| Income Bracket | # Households | % Households |
| Less than $10,000 | 26 | 2.1% |
| $10,000 to $14,999 | 58 | 4.8% |
| $15,000 to $24,999 | 115 | 9.5% |
| $25,000 to $34,999 | 114 | 9.4% |
| $35,000 to $49,999 | 217 | 17.9% |
| $50,000 to $74,999 | 219 | 18.0% |
| $75,000 to $99,999 | 181 | 14.9% |
| $100,000 to $149,999 | 202 | 16.6% |
| $150,000 to $199,999 | 74 | 6.1% |
| $200,000+ | 9 | 0.7% |
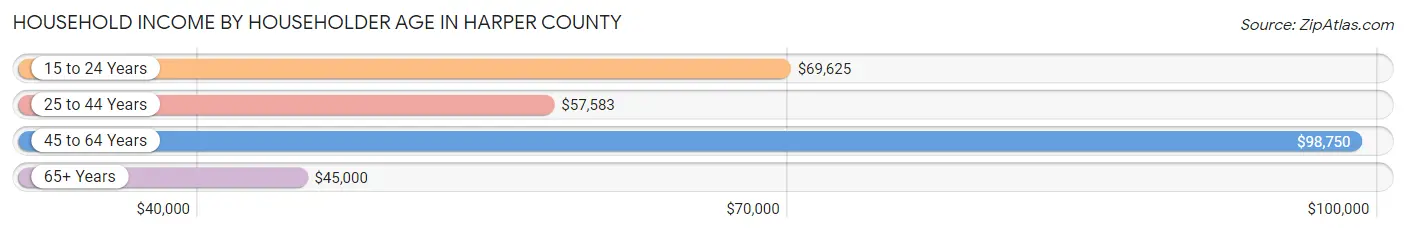
Household Income by Householder Age in Harper County
The median household income in Harper County is $59,934, with the highest median household income of $98,750 found in the 45 to 64 years age bracket for the primary householder. A total of 329 households (27.1%) fall into this category. Meanwhile, the 65+ years age bracket for the primary householder has the lowest median household income of $45,000, with 406 households (33.4%) in this group.
| Income Bracket | # Households | Median Income |
| 15 to 24 Years | 41 (3.4%) | $69,625 |
| 25 to 44 Years | 439 (36.1%) | $57,583 |
| 45 to 64 Years | 329 (27.1%) | $98,750 |
| 65+ Years | 406 (33.4%) | $45,000 |
| Total | 1,215 (100.0%) | $59,934 |
Poverty in Harper County
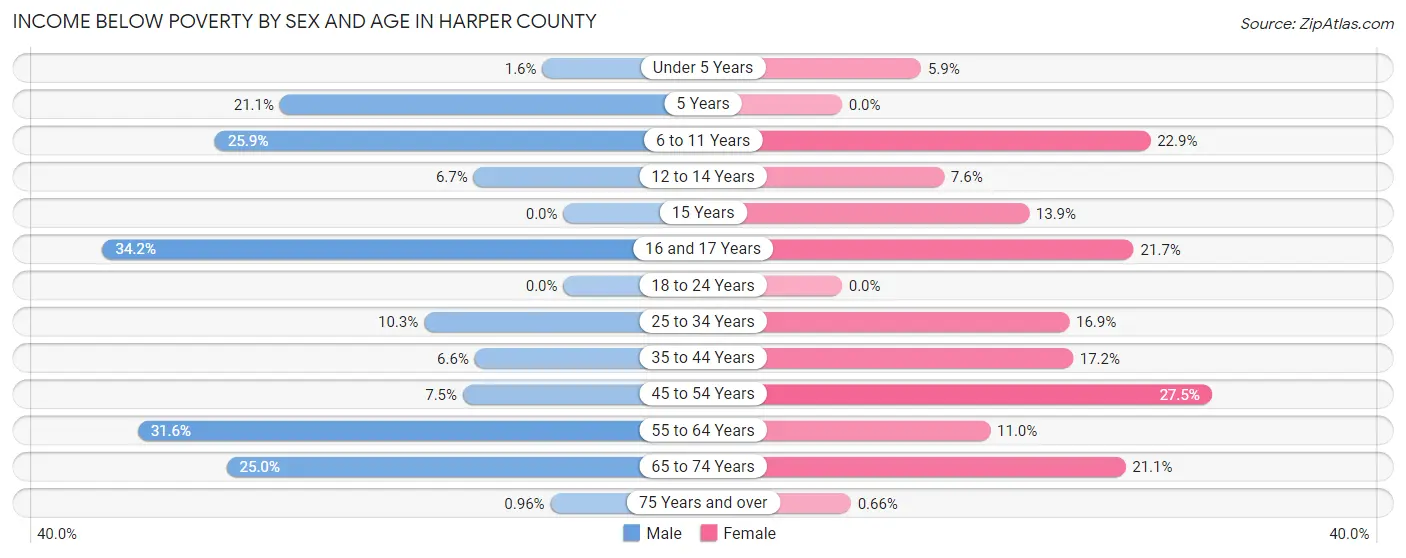
Income Below Poverty by Sex and Age in Harper County
With 14.1% poverty level for males and 14.1% for females among the residents of Harper County, 16 and 17 year old males and 45 to 54 year old females are the most vulnerable to poverty, with 13 males (34.2%) and 39 females (27.5%) in their respective age groups living below the poverty level.
| Age Bracket | Male | Female |
| Under 5 Years | 1 (1.6%) | 8 (5.9%) |
| 5 Years | 4 (21.0%) | 0 (0.0%) |
| 6 to 11 Years | 30 (25.9%) | 30 (22.9%) |
| 12 to 14 Years | 3 (6.7%) | 5 (7.6%) |
| 15 Years | 0 (0.0%) | 5 (13.9%) |
| 16 and 17 Years | 13 (34.2%) | 13 (21.7%) |
| 18 to 24 Years | 0 (0.0%) | 0 (0.0%) |
| 25 to 34 Years | 18 (10.3%) | 28 (16.9%) |
| 35 to 44 Years | 15 (6.6%) | 41 (17.2%) |
| 45 to 54 Years | 15 (7.5%) | 39 (27.5%) |
| 55 to 64 Years | 73 (31.6%) | 24 (11.0%) |
| 65 to 74 Years | 44 (25.0%) | 32 (21.0%) |
| 75 Years and over | 1 (1.0%) | 1 (0.7%) |
| Total | 217 (14.1%) | 226 (14.1%) |
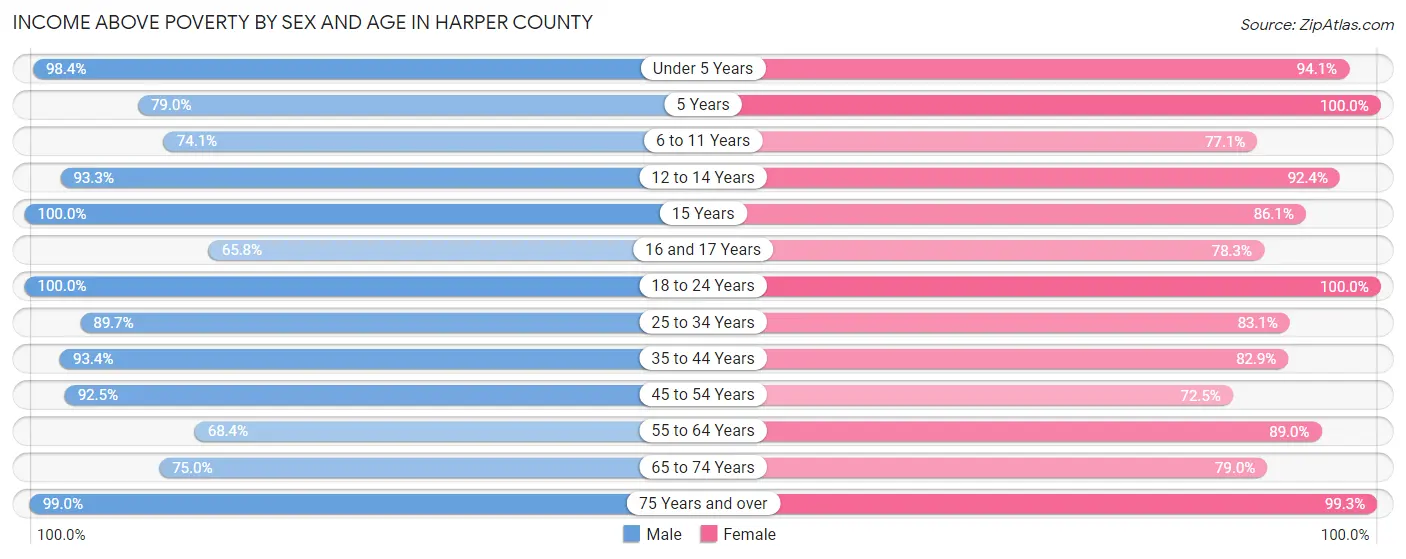
Income Above Poverty by Sex and Age in Harper County
According to the poverty statistics in Harper County, males aged 15 years and females aged 5 years are the age groups that are most secure financially, with 100.0% of males and 100.0% of females in these age groups living above the poverty line.
| Age Bracket | Male | Female |
| Under 5 Years | 63 (98.4%) | 128 (94.1%) |
| 5 Years | 15 (78.9%) | 9 (100.0%) |
| 6 to 11 Years | 86 (74.1%) | 101 (77.1%) |
| 12 to 14 Years | 42 (93.3%) | 61 (92.4%) |
| 15 Years | 17 (100.0%) | 31 (86.1%) |
| 16 and 17 Years | 25 (65.8%) | 47 (78.3%) |
| 18 to 24 Years | 127 (100.0%) | 96 (100.0%) |
| 25 to 34 Years | 156 (89.7%) | 138 (83.1%) |
| 35 to 44 Years | 213 (93.4%) | 198 (82.9%) |
| 45 to 54 Years | 186 (92.5%) | 103 (72.5%) |
| 55 to 64 Years | 158 (68.4%) | 194 (89.0%) |
| 65 to 74 Years | 132 (75.0%) | 120 (78.9%) |
| 75 Years and over | 103 (99.0%) | 151 (99.3%) |
| Total | 1,323 (85.9%) | 1,377 (85.9%) |
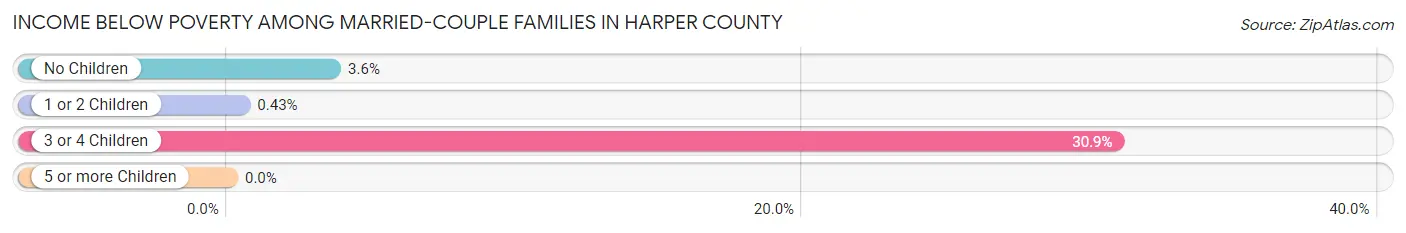
Income Below Poverty Among Married-Couple Families in Harper County
The poverty statistics for married-couple families in Harper County show that 9.3% or 66 of the total 713 families live below the poverty line. Families with 3 or 4 children have the highest poverty rate of 30.9%, comprising of 54 families. On the other hand, families with 1 or 2 children have the lowest poverty rate of 0.4%, which includes 1 families.
| Children | Above Poverty | Below Poverty |
| No Children | 295 (96.4%) | 11 (3.6%) |
| 1 or 2 Children | 231 (99.6%) | 1 (0.4%) |
| 3 or 4 Children | 121 (69.1%) | 54 (30.9%) |
| 5 or more Children | 0 (0.0%) | 0 (0.0%) |
| Total | 647 (90.7%) | 66 (9.3%) |
Income Below Poverty Among Single-Parent Households in Harper County
According to the poverty data in Harper County, 9.2% or 6 single-father households and 8.9% or 5 single-mother households are living below the poverty line. Among single-father households, those with 1 or 2 children have the highest poverty rate, with 6 households (12.0%) experiencing poverty. Likewise, among single-mother households, those with 1 or 2 children have the highest poverty rate, with 5 households (23.8%) falling below the poverty line.
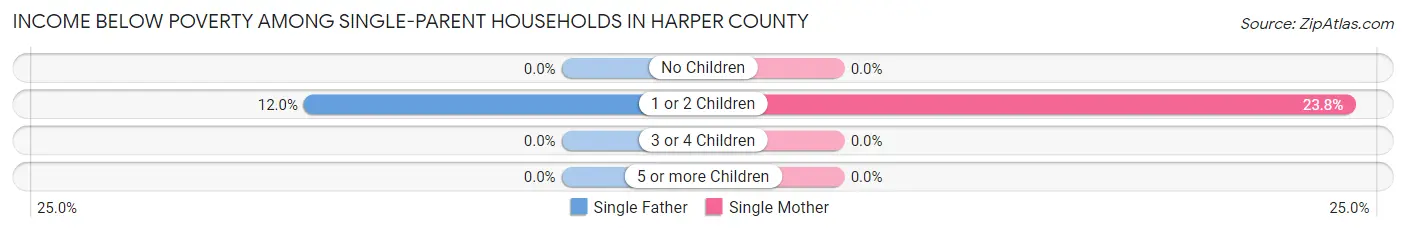
| Children | Single Father | Single Mother |
| No Children | 0 (0.0%) | 0 (0.0%) |
| 1 or 2 Children | 6 (12.0%) | 5 (23.8%) |
| 3 or 4 Children | 0 (0.0%) | 0 (0.0%) |
| 5 or more Children | 0 (0.0%) | 0 (0.0%) |
| Total | 6 (9.2%) | 5 (8.9%) |
Income Below Poverty Among Married-Couple vs Single-Parent Households in Harper County
The poverty data for Harper County shows that 66 of the married-couple family households (9.3%) and 11 of the single-parent households (9.1%) are living below the poverty level. Within the married-couple family households, those with 3 or 4 children have the highest poverty rate, with 54 households (30.9%) falling below the poverty line. Among the single-parent households, those with 1 or 2 children have the highest poverty rate, with 11 household (15.5%) living below poverty.

| Children | Married-Couple Families | Single-Parent Households |
| No Children | 11 (3.6%) | 0 (0.0%) |
| 1 or 2 Children | 1 (0.4%) | 11 (15.5%) |
| 3 or 4 Children | 54 (30.9%) | 0 (0.0%) |
| 5 or more Children | 0 (0.0%) | 0 (0.0%) |
| Total | 66 (9.3%) | 11 (9.1%) |
Employment Characteristics in Harper County
Employment by Class of Employer in Harper County
Among the 1,403 employed individuals in Harper County, private company employees (779 | 55.5%), local government employees (210 | 15.0%), and state government employees (182 | 13.0%) make up the most common classes of employment.
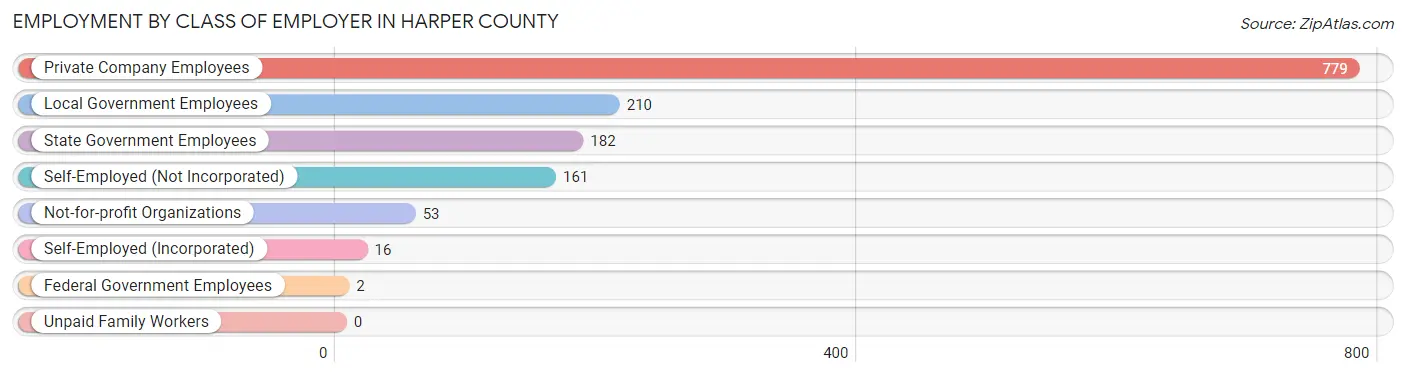
| Employer Class | # Employees | % Employees |
| Private Company Employees | 779 | 55.5% |
| Self-Employed (Incorporated) | 16 | 1.1% |
| Self-Employed (Not Incorporated) | 161 | 11.5% |
| Not-for-profit Organizations | 53 | 3.8% |
| Local Government Employees | 210 | 15.0% |
| State Government Employees | 182 | 13.0% |
| Federal Government Employees | 2 | 0.1% |
| Unpaid Family Workers | 0 | 0.0% |
| Total | 1,403 | 100.0% |
Employment Status by Age in Harper County
According to the labor force statistics for Harper County, out of the total population over 16 years of age (2,560), 56.8% or 1,454 individuals are in the labor force, with 2.6% or 38 of them unemployed. The age group with the highest labor force participation rate is 25 to 29 years, with 87.9% or 102 individuals in the labor force. Within the labor force, the 35 to 44 years age range has the highest percentage of unemployed individuals, with 5.5% or 21 of them being unemployed.

| Age Bracket | In Labor Force | Unemployed |
| 16 to 19 Years | 58 (24.3%) | 0 (0.0%) |
| 20 to 24 Years | 72 (86.7%) | 0 (0.0%) |
| 25 to 29 Years | 102 (87.9%) | 3 (2.9%) |
| 30 to 34 Years | 173 (76.9%) | 7 (4.0%) |
| 35 to 44 Years | 380 (80.9%) | 21 (5.5%) |
| 45 to 54 Years | 256 (71.7%) | 0 (0.0%) |
| 55 to 59 Years | 176 (83.8%) | 7 (4.0%) |
| 60 to 64 Years | 137 (55.9%) | 0 (0.0%) |
| 65 to 74 Years | 93 (27.4%) | 0 (0.0%) |
| 75 Years and over | 8 (2.9%) | 0 (0.0%) |
| Total | 1,454 (56.8%) | 38 (2.6%) |
Employment Status by Educational Attainment in Harper County
According to labor force statistics for Harper County, 75.4% of individuals (1,224) out of the total population between 25 and 64 years of age (1,623) are in the labor force, with 3.1% or 38 of them being unemployed. The group with the highest labor force participation rate are those with the educational attainment of college / associate degree, with 91.7% or 527 individuals in the labor force. Within the labor force, individuals with less than high school education have the highest percentage of unemployment, with 4.1% or 4 of them being unemployed.
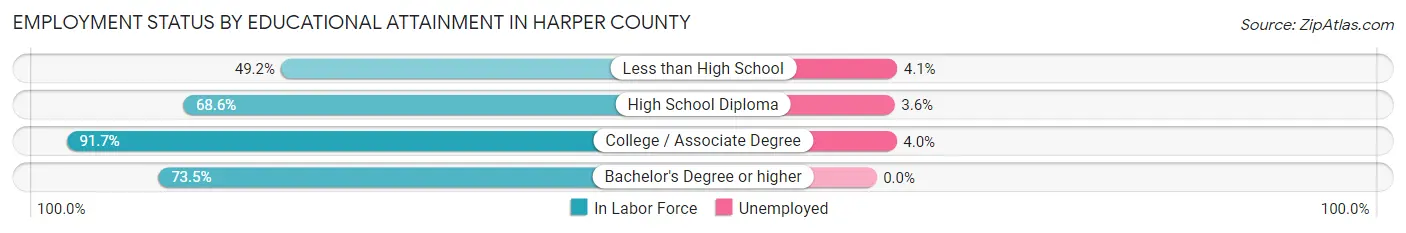
| Educational Attainment | In Labor Force | Unemployed |
| Less than High School | 97 (49.2%) | 8 (4.1%) |
| High School Diploma | 361 (68.6%) | 19 (3.6%) |
| College / Associate Degree | 527 (91.7%) | 23 (4.0%) |
| Bachelor's Degree or higher | 239 (73.5%) | 0 (0.0%) |
| Total | 1,224 (75.4%) | 50 (3.1%) |
Employment Occupations by Sex in Harper County
Management, Business, Science and Arts Occupations
The most common Management, Business, Science and Arts occupations in Harper County are Management (203 | 14.3%), Health Diagnosing & Treating (114 | 8.1%), Community & Social Service (91 | 6.4%), Education Instruction & Library (70 | 4.9%), and Business & Financial (39 | 2.8%).
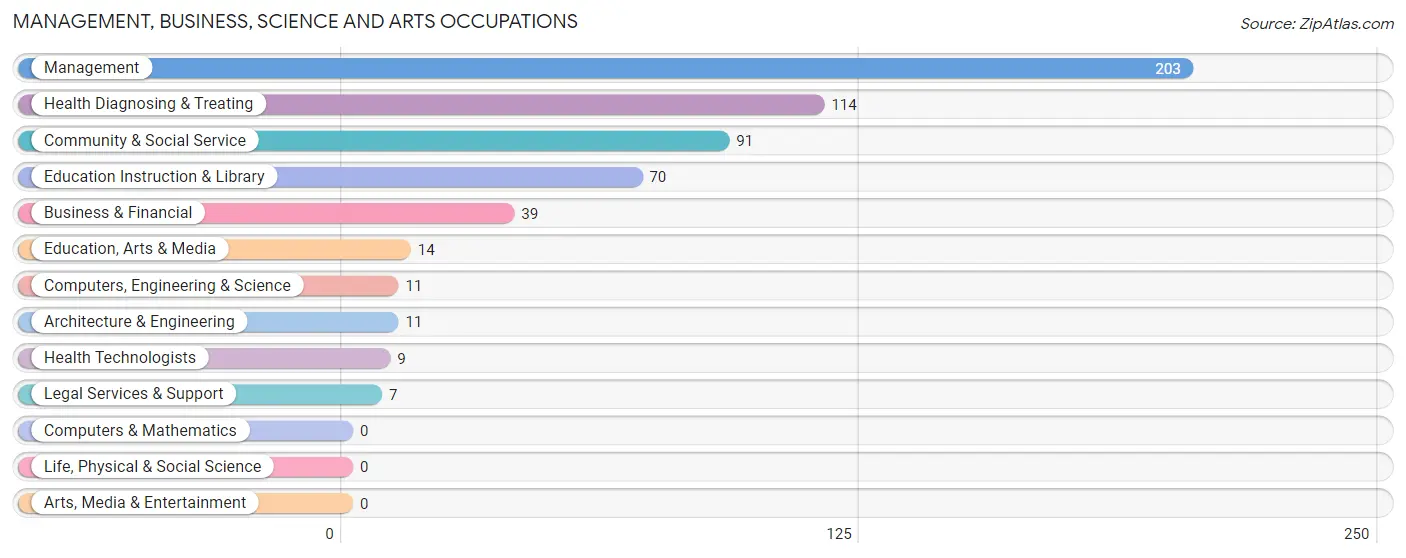
Management, Business, Science and Arts Occupations by Sex
Within the Management, Business, Science and Arts occupations in Harper County, the most male-oriented occupations are Education, Arts & Media (71.4%), Management (60.6%), and Community & Social Service (25.3%), while the most female-oriented occupations are Computers, Engineering & Science (100.0%), Architecture & Engineering (100.0%), and Legal Services & Support (100.0%).

| Occupation | Male | Female |
| Management | 123 (60.6%) | 80 (39.4%) |
| Business & Financial | 5 (12.8%) | 34 (87.2%) |
| Computers, Engineering & Science | 0 (0.0%) | 11 (100.0%) |
| Computers & Mathematics | 0 (0.0%) | 0 (0.0%) |
| Architecture & Engineering | 0 (0.0%) | 11 (100.0%) |
| Life, Physical & Social Science | 0 (0.0%) | 0 (0.0%) |
| Community & Social Service | 23 (25.3%) | 68 (74.7%) |
| Education, Arts & Media | 10 (71.4%) | 4 (28.6%) |
| Legal Services & Support | 0 (0.0%) | 7 (100.0%) |
| Education Instruction & Library | 13 (18.6%) | 57 (81.4%) |
| Arts, Media & Entertainment | 0 (0.0%) | 0 (0.0%) |
| Health Diagnosing & Treating | 0 (0.0%) | 114 (100.0%) |
| Health Technologists | 0 (0.0%) | 9 (100.0%) |
| Total (Category) | 151 (33.0%) | 307 (67.0%) |
| Total (Overall) | 773 (54.5%) | 644 (45.5%) |
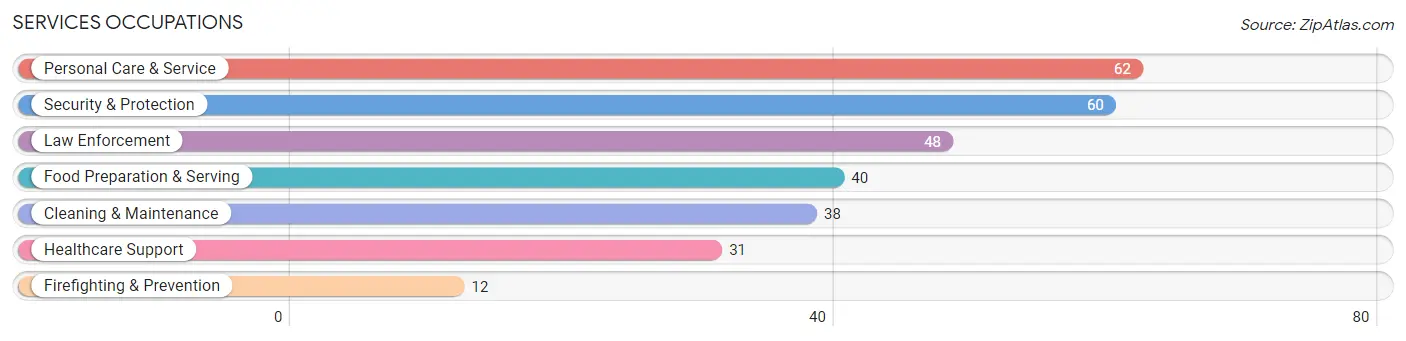
Services Occupations
The most common Services occupations in Harper County are Personal Care & Service (62 | 4.4%), Security & Protection (60 | 4.2%), Law Enforcement (48 | 3.4%), Food Preparation & Serving (40 | 2.8%), and Cleaning & Maintenance (38 | 2.7%).
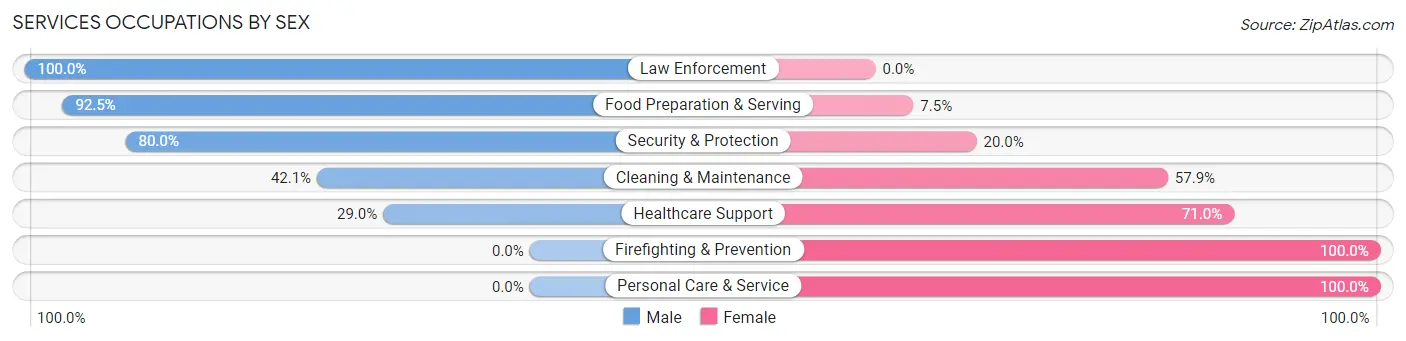
Services Occupations by Sex
Within the Services occupations in Harper County, the most male-oriented occupations are Law Enforcement (100.0%), Food Preparation & Serving (92.5%), and Security & Protection (80.0%), while the most female-oriented occupations are Firefighting & Prevention (100.0%), Personal Care & Service (100.0%), and Healthcare Support (71.0%).
| Occupation | Male | Female |
| Healthcare Support | 9 (29.0%) | 22 (71.0%) |
| Security & Protection | 48 (80.0%) | 12 (20.0%) |
| Firefighting & Prevention | 0 (0.0%) | 12 (100.0%) |
| Law Enforcement | 48 (100.0%) | 0 (0.0%) |
| Food Preparation & Serving | 37 (92.5%) | 3 (7.5%) |
| Cleaning & Maintenance | 16 (42.1%) | 22 (57.9%) |
| Personal Care & Service | 0 (0.0%) | 62 (100.0%) |
| Total (Category) | 110 (47.6%) | 121 (52.4%) |
| Total (Overall) | 773 (54.5%) | 644 (45.5%) |
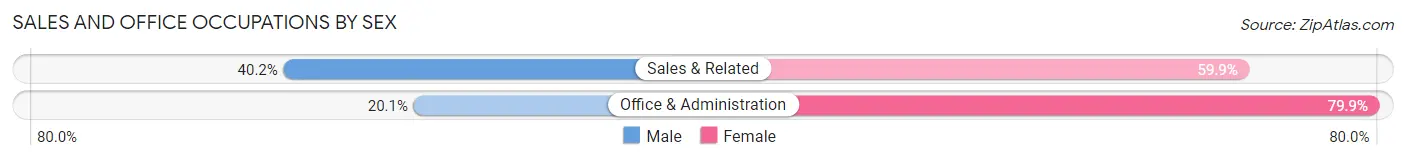
Sales and Office Occupations
The most common Sales and Office occupations in Harper County are Office & Administration (164 | 11.6%), and Sales & Related (132 | 9.3%).

Sales and Office Occupations by Sex
| Occupation | Male | Female |
| Sales & Related | 53 (40.2%) | 79 (59.9%) |
| Office & Administration | 33 (20.1%) | 131 (79.9%) |
| Total (Category) | 86 (29.0%) | 210 (71.0%) |
| Total (Overall) | 773 (54.5%) | 644 (45.5%) |
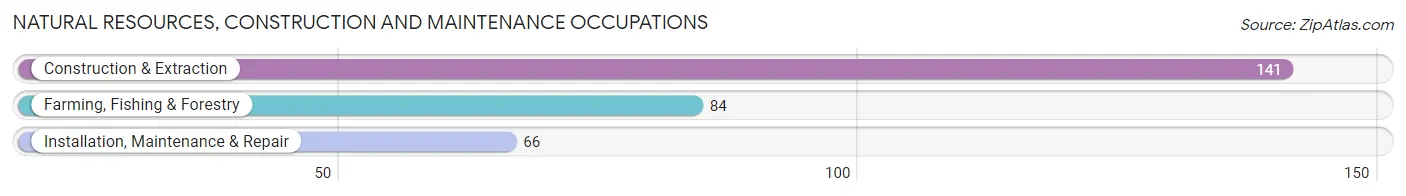
Natural Resources, Construction and Maintenance Occupations
The most common Natural Resources, Construction and Maintenance occupations in Harper County are Construction & Extraction (141 | 10.0%), Farming, Fishing & Forestry (84 | 5.9%), and Installation, Maintenance & Repair (66 | 4.7%).
Natural Resources, Construction and Maintenance Occupations by Sex
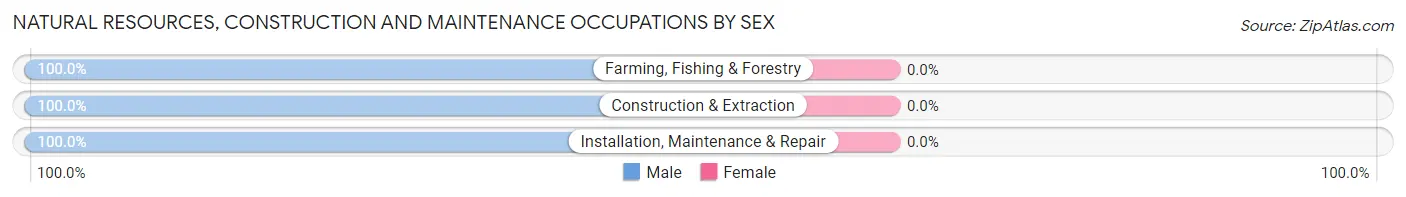
| Occupation | Male | Female |
| Farming, Fishing & Forestry | 84 (100.0%) | 0 (0.0%) |
| Construction & Extraction | 141 (100.0%) | 0 (0.0%) |
| Installation, Maintenance & Repair | 66 (100.0%) | 0 (0.0%) |
| Total (Category) | 291 (100.0%) | 0 (0.0%) |
| Total (Overall) | 773 (54.5%) | 644 (45.5%) |
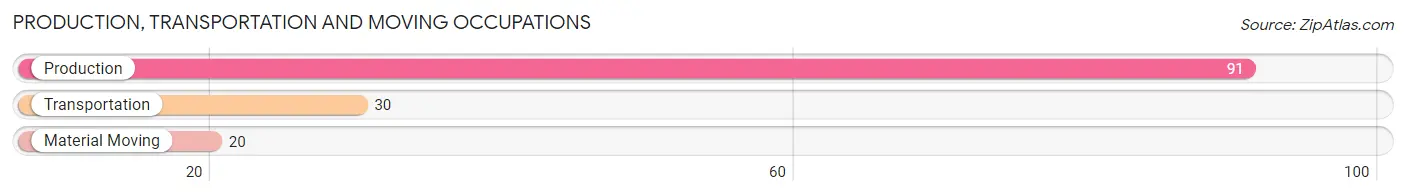
Production, Transportation and Moving Occupations
The most common Production, Transportation and Moving occupations in Harper County are Production (91 | 6.4%), Transportation (30 | 2.1%), and Material Moving (20 | 1.4%).
Production, Transportation and Moving Occupations by Sex
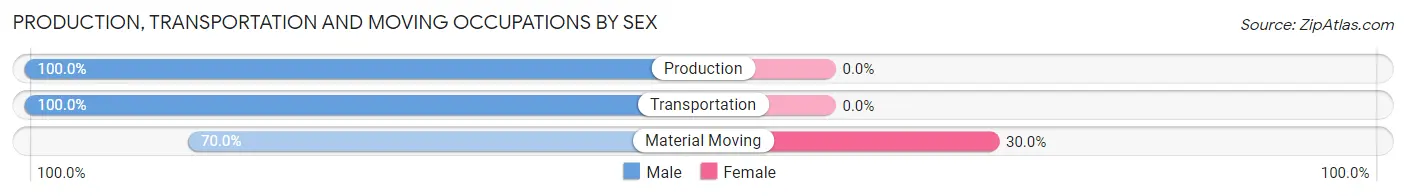
| Occupation | Male | Female |
| Production | 91 (100.0%) | 0 (0.0%) |
| Transportation | 30 (100.0%) | 0 (0.0%) |
| Material Moving | 14 (70.0%) | 6 (30.0%) |
| Total (Category) | 135 (95.7%) | 6 (4.3%) |
| Total (Overall) | 773 (54.5%) | 644 (45.5%) |
Employment Industries by Sex in Harper County
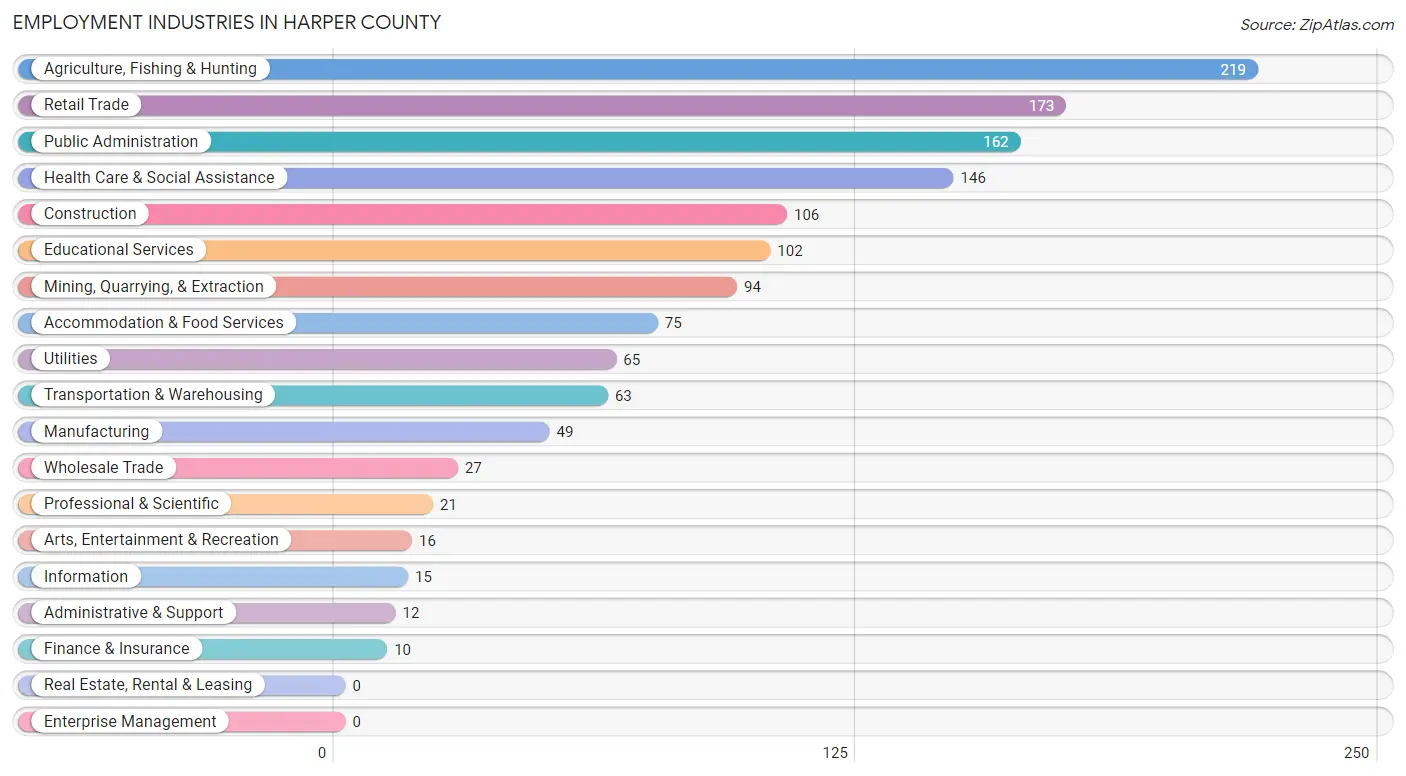
Employment Industries in Harper County
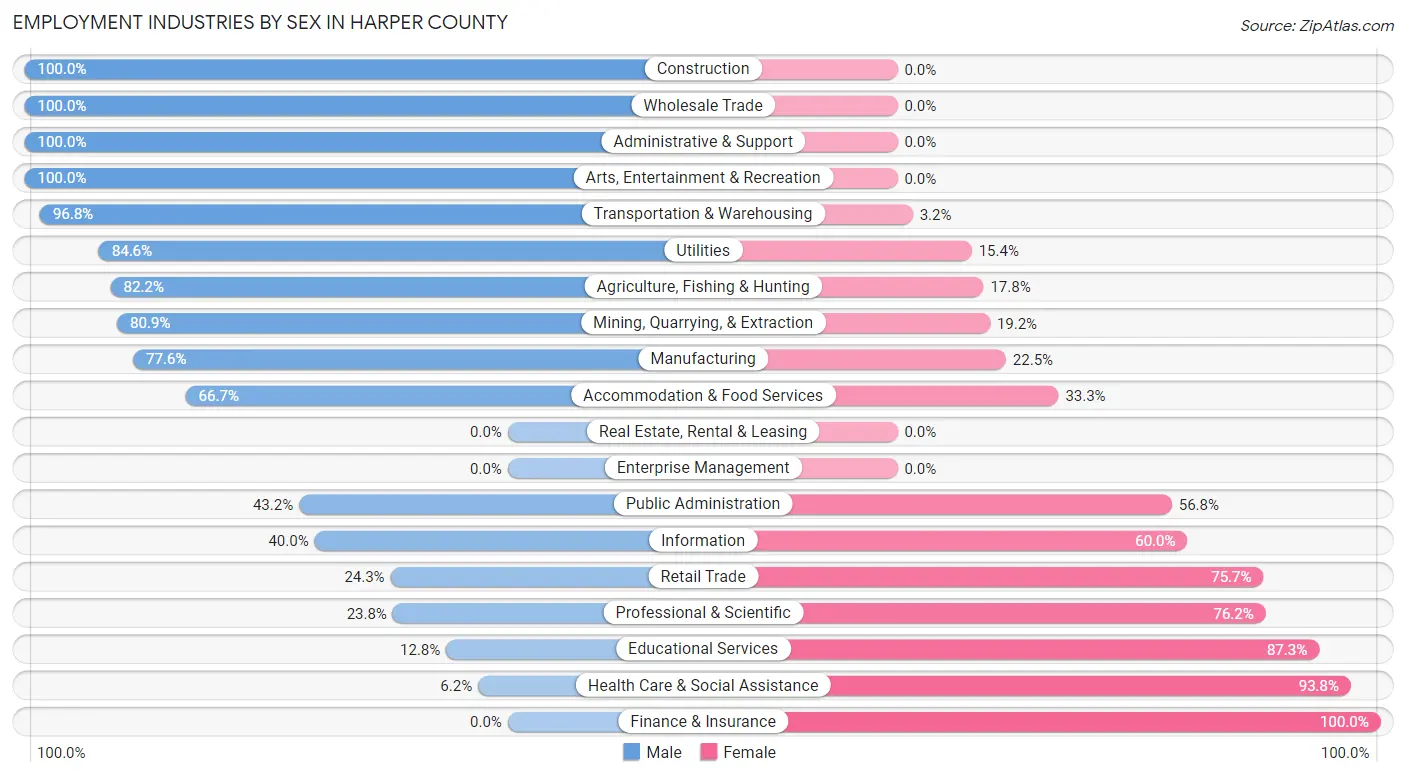
The major employment industries in Harper County include Agriculture, Fishing & Hunting (219 | 15.5%), Retail Trade (173 | 12.2%), Public Administration (162 | 11.4%), Health Care & Social Assistance (146 | 10.3%), and Construction (106 | 7.5%).
Employment Industries by Sex in Harper County
The Harper County industries that see more men than women are Construction (100.0%), Wholesale Trade (100.0%), and Administrative & Support (100.0%), whereas the industries that tend to have a higher number of women are Finance & Insurance (100.0%), Health Care & Social Assistance (93.8%), and Educational Services (87.3%).
| Industry | Male | Female |
| Agriculture, Fishing & Hunting | 180 (82.2%) | 39 (17.8%) |
| Mining, Quarrying, & Extraction | 76 (80.8%) | 18 (19.2%) |
| Construction | 106 (100.0%) | 0 (0.0%) |
| Manufacturing | 38 (77.5%) | 11 (22.5%) |
| Wholesale Trade | 27 (100.0%) | 0 (0.0%) |
| Retail Trade | 42 (24.3%) | 131 (75.7%) |
| Transportation & Warehousing | 61 (96.8%) | 2 (3.2%) |
| Utilities | 55 (84.6%) | 10 (15.4%) |
| Information | 6 (40.0%) | 9 (60.0%) |
| Finance & Insurance | 0 (0.0%) | 10 (100.0%) |
| Real Estate, Rental & Leasing | 0 (0.0%) | 0 (0.0%) |
| Professional & Scientific | 5 (23.8%) | 16 (76.2%) |
| Enterprise Management | 0 (0.0%) | 0 (0.0%) |
| Administrative & Support | 12 (100.0%) | 0 (0.0%) |
| Educational Services | 13 (12.8%) | 89 (87.3%) |
| Health Care & Social Assistance | 9 (6.2%) | 137 (93.8%) |
| Arts, Entertainment & Recreation | 16 (100.0%) | 0 (0.0%) |
| Accommodation & Food Services | 50 (66.7%) | 25 (33.3%) |
| Public Administration | 70 (43.2%) | 92 (56.8%) |
| Total | 773 (54.5%) | 644 (45.5%) |
Education in Harper County
School Enrollment in Harper County
The most common levels of schooling among the 772 students in Harper County are high school (251 | 32.5%), elementary school (171 | 22.2%), and middle school (156 | 20.2%).

| School Level | # Students | % Students |
| Nursery / Preschool | 16 | 2.1% |
| Kindergarten | 113 | 14.6% |
| Elementary School | 171 | 22.2% |
| Middle School | 156 | 20.2% |
| High School | 251 | 32.5% |
| College / Undergraduate | 59 | 7.6% |
| Graduate / Professional | 6 | 0.8% |
| Total | 772 | 100.0% |
School Enrollment by Age by Funding Source in Harper County
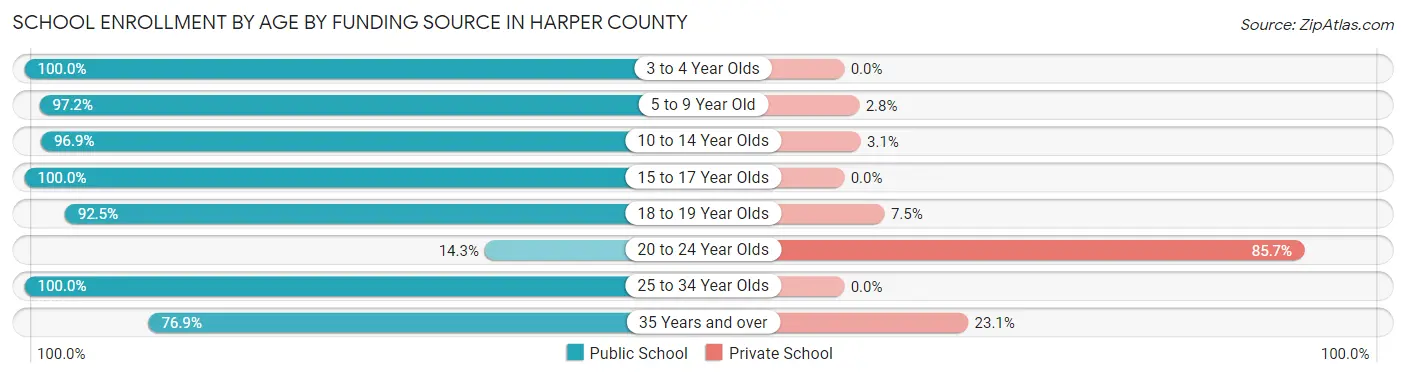
Out of a total of 772 students who are enrolled in schools in Harper County, 48 (6.2%) attend a private institution, while the remaining 724 (93.8%) are enrolled in public schools. The age group of 20 to 24 year olds has the highest likelihood of being enrolled in private schools, with 18 (85.7% in the age bracket) enrolled. Conversely, the age group of 3 to 4 year olds has the lowest likelihood of being enrolled in a private school, with 49 (100.0% in the age bracket) attending a public institution.
| Age Bracket | Public School | Private School |
| 3 to 4 Year Olds | 49 (100.0%) | 0 (0.0%) |
| 5 to 9 Year Old | 208 (97.2%) | 6 (2.8%) |
| 10 to 14 Year Olds | 190 (96.9%) | 6 (3.1%) |
| 15 to 17 Year Olds | 127 (100.0%) | 0 (0.0%) |
| 18 to 19 Year Olds | 111 (92.5%) | 9 (7.5%) |
| 20 to 24 Year Olds | 3 (14.3%) | 18 (85.7%) |
| 25 to 34 Year Olds | 6 (100.0%) | 0 (0.0%) |
| 35 Years and over | 30 (76.9%) | 9 (23.1%) |
| Total | 724 (93.8%) | 48 (6.2%) |
Educational Attainment by Field of Study in Harper County
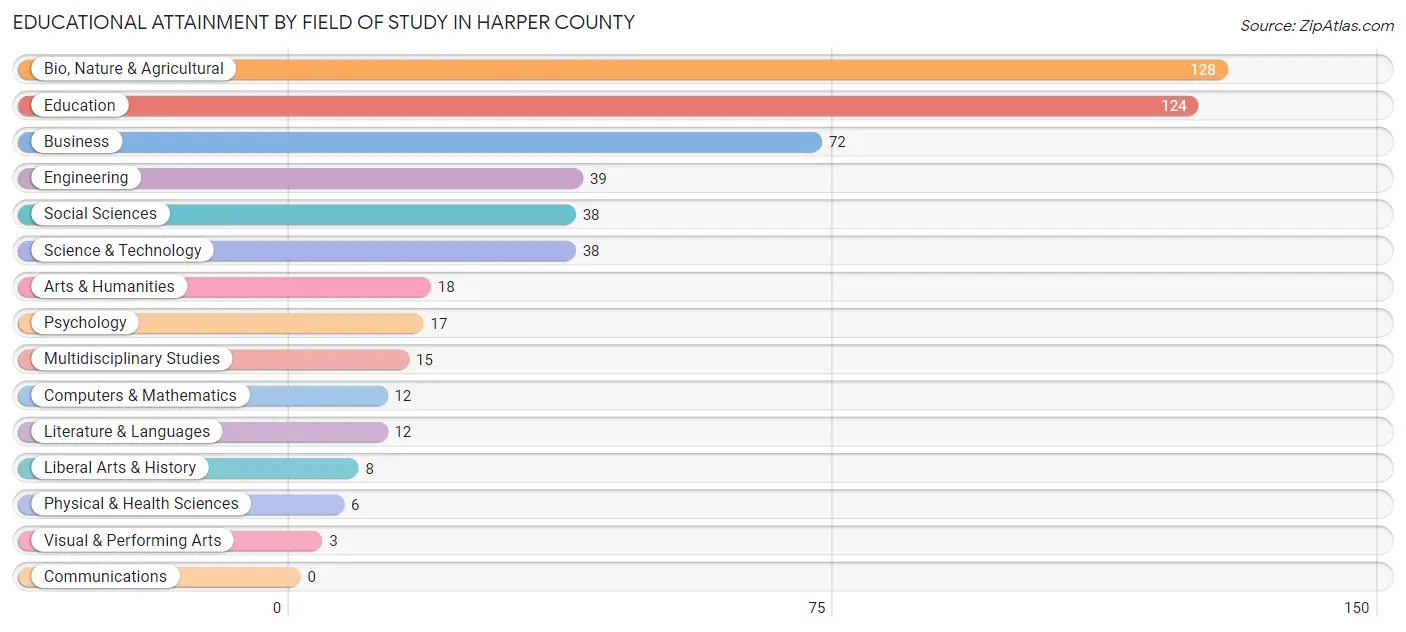
Bio, nature & agricultural (128 | 24.1%), education (124 | 23.4%), business (72 | 13.6%), engineering (39 | 7.4%), and social sciences (38 | 7.2%) are the most common fields of study among 530 individuals in Harper County who have obtained a bachelor's degree or higher.
| Field of Study | # Graduates | % Graduates |
| Computers & Mathematics | 12 | 2.3% |
| Bio, Nature & Agricultural | 128 | 24.1% |
| Physical & Health Sciences | 6 | 1.1% |
| Psychology | 17 | 3.2% |
| Social Sciences | 38 | 7.2% |
| Engineering | 39 | 7.4% |
| Multidisciplinary Studies | 15 | 2.8% |
| Science & Technology | 38 | 7.2% |
| Business | 72 | 13.6% |
| Education | 124 | 23.4% |
| Literature & Languages | 12 | 2.3% |
| Liberal Arts & History | 8 | 1.5% |
| Visual & Performing Arts | 3 | 0.6% |
| Communications | 0 | 0.0% |
| Arts & Humanities | 18 | 3.4% |
| Total | 530 | 100.0% |
Transportation & Commute in Harper County
Vehicle Availability by Sex in Harper County
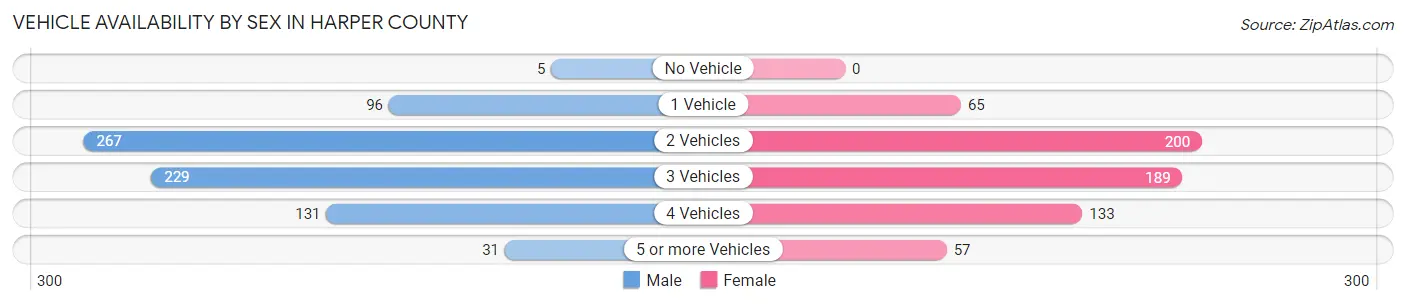
The most prevalent vehicle ownership categories in Harper County are males with 2 vehicles (267, accounting for 35.2%) and females with 2 vehicles (200, making up 41.5%).
| Vehicles Available | Male | Female |
| No Vehicle | 5 (0.7%) | 0 (0.0%) |
| 1 Vehicle | 96 (12.7%) | 65 (10.1%) |
| 2 Vehicles | 267 (35.2%) | 200 (31.1%) |
| 3 Vehicles | 229 (30.2%) | 189 (29.3%) |
| 4 Vehicles | 131 (17.3%) | 133 (20.6%) |
| 5 or more Vehicles | 31 (4.1%) | 57 (8.8%) |
| Total | 759 (100.0%) | 644 (100.0%) |
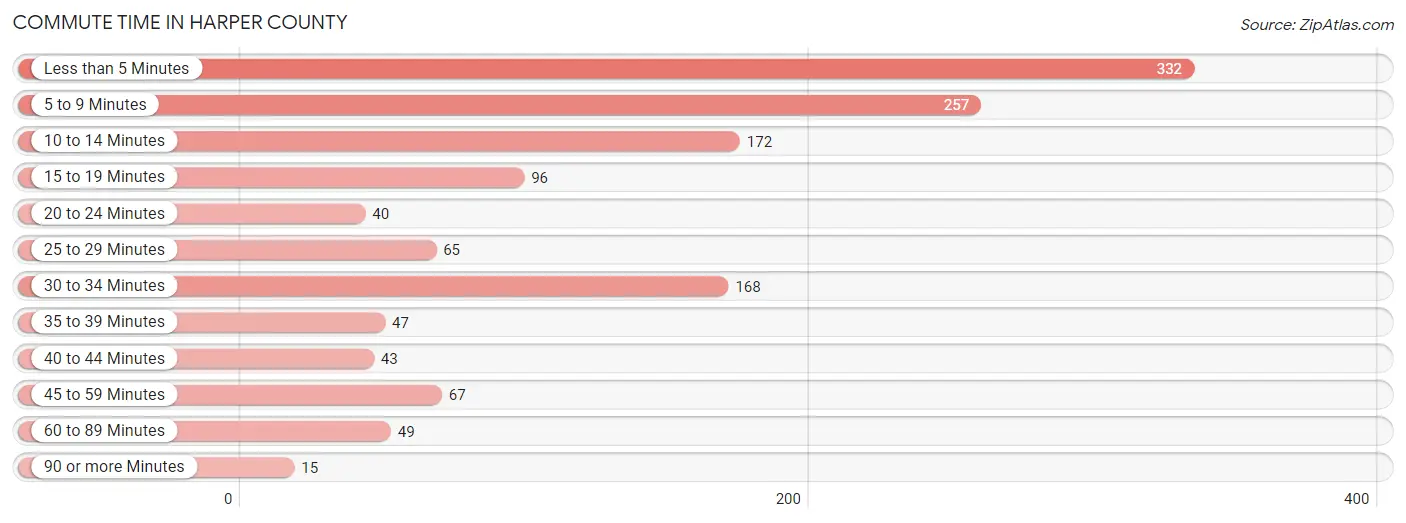
Commute Time in Harper County
The most frequently occuring commute durations in Harper County are less than 5 minutes (332 commuters, 24.6%), 5 to 9 minutes (257 commuters, 19.0%), and 10 to 14 minutes (172 commuters, 12.7%).
| Commute Time | # Commuters | % Commuters |
| Less than 5 Minutes | 332 | 24.6% |
| 5 to 9 Minutes | 257 | 19.0% |
| 10 to 14 Minutes | 172 | 12.7% |
| 15 to 19 Minutes | 96 | 7.1% |
| 20 to 24 Minutes | 40 | 3.0% |
| 25 to 29 Minutes | 65 | 4.8% |
| 30 to 34 Minutes | 168 | 12.4% |
| 35 to 39 Minutes | 47 | 3.5% |
| 40 to 44 Minutes | 43 | 3.2% |
| 45 to 59 Minutes | 67 | 5.0% |
| 60 to 89 Minutes | 49 | 3.6% |
| 90 or more Minutes | 15 | 1.1% |
Commute Time by Sex in Harper County
The most common commute times in Harper County are less than 5 minutes (175 commuters, 23.7%) for males and 5 to 9 minutes (169 commuters, 27.6%) for females.

| Commute Time | Male | Female |
| Less than 5 Minutes | 175 (23.7%) | 157 (25.7%) |
| 5 to 9 Minutes | 88 (11.9%) | 169 (27.6%) |
| 10 to 14 Minutes | 109 (14.7%) | 63 (10.3%) |
| 15 to 19 Minutes | 60 (8.1%) | 36 (5.9%) |
| 20 to 24 Minutes | 12 (1.6%) | 28 (4.6%) |
| 25 to 29 Minutes | 44 (5.9%) | 21 (3.4%) |
| 30 to 34 Minutes | 116 (15.7%) | 52 (8.5%) |
| 35 to 39 Minutes | 16 (2.2%) | 31 (5.1%) |
| 40 to 44 Minutes | 28 (3.8%) | 15 (2.5%) |
| 45 to 59 Minutes | 46 (6.2%) | 21 (3.4%) |
| 60 to 89 Minutes | 34 (4.6%) | 15 (2.5%) |
| 90 or more Minutes | 11 (1.5%) | 4 (0.6%) |
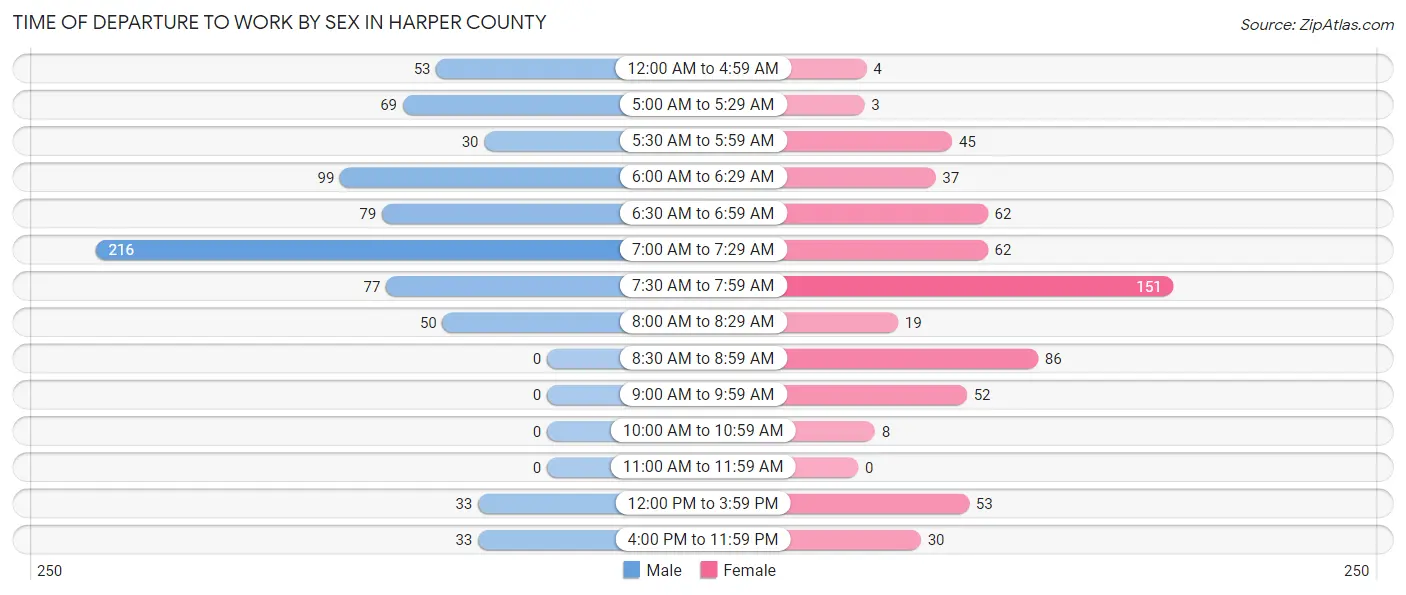
Time of Departure to Work by Sex in Harper County
The most frequent times of departure to work in Harper County are 7:00 AM to 7:29 AM (216, 29.2%) for males and 7:30 AM to 7:59 AM (151, 24.7%) for females.
| Time of Departure | Male | Female |
| 12:00 AM to 4:59 AM | 53 (7.2%) | 4 (0.6%) |
| 5:00 AM to 5:29 AM | 69 (9.3%) | 3 (0.5%) |
| 5:30 AM to 5:59 AM | 30 (4.1%) | 45 (7.3%) |
| 6:00 AM to 6:29 AM | 99 (13.4%) | 37 (6.0%) |
| 6:30 AM to 6:59 AM | 79 (10.7%) | 62 (10.1%) |
| 7:00 AM to 7:29 AM | 216 (29.2%) | 62 (10.1%) |
| 7:30 AM to 7:59 AM | 77 (10.4%) | 151 (24.7%) |
| 8:00 AM to 8:29 AM | 50 (6.8%) | 19 (3.1%) |
| 8:30 AM to 8:59 AM | 0 (0.0%) | 86 (14.1%) |
| 9:00 AM to 9:59 AM | 0 (0.0%) | 52 (8.5%) |
| 10:00 AM to 10:59 AM | 0 (0.0%) | 8 (1.3%) |
| 11:00 AM to 11:59 AM | 0 (0.0%) | 0 (0.0%) |
| 12:00 PM to 3:59 PM | 33 (4.5%) | 53 (8.7%) |
| 4:00 PM to 11:59 PM | 33 (4.5%) | 30 (4.9%) |
| Total | 739 (100.0%) | 612 (100.0%) |
Housing Occupancy in Harper County
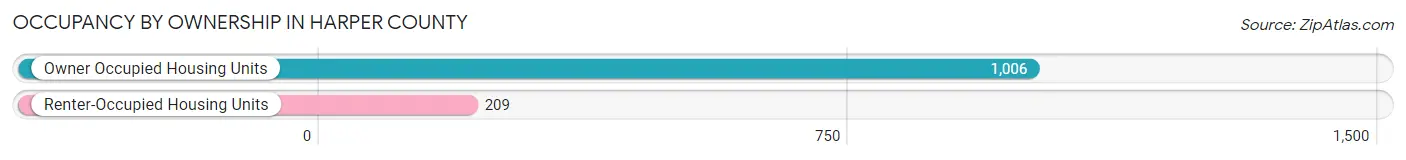
Occupancy by Ownership in Harper County
Of the total 1,215 dwellings in Harper County, owner-occupied units account for 1,006 (82.8%), while renter-occupied units make up 209 (17.2%).
| Occupancy | # Housing Units | % Housing Units |
| Owner Occupied Housing Units | 1,006 | 82.8% |
| Renter-Occupied Housing Units | 209 | 17.2% |
| Total Occupied Housing Units | 1,215 | 100.0% |
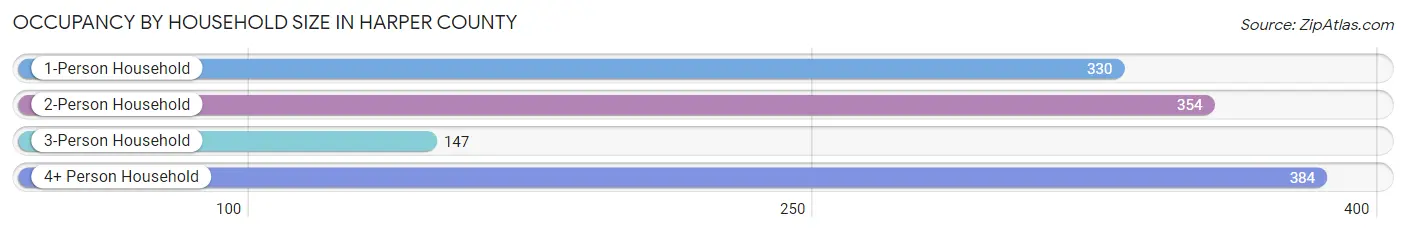
Occupancy by Household Size in Harper County
| Household Size | # Housing Units | % Housing Units |
| 1-Person Household | 330 | 27.2% |
| 2-Person Household | 354 | 29.1% |
| 3-Person Household | 147 | 12.1% |
| 4+ Person Household | 384 | 31.6% |
| Total Housing Units | 1,215 | 100.0% |
Occupancy by Ownership by Household Size in Harper County
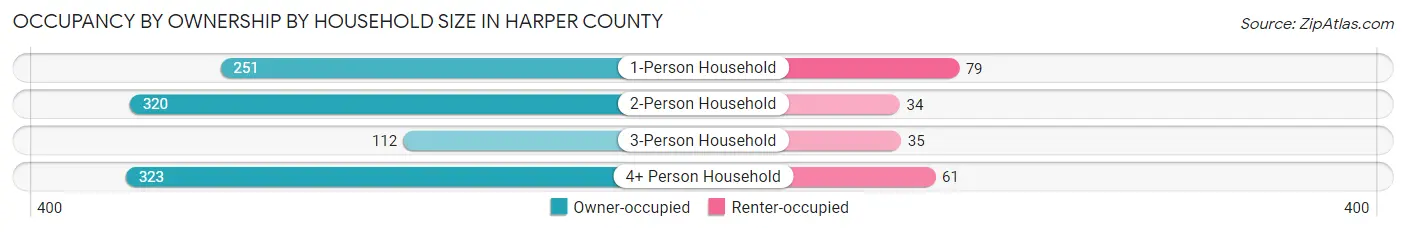
| Household Size | Owner-occupied | Renter-occupied |
| 1-Person Household | 251 (76.1%) | 79 (23.9%) |
| 2-Person Household | 320 (90.4%) | 34 (9.6%) |
| 3-Person Household | 112 (76.2%) | 35 (23.8%) |
| 4+ Person Household | 323 (84.1%) | 61 (15.9%) |
| Total Housing Units | 1,006 (82.8%) | 209 (17.2%) |
Occupancy by Educational Attainment in Harper County
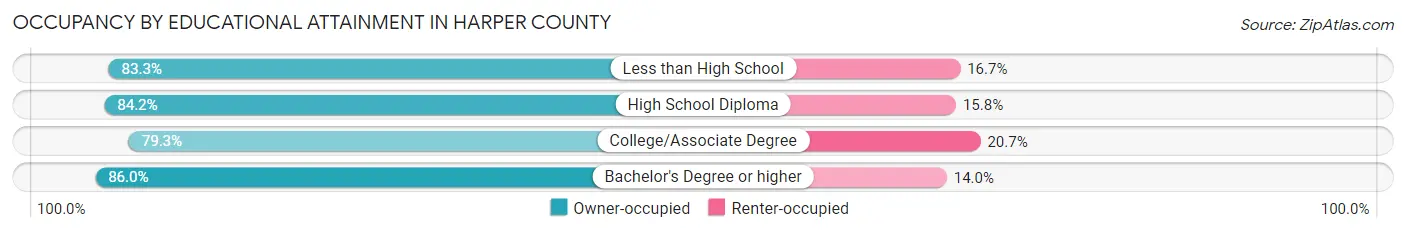
| Household Size | Owner-occupied | Renter-occupied |
| Less than High School | 95 (83.3%) | 19 (16.7%) |
| High School Diploma | 298 (84.2%) | 56 (15.8%) |
| College/Associate Degree | 349 (79.3%) | 91 (20.7%) |
| Bachelor's Degree or higher | 264 (86.0%) | 43 (14.0%) |
Occupancy by Age of Householder in Harper County
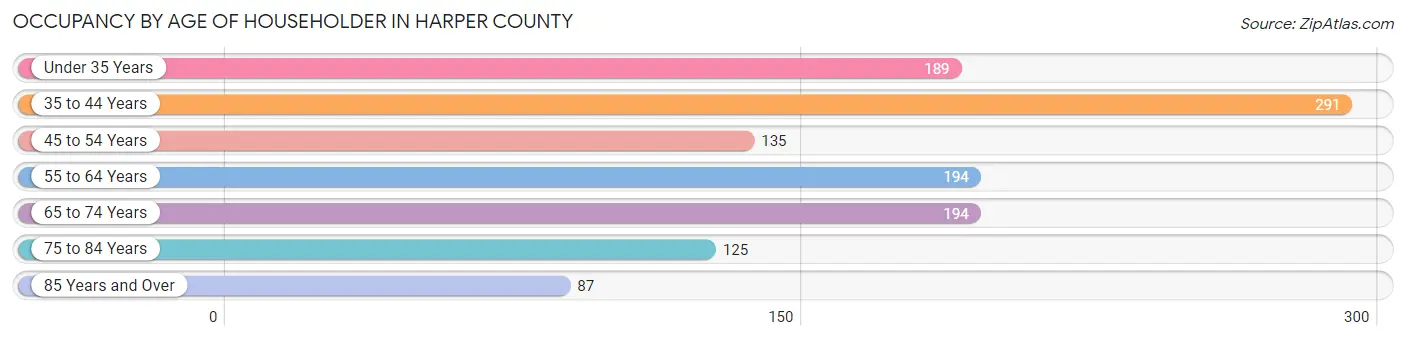
| Age Bracket | # Households | % Households |
| Under 35 Years | 189 | 15.6% |
| 35 to 44 Years | 291 | 23.9% |
| 45 to 54 Years | 135 | 11.1% |
| 55 to 64 Years | 194 | 16.0% |
| 65 to 74 Years | 194 | 16.0% |
| 75 to 84 Years | 125 | 10.3% |
| 85 Years and Over | 87 | 7.2% |
| Total | 1,215 | 100.0% |
Housing Finances in Harper County
Median Income by Occupancy in Harper County

| Occupancy Type | # Households | Median Income |
| Owner-Occupied | 1,006 (82.8%) | $64,000 |
| Renter-Occupied | 209 (17.2%) | $47,841 |
| Average | 1,215 (100.0%) | $59,934 |
Occupancy by Householder Income Bracket in Harper County

| Income Bracket | Owner-occupied | Renter-occupied |
| Less than $5,000 | 4 (0.4%) | 0 (0.0%) |
| $5,000 to $9,999 | 19 (1.9%) | 2 (1.0%) |
| $10,000 to $14,999 | 12 (1.2%) | 46 (22.0%) |
| $15,000 to $19,999 | 69 (6.9%) | 0 (0.0%) |
| $20,000 to $24,999 | 46 (4.6%) | 1 (0.5%) |
| $25,000 to $34,999 | 100 (9.9%) | 14 (6.7%) |
| $35,000 to $49,999 | 166 (16.5%) | 51 (24.4%) |
| $50,000 to $74,999 | 177 (17.6%) | 42 (20.1%) |
| $75,000 to $99,999 | 147 (14.6%) | 34 (16.3%) |
| $100,000 to $149,999 | 183 (18.2%) | 19 (9.1%) |
| $150,000 or more | 83 (8.3%) | 0 (0.0%) |
| Total | 1,006 (100.0%) | 209 (100.0%) |
Monthly Housing Cost Tiers in Harper County

| Monthly Cost | Owner-occupied | Renter-occupied |
| Less than $300 | 71 (7.1%) | 0 (0.0%) |
| $300 to $499 | 250 (24.8%) | 7 (3.4%) |
| $500 to $799 | 297 (29.5%) | 75 (35.9%) |
| $800 to $999 | 116 (11.5%) | 72 (34.4%) |
| $1,000 to $1,499 | 206 (20.5%) | 0 (0.0%) |
| $1,500 to $1,999 | 66 (6.6%) | 0 (0.0%) |
| $2,000 to $2,499 | 0 (0.0%) | 0 (0.0%) |
| $2,500 to $2,999 | 0 (0.0%) | 0 (0.0%) |
| $3,000 or more | 0 (0.0%) | 0 (0.0%) |
| Total | 1,006 (100.0%) | 209 (100.0%) |
Physical Housing Characteristics in Harper County
Housing Structures in Harper County
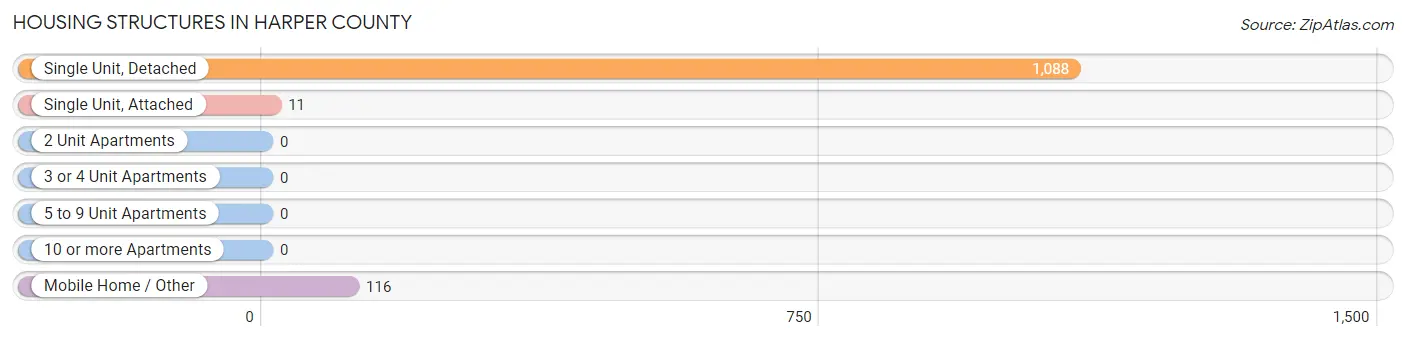
| Structure Type | # Housing Units | % Housing Units |
| Single Unit, Detached | 1,088 | 89.5% |
| Single Unit, Attached | 11 | 0.9% |
| 2 Unit Apartments | 0 | 0.0% |
| 3 or 4 Unit Apartments | 0 | 0.0% |
| 5 to 9 Unit Apartments | 0 | 0.0% |
| 10 or more Apartments | 0 | 0.0% |
| Mobile Home / Other | 116 | 9.6% |
| Total | 1,215 | 100.0% |
Housing Structures by Occupancy in Harper County

| Structure Type | Owner-occupied | Renter-occupied |
| Single Unit, Detached | 881 (81.0%) | 207 (19.0%) |
| Single Unit, Attached | 11 (100.0%) | 0 (0.0%) |
| 2 Unit Apartments | 0 (0.0%) | 0 (0.0%) |
| 3 or 4 Unit Apartments | 0 (0.0%) | 0 (0.0%) |
| 5 to 9 Unit Apartments | 0 (0.0%) | 0 (0.0%) |
| 10 or more Apartments | 0 (0.0%) | 0 (0.0%) |
| Mobile Home / Other | 114 (98.3%) | 2 (1.7%) |
| Total | 1,006 (82.8%) | 209 (17.2%) |
Housing Structures by Number of Rooms in Harper County
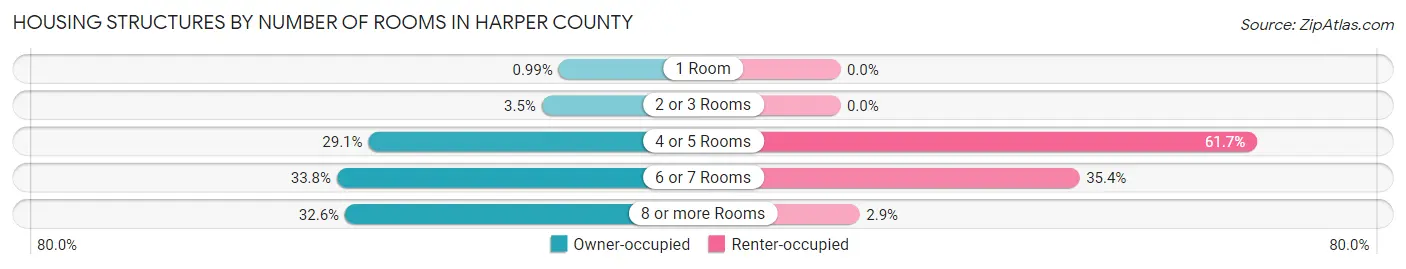
| Number of Rooms | Owner-occupied | Renter-occupied |
| 1 Room | 10 (1.0%) | 0 (0.0%) |
| 2 or 3 Rooms | 35 (3.5%) | 0 (0.0%) |
| 4 or 5 Rooms | 293 (29.1%) | 129 (61.7%) |
| 6 or 7 Rooms | 340 (33.8%) | 74 (35.4%) |
| 8 or more Rooms | 328 (32.6%) | 6 (2.9%) |
| Total | 1,006 (100.0%) | 209 (100.0%) |
Housing Structure by Heating Type in Harper County
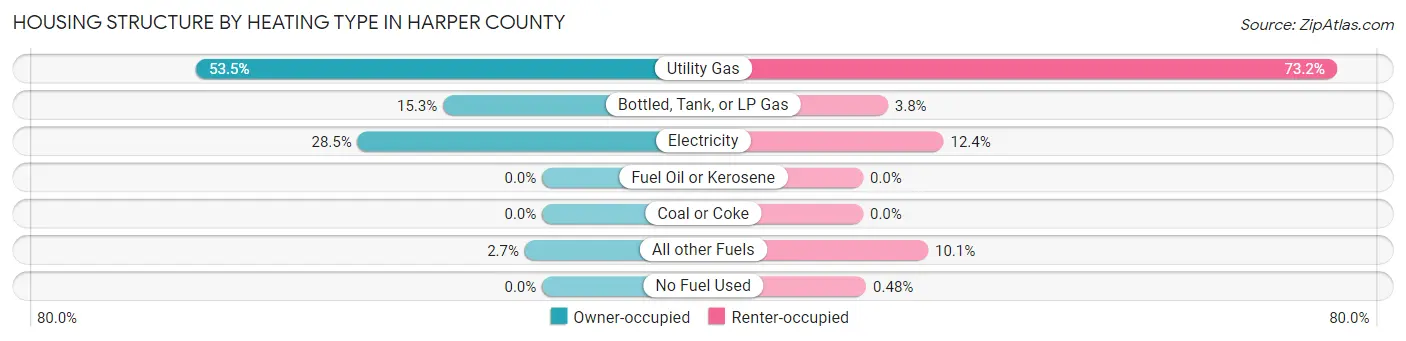
| Heating Type | Owner-occupied | Renter-occupied |
| Utility Gas | 538 (53.5%) | 153 (73.2%) |
| Bottled, Tank, or LP Gas | 154 (15.3%) | 8 (3.8%) |
| Electricity | 287 (28.5%) | 26 (12.4%) |
| Fuel Oil or Kerosene | 0 (0.0%) | 0 (0.0%) |
| Coal or Coke | 0 (0.0%) | 0 (0.0%) |
| All other Fuels | 27 (2.7%) | 21 (10.1%) |
| No Fuel Used | 0 (0.0%) | 1 (0.5%) |
| Total | 1,006 (100.0%) | 209 (100.0%) |
Household Vehicle Usage in Harper County
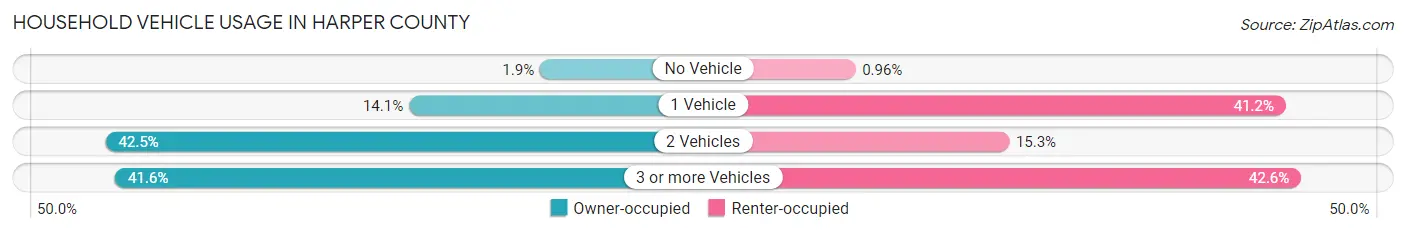
| Vehicles per Household | Owner-occupied | Renter-occupied |
| No Vehicle | 19 (1.9%) | 2 (1.0%) |
| 1 Vehicle | 142 (14.1%) | 86 (41.1%) |
| 2 Vehicles | 427 (42.4%) | 32 (15.3%) |
| 3 or more Vehicles | 418 (41.5%) | 89 (42.6%) |
| Total | 1,006 (100.0%) | 209 (100.0%) |
Real Estate & Mortgages in Harper County
Real Estate and Mortgage Overview in Harper County
| Characteristic | Without Mortgage | With Mortgage |
| Housing Units | 611 | 395 |
| Median Property Value | $99,200 | $86,300 |
| Median Household Income | $54,554 | $36 |
| Monthly Housing Costs | $487 | $0 |
| Real Estate Taxes | $650 | $0 |
Property Value by Mortgage Status in Harper County
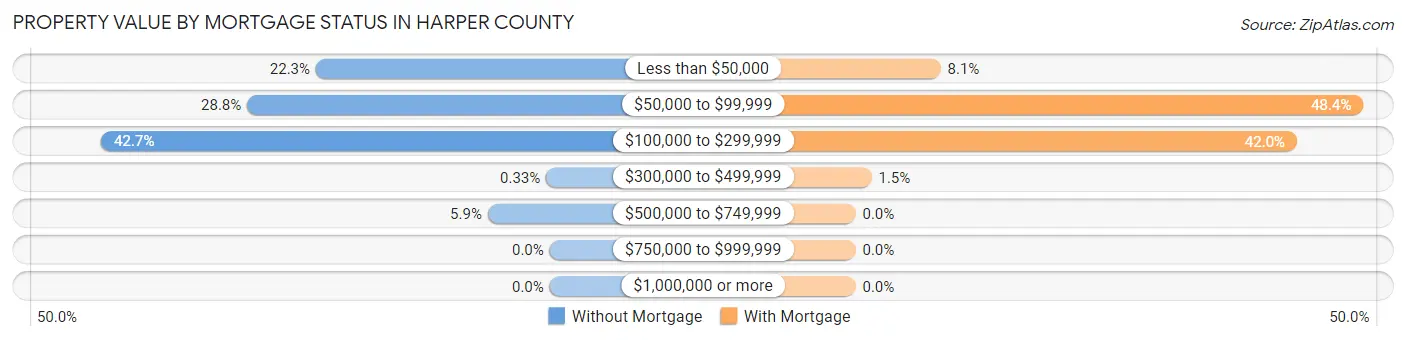
| Property Value | Without Mortgage | With Mortgage |
| Less than $50,000 | 136 (22.3%) | 32 (8.1%) |
| $50,000 to $99,999 | 176 (28.8%) | 191 (48.3%) |
| $100,000 to $299,999 | 261 (42.7%) | 166 (42.0%) |
| $300,000 to $499,999 | 2 (0.3%) | 6 (1.5%) |
| $500,000 to $749,999 | 36 (5.9%) | 0 (0.0%) |
| $750,000 to $999,999 | 0 (0.0%) | 0 (0.0%) |
| $1,000,000 or more | 0 (0.0%) | 0 (0.0%) |
| Total | 611 (100.0%) | 395 (100.0%) |
Household Income by Mortgage Status in Harper County
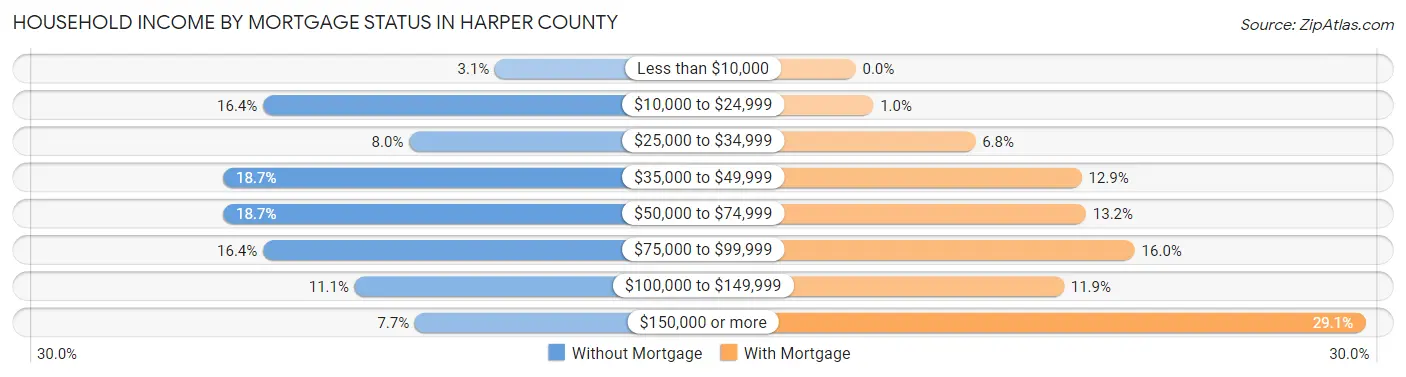
| Household Income | Without Mortgage | With Mortgage |
| Less than $10,000 | 19 (3.1%) | 0 (0.0%) |
| $10,000 to $24,999 | 100 (16.4%) | 4 (1.0%) |
| $25,000 to $34,999 | 49 (8.0%) | 27 (6.8%) |
| $35,000 to $49,999 | 114 (18.7%) | 51 (12.9%) |
| $50,000 to $74,999 | 114 (18.7%) | 52 (13.2%) |
| $75,000 to $99,999 | 100 (16.4%) | 63 (16.0%) |
| $100,000 to $149,999 | 68 (11.1%) | 47 (11.9%) |
| $150,000 or more | 47 (7.7%) | 115 (29.1%) |
| Total | 611 (100.0%) | 395 (100.0%) |
Property Value to Household Income Ratio in Harper County
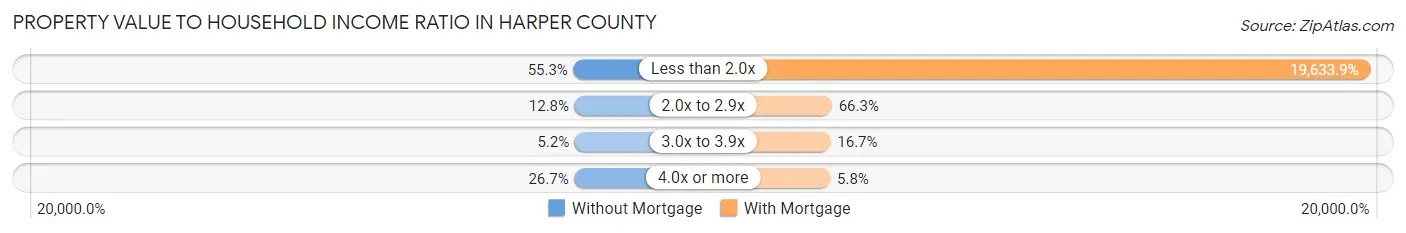
| Value-to-Income Ratio | Without Mortgage | With Mortgage |
| Less than 2.0x | 338 (55.3%) | 77,554 (19,633.9%) |
| 2.0x to 2.9x | 78 (12.8%) | 262 (66.3%) |
| 3.0x to 3.9x | 32 (5.2%) | 66 (16.7%) |
| 4.0x or more | 163 (26.7%) | 23 (5.8%) |
| Total | 611 (100.0%) | 395 (100.0%) |
Real Estate Taxes by Mortgage Status in Harper County
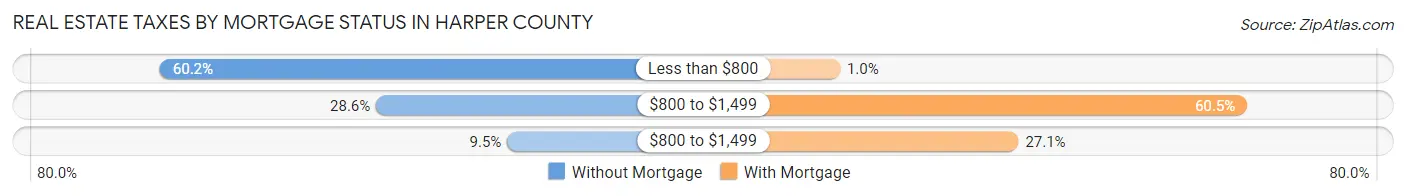
| Property Taxes | Without Mortgage | With Mortgage |
| Less than $800 | 368 (60.2%) | 4 (1.0%) |
| $800 to $1,499 | 175 (28.6%) | 239 (60.5%) |
| $800 to $1,499 | 58 (9.5%) | 107 (27.1%) |
| Total | 611 (100.0%) | 395 (100.0%) |
Health & Disability in Harper County
Health Insurance Coverage by Age in Harper County
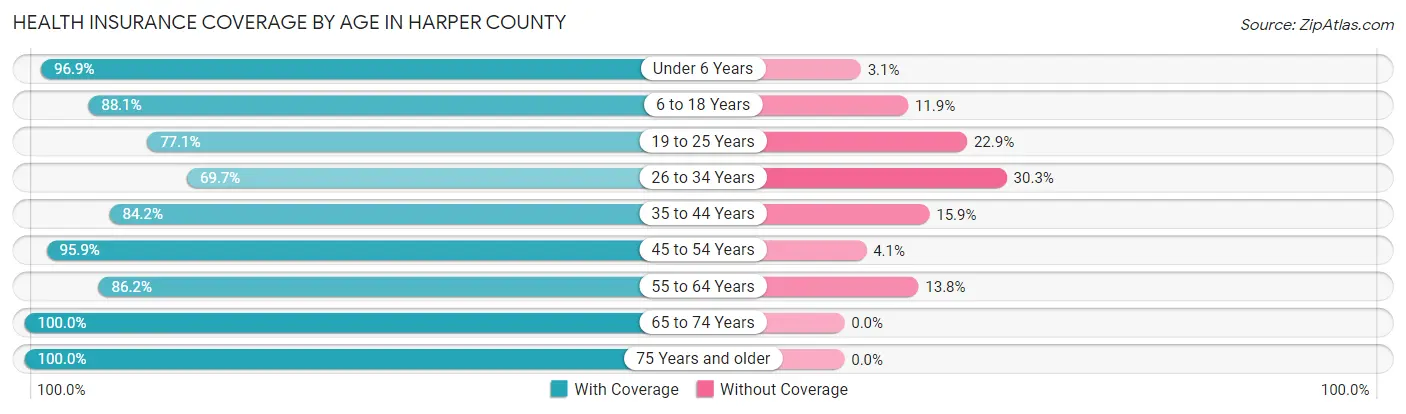
| Age Bracket | With Coverage | Without Coverage |
| Under 6 Years | 221 (96.9%) | 7 (3.1%) |
| 6 to 18 Years | 586 (88.1%) | 79 (11.9%) |
| 19 to 25 Years | 118 (77.1%) | 35 (22.9%) |
| 26 to 34 Years | 228 (69.7%) | 99 (30.3%) |
| 35 to 44 Years | 393 (84.2%) | 74 (15.9%) |
| 45 to 54 Years | 329 (95.9%) | 14 (4.1%) |
| 55 to 64 Years | 387 (86.2%) | 62 (13.8%) |
| 65 to 74 Years | 328 (100.0%) | 0 (0.0%) |
| 75 Years and older | 256 (100.0%) | 0 (0.0%) |
| Total | 2,846 (88.5%) | 370 (11.5%) |
Health Insurance Coverage by Citizenship Status in Harper County
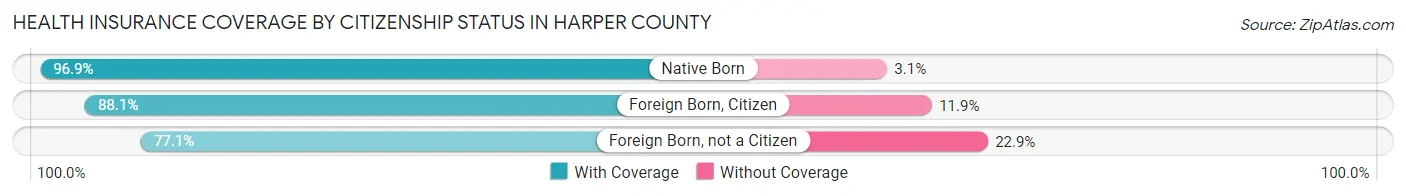
| Citizenship Status | With Coverage | Without Coverage |
| Native Born | 221 (96.9%) | 7 (3.1%) |
| Foreign Born, Citizen | 586 (88.1%) | 79 (11.9%) |
| Foreign Born, not a Citizen | 118 (77.1%) | 35 (22.9%) |
Health Insurance Coverage by Household Income in Harper County

| Household Income | With Coverage | Without Coverage |
| Under $25,000 | 179 (64.4%) | 99 (35.6%) |
| $25,000 to $49,999 | 898 (91.8%) | 80 (8.2%) |
| $50,000 to $74,999 | 507 (93.0%) | 38 (7.0%) |
| $75,000 to $99,999 | 432 (82.4%) | 92 (17.6%) |
| $100,000 and over | 830 (93.1%) | 61 (6.9%) |
Public vs Private Health Insurance Coverage by Age in Harper County
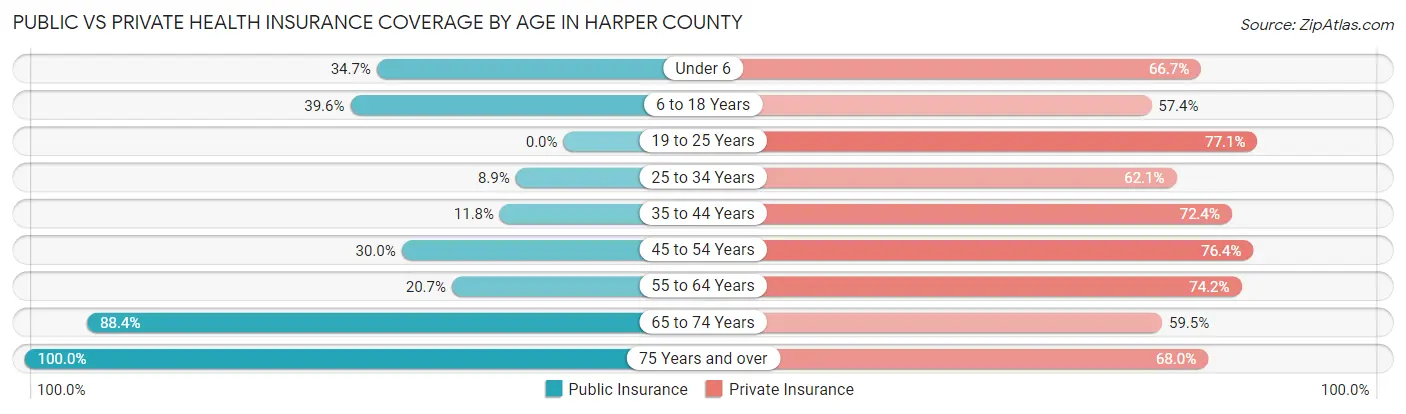
| Age Bracket | Public Insurance | Private Insurance |
| Under 6 | 79 (34.6%) | 152 (66.7%) |
| 6 to 18 Years | 263 (39.6%) | 382 (57.4%) |
| 19 to 25 Years | 0 (0.0%) | 118 (77.1%) |
| 25 to 34 Years | 29 (8.9%) | 203 (62.1%) |
| 35 to 44 Years | 55 (11.8%) | 338 (72.4%) |
| 45 to 54 Years | 103 (30.0%) | 262 (76.4%) |
| 55 to 64 Years | 93 (20.7%) | 333 (74.2%) |
| 65 to 74 Years | 290 (88.4%) | 195 (59.5%) |
| 75 Years and over | 256 (100.0%) | 174 (68.0%) |
| Total | 1,168 (36.3%) | 2,157 (67.1%) |
Disability Status by Sex by Age in Harper County
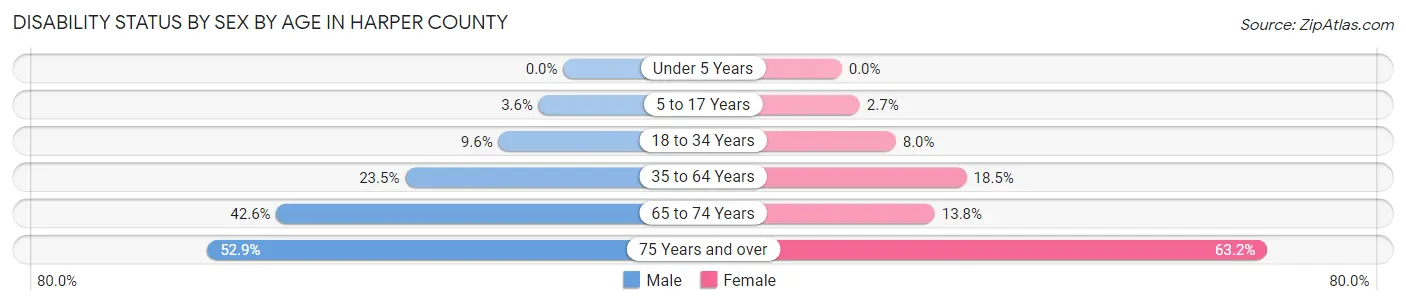
| Age Bracket | Male | Female |
| Under 5 Years | 0 (0.0%) | 0 (0.0%) |
| 5 to 17 Years | 10 (3.6%) | 9 (2.7%) |
| 18 to 34 Years | 29 (9.6%) | 21 (8.0%) |
| 35 to 64 Years | 155 (23.5%) | 111 (18.5%) |
| 65 to 74 Years | 75 (42.6%) | 21 (13.8%) |
| 75 Years and over | 55 (52.9%) | 96 (63.2%) |
Disability Class by Sex by Age in Harper County
Disability Class: Hearing Difficulty
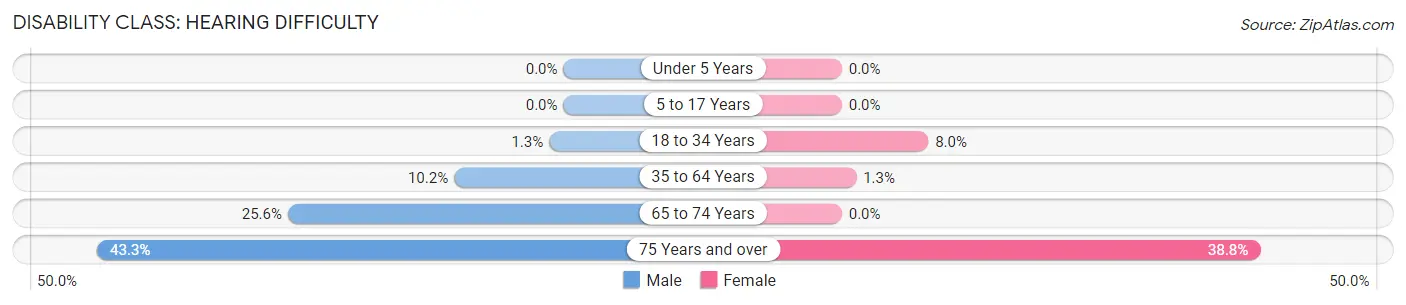
| Age Bracket | Male | Female |
| Under 5 Years | 0 (0.0%) | 0 (0.0%) |
| 5 to 17 Years | 0 (0.0%) | 0 (0.0%) |
| 18 to 34 Years | 4 (1.3%) | 21 (8.0%) |
| 35 to 64 Years | 67 (10.2%) | 8 (1.3%) |
| 65 to 74 Years | 45 (25.6%) | 0 (0.0%) |
| 75 Years and over | 45 (43.3%) | 59 (38.8%) |
Disability Class: Vision Difficulty
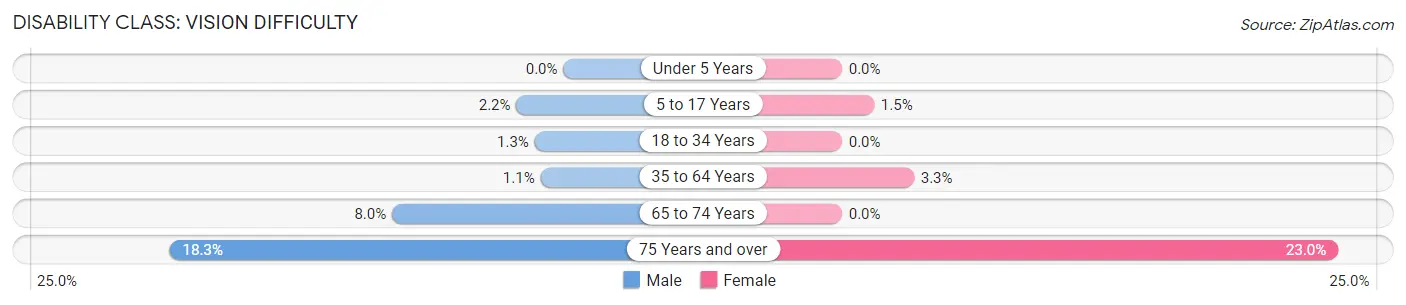
| Age Bracket | Male | Female |
| Under 5 Years | 0 (0.0%) | 0 (0.0%) |
| 5 to 17 Years | 6 (2.2%) | 5 (1.5%) |
| 18 to 34 Years | 4 (1.3%) | 0 (0.0%) |
| 35 to 64 Years | 7 (1.1%) | 20 (3.3%) |
| 65 to 74 Years | 14 (8.0%) | 0 (0.0%) |
| 75 Years and over | 19 (18.3%) | 35 (23.0%) |
Disability Class: Cognitive Difficulty
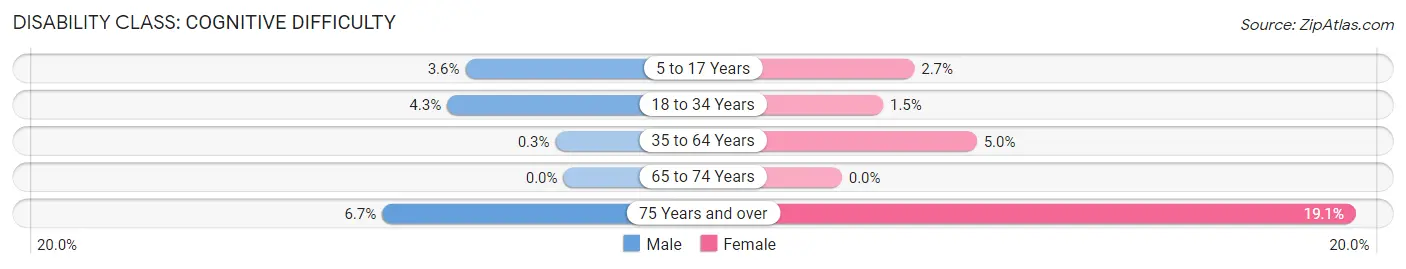
| Age Bracket | Male | Female |
| 5 to 17 Years | 10 (3.6%) | 9 (2.7%) |
| 18 to 34 Years | 13 (4.3%) | 4 (1.5%) |
| 35 to 64 Years | 2 (0.3%) | 30 (5.0%) |
| 65 to 74 Years | 0 (0.0%) | 0 (0.0%) |
| 75 Years and over | 7 (6.7%) | 29 (19.1%) |
Disability Class: Ambulatory Difficulty
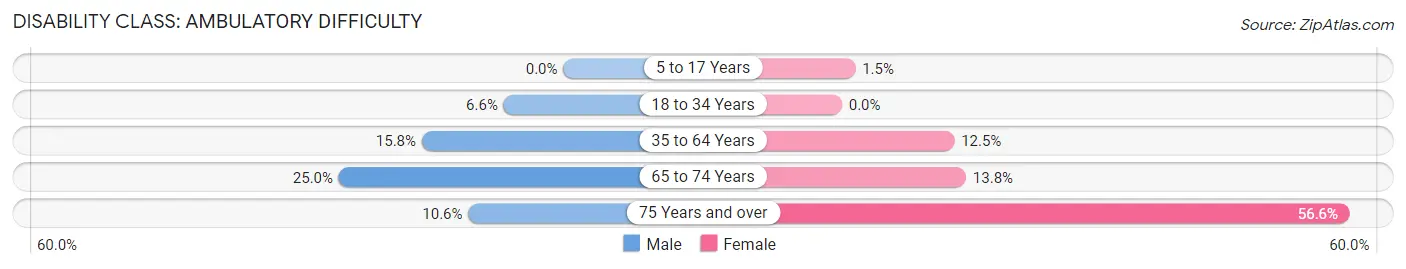
| Age Bracket | Male | Female |
| 5 to 17 Years | 0 (0.0%) | 5 (1.5%) |
| 18 to 34 Years | 20 (6.6%) | 0 (0.0%) |
| 35 to 64 Years | 104 (15.8%) | 75 (12.5%) |
| 65 to 74 Years | 44 (25.0%) | 21 (13.8%) |
| 75 Years and over | 11 (10.6%) | 86 (56.6%) |
Disability Class: Self-Care Difficulty
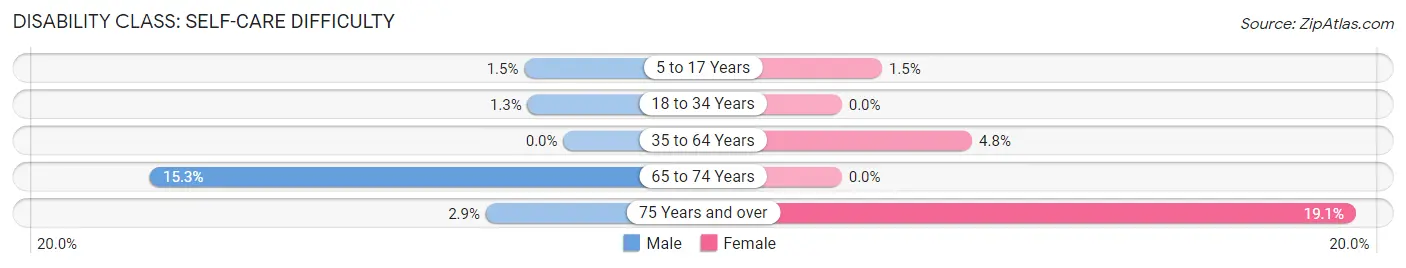
| Age Bracket | Male | Female |
| 5 to 17 Years | 4 (1.5%) | 5 (1.5%) |
| 18 to 34 Years | 4 (1.3%) | 0 (0.0%) |
| 35 to 64 Years | 0 (0.0%) | 29 (4.8%) |
| 65 to 74 Years | 27 (15.3%) | 0 (0.0%) |
| 75 Years and over | 3 (2.9%) | 29 (19.1%) |
Technology Access in Harper County
Computing Device Access in Harper County
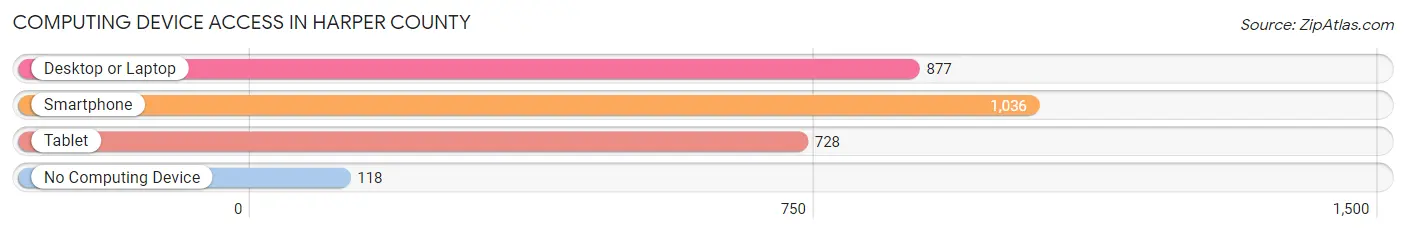
| Device Type | # Households | % Households |
| Desktop or Laptop | 877 | 72.2% |
| Smartphone | 1,036 | 85.3% |
| Tablet | 728 | 59.9% |
| No Computing Device | 118 | 9.7% |
| Total | 1,215 | 100.0% |
Internet Access in Harper County
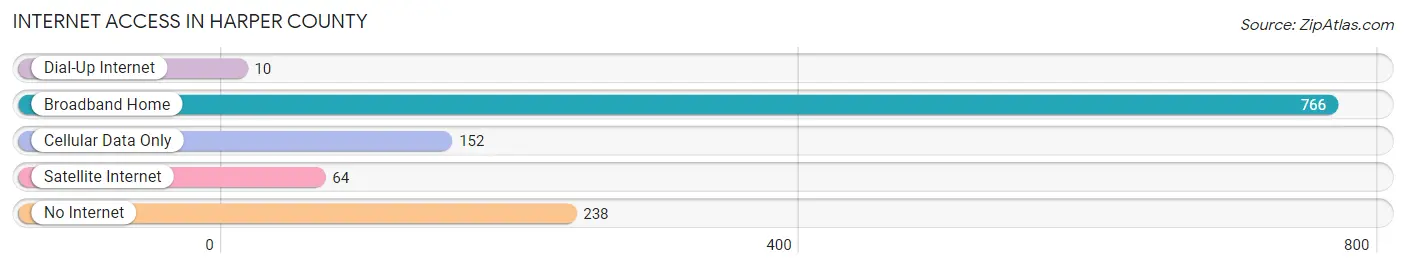
| Internet Type | # Households | % Households |
| Dial-Up Internet | 10 | 0.8% |
| Broadband Home | 766 | 63.0% |
| Cellular Data Only | 152 | 12.5% |
| Satellite Internet | 64 | 5.3% |
| No Internet | 238 | 19.6% |
| Total | 1,215 | 100.0% |
Harper County Summary
Harper County is located in the northwestern part of Oklahoma, and is bordered by Woodward County to the north, Ellis County to the east, Woods County to the south, and Beaver County to the west. The county seat is Buffalo, and the largest city is Laverne. The county was created in 1907 and named for Oscar Green Harper, a prominent local rancher.
Geography
Harper County covers an area of 1,092 square miles, making it the fourth-largest county in Oklahoma. The terrain is mostly flat, with some rolling hills in the western part of the county. The Cimarron River flows through the county, and there are several small lakes and reservoirs. The county is mostly covered in grassland, with some areas of woodland.
Climate
Harper County has a semi-arid climate, with hot summers and cold winters. The average annual temperature is around 60°F, and the average annual precipitation is around 22 inches.
Demographics
As of the 2010 census, there were 3,685 people living in Harper County. The population density was 3.4 people per square mile. The racial makeup of the county was 95.2% White, 0.3% African American, 1.2% Native American, 0.2% Asian, 0.1% Pacific Islander, 1.2% from other races, and 1.9% from two or more races. Hispanic or Latino of any race were 3.2% of the population.
The median income for a household in the county was $35,938, and the median income for a family was $41,944. The per capita income for the county was $17,845. About 11.2% of families and 14.2% of the population were below the poverty line, including 17.2% of those under age 18 and 11.2% of those age 65 or over.
Economy
The economy of Harper County is largely based on agriculture. The county is home to several large cattle ranches, and the main crops grown in the area are wheat, corn, and sorghum. The county also has some oil and gas production, and there are several small businesses in the area.
History
Harper County was created in 1907 from parts of Woodward and Ellis Counties. The county was named for Oscar Green Harper, a prominent local rancher. The county seat was originally located in Laverne, but was moved to Buffalo in 1909.
In the early 20th century, the county was largely agricultural, with most of the population living in small farming communities. The Great Depression had a major impact on the county, and many people left the area in search of work.
In the 1950s, oil and gas production began in the county, and this helped to revive the local economy. The county also began to attract new residents, and the population began to grow.
Today, Harper County is a largely rural area, with a population of around 3,700. The county is still largely agricultural, and the main industries are cattle ranching and farming. The county also has some oil and gas production, and there are several small businesses in the area.
Common Questions
What is the Total Population of Harper County?
Total Population of Harper County is 3,272.
What is the Total Male Population of Harper County?
Total Male Population of Harper County is 1,613.
What is the Total Female Population of Harper County?
Total Female Population of Harper County is 1,659.
What is the Ratio of Males per 100 Females in Harper County?
There are 97.23 Males per 100 Females in Harper County.
What is the Ratio of Females per 100 Males in Harper County?
There are 102.85 Females per 100 Males in Harper County.
What is the Median Population Age in Harper County?
Median Population Age in Harper County is 39.7 Years.
What is the Average Family Size in Harper County
Average Family Size in Harper County is 3.1 People.
What is the Average Household Size in Harper County
Average Household Size in Harper County is 2.6 People.
What is Per Capita Income in Harper County?
Per Capita income in Harper County is $26,279.
What is the Median Family Income in Harper County?
Median Family Income in Harper County is $69,896.
What is the Median Household income in Harper County?
Median Household Income in Harper County is $59,934.
What is Income or Wage Gap in Harper County?
Income or Wage Gap in Harper County is 30.4%.
Women in Harper County earn 69.6 cents for every dollar earned by a man.
What is Inequality or Gini Index in Harper County?
Inequality or Gini Index in Harper County is 0.36.
How Large is the Labor Force in Harper County?
There are 1,454 People in the Labor Forcein in Harper County.
What is the Percentage of People in the Labor Force in Harper County?
56.8% of People are in the Labor Force in Harper County.
What is the Unemployment Rate in Harper County?
Unemployment Rate in Harper County is 2.6%.