Garfield County, OK
Garfield County Overview
62,456
TOTAL POPULATION
31,386
MALE POPULATION
31,070
FEMALE POPULATION
101.02
MALES / 100 FEMALES
98.99
FEMALES / 100 MALES
35.7
MEDIAN AGE
3.2
AVG FAMILY SIZE
2.5
AVG HOUSEHOLD SIZE
$32,579
PER CAPITA INCOME
$79,145
AVG FAMILY INCOME
$64,165
AVG HOUSEHOLD INCOME
33.5%
WAGE / INCOME GAP [ % ]
66.5¢/ $1
WAGE / INCOME GAP [ $ ]
$10,554
FAMILY INCOME DEFICIT
0.45
INEQUALITY / GINI INDEX
30,658
LABOR FORCE [ PEOPLE ]
63.8%
PERCENT IN LABOR FORCE
4.6%
UNEMPLOYMENT RATE
Garfield County Area Codes
Race in Garfield County
The most populous races in Garfield County are White / Caucasian (48,134 | 77.1%), Hispanic or Latino (8,625 | 13.8%), and Two or more Races (5,322 | 8.5%).
| Race | # Population | % Population |
| Asian | 766 | 1.2% |
| Black / African American | 1,315 | 2.1% |
| Hawaiian / Pacific | 2,730 | 4.4% |
| Hispanic or Latino | 8,625 | 13.8% |
| Native / Alaskan | 1,270 | 2.0% |
| White / Caucasian | 48,134 | 77.1% |
| Two or more Races | 5,322 | 8.5% |
| Some other Race | 2,919 | 4.7% |
| Total | 62,456 | 100.0% |
Ancestry in Garfield County
The most populous ancestries reported in Garfield County are German (10,757 | 17.2%), Mexican (7,830 | 12.5%), Irish (6,913 | 11.1%), English (5,236 | 8.4%), and American (3,562 | 5.7%), together accounting for 54.9% of all Garfield County residents.
| Ancestry | # Population | % Population |
| Afghan | 18 | 0.0% |
| African | 44 | 0.1% |
| American | 3,562 | 5.7% |
| Apache | 9 | 0.0% |
| Arab | 297 | 0.5% |
| Arapaho | 18 | 0.0% |
| Australian | 40 | 0.1% |
| Austrian | 7 | 0.0% |
| Bangladeshi | 104 | 0.2% |
| Belgian | 22 | 0.0% |
| Bhutanese | 137 | 0.2% |
| Blackfeet | 48 | 0.1% |
| British | 162 | 0.3% |
| Bulgarian | 36 | 0.1% |
| Burmese | 74 | 0.1% |
| Canadian | 8 | 0.0% |
| Celtic | 41 | 0.1% |
| Central American | 388 | 0.6% |
| Central American Indian | 2 | 0.0% |
| Cherokee | 1,764 | 2.8% |
| Cheyenne | 30 | 0.1% |
| Chickasaw | 78 | 0.1% |
| Chippewa | 2 | 0.0% |
| Choctaw | 271 | 0.4% |
| Colombian | 16 | 0.0% |
| Comanche | 38 | 0.1% |
| Costa Rican | 40 | 0.1% |
| Creek | 53 | 0.1% |
| Crow | 6 | 0.0% |
| Cuban | 11 | 0.0% |
| Czech | 818 | 1.3% |
| Czechoslovakian | 102 | 0.2% |
| Danish | 47 | 0.1% |
| Delaware | 5 | 0.0% |
| Dutch | 1,471 | 2.4% |
| Dutch West Indian | 5 | 0.0% |
| Eastern European | 56 | 0.1% |
| English | 5,236 | 8.4% |
| European | 567 | 0.9% |
| Fijian | 2,498 | 4.0% |
| Filipino | 47 | 0.1% |
| Finnish | 8 | 0.0% |
| French | 1,056 | 1.7% |
| French Canadian | 137 | 0.2% |
| German | 10,757 | 17.2% |
| Greek | 82 | 0.1% |
| Guatemalan | 211 | 0.3% |
| Guyanese | 19 | 0.0% |
| Honduran | 27 | 0.0% |
| Hungarian | 10 | 0.0% |
| Indian (Asian) | 467 | 0.7% |
| Iranian | 38 | 0.1% |
| Irish | 6,913 | 11.1% |
| Iroquois | 14 | 0.0% |
| Italian | 815 | 1.3% |
| Jamaican | 56 | 0.1% |
| Kiowa | 73 | 0.1% |
| Korean | 85 | 0.1% |
| Lebanese | 215 | 0.3% |
| Lithuanian | 14 | 0.0% |
| Luxembourger | 1 | 0.0% |
| Macedonian | 6 | 0.0% |
| Maltese | 22 | 0.0% |
| Marshallese | 279 | 0.4% |
| Mexican | 7,830 | 12.5% |
| Mexican American Indian | 246 | 0.4% |
| Moroccan | 6 | 0.0% |
| Native Hawaiian | 76 | 0.1% |
| Navajo | 154 | 0.3% |
| Nicaraguan | 39 | 0.1% |
| Nigerian | 56 | 0.1% |
| Northern European | 36 | 0.1% |
| Norwegian | 439 | 0.7% |
| Osage | 30 | 0.1% |
| Ottawa | 2 | 0.0% |
| Pakistani | 16 | 0.0% |
| Paraguayan | 14 | 0.0% |
| Pennsylvania German | 84 | 0.1% |
| Pima | 108 | 0.2% |
| Polish | 424 | 0.7% |
| Portuguese | 24 | 0.0% |
| Potawatomi | 10 | 0.0% |
| Pueblo | 8 | 0.0% |
| Puerto Rican | 172 | 0.3% |
| Romanian | 12 | 0.0% |
| Russian | 280 | 0.4% |
| Salvadoran | 71 | 0.1% |
| Scandinavian | 117 | 0.2% |
| Scotch-Irish | 557 | 0.9% |
| Scottish | 993 | 1.6% |
| Seminole | 10 | 0.0% |
| Serbian | 29 | 0.1% |
| Sioux | 70 | 0.1% |
| South African | 9 | 0.0% |
| South American | 30 | 0.1% |
| Spaniard | 49 | 0.1% |
| Spanish American | 3 | 0.0% |
| Sri Lankan | 38 | 0.1% |
| Subsaharan African | 109 | 0.2% |
| Swedish | 547 | 0.9% |
| Swiss | 169 | 0.3% |
| Syrian | 76 | 0.1% |
| Thai | 116 | 0.2% |
| Tongan | 10 | 0.0% |
| Turkish | 14 | 0.0% |
| Ukrainian | 20 | 0.0% |
| Welsh | 294 | 0.5% |
| West Indian | 8 | 0.0% | View All 108 Rows |
Immigrants in Garfield County
The most numerous immigrant groups reported in Garfield County came from Latin America (2,242 | 3.6%), Central America (2,169 | 3.5%), Mexico (1,964 | 3.1%), Oceania (1,446 | 2.3%), and Asia (464 | 0.7%), together accounting for 13.3% of all Garfield County residents.
| Immigration Origin | # Population | % Population |
| Afghanistan | 33 | 0.1% |
| Africa | 159 | 0.3% |
| Asia | 464 | 0.7% |
| Australia | 13 | 0.0% |
| Brazil | 9 | 0.0% |
| Canada | 4 | 0.0% |
| Caribbean | 34 | 0.1% |
| Central America | 2,169 | 3.5% |
| China | 205 | 0.3% |
| Colombia | 16 | 0.0% |
| Eastern Asia | 243 | 0.4% |
| Eastern Europe | 10 | 0.0% |
| El Salvador | 94 | 0.2% |
| England | 19 | 0.0% |
| Europe | 77 | 0.1% |
| France | 2 | 0.0% |
| Germany | 44 | 0.1% |
| Ghana | 24 | 0.0% |
| Guatemala | 106 | 0.2% |
| Honduras | 5 | 0.0% |
| Hong Kong | 18 | 0.0% |
| India | 80 | 0.1% |
| Iran | 34 | 0.1% |
| Jamaica | 34 | 0.1% |
| Japan | 11 | 0.0% |
| Korea | 27 | 0.0% |
| Laos | 16 | 0.0% |
| Latin America | 2,242 | 3.6% |
| Mexico | 1,964 | 3.1% |
| Micronesia | 113 | 0.2% |
| Morocco | 6 | 0.0% |
| Nigeria | 56 | 0.1% |
| Northern Africa | 6 | 0.0% |
| Northern Europe | 21 | 0.0% |
| Oceania | 1,446 | 2.3% |
| Pakistan | 3 | 0.0% |
| Philippines | 16 | 0.0% |
| Russia | 10 | 0.0% |
| South Africa | 66 | 0.1% |
| South America | 39 | 0.1% |
| South Central Asia | 150 | 0.2% |
| South Eastern Asia | 71 | 0.1% |
| Thailand | 37 | 0.1% |
| Vietnam | 2 | 0.0% |
| Western Africa | 87 | 0.1% |
| Western Europe | 46 | 0.1% | View All 46 Rows |
Sex and Age in Garfield County
Sex and Age in Garfield County
The most populous age groups in Garfield County are 5 to 9 Years (2,427 | 7.7%) for men and 15 to 19 Years (2,297 | 7.4%) for women.
| Age Bracket | Male | Female |
| Under 5 Years | 2,024 (6.5%) | 2,196 (7.1%) |
| 5 to 9 Years | 2,427 (7.7%) | 2,046 (6.6%) |
| 10 to 14 Years | 2,310 (7.4%) | 2,249 (7.2%) |
| 15 to 19 Years | 2,317 (7.4%) | 2,297 (7.4%) |
| 20 to 24 Years | 2,154 (6.9%) | 1,783 (5.7%) |
| 25 to 29 Years | 2,040 (6.5%) | 1,929 (6.2%) |
| 30 to 34 Years | 2,320 (7.4%) | 2,203 (7.1%) |
| 35 to 39 Years | 2,273 (7.2%) | 2,215 (7.1%) |
| 40 to 44 Years | 1,973 (6.3%) | 1,545 (5.0%) |
| 45 to 49 Years | 1,717 (5.5%) | 1,503 (4.8%) |
| 50 to 54 Years | 1,511 (4.8%) | 1,557 (5.0%) |
| 55 to 59 Years | 1,831 (5.8%) | 2,052 (6.6%) |
| 60 to 64 Years | 1,926 (6.1%) | 1,772 (5.7%) |
| 65 to 69 Years | 1,682 (5.4%) | 1,575 (5.1%) |
| 70 to 74 Years | 1,136 (3.6%) | 1,381 (4.4%) |
| 75 to 79 Years | 708 (2.3%) | 1,137 (3.7%) |
| 80 to 84 Years | 709 (2.3%) | 602 (1.9%) |
| 85 Years and over | 328 (1.1%) | 1,028 (3.3%) |
| Total | 31,386 (100.0%) | 31,070 (100.0%) |
Families and Households in Garfield County
Median Family Size in Garfield County
The median family size in Garfield County is 3.21 persons per family, with single female/mother families (2,452 | 16.0%) accounting for the largest median family size of 3.7 persons per family. On the other hand, married-couple families (11,741 | 76.6%) represent the smallest median family size with 3.12 persons per family.
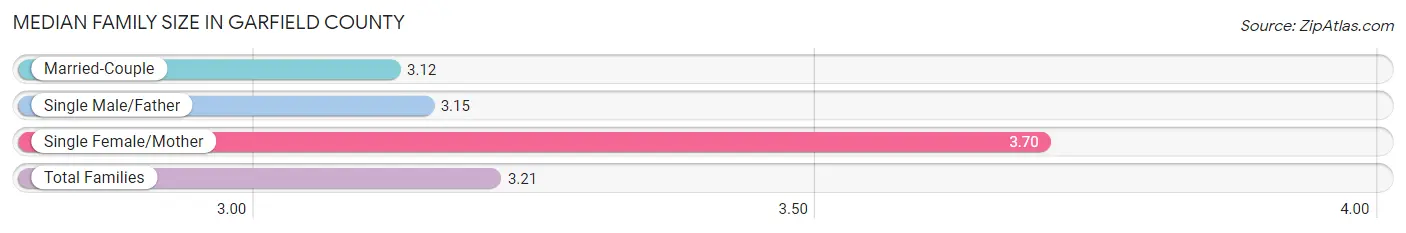
| Family Type | # Families | Family Size |
| Married-Couple | 11,741 (76.6%) | 3.12 |
| Single Male/Father | 1,140 (7.4%) | 3.15 |
| Single Female/Mother | 2,452 (16.0%) | 3.70 |
| Total Families | 15,333 (100.0%) | 3.21 |
Median Household Size in Garfield County
The median household size in Garfield County is 2.55 persons per household, with single female/mother households (2,452 | 10.3%) accounting for the largest median household size of 3.89 persons per household. non-family households (8,482 | 35.6%) represent the smallest median household size with 1.20 persons per household.
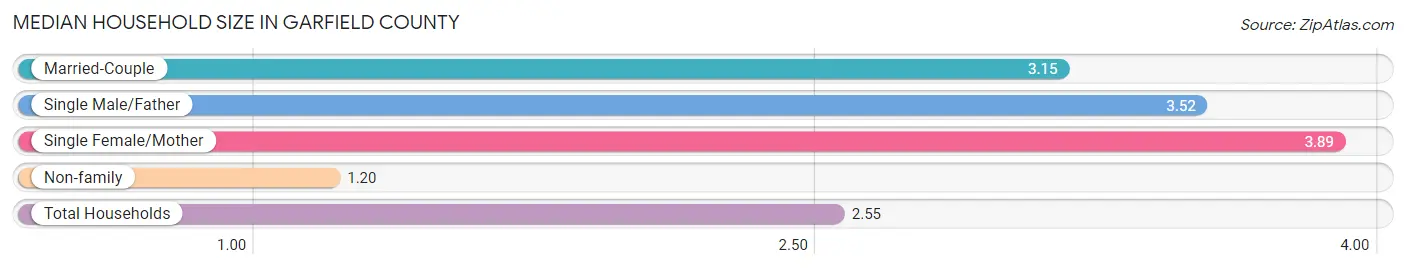
| Household Type | # Households | Household Size |
| Married-Couple | 11,741 (49.3%) | 3.15 |
| Single Male/Father | 1,140 (4.8%) | 3.52 |
| Single Female/Mother | 2,452 (10.3%) | 3.89 |
| Non-family | 8,482 (35.6%) | 1.20 |
| Total Households | 23,815 (100.0%) | 2.55 |
Household Size by Marriage Status in Garfield County
Out of a total of 23,815 households in Garfield County, 15,333 (64.4%) are family households, while 8,482 (35.6%) are nonfamily households. The most numerous type of family households are 2-person households, comprising 7,493, and the most common type of nonfamily households are 1-person households, comprising 7,062.
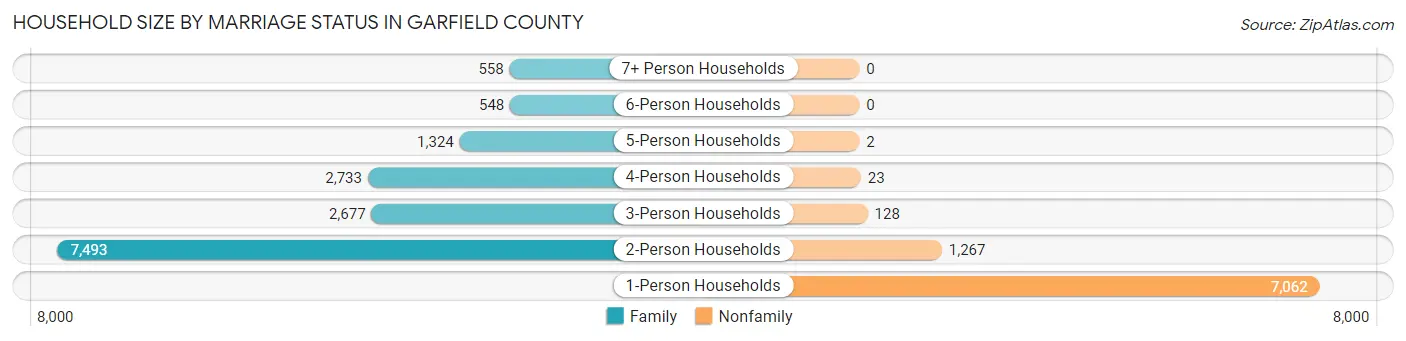
| Household Size | Family Households | Nonfamily Households |
| 1-Person Households | - | 7,062 (29.6%) |
| 2-Person Households | 7,493 (31.5%) | 1,267 (5.3%) |
| 3-Person Households | 2,677 (11.2%) | 128 (0.5%) |
| 4-Person Households | 2,733 (11.5%) | 23 (0.1%) |
| 5-Person Households | 1,324 (5.6%) | 2 (0.0%) |
| 6-Person Households | 548 (2.3%) | 0 (0.0%) |
| 7+ Person Households | 558 (2.3%) | 0 (0.0%) |
| Total | 15,333 (64.4%) | 8,482 (35.6%) |
Female Fertility in Garfield County
Fertility by Age in Garfield County
Average fertility rate in Garfield County is 65.0 births per 1,000 women. Women in the age bracket of 20 to 34 years have the highest fertility rate with 84.0 births per 1,000 women. Women in the age bracket of 20 to 34 years acount for 55.1% of all women with births.
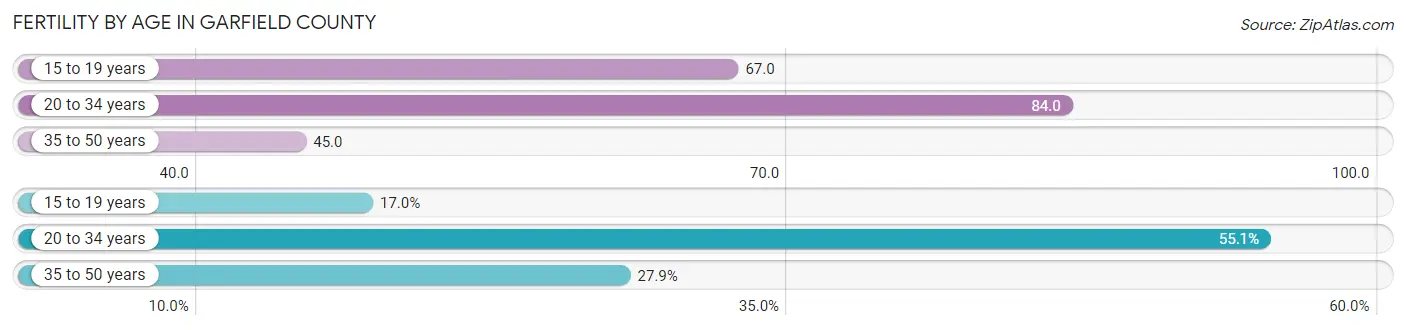
| Age Bracket | Women with Births | Births / 1,000 Women |
| 15 to 19 years | 154 (17.0%) | 67.0 |
| 20 to 34 years | 499 (55.1%) | 84.0 |
| 35 to 50 years | 253 (27.9%) | 45.0 |
| Total | 906 (100.0%) | 65.0 |
Fertility by Age by Marriage Status in Garfield County
76.6% of women with births (906) in Garfield County are married. The highest percentage of unmarried women with births falls into 20 to 34 years age bracket with 34.9% of them unmarried at the time of birth, while the lowest percentage of unmarried women with births belong to 35 to 50 years age bracket with 1.6% of them unmarried.
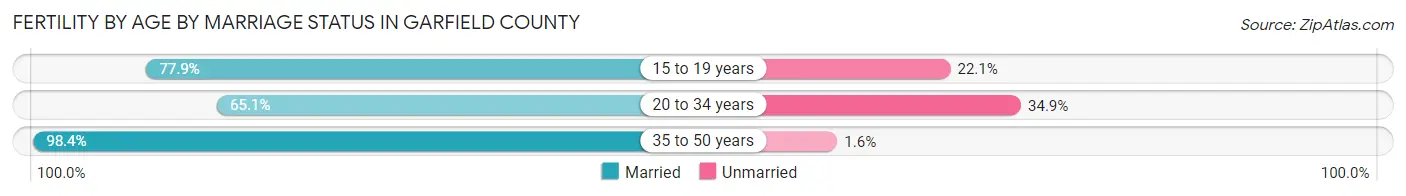
| Age Bracket | Married | Unmarried |
| 15 to 19 years | 120 (77.9%) | 34 (22.1%) |
| 20 to 34 years | 325 (65.1%) | 174 (34.9%) |
| 35 to 50 years | 249 (98.4%) | 4 (1.6%) |
| Total | 694 (76.6%) | 212 (23.4%) |
Fertility by Education in Garfield County
Average fertility rate in Garfield County is 65.0 births per 1,000 women. Women with the education attainment of graduate degree have the highest fertility rate of 116.0 births per 1,000 women, while women with the education attainment of college or associate's degree have the lowest fertility at 51.0 births per 1,000 women. Women with the education attainment of high school diploma represent 26.4% of all women with births.
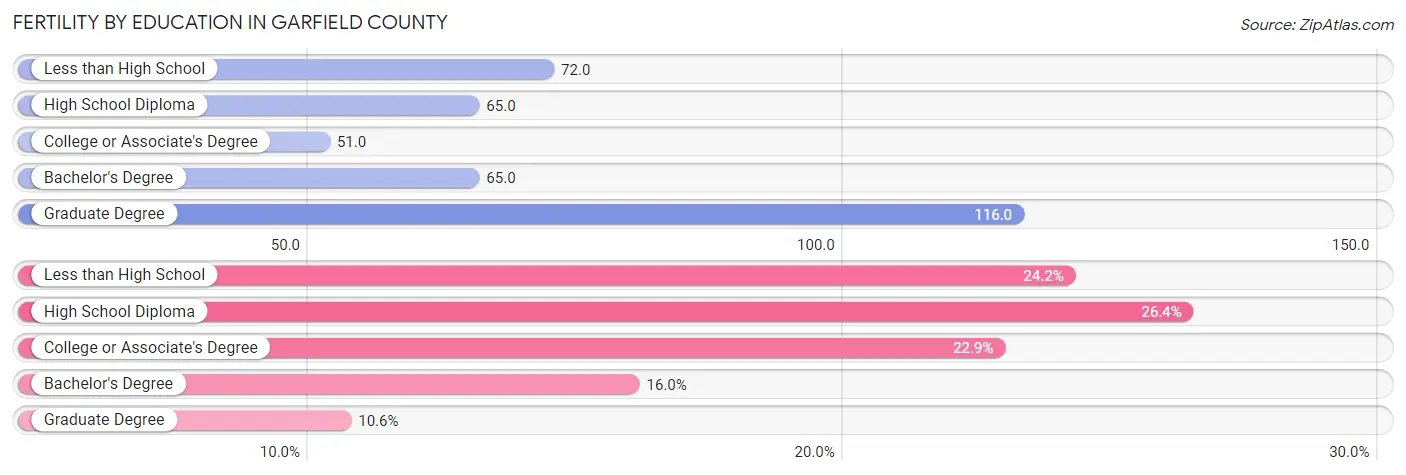
| Educational Attainment | Women with Births | Births / 1,000 Women |
| Less than High School | 219 (24.2%) | 72.0 |
| High School Diploma | 239 (26.4%) | 65.0 |
| College or Associate's Degree | 207 (22.9%) | 51.0 |
| Bachelor's Degree | 145 (16.0%) | 65.0 |
| Graduate Degree | 96 (10.6%) | 116.0 |
| Total | 906 (100.0%) | 65.0 |
Fertility by Education by Marriage Status in Garfield County
23.4% of women with births in Garfield County are unmarried. Women with the educational attainment of bachelor's degree are most likely to be married with 100.0% of them married at childbirth, while women with the educational attainment of college or associate's degree are least likely to be married with 47.8% of them unmarried at childbirth.
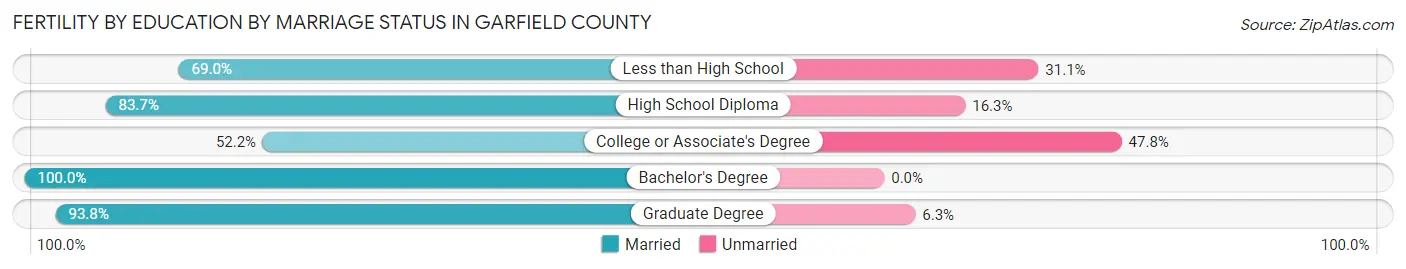
| Educational Attainment | Married | Unmarried |
| Less than High School | 151 (69.0%) | 68 (31.0%) |
| High School Diploma | 200 (83.7%) | 39 (16.3%) |
| College or Associate's Degree | 108 (52.2%) | 99 (47.8%) |
| Bachelor's Degree | 145 (100.0%) | 0 (0.0%) |
| Graduate Degree | 90 (93.8%) | 6 (6.2%) |
| Total | 694 (76.6%) | 212 (23.4%) |
Income in Garfield County
Income Overview in Garfield County
Per Capita Income in Garfield County is $32,579, while median incomes of families and households are $79,145 and $64,165 respectively.
| Characteristic | Number | Measure |
| Per Capita Income | 62,456 | $32,579 |
| Median Family Income | 15,333 | $79,145 |
| Mean Family Income | 15,333 | $98,598 |
| Median Household Income | 23,815 | $64,165 |
| Mean Household Income | 23,815 | $82,388 |
| Income Deficit | 15,333 | $10,554 |
| Wage / Income Gap (%) | 62,456 | 33.48% |
| Wage / Income Gap ($) | 62,456 | 66.52¢ per $1 |
| Gini / Inequality Index | 62,456 | 0.45 |
Earnings by Sex in Garfield County
Average Earnings in Garfield County are $35,134, $44,011 for men and $29,276 for women, a difference of 33.5%.
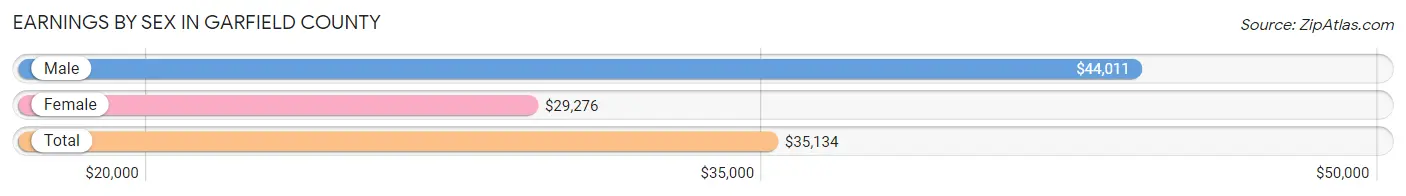
| Sex | Number | Average Earnings |
| Male | 17,474 (54.7%) | $44,011 |
| Female | 14,465 (45.3%) | $29,276 |
| Total | 31,939 (100.0%) | $35,134 |
Earnings by Sex by Income Bracket in Garfield County
The most common earnings brackets in Garfield County are $100,000+ for men (2,287 | 13.1%) and $30,000 to $34,999 for women (1,177 | 8.1%).
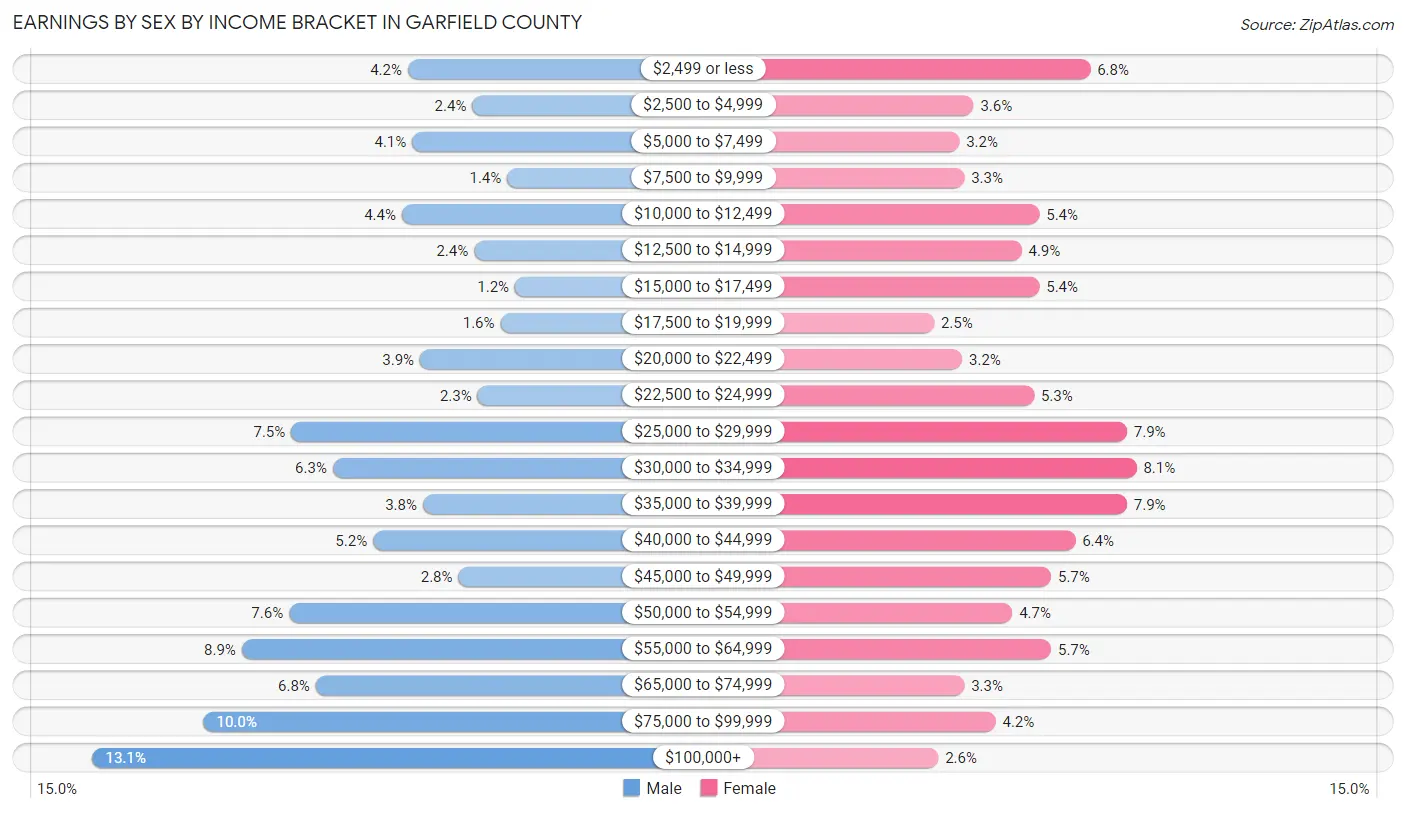
| Income | Male | Female |
| $2,499 or less | 739 (4.2%) | 989 (6.8%) |
| $2,500 to $4,999 | 422 (2.4%) | 515 (3.6%) |
| $5,000 to $7,499 | 719 (4.1%) | 457 (3.2%) |
| $7,500 to $9,999 | 251 (1.4%) | 478 (3.3%) |
| $10,000 to $12,499 | 769 (4.4%) | 783 (5.4%) |
| $12,500 to $14,999 | 415 (2.4%) | 710 (4.9%) |
| $15,000 to $17,499 | 214 (1.2%) | 782 (5.4%) |
| $17,500 to $19,999 | 285 (1.6%) | 355 (2.5%) |
| $20,000 to $22,499 | 679 (3.9%) | 468 (3.2%) |
| $22,500 to $24,999 | 397 (2.3%) | 761 (5.3%) |
| $25,000 to $29,999 | 1,312 (7.5%) | 1,138 (7.9%) |
| $30,000 to $34,999 | 1,107 (6.3%) | 1,177 (8.1%) |
| $35,000 to $39,999 | 665 (3.8%) | 1,138 (7.9%) |
| $40,000 to $44,999 | 911 (5.2%) | 928 (6.4%) |
| $45,000 to $49,999 | 491 (2.8%) | 830 (5.7%) |
| $50,000 to $54,999 | 1,322 (7.6%) | 672 (4.6%) |
| $55,000 to $64,999 | 1,555 (8.9%) | 830 (5.7%) |
| $65,000 to $74,999 | 1,191 (6.8%) | 477 (3.3%) |
| $75,000 to $99,999 | 1,743 (10.0%) | 605 (4.2%) |
| $100,000+ | 2,287 (13.1%) | 372 (2.6%) |
| Total | 17,474 (100.0%) | 14,465 (100.0%) |
Earnings by Sex by Educational Attainment in Garfield County
Average earnings in Garfield County are $51,576 for men and $33,004 for women, a difference of 36.0%. Men with an educational attainment of graduate degree enjoy the highest average annual earnings of $79,635, while those with less than high school education earn the least with $32,042. Women with an educational attainment of graduate degree earn the most with the average annual earnings of $48,831, while those with less than high school education have the smallest earnings of $14,281.
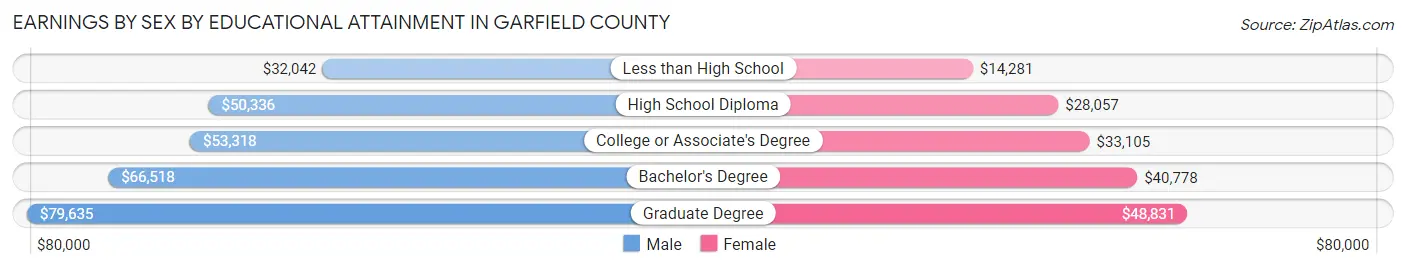
| Educational Attainment | Male Income | Female Income |
| Less than High School | $32,042 | $14,281 |
| High School Diploma | $50,336 | $28,057 |
| College or Associate's Degree | $53,318 | $33,105 |
| Bachelor's Degree | $66,518 | $40,778 |
| Graduate Degree | $79,635 | $48,831 |
| Total | $51,576 | $33,004 |
Family Income in Garfield County
Family Income Brackets in Garfield County
According to the Garfield County family income data, there are 3,082 families falling into the $100,000 to $149,999 income range, which is the most common income bracket and makes up 20.1% of all families. Conversely, the $10,000 to $14,999 income bracket is the least frequent group with only 353 families (2.3%) belonging to this category.
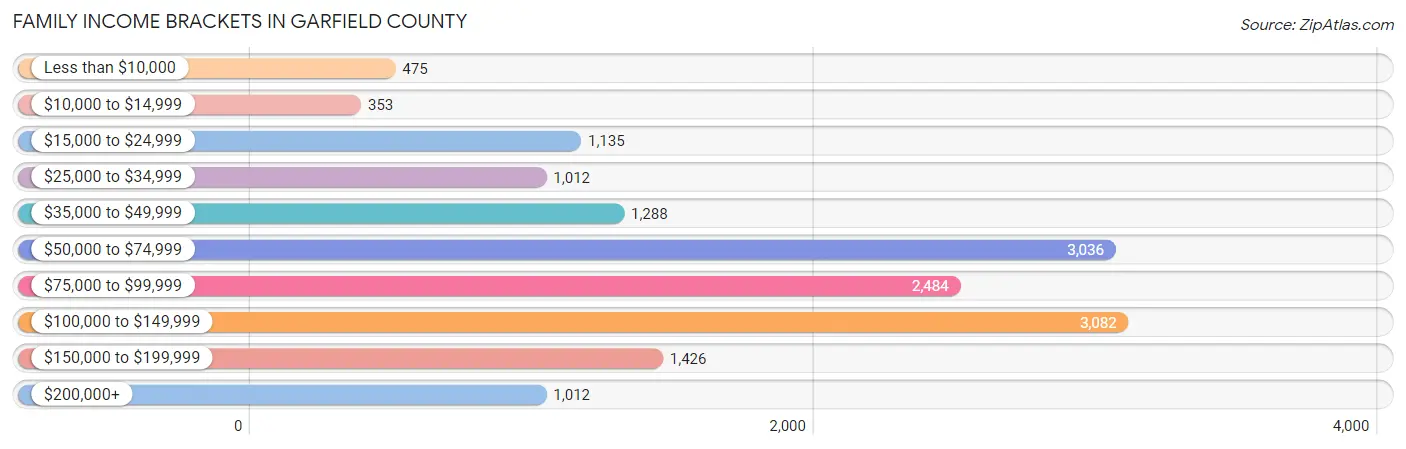
| Income Bracket | # Families | % Families |
| Less than $10,000 | 475 | 3.1% |
| $10,000 to $14,999 | 353 | 2.3% |
| $15,000 to $24,999 | 1,135 | 7.4% |
| $25,000 to $34,999 | 1,012 | 6.6% |
| $35,000 to $49,999 | 1,288 | 8.4% |
| $50,000 to $74,999 | 3,036 | 19.8% |
| $75,000 to $99,999 | 2,484 | 16.2% |
| $100,000 to $149,999 | 3,082 | 20.1% |
| $150,000 to $199,999 | 1,426 | 9.3% |
| $200,000+ | 1,012 | 6.6% |
Family Income by Famaliy Size in Garfield County
5-person families (1,287 | 8.4%) account for the highest median family income in Garfield County with $115,972 per family, while 2-person families (7,886 | 51.4%) have the highest median income of $35,131 per family member.
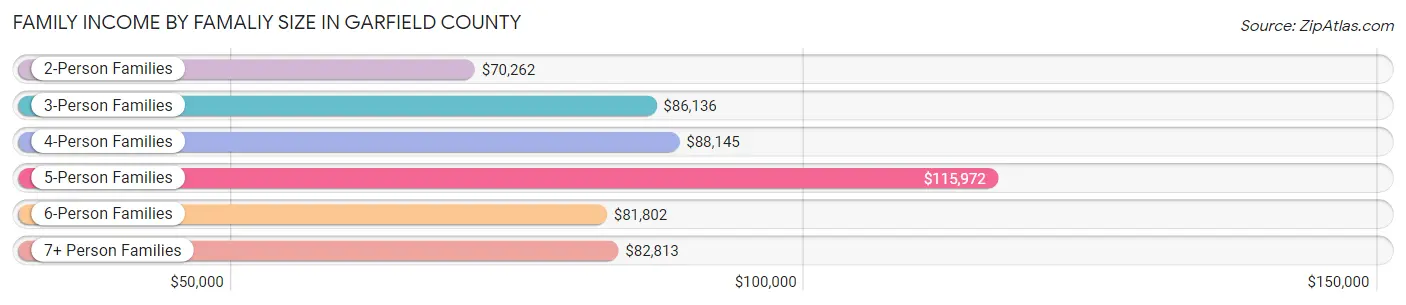
| Income Bracket | # Families | Median Income |
| 2-Person Families | 7,886 (51.4%) | $70,262 |
| 3-Person Families | 2,702 (17.6%) | $86,136 |
| 4-Person Families | 2,474 (16.1%) | $88,145 |
| 5-Person Families | 1,287 (8.4%) | $115,972 |
| 6-Person Families | 426 (2.8%) | $81,802 |
| 7+ Person Families | 558 (3.6%) | $82,813 |
| Total | 15,333 (100.0%) | $79,145 |
Family Income by Number of Earners in Garfield County
The median family income in Garfield County is $79,145, with families comprising 3+ earners (1,606) having the highest median family income of $111,618, while families with no earners (2,334) have the lowest median family income of $46,515, accounting for 10.5% and 15.2% of families, respectively.
| Number of Earners | # Families | Median Income |
| No Earners | 2,334 (15.2%) | $46,515 |
| 1 Earner | 5,204 (33.9%) | $63,454 |
| 2 Earners | 6,189 (40.4%) | $93,125 |
| 3+ Earners | 1,606 (10.5%) | $111,618 |
| Total | 15,333 (100.0%) | $79,145 |
Household Income in Garfield County
Household Income Brackets in Garfield County
With 4,954 households falling in the category, the $50,000 to $74,999 income range is the most frequent in Garfield County, accounting for 20.8% of all households. In contrast, only 1,048 households (4.4%) fall into the $10,000 to $14,999 income bracket, making it the least populous group.
| Income Bracket | # Households | % Households |
| Less than $10,000 | 1,072 | 4.5% |
| $10,000 to $14,999 | 1,048 | 4.4% |
| $15,000 to $24,999 | 2,000 | 8.4% |
| $25,000 to $34,999 | 2,429 | 10.2% |
| $35,000 to $49,999 | 2,548 | 10.7% |
| $50,000 to $74,999 | 4,954 | 20.8% |
| $75,000 to $99,999 | 3,572 | 15.0% |
| $100,000 to $149,999 | 3,525 | 14.8% |
| $150,000 to $199,999 | 1,548 | 6.5% |
| $200,000+ | 1,119 | 4.7% |
Household Income by Householder Age in Garfield County
The median household income in Garfield County is $64,165, with the highest median household income of $68,661 found in the 25 to 44 years age bracket for the primary householder. A total of 8,314 households (34.9%) fall into this category. Meanwhile, the 15 to 24 years age bracket for the primary householder has the lowest median household income of $47,827, with 1,267 households (5.3%) in this group.
| Income Bracket | # Households | Median Income |
| 15 to 24 Years | 1,267 (5.3%) | $47,827 |
| 25 to 44 Years | 8,314 (34.9%) | $68,661 |
| 45 to 64 Years | 7,522 (31.6%) | $68,551 |
| 65+ Years | 6,712 (28.2%) | $55,268 |
| Total | 23,815 (100.0%) | $64,165 |
Poverty in Garfield County
Income Below Poverty by Sex and Age in Garfield County
With 12.4% poverty level for males and 15.6% for females among the residents of Garfield County, 6 to 11 year old males and 5 year old females are the most vulnerable to poverty, with 549 males (19.2%) and 121 females (37.7%) in their respective age groups living below the poverty level.
| Age Bracket | Male | Female |
| Under 5 Years | 324 (17.8%) | 504 (23.8%) |
| 5 Years | 19 (5.0%) | 121 (37.7%) |
| 6 to 11 Years | 549 (19.2%) | 658 (24.4%) |
| 12 to 14 Years | 171 (12.1%) | 127 (10.8%) |
| 15 Years | 56 (9.6%) | 147 (26.4%) |
| 16 and 17 Years | 98 (12.7%) | 118 (13.7%) |
| 18 to 24 Years | 246 (8.9%) | 397 (16.2%) |
| 25 to 34 Years | 526 (12.4%) | 981 (24.1%) |
| 35 to 44 Years | 575 (13.9%) | 456 (12.2%) |
| 45 to 54 Years | 455 (14.3%) | 428 (14.0%) |
| 55 to 64 Years | 354 (9.7%) | 331 (8.7%) |
| 65 to 74 Years | 353 (12.5%) | 250 (8.6%) |
| 75 Years and over | 13 (0.8%) | 206 (8.3%) |
| Total | 3,739 (12.4%) | 4,724 (15.6%) |
Income Above Poverty by Sex and Age in Garfield County
According to the poverty statistics in Garfield County, males aged 75 years and over and females aged 75 years and over are the age groups that are most secure financially, with 99.2% of males and 91.7% of females in these age groups living above the poverty line.
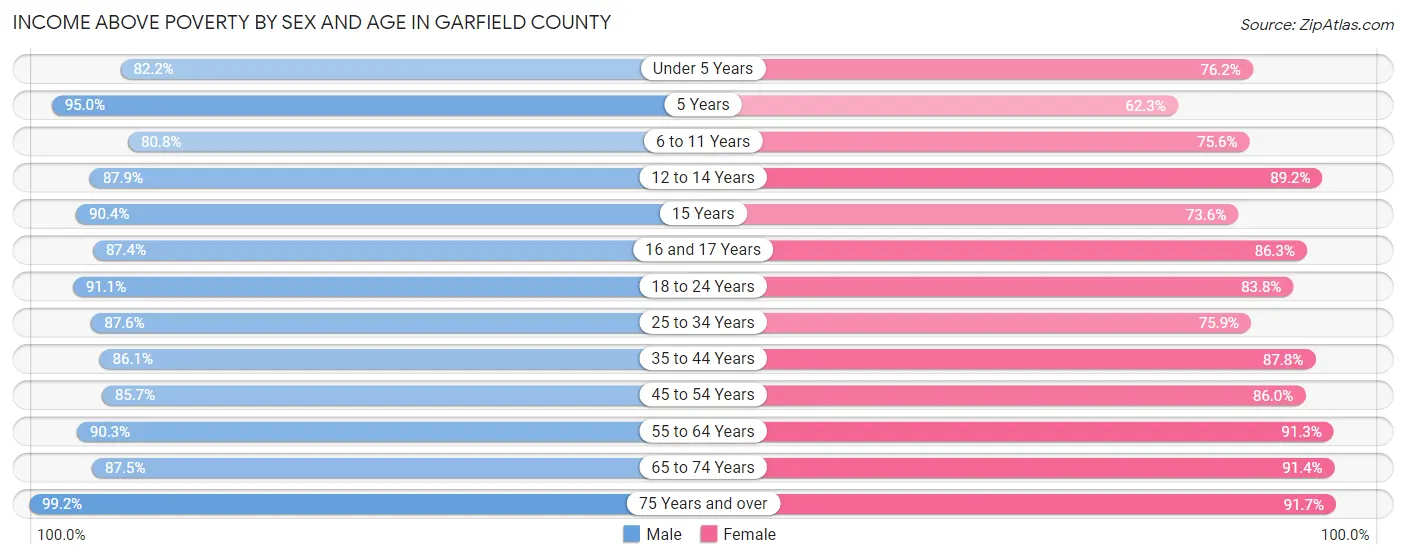
| Age Bracket | Male | Female |
| Under 5 Years | 1,496 (82.2%) | 1,616 (76.2%) |
| 5 Years | 358 (95.0%) | 200 (62.3%) |
| 6 to 11 Years | 2,309 (80.8%) | 2,042 (75.6%) |
| 12 to 14 Years | 1,243 (87.9%) | 1,048 (89.2%) |
| 15 Years | 530 (90.4%) | 409 (73.6%) |
| 16 and 17 Years | 677 (87.4%) | 744 (86.3%) |
| 18 to 24 Years | 2,503 (91.0%) | 2,051 (83.8%) |
| 25 to 34 Years | 3,719 (87.6%) | 3,096 (75.9%) |
| 35 to 44 Years | 3,549 (86.1%) | 3,294 (87.8%) |
| 45 to 54 Years | 2,716 (85.7%) | 2,624 (86.0%) |
| 55 to 64 Years | 3,291 (90.3%) | 3,466 (91.3%) |
| 65 to 74 Years | 2,463 (87.5%) | 2,671 (91.4%) |
| 75 Years and over | 1,594 (99.2%) | 2,274 (91.7%) |
| Total | 26,448 (87.6%) | 25,535 (84.4%) |
Income Below Poverty Among Married-Couple Families in Garfield County
The poverty statistics for married-couple families in Garfield County show that 6.3% or 738 of the total 11,741 families live below the poverty line. Families with 5 or more children have the highest poverty rate of 13.5%, comprising of 19 families. On the other hand, families with 1 or 2 children have the lowest poverty rate of 3.9%, which includes 124 families.
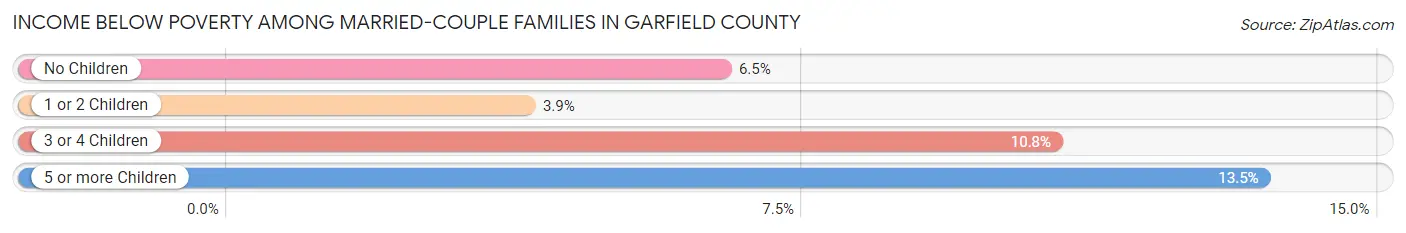
| Children | Above Poverty | Below Poverty |
| No Children | 6,730 (93.5%) | 464 (6.5%) |
| 1 or 2 Children | 3,066 (96.1%) | 124 (3.9%) |
| 3 or 4 Children | 1,085 (89.2%) | 131 (10.8%) |
| 5 or more Children | 122 (86.5%) | 19 (13.5%) |
| Total | 11,003 (93.7%) | 738 (6.3%) |
Income Below Poverty Among Single-Parent Households in Garfield County
According to the poverty data in Garfield County, 14.0% or 159 single-father households and 31.7% or 777 single-mother households are living below the poverty line. Among single-father households, those with 3 or 4 children have the highest poverty rate, with 21 households (16.3%) experiencing poverty. Likewise, among single-mother households, those with 5 or more children have the highest poverty rate, with 181 households (74.2%) falling below the poverty line.
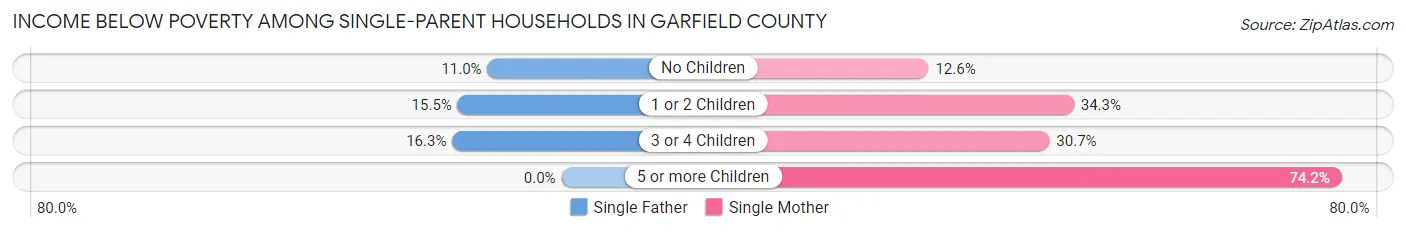
| Children | Single Father | Single Mother |
| No Children | 45 (11.0%) | 88 (12.6%) |
| 1 or 2 Children | 93 (15.5%) | 420 (34.3%) |
| 3 or 4 Children | 21 (16.3%) | 88 (30.7%) |
| 5 or more Children | 0 (0.0%) | 181 (74.2%) |
| Total | 159 (14.0%) | 777 (31.7%) |
Income Below Poverty Among Married-Couple vs Single-Parent Households in Garfield County
The poverty data for Garfield County shows that 738 of the married-couple family households (6.3%) and 936 of the single-parent households (26.1%) are living below the poverty level. Within the married-couple family households, those with 5 or more children have the highest poverty rate, with 19 households (13.5%) falling below the poverty line. Among the single-parent households, those with 5 or more children have the highest poverty rate, with 181 household (73.6%) living below poverty.
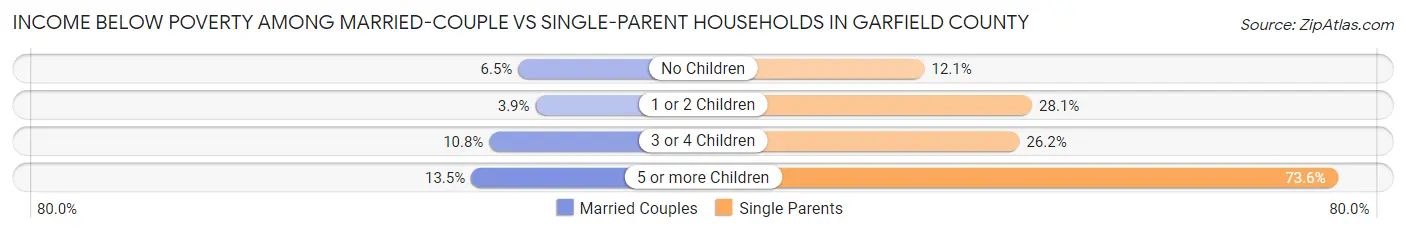
| Children | Married-Couple Families | Single-Parent Households |
| No Children | 464 (6.5%) | 133 (12.0%) |
| 1 or 2 Children | 124 (3.9%) | 513 (28.1%) |
| 3 or 4 Children | 131 (10.8%) | 109 (26.2%) |
| 5 or more Children | 19 (13.5%) | 181 (73.6%) |
| Total | 738 (6.3%) | 936 (26.1%) |
Employment Characteristics in Garfield County
Employment by Class of Employer in Garfield County
Among the 28,409 employed individuals in Garfield County, private company employees (17,652 | 62.1%), federal government employees (2,646 | 9.3%), and not-for-profit organizations (2,134 | 7.5%) make up the most common classes of employment.
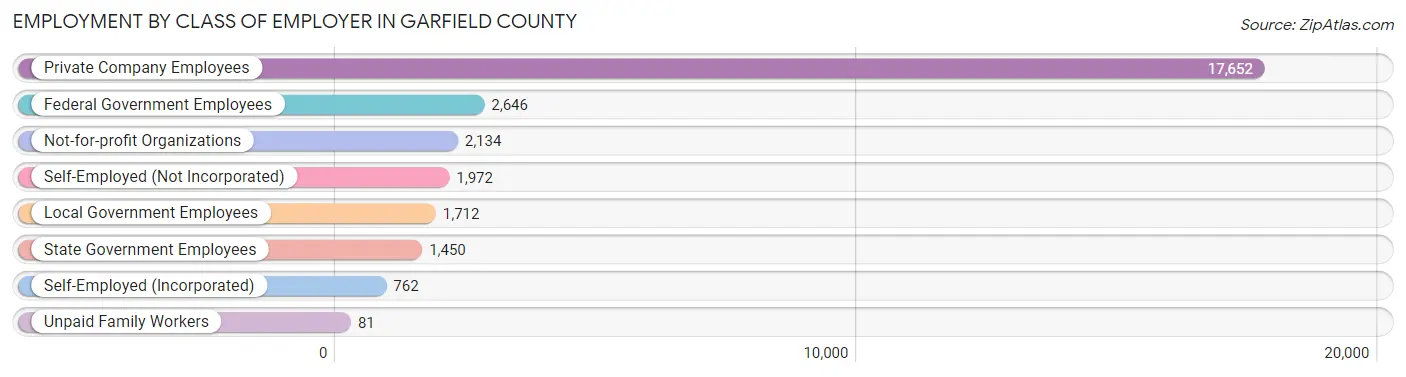
| Employer Class | # Employees | % Employees |
| Private Company Employees | 17,652 | 62.1% |
| Self-Employed (Incorporated) | 762 | 2.7% |
| Self-Employed (Not Incorporated) | 1,972 | 6.9% |
| Not-for-profit Organizations | 2,134 | 7.5% |
| Local Government Employees | 1,712 | 6.0% |
| State Government Employees | 1,450 | 5.1% |
| Federal Government Employees | 2,646 | 9.3% |
| Unpaid Family Workers | 81 | 0.3% |
| Total | 28,409 | 100.0% |
Employment Status by Age in Garfield County
According to the labor force statistics for Garfield County, out of the total population over 16 years of age (48,053), 63.8% or 30,658 individuals are in the labor force, with 4.6% or 1,410 of them unemployed. The age group with the highest labor force participation rate is 20 to 24 years, with 87.0% or 3,425 individuals in the labor force. Within the labor force, the 20 to 24 years age range has the highest percentage of unemployed individuals, with 8.4% or 288 of them being unemployed.
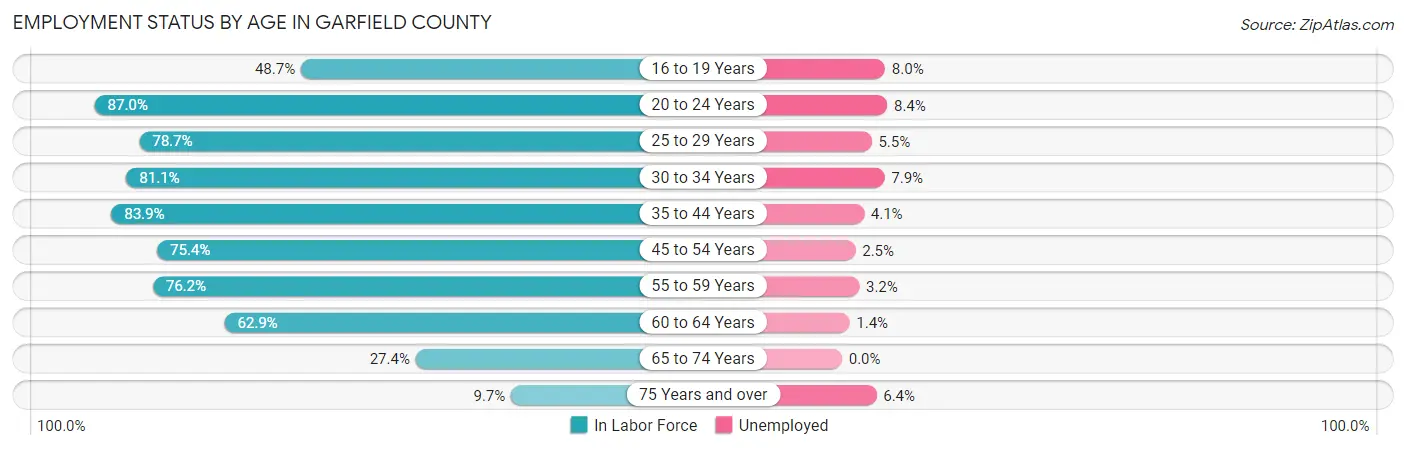
| Age Bracket | In Labor Force | Unemployed |
| 16 to 19 Years | 1,686 (48.7%) | 135 (8.0%) |
| 20 to 24 Years | 3,425 (87.0%) | 288 (8.4%) |
| 25 to 29 Years | 3,124 (78.7%) | 172 (5.5%) |
| 30 to 34 Years | 3,668 (81.1%) | 290 (7.9%) |
| 35 to 44 Years | 6,717 (83.9%) | 275 (4.1%) |
| 45 to 54 Years | 4,741 (75.4%) | 119 (2.5%) |
| 55 to 59 Years | 2,959 (76.2%) | 95 (3.2%) |
| 60 to 64 Years | 2,326 (62.9%) | 33 (1.4%) |
| 65 to 74 Years | 1,582 (27.4%) | 0 (0.0%) |
| 75 Years and over | 438 (9.7%) | 28 (6.4%) |
| Total | 30,658 (63.8%) | 1,410 (4.6%) |
Employment Status by Educational Attainment in Garfield County
According to labor force statistics for Garfield County, 77.5% of individuals (23,534) out of the total population between 25 and 64 years of age (30,367) are in the labor force, with 4.2% or 988 of them being unemployed. The group with the highest labor force participation rate are those with the educational attainment of bachelor's degree or higher, with 88.3% or 5,938 individuals in the labor force. Within the labor force, individuals with less than high school education have the highest percentage of unemployment, with 13.2% or 375 of them being unemployed.
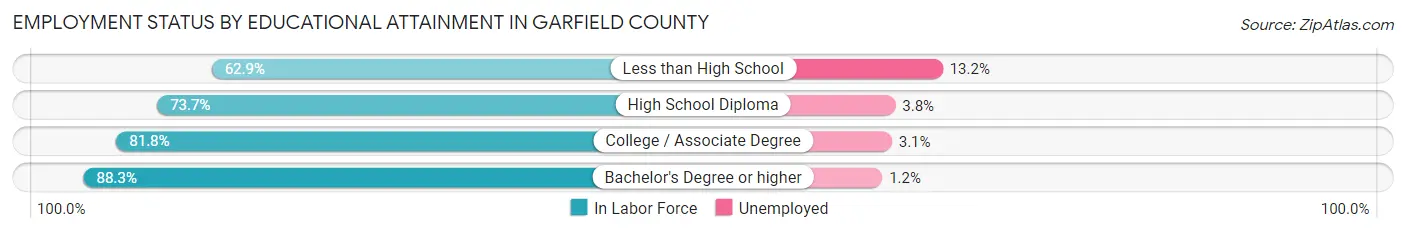
| Educational Attainment | In Labor Force | Unemployed |
| Less than High School | 2,840 (62.9%) | 596 (13.2%) |
| High School Diploma | 8,068 (73.7%) | 416 (3.8%) |
| College / Associate Degree | 6,691 (81.8%) | 254 (3.1%) |
| Bachelor's Degree or higher | 5,938 (88.3%) | 81 (1.2%) |
| Total | 23,534 (77.5%) | 1,275 (4.2%) |
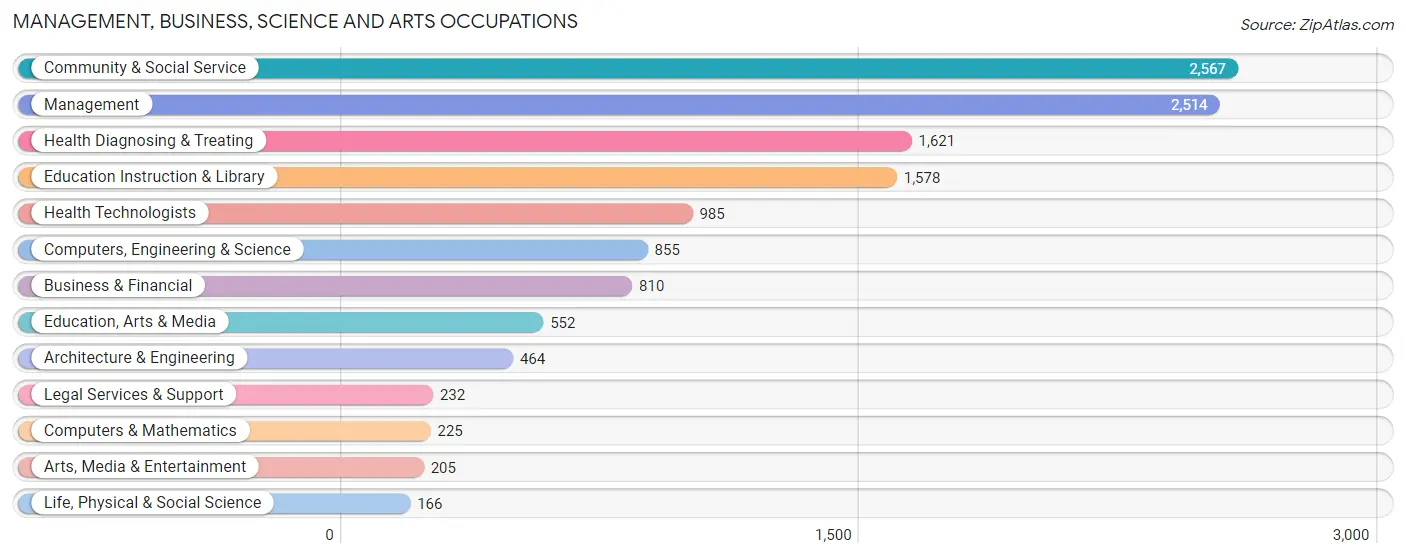
Employment Occupations by Sex in Garfield County
Management, Business, Science and Arts Occupations
The most common Management, Business, Science and Arts occupations in Garfield County are Community & Social Service (2,567 | 9.1%), Management (2,514 | 9.0%), Health Diagnosing & Treating (1,621 | 5.8%), Education Instruction & Library (1,578 | 5.6%), and Health Technologists (985 | 3.5%).
Management, Business, Science and Arts Occupations by Sex
Within the Management, Business, Science and Arts occupations in Garfield County, the most male-oriented occupations are Architecture & Engineering (83.4%), Computers & Mathematics (81.3%), and Computers, Engineering & Science (77.8%), while the most female-oriented occupations are Health Diagnosing & Treating (86.1%), Health Technologists (84.1%), and Education Instruction & Library (81.3%).
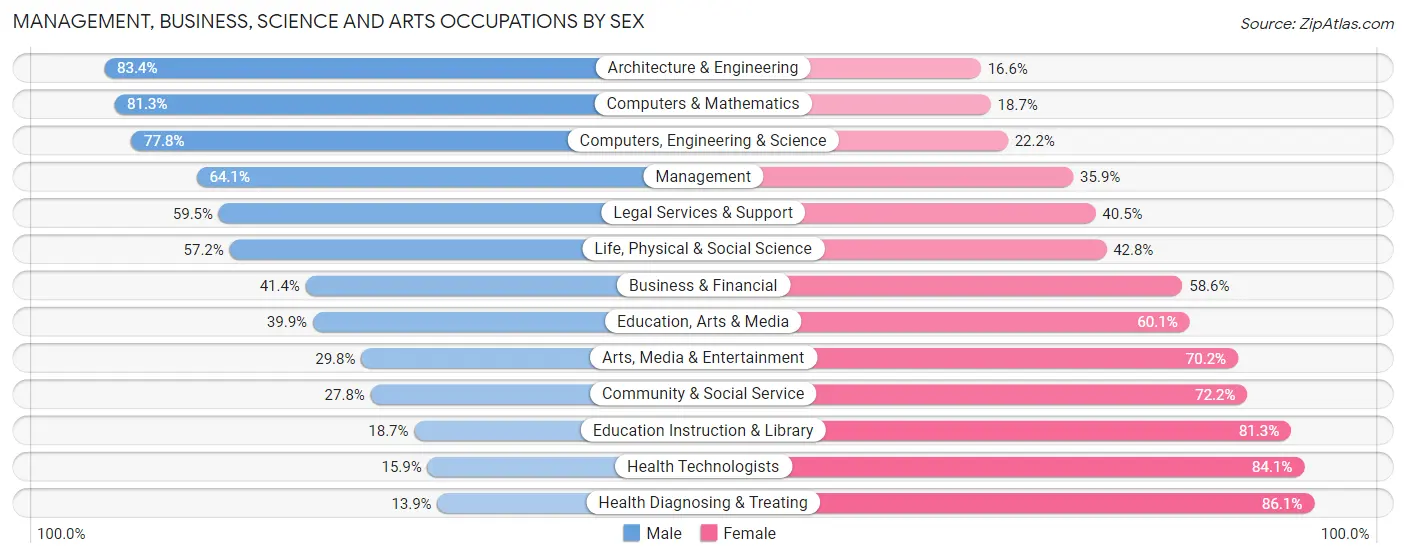
| Occupation | Male | Female |
| Management | 1,612 (64.1%) | 902 (35.9%) |
| Business & Financial | 335 (41.4%) | 475 (58.6%) |
| Computers, Engineering & Science | 665 (77.8%) | 190 (22.2%) |
| Computers & Mathematics | 183 (81.3%) | 42 (18.7%) |
| Architecture & Engineering | 387 (83.4%) | 77 (16.6%) |
| Life, Physical & Social Science | 95 (57.2%) | 71 (42.8%) |
| Community & Social Service | 714 (27.8%) | 1,853 (72.2%) |
| Education, Arts & Media | 220 (39.9%) | 332 (60.1%) |
| Legal Services & Support | 138 (59.5%) | 94 (40.5%) |
| Education Instruction & Library | 295 (18.7%) | 1,283 (81.3%) |
| Arts, Media & Entertainment | 61 (29.8%) | 144 (70.2%) |
| Health Diagnosing & Treating | 225 (13.9%) | 1,396 (86.1%) |
| Health Technologists | 157 (15.9%) | 828 (84.1%) |
| Total (Category) | 3,551 (42.4%) | 4,816 (57.6%) |
| Total (Overall) | 14,887 (53.0%) | 13,184 (47.0%) |
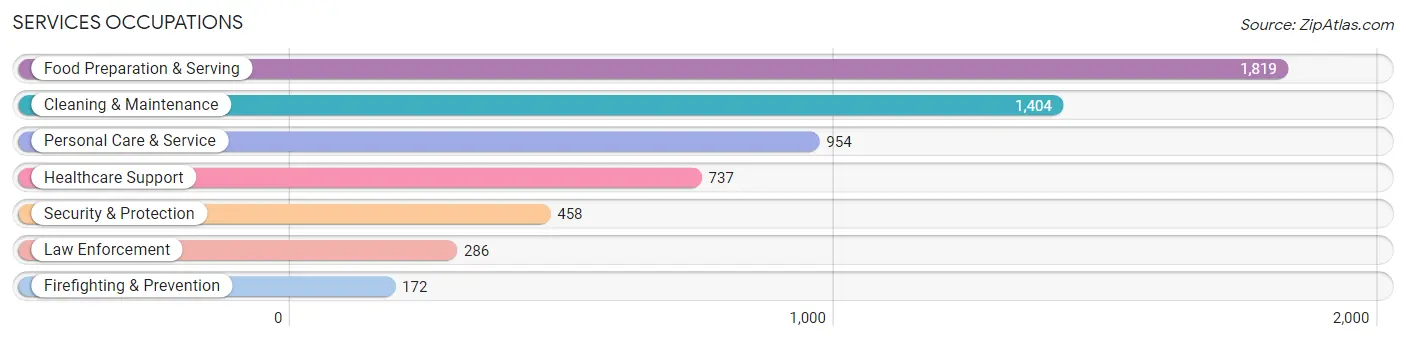
Services Occupations
The most common Services occupations in Garfield County are Food Preparation & Serving (1,819 | 6.5%), Cleaning & Maintenance (1,404 | 5.0%), Personal Care & Service (954 | 3.4%), Healthcare Support (737 | 2.6%), and Security & Protection (458 | 1.6%).
Services Occupations by Sex
Within the Services occupations in Garfield County, the most male-oriented occupations are Firefighting & Prevention (68.6%), Security & Protection (64.6%), and Law Enforcement (62.2%), while the most female-oriented occupations are Healthcare Support (93.2%), Personal Care & Service (77.4%), and Food Preparation & Serving (58.1%).
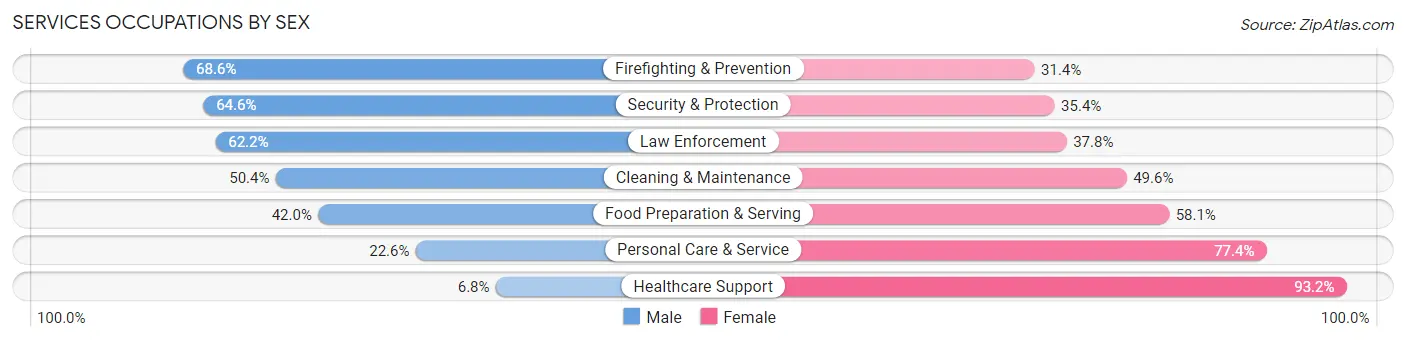
| Occupation | Male | Female |
| Healthcare Support | 50 (6.8%) | 687 (93.2%) |
| Security & Protection | 296 (64.6%) | 162 (35.4%) |
| Firefighting & Prevention | 118 (68.6%) | 54 (31.4%) |
| Law Enforcement | 178 (62.2%) | 108 (37.8%) |
| Food Preparation & Serving | 763 (41.9%) | 1,056 (58.1%) |
| Cleaning & Maintenance | 707 (50.4%) | 697 (49.6%) |
| Personal Care & Service | 216 (22.6%) | 738 (77.4%) |
| Total (Category) | 2,032 (37.8%) | 3,340 (62.2%) |
| Total (Overall) | 14,887 (53.0%) | 13,184 (47.0%) |
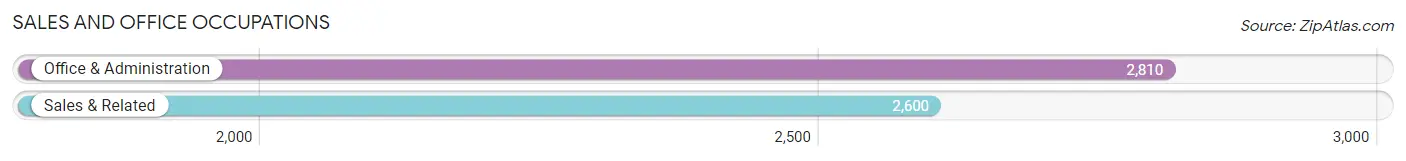
Sales and Office Occupations
The most common Sales and Office occupations in Garfield County are Office & Administration (2,810 | 10.0%), and Sales & Related (2,600 | 9.3%).
Sales and Office Occupations by Sex
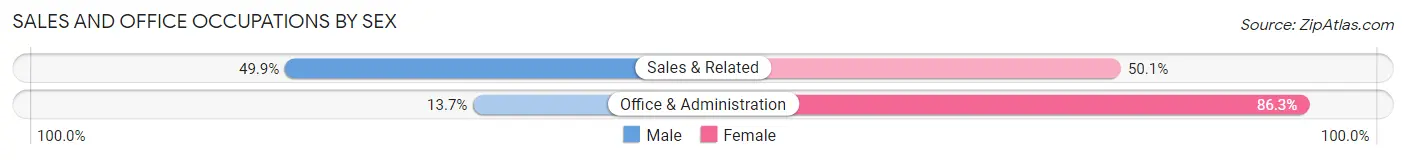
| Occupation | Male | Female |
| Sales & Related | 1,298 (49.9%) | 1,302 (50.1%) |
| Office & Administration | 386 (13.7%) | 2,424 (86.3%) |
| Total (Category) | 1,684 (31.1%) | 3,726 (68.9%) |
| Total (Overall) | 14,887 (53.0%) | 13,184 (47.0%) |
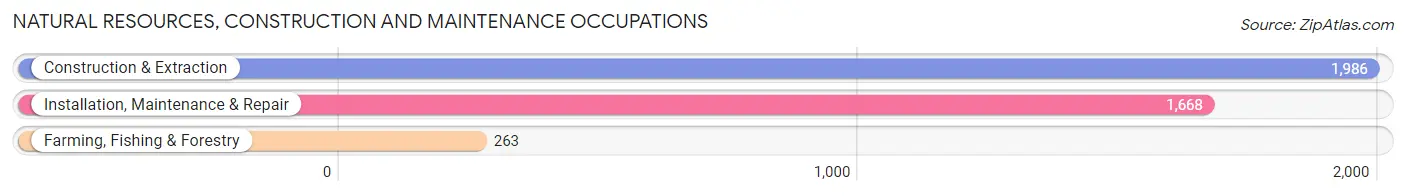
Natural Resources, Construction and Maintenance Occupations
The most common Natural Resources, Construction and Maintenance occupations in Garfield County are Construction & Extraction (1,986 | 7.1%), Installation, Maintenance & Repair (1,668 | 5.9%), and Farming, Fishing & Forestry (263 | 0.9%).
Natural Resources, Construction and Maintenance Occupations by Sex
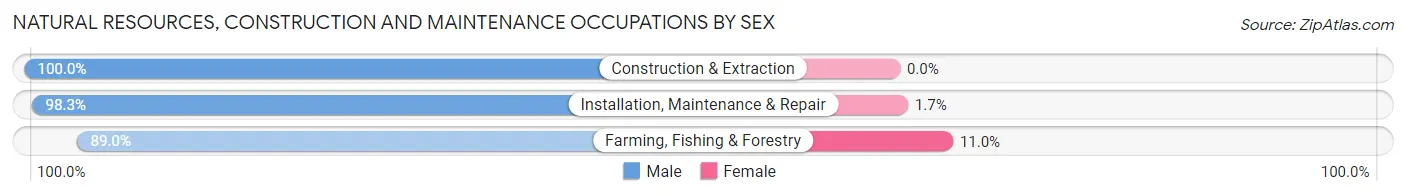
| Occupation | Male | Female |
| Farming, Fishing & Forestry | 234 (89.0%) | 29 (11.0%) |
| Construction & Extraction | 1,986 (100.0%) | 0 (0.0%) |
| Installation, Maintenance & Repair | 1,640 (98.3%) | 28 (1.7%) |
| Total (Category) | 3,860 (98.5%) | 57 (1.5%) |
| Total (Overall) | 14,887 (53.0%) | 13,184 (47.0%) |
Production, Transportation and Moving Occupations
The most common Production, Transportation and Moving occupations in Garfield County are Production (1,981 | 7.1%), Transportation (1,529 | 5.4%), and Material Moving (1,495 | 5.3%).
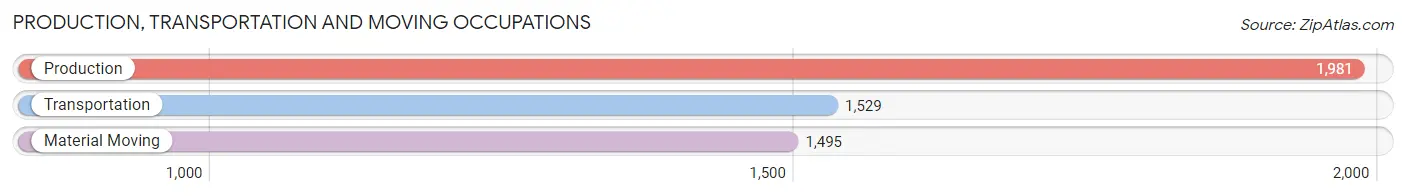
Production, Transportation and Moving Occupations by Sex
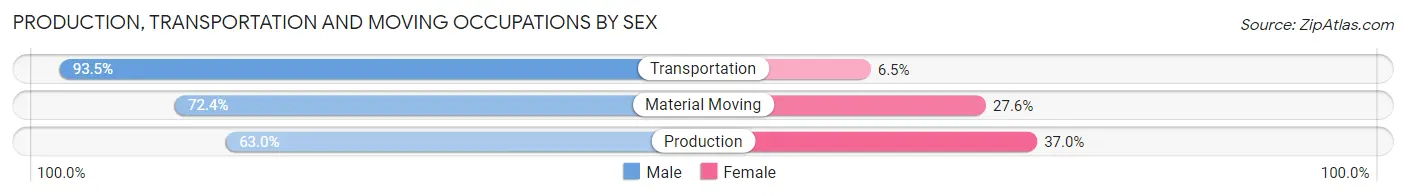
| Occupation | Male | Female |
| Production | 1,248 (63.0%) | 733 (37.0%) |
| Transportation | 1,430 (93.5%) | 99 (6.5%) |
| Material Moving | 1,082 (72.4%) | 413 (27.6%) |
| Total (Category) | 3,760 (75.1%) | 1,245 (24.9%) |
| Total (Overall) | 14,887 (53.0%) | 13,184 (47.0%) |
Employment Industries by Sex in Garfield County
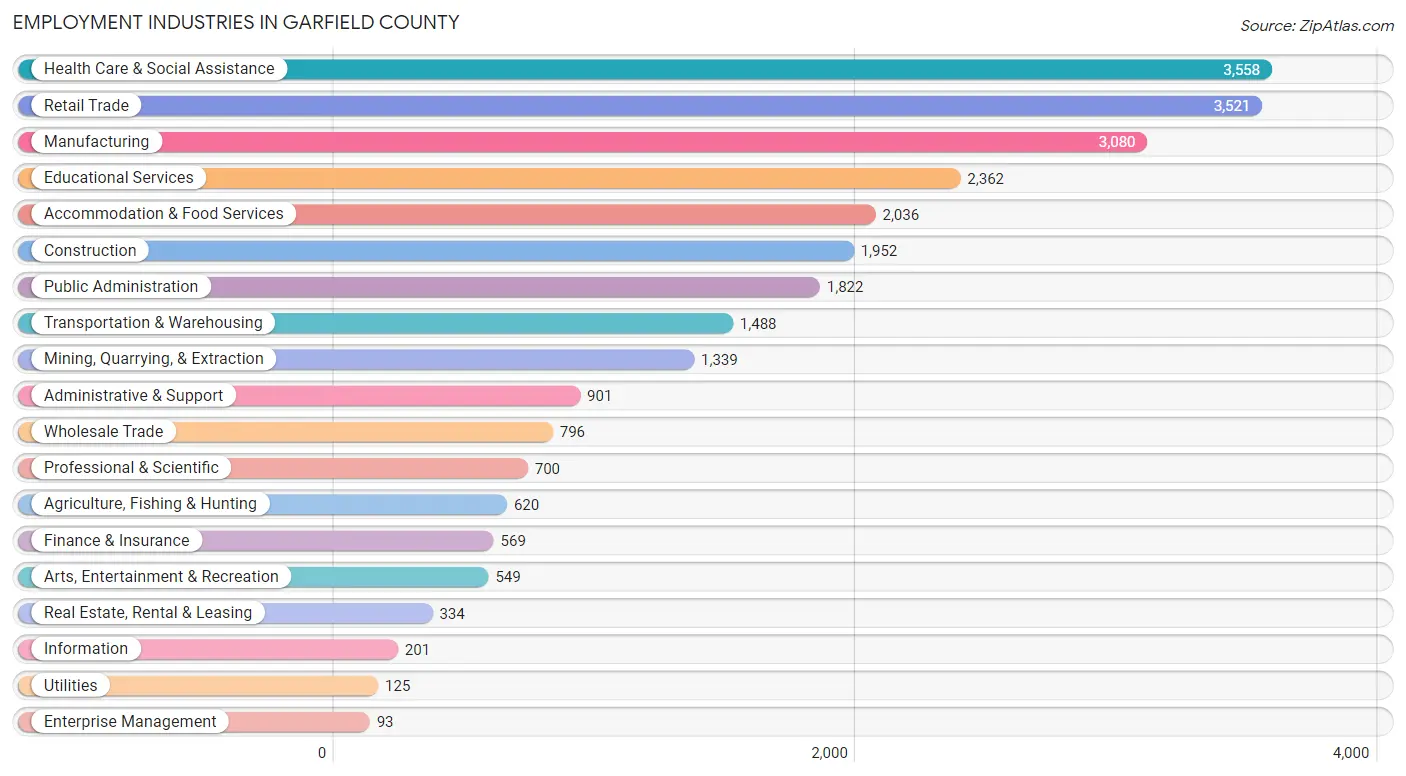
Employment Industries in Garfield County
The major employment industries in Garfield County include Health Care & Social Assistance (3,558 | 12.7%), Retail Trade (3,521 | 12.5%), Manufacturing (3,080 | 11.0%), Educational Services (2,362 | 8.4%), and Accommodation & Food Services (2,036 | 7.2%).
Employment Industries by Sex in Garfield County
The Garfield County industries that see more men than women are Mining, Quarrying, & Extraction (90.0%), Transportation & Warehousing (89.8%), and Construction (82.3%), whereas the industries that tend to have a higher number of women are Enterprise Management (100.0%), Health Care & Social Assistance (87.5%), and Educational Services (79.3%).
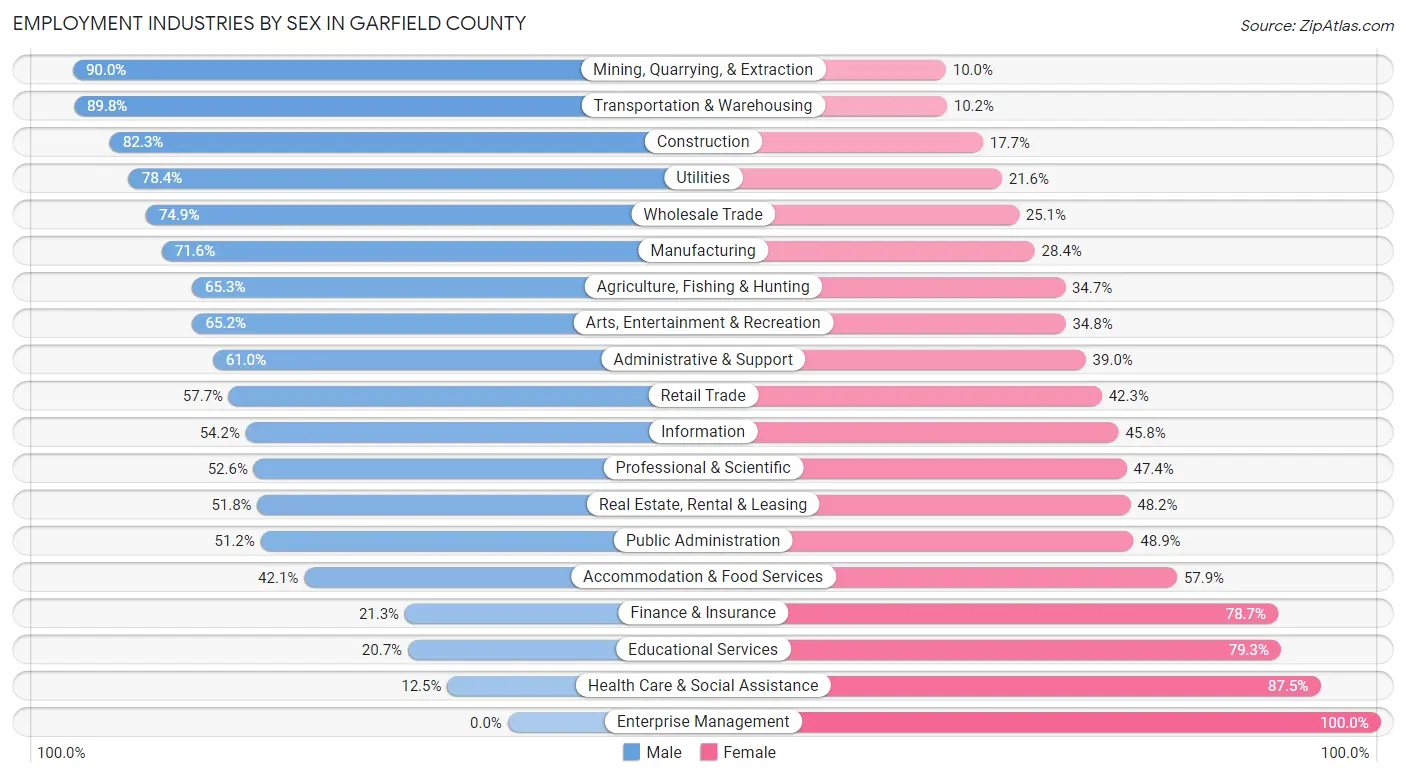
| Industry | Male | Female |
| Agriculture, Fishing & Hunting | 405 (65.3%) | 215 (34.7%) |
| Mining, Quarrying, & Extraction | 1,205 (90.0%) | 134 (10.0%) |
| Construction | 1,607 (82.3%) | 345 (17.7%) |
| Manufacturing | 2,205 (71.6%) | 875 (28.4%) |
| Wholesale Trade | 596 (74.9%) | 200 (25.1%) |
| Retail Trade | 2,032 (57.7%) | 1,489 (42.3%) |
| Transportation & Warehousing | 1,336 (89.8%) | 152 (10.2%) |
| Utilities | 98 (78.4%) | 27 (21.6%) |
| Information | 109 (54.2%) | 92 (45.8%) |
| Finance & Insurance | 121 (21.3%) | 448 (78.7%) |
| Real Estate, Rental & Leasing | 173 (51.8%) | 161 (48.2%) |
| Professional & Scientific | 368 (52.6%) | 332 (47.4%) |
| Enterprise Management | 0 (0.0%) | 93 (100.0%) |
| Administrative & Support | 550 (61.0%) | 351 (39.0%) |
| Educational Services | 488 (20.7%) | 1,874 (79.3%) |
| Health Care & Social Assistance | 445 (12.5%) | 3,113 (87.5%) |
| Arts, Entertainment & Recreation | 358 (65.2%) | 191 (34.8%) |
| Accommodation & Food Services | 858 (42.1%) | 1,178 (57.9%) |
| Public Administration | 932 (51.1%) | 890 (48.8%) |
| Total | 14,887 (53.0%) | 13,184 (47.0%) |
Education in Garfield County
School Enrollment in Garfield County
The most common levels of schooling among the 15,457 students in Garfield County are high school (4,015 | 26.0%), elementary school (3,959 | 25.6%), and middle school (3,201 | 20.7%).
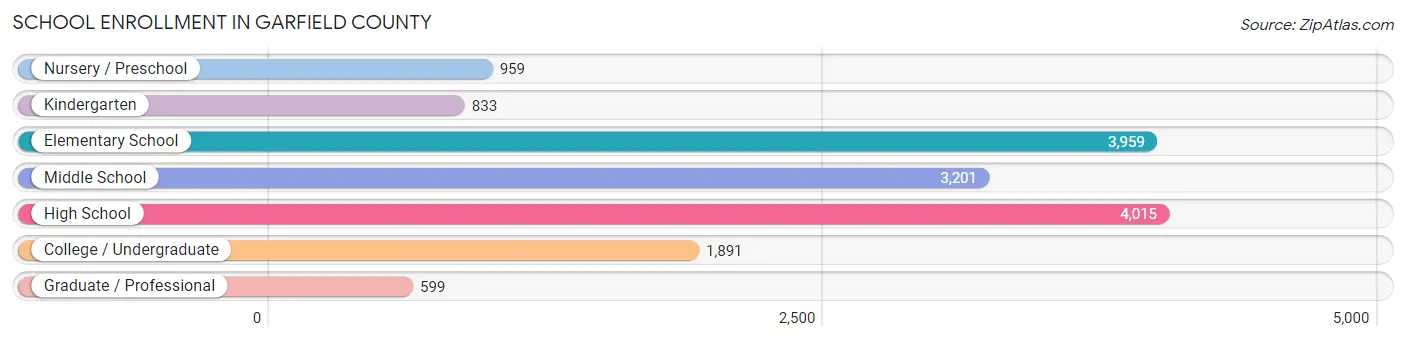
| School Level | # Students | % Students |
| Nursery / Preschool | 959 | 6.2% |
| Kindergarten | 833 | 5.4% |
| Elementary School | 3,959 | 25.6% |
| Middle School | 3,201 | 20.7% |
| High School | 4,015 | 26.0% |
| College / Undergraduate | 1,891 | 12.2% |
| Graduate / Professional | 599 | 3.9% |
| Total | 15,457 | 100.0% |
School Enrollment by Age by Funding Source in Garfield County
Out of a total of 15,457 students who are enrolled in schools in Garfield County, 1,901 (12.3%) attend a private institution, while the remaining 13,556 (87.7%) are enrolled in public schools. The age group of 35 years and over has the highest likelihood of being enrolled in private schools, with 190 (28.4% in the age bracket) enrolled. Conversely, the age group of 15 to 17 year olds has the lowest likelihood of being enrolled in a private school, with 2,569 (92.8% in the age bracket) attending a public institution.
| Age Bracket | Public School | Private School |
| 3 to 4 Year Olds | 592 (76.1%) | 186 (23.9%) |
| 5 to 9 Year Old | 3,734 (87.4%) | 540 (12.6%) |
| 10 to 14 Year Olds | 3,808 (89.0%) | 471 (11.0%) |
| 15 to 17 Year Olds | 2,569 (92.8%) | 199 (7.2%) |
| 18 to 19 Year Olds | 1,086 (87.2%) | 160 (12.8%) |
| 20 to 24 Year Olds | 815 (89.2%) | 99 (10.8%) |
| 25 to 34 Year Olds | 466 (88.3%) | 62 (11.7%) |
| 35 Years and over | 480 (71.6%) | 190 (28.4%) |
| Total | 13,556 (87.7%) | 1,901 (12.3%) |
Educational Attainment by Field of Study in Garfield County
Education (2,048 | 19.9%), business (1,942 | 18.9%), science & technology (1,255 | 12.2%), arts & humanities (911 | 8.9%), and bio, nature & agricultural (765 | 7.4%) are the most common fields of study among 10,270 individuals in Garfield County who have obtained a bachelor's degree or higher.
| Field of Study | # Graduates | % Graduates |
| Computers & Mathematics | 129 | 1.3% |
| Bio, Nature & Agricultural | 765 | 7.4% |
| Physical & Health Sciences | 518 | 5.0% |
| Psychology | 366 | 3.6% |
| Social Sciences | 740 | 7.2% |
| Engineering | 428 | 4.2% |
| Multidisciplinary Studies | 30 | 0.3% |
| Science & Technology | 1,255 | 12.2% |
| Business | 1,942 | 18.9% |
| Education | 2,048 | 19.9% |
| Literature & Languages | 199 | 1.9% |
| Liberal Arts & History | 670 | 6.5% |
| Visual & Performing Arts | 156 | 1.5% |
| Communications | 113 | 1.1% |
| Arts & Humanities | 911 | 8.9% |
| Total | 10,270 | 100.0% |
Transportation & Commute in Garfield County
Vehicle Availability by Sex in Garfield County
The most prevalent vehicle ownership categories in Garfield County are males with 2 vehicles (6,361, accounting for 42.1%) and females with 2 vehicles (4,814, making up 49.5%).
| Vehicles Available | Male | Female |
| No Vehicle | 446 (2.9%) | 216 (1.7%) |
| 1 Vehicle | 2,775 (18.4%) | 3,060 (23.8%) |
| 2 Vehicles | 6,361 (42.1%) | 4,814 (37.5%) |
| 3 Vehicles | 3,685 (24.4%) | 3,134 (24.4%) |
| 4 Vehicles | 1,264 (8.4%) | 1,208 (9.4%) |
| 5 or more Vehicles | 572 (3.8%) | 419 (3.3%) |
| Total | 15,103 (100.0%) | 12,851 (100.0%) |
Commute Time in Garfield County
The most frequently occuring commute durations in Garfield County are 10 to 14 minutes (6,722 commuters, 24.8%), 15 to 19 minutes (5,756 commuters, 21.2%), and 5 to 9 minutes (5,671 commuters, 20.9%).
| Commute Time | # Commuters | % Commuters |
| Less than 5 Minutes | 1,363 | 5.0% |
| 5 to 9 Minutes | 5,671 | 20.9% |
| 10 to 14 Minutes | 6,722 | 24.8% |
| 15 to 19 Minutes | 5,756 | 21.2% |
| 20 to 24 Minutes | 3,145 | 11.6% |
| 25 to 29 Minutes | 560 | 2.1% |
| 30 to 34 Minutes | 1,124 | 4.1% |
| 35 to 39 Minutes | 221 | 0.8% |
| 40 to 44 Minutes | 83 | 0.3% |
| 45 to 59 Minutes | 805 | 3.0% |
| 60 to 89 Minutes | 1,168 | 4.3% |
| 90 or more Minutes | 534 | 2.0% |
Commute Time by Sex in Garfield County
The most common commute times in Garfield County are 10 to 14 minutes (3,277 commuters, 22.0%) for males and 10 to 14 minutes (3,445 commuters, 28.2%) for females.
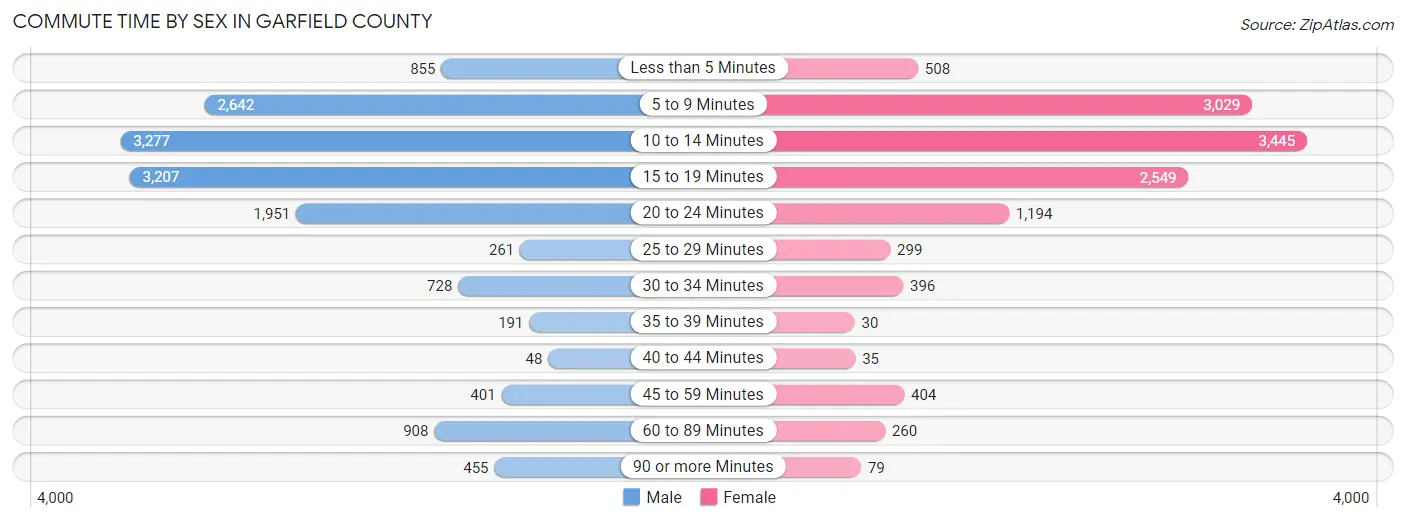
| Commute Time | Male | Female |
| Less than 5 Minutes | 855 (5.7%) | 508 (4.2%) |
| 5 to 9 Minutes | 2,642 (17.7%) | 3,029 (24.8%) |
| 10 to 14 Minutes | 3,277 (22.0%) | 3,445 (28.2%) |
| 15 to 19 Minutes | 3,207 (21.5%) | 2,549 (20.8%) |
| 20 to 24 Minutes | 1,951 (13.1%) | 1,194 (9.8%) |
| 25 to 29 Minutes | 261 (1.8%) | 299 (2.5%) |
| 30 to 34 Minutes | 728 (4.9%) | 396 (3.2%) |
| 35 to 39 Minutes | 191 (1.3%) | 30 (0.3%) |
| 40 to 44 Minutes | 48 (0.3%) | 35 (0.3%) |
| 45 to 59 Minutes | 401 (2.7%) | 404 (3.3%) |
| 60 to 89 Minutes | 908 (6.1%) | 260 (2.1%) |
| 90 or more Minutes | 455 (3.0%) | 79 (0.6%) |
Time of Departure to Work by Sex in Garfield County
The most frequent times of departure to work in Garfield County are 7:00 AM to 7:29 AM (2,297, 15.4%) for males and 7:30 AM to 7:59 AM (2,519, 20.6%) for females.
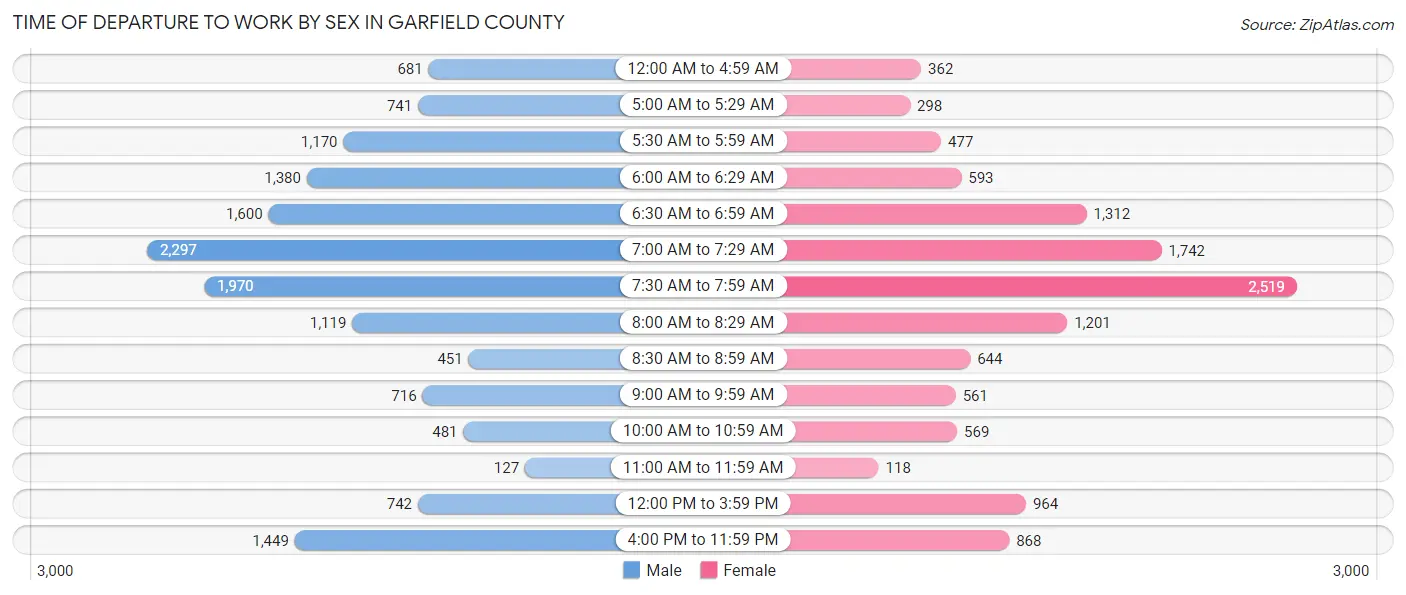
| Time of Departure | Male | Female |
| 12:00 AM to 4:59 AM | 681 (4.6%) | 362 (3.0%) |
| 5:00 AM to 5:29 AM | 741 (5.0%) | 298 (2.4%) |
| 5:30 AM to 5:59 AM | 1,170 (7.8%) | 477 (3.9%) |
| 6:00 AM to 6:29 AM | 1,380 (9.2%) | 593 (4.9%) |
| 6:30 AM to 6:59 AM | 1,600 (10.7%) | 1,312 (10.7%) |
| 7:00 AM to 7:29 AM | 2,297 (15.4%) | 1,742 (14.2%) |
| 7:30 AM to 7:59 AM | 1,970 (13.2%) | 2,519 (20.6%) |
| 8:00 AM to 8:29 AM | 1,119 (7.5%) | 1,201 (9.8%) |
| 8:30 AM to 8:59 AM | 451 (3.0%) | 644 (5.3%) |
| 9:00 AM to 9:59 AM | 716 (4.8%) | 561 (4.6%) |
| 10:00 AM to 10:59 AM | 481 (3.2%) | 569 (4.6%) |
| 11:00 AM to 11:59 AM | 127 (0.9%) | 118 (1.0%) |
| 12:00 PM to 3:59 PM | 742 (5.0%) | 964 (7.9%) |
| 4:00 PM to 11:59 PM | 1,449 (9.7%) | 868 (7.1%) |
| Total | 14,924 (100.0%) | 12,228 (100.0%) |
Housing Occupancy in Garfield County
Occupancy by Ownership in Garfield County
Of the total 23,815 dwellings in Garfield County, owner-occupied units account for 15,657 (65.7%), while renter-occupied units make up 8,158 (34.3%).
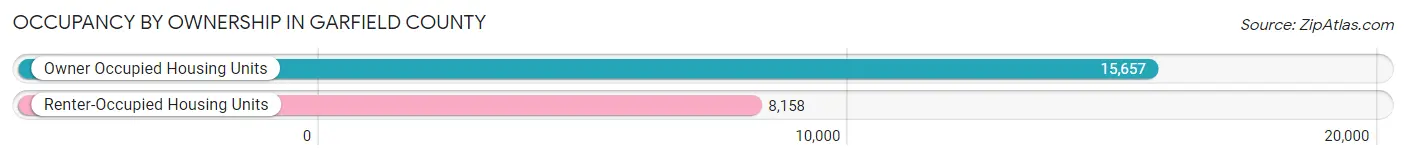
| Occupancy | # Housing Units | % Housing Units |
| Owner Occupied Housing Units | 15,657 | 65.7% |
| Renter-Occupied Housing Units | 8,158 | 34.3% |
| Total Occupied Housing Units | 23,815 | 100.0% |
Occupancy by Household Size in Garfield County
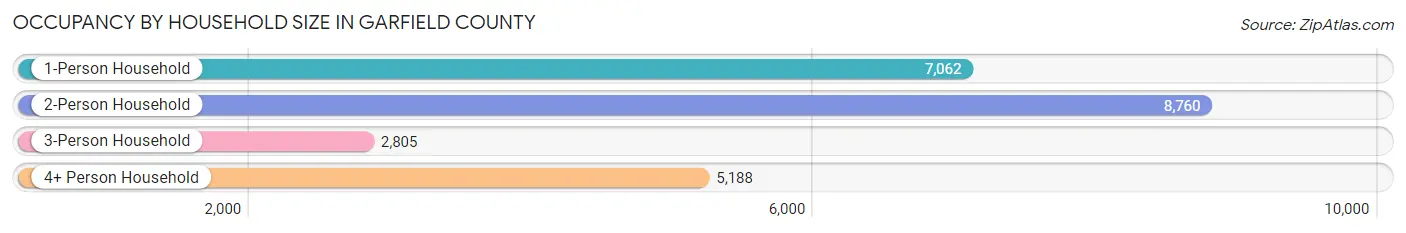
| Household Size | # Housing Units | % Housing Units |
| 1-Person Household | 7,062 | 29.6% |
| 2-Person Household | 8,760 | 36.8% |
| 3-Person Household | 2,805 | 11.8% |
| 4+ Person Household | 5,188 | 21.8% |
| Total Housing Units | 23,815 | 100.0% |
Occupancy by Ownership by Household Size in Garfield County
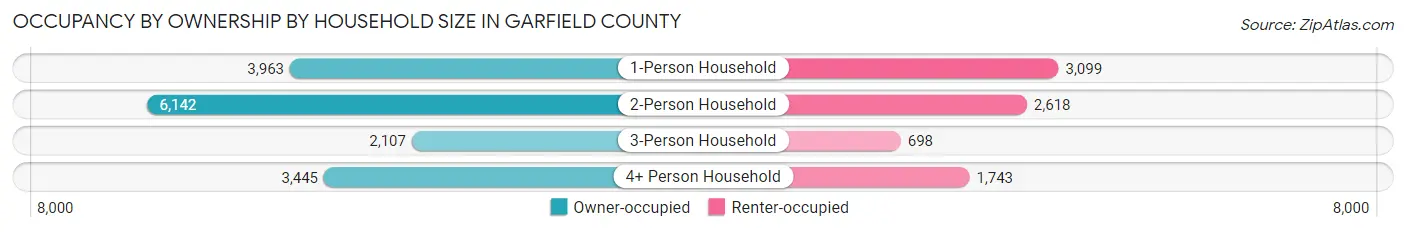
| Household Size | Owner-occupied | Renter-occupied |
| 1-Person Household | 3,963 (56.1%) | 3,099 (43.9%) |
| 2-Person Household | 6,142 (70.1%) | 2,618 (29.9%) |
| 3-Person Household | 2,107 (75.1%) | 698 (24.9%) |
| 4+ Person Household | 3,445 (66.4%) | 1,743 (33.6%) |
| Total Housing Units | 15,657 (65.7%) | 8,158 (34.3%) |
Occupancy by Educational Attainment in Garfield County
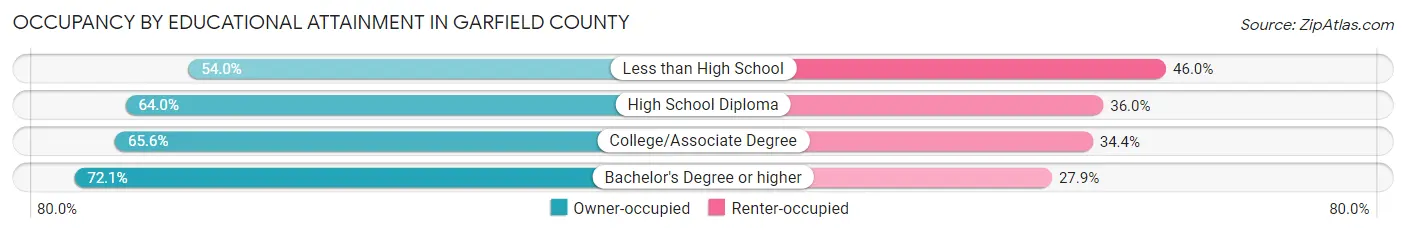
| Household Size | Owner-occupied | Renter-occupied |
| Less than High School | 1,198 (54.0%) | 1,020 (46.0%) |
| High School Diploma | 5,176 (64.0%) | 2,914 (36.0%) |
| College/Associate Degree | 4,634 (65.6%) | 2,426 (34.4%) |
| Bachelor's Degree or higher | 4,649 (72.1%) | 1,798 (27.9%) |
Occupancy by Age of Householder in Garfield County
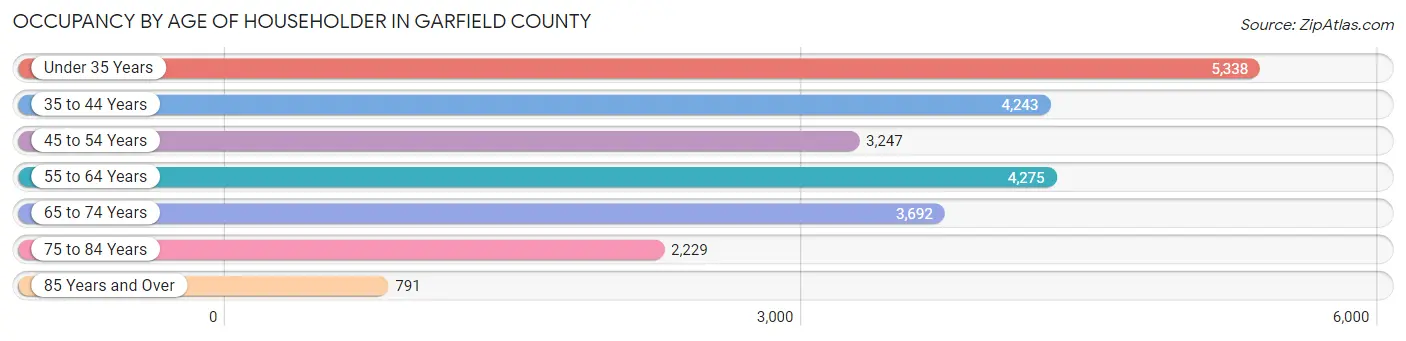
| Age Bracket | # Households | % Households |
| Under 35 Years | 5,338 | 22.4% |
| 35 to 44 Years | 4,243 | 17.8% |
| 45 to 54 Years | 3,247 | 13.6% |
| 55 to 64 Years | 4,275 | 17.9% |
| 65 to 74 Years | 3,692 | 15.5% |
| 75 to 84 Years | 2,229 | 9.4% |
| 85 Years and Over | 791 | 3.3% |
| Total | 23,815 | 100.0% |
Housing Finances in Garfield County
Median Income by Occupancy in Garfield County
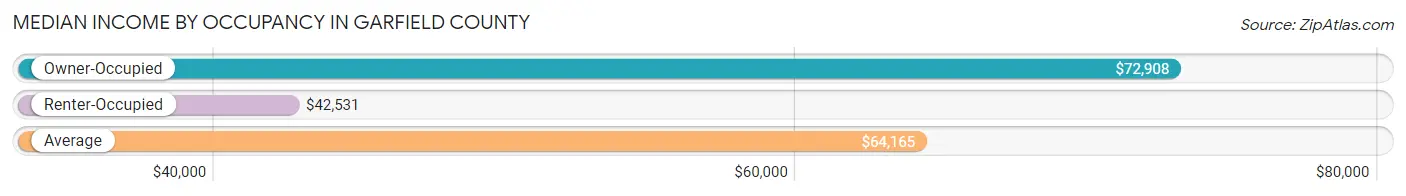
| Occupancy Type | # Households | Median Income |
| Owner-Occupied | 15,657 (65.7%) | $72,908 |
| Renter-Occupied | 8,158 (34.3%) | $42,531 |
| Average | 23,815 (100.0%) | $64,165 |
Occupancy by Householder Income Bracket in Garfield County
| Income Bracket | Owner-occupied | Renter-occupied |
| Less than $5,000 | 384 (2.5%) | 309 (3.8%) |
| $5,000 to $9,999 | 187 (1.2%) | 192 (2.4%) |
| $10,000 to $14,999 | 324 (2.1%) | 724 (8.9%) |
| $15,000 to $19,999 | 370 (2.4%) | 531 (6.5%) |
| $20,000 to $24,999 | 444 (2.8%) | 664 (8.1%) |
| $25,000 to $34,999 | 1,300 (8.3%) | 1,131 (13.9%) |
| $35,000 to $49,999 | 1,497 (9.6%) | 1,046 (12.8%) |
| $50,000 to $74,999 | 3,484 (22.3%) | 1,469 (18.0%) |
| $75,000 to $99,999 | 2,359 (15.1%) | 1,222 (15.0%) |
| $100,000 to $149,999 | 2,924 (18.7%) | 607 (7.4%) |
| $150,000 or more | 2,384 (15.2%) | 263 (3.2%) |
| Total | 15,657 (100.0%) | 8,158 (100.0%) |
Monthly Housing Cost Tiers in Garfield County
| Monthly Cost | Owner-occupied | Renter-occupied |
| Less than $300 | 1,464 (9.3%) | 51 (0.6%) |
| $300 to $499 | 3,001 (19.2%) | 403 (4.9%) |
| $500 to $799 | 3,455 (22.1%) | 2,618 (32.1%) |
| $800 to $999 | 1,532 (9.8%) | 1,987 (24.4%) |
| $1,000 to $1,499 | 3,534 (22.6%) | 1,628 (20.0%) |
| $1,500 to $1,999 | 1,337 (8.5%) | 257 (3.2%) |
| $2,000 to $2,499 | 688 (4.4%) | 223 (2.7%) |
| $2,500 to $2,999 | 262 (1.7%) | 51 (0.6%) |
| $3,000 or more | 384 (2.5%) | 109 (1.3%) |
| Total | 15,657 (100.0%) | 8,158 (100.0%) |
Physical Housing Characteristics in Garfield County
Housing Structures in Garfield County
| Structure Type | # Housing Units | % Housing Units |
| Single Unit, Detached | 19,337 | 81.2% |
| Single Unit, Attached | 399 | 1.7% |
| 2 Unit Apartments | 405 | 1.7% |
| 3 or 4 Unit Apartments | 633 | 2.7% |
| 5 to 9 Unit Apartments | 476 | 2.0% |
| 10 or more Apartments | 1,186 | 5.0% |
| Mobile Home / Other | 1,379 | 5.8% |
| Total | 23,815 | 100.0% |
Housing Structures by Occupancy in Garfield County
| Structure Type | Owner-occupied | Renter-occupied |
| Single Unit, Detached | 14,442 (74.7%) | 4,895 (25.3%) |
| Single Unit, Attached | 161 (40.4%) | 238 (59.7%) |
| 2 Unit Apartments | 33 (8.2%) | 372 (91.8%) |
| 3 or 4 Unit Apartments | 16 (2.5%) | 617 (97.5%) |
| 5 to 9 Unit Apartments | 0 (0.0%) | 476 (100.0%) |
| 10 or more Apartments | 0 (0.0%) | 1,186 (100.0%) |
| Mobile Home / Other | 1,005 (72.9%) | 374 (27.1%) |
| Total | 15,657 (65.7%) | 8,158 (34.3%) |
Housing Structures by Number of Rooms in Garfield County
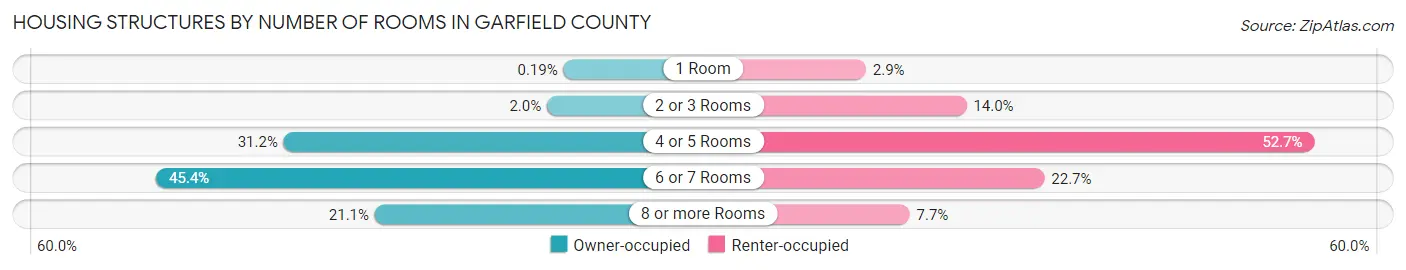
| Number of Rooms | Owner-occupied | Renter-occupied |
| 1 Room | 29 (0.2%) | 235 (2.9%) |
| 2 or 3 Rooms | 317 (2.0%) | 1,145 (14.0%) |
| 4 or 5 Rooms | 4,891 (31.2%) | 4,296 (52.7%) |
| 6 or 7 Rooms | 7,111 (45.4%) | 1,851 (22.7%) |
| 8 or more Rooms | 3,309 (21.1%) | 631 (7.7%) |
| Total | 15,657 (100.0%) | 8,158 (100.0%) |
Housing Structure by Heating Type in Garfield County
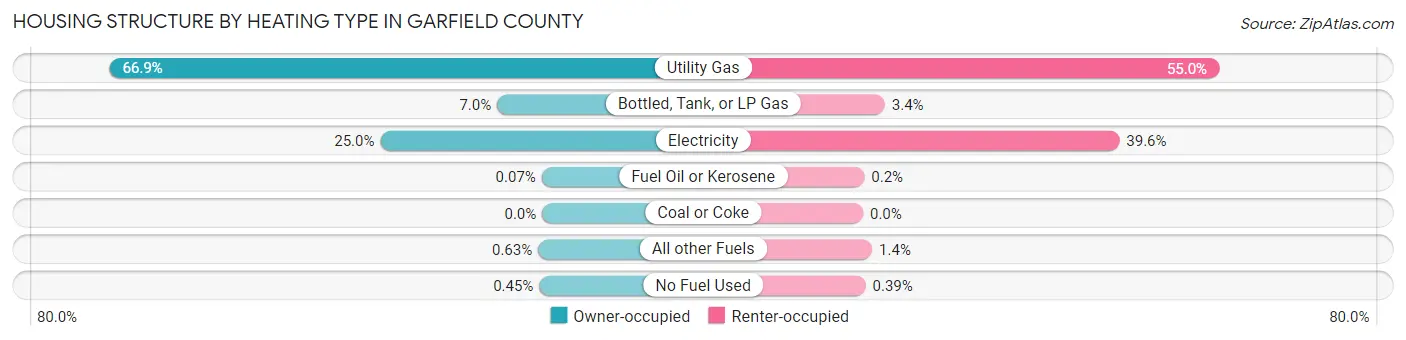
| Heating Type | Owner-occupied | Renter-occupied |
| Utility Gas | 10,471 (66.9%) | 4,488 (55.0%) |
| Bottled, Tank, or LP Gas | 1,090 (7.0%) | 275 (3.4%) |
| Electricity | 3,916 (25.0%) | 3,232 (39.6%) |
| Fuel Oil or Kerosene | 11 (0.1%) | 16 (0.2%) |
| Coal or Coke | 0 (0.0%) | 0 (0.0%) |
| All other Fuels | 99 (0.6%) | 115 (1.4%) |
| No Fuel Used | 70 (0.4%) | 32 (0.4%) |
| Total | 15,657 (100.0%) | 8,158 (100.0%) |
Household Vehicle Usage in Garfield County
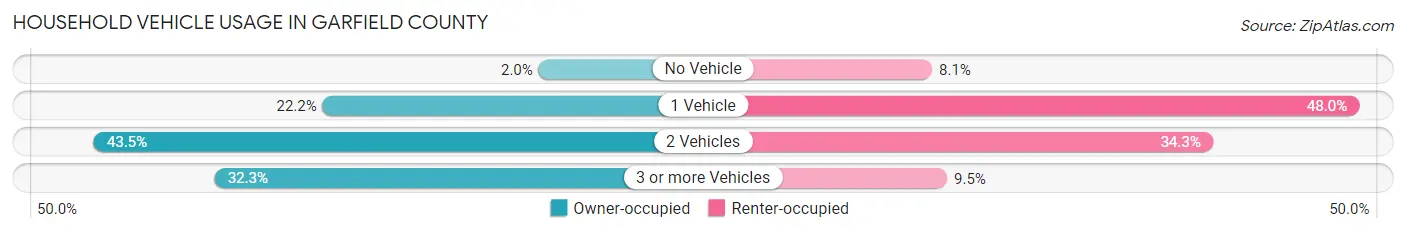
| Vehicles per Household | Owner-occupied | Renter-occupied |
| No Vehicle | 317 (2.0%) | 664 (8.1%) |
| 1 Vehicle | 3,474 (22.2%) | 3,915 (48.0%) |
| 2 Vehicles | 6,816 (43.5%) | 2,801 (34.3%) |
| 3 or more Vehicles | 5,050 (32.3%) | 778 (9.5%) |
| Total | 15,657 (100.0%) | 8,158 (100.0%) |
Real Estate & Mortgages in Garfield County
Real Estate and Mortgage Overview in Garfield County
| Characteristic | Without Mortgage | With Mortgage |
| Housing Units | 7,733 | 7,924 |
| Median Property Value | $133,800 | $149,500 |
| Median Household Income | $66,085 | $1,332 |
| Monthly Housing Costs | $474 | $381 |
| Real Estate Taxes | $1,057 | $353 |
Property Value by Mortgage Status in Garfield County
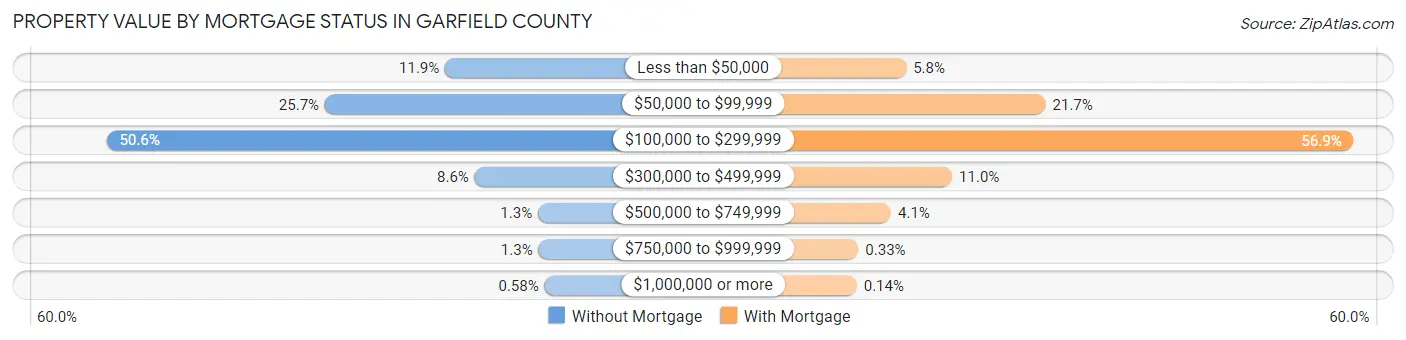
| Property Value | Without Mortgage | With Mortgage |
| Less than $50,000 | 923 (11.9%) | 459 (5.8%) |
| $50,000 to $99,999 | 1,986 (25.7%) | 1,721 (21.7%) |
| $100,000 to $299,999 | 3,916 (50.6%) | 4,510 (56.9%) |
| $300,000 to $499,999 | 662 (8.6%) | 875 (11.0%) |
| $500,000 to $749,999 | 103 (1.3%) | 322 (4.1%) |
| $750,000 to $999,999 | 98 (1.3%) | 26 (0.3%) |
| $1,000,000 or more | 45 (0.6%) | 11 (0.1%) |
| Total | 7,733 (100.0%) | 7,924 (100.0%) |
Household Income by Mortgage Status in Garfield County
| Household Income | Without Mortgage | With Mortgage |
| Less than $10,000 | 337 (4.4%) | 55 (0.7%) |
| $10,000 to $24,999 | 821 (10.6%) | 234 (2.9%) |
| $25,000 to $34,999 | 808 (10.4%) | 317 (4.0%) |
| $35,000 to $49,999 | 682 (8.8%) | 492 (6.2%) |
| $50,000 to $74,999 | 1,828 (23.6%) | 815 (10.3%) |
| $75,000 to $99,999 | 1,220 (15.8%) | 1,656 (20.9%) |
| $100,000 to $149,999 | 985 (12.7%) | 1,139 (14.4%) |
| $150,000 or more | 1,052 (13.6%) | 1,939 (24.5%) |
| Total | 7,733 (100.0%) | 7,924 (100.0%) |
Property Value to Household Income Ratio in Garfield County
| Value-to-Income Ratio | Without Mortgage | With Mortgage |
| Less than 2.0x | 3,590 (46.4%) | 86,541 (1,092.1%) |
| 2.0x to 2.9x | 1,669 (21.6%) | 4,236 (53.5%) |
| 3.0x to 3.9x | 856 (11.1%) | 1,783 (22.5%) |
| 4.0x or more | 1,501 (19.4%) | 767 (9.7%) |
| Total | 7,733 (100.0%) | 7,924 (100.0%) |
Real Estate Taxes by Mortgage Status in Garfield County
| Property Taxes | Without Mortgage | With Mortgage |
| Less than $800 | 2,967 (38.4%) | 90 (1.1%) |
| $800 to $1,499 | 1,775 (23.0%) | 1,975 (24.9%) |
| $800 to $1,499 | 2,413 (31.2%) | 2,514 (31.7%) |
| Total | 7,733 (100.0%) | 7,924 (100.0%) |
Health & Disability in Garfield County
Health Insurance Coverage by Age in Garfield County
| Age Bracket | With Coverage | Without Coverage |
| Under 6 Years | 4,662 (93.7%) | 315 (6.3%) |
| 6 to 18 Years | 10,763 (91.2%) | 1,042 (8.8%) |
| 19 to 25 Years | 3,802 (75.6%) | 1,225 (24.4%) |
| 26 to 34 Years | 4,883 (69.3%) | 2,167 (30.7%) |
| 35 to 44 Years | 5,869 (75.4%) | 1,914 (24.6%) |
| 45 to 54 Years | 5,085 (82.1%) | 1,112 (17.9%) |
| 55 to 64 Years | 6,597 (88.6%) | 845 (11.4%) |
| 65 to 74 Years | 5,614 (97.9%) | 123 (2.1%) |
| 75 Years and older | 4,056 (99.2%) | 31 (0.8%) |
| Total | 51,331 (85.4%) | 8,774 (14.6%) |
Health Insurance Coverage by Citizenship Status in Garfield County
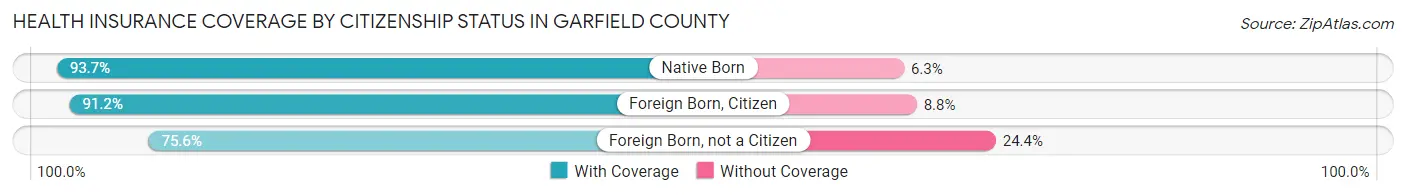
| Citizenship Status | With Coverage | Without Coverage |
| Native Born | 4,662 (93.7%) | 315 (6.3%) |
| Foreign Born, Citizen | 10,763 (91.2%) | 1,042 (8.8%) |
| Foreign Born, not a Citizen | 3,802 (75.6%) | 1,225 (24.4%) |
Health Insurance Coverage by Household Income in Garfield County
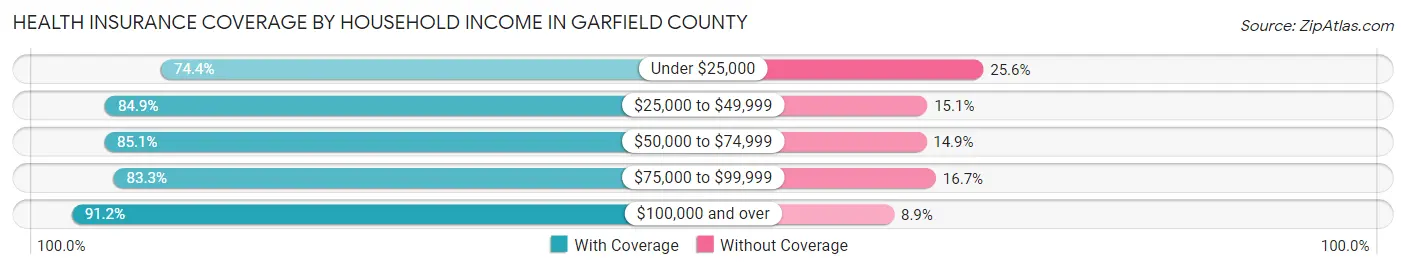
| Household Income | With Coverage | Without Coverage |
| Under $25,000 | 5,642 (74.4%) | 1,939 (25.6%) |
| $25,000 to $49,999 | 9,249 (84.9%) | 1,641 (15.1%) |
| $50,000 to $74,999 | 9,814 (85.1%) | 1,718 (14.9%) |
| $75,000 to $99,999 | 8,415 (83.3%) | 1,686 (16.7%) |
| $100,000 and over | 17,935 (91.1%) | 1,742 (8.8%) |
Public vs Private Health Insurance Coverage by Age in Garfield County
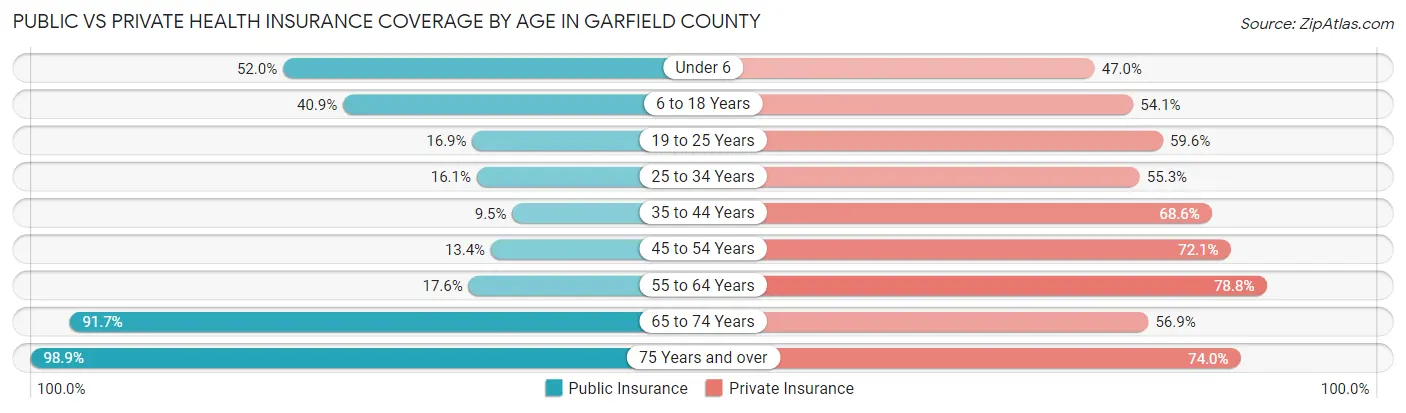
| Age Bracket | Public Insurance | Private Insurance |
| Under 6 | 2,590 (52.0%) | 2,337 (47.0%) |
| 6 to 18 Years | 4,826 (40.9%) | 6,390 (54.1%) |
| 19 to 25 Years | 849 (16.9%) | 2,997 (59.6%) |
| 25 to 34 Years | 1,133 (16.1%) | 3,901 (55.3%) |
| 35 to 44 Years | 736 (9.5%) | 5,342 (68.6%) |
| 45 to 54 Years | 833 (13.4%) | 4,469 (72.1%) |
| 55 to 64 Years | 1,310 (17.6%) | 5,863 (78.8%) |
| 65 to 74 Years | 5,259 (91.7%) | 3,266 (56.9%) |
| 75 Years and over | 4,042 (98.9%) | 3,023 (74.0%) |
| Total | 21,578 (35.9%) | 37,588 (62.5%) |
Disability Status by Sex by Age in Garfield County
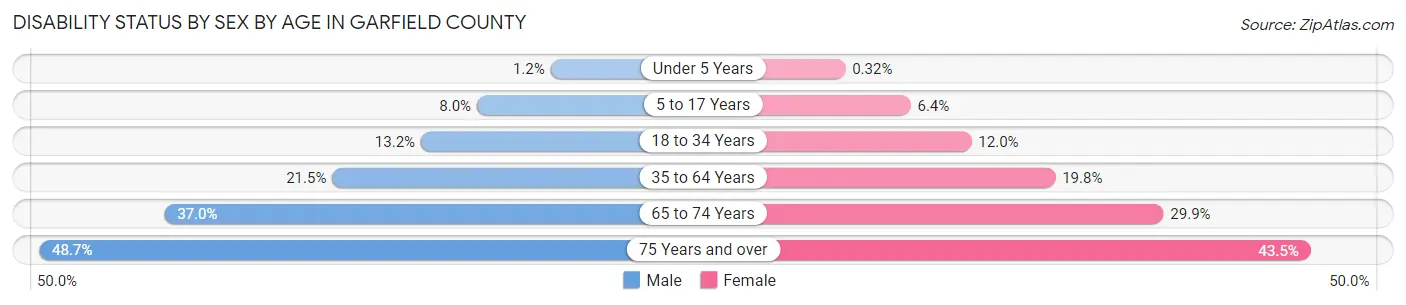
| Age Bracket | Male | Female |
| Under 5 Years | 24 (1.2%) | 7 (0.3%) |
| 5 to 17 Years | 487 (8.0%) | 364 (6.4%) |
| 18 to 34 Years | 843 (13.2%) | 779 (12.0%) |
| 35 to 64 Years | 2,324 (21.4%) | 2,098 (19.8%) |
| 65 to 74 Years | 1,043 (37.0%) | 872 (29.8%) |
| 75 Years and over | 782 (48.7%) | 1,079 (43.5%) |
Disability Class by Sex by Age in Garfield County
Disability Class: Hearing Difficulty
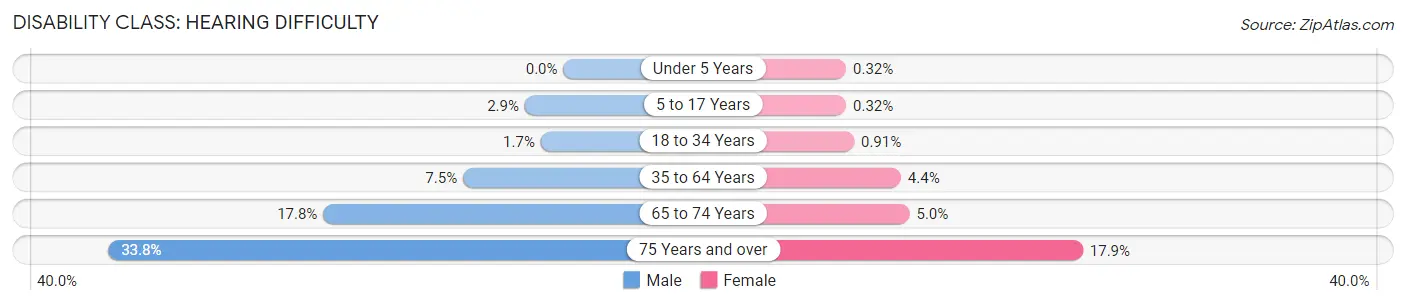
| Age Bracket | Male | Female |
| Under 5 Years | 0 (0.0%) | 7 (0.3%) |
| 5 to 17 Years | 174 (2.9%) | 18 (0.3%) |
| 18 to 34 Years | 107 (1.7%) | 59 (0.9%) |
| 35 to 64 Years | 807 (7.4%) | 465 (4.4%) |
| 65 to 74 Years | 502 (17.8%) | 147 (5.0%) |
| 75 Years and over | 543 (33.8%) | 444 (17.9%) |
Disability Class: Vision Difficulty
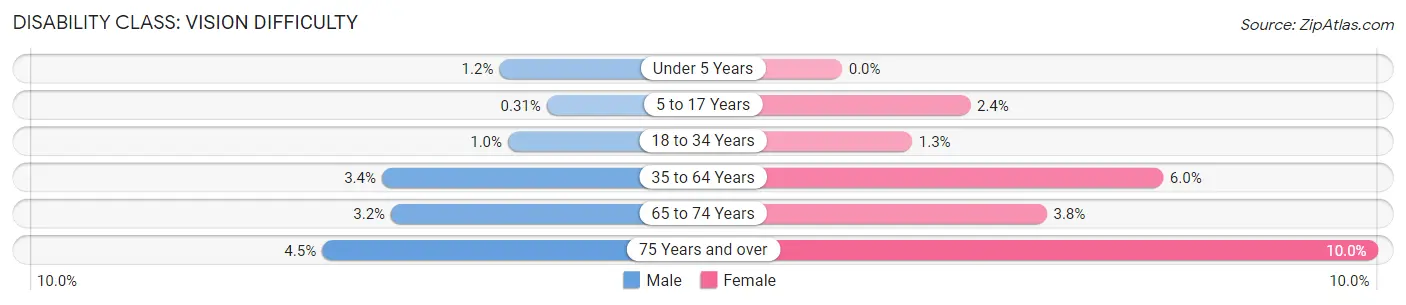
| Age Bracket | Male | Female |
| Under 5 Years | 24 (1.2%) | 0 (0.0%) |
| 5 to 17 Years | 19 (0.3%) | 136 (2.4%) |
| 18 to 34 Years | 66 (1.0%) | 84 (1.3%) |
| 35 to 64 Years | 365 (3.4%) | 631 (6.0%) |
| 65 to 74 Years | 90 (3.2%) | 111 (3.8%) |
| 75 Years and over | 72 (4.5%) | 247 (10.0%) |
Disability Class: Cognitive Difficulty
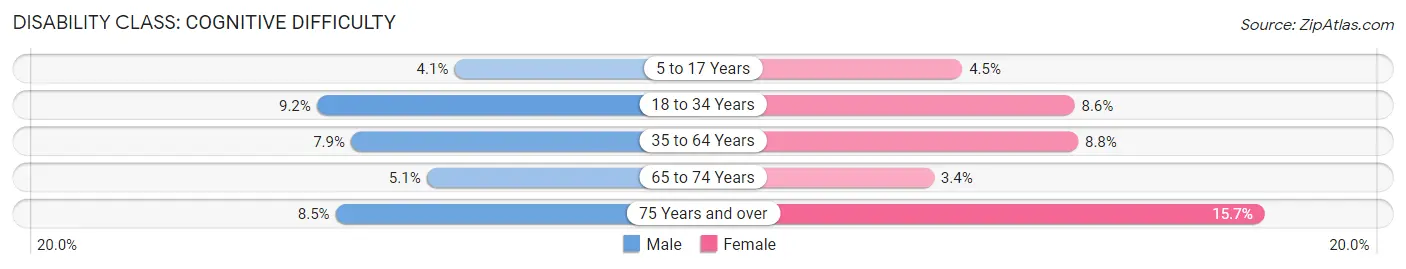
| Age Bracket | Male | Female |
| 5 to 17 Years | 246 (4.1%) | 255 (4.5%) |
| 18 to 34 Years | 584 (9.2%) | 560 (8.6%) |
| 35 to 64 Years | 855 (7.9%) | 929 (8.8%) |
| 65 to 74 Years | 143 (5.1%) | 100 (3.4%) |
| 75 Years and over | 136 (8.5%) | 389 (15.7%) |
Disability Class: Ambulatory Difficulty
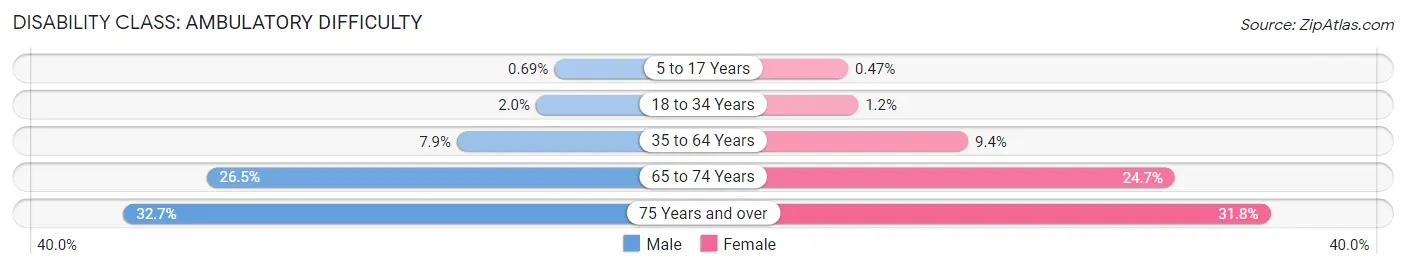
| Age Bracket | Male | Female |
| 5 to 17 Years | 42 (0.7%) | 27 (0.5%) |
| 18 to 34 Years | 130 (2.0%) | 79 (1.2%) |
| 35 to 64 Years | 857 (7.9%) | 993 (9.4%) |
| 65 to 74 Years | 746 (26.5%) | 722 (24.7%) |
| 75 Years and over | 525 (32.7%) | 789 (31.8%) |
Disability Class: Self-Care Difficulty
| Age Bracket | Male | Female |
| 5 to 17 Years | 43 (0.7%) | 62 (1.1%) |
| 18 to 34 Years | 183 (2.9%) | 53 (0.8%) |
| 35 to 64 Years | 212 (2.0%) | 394 (3.7%) |
| 65 to 74 Years | 243 (8.6%) | 146 (5.0%) |
| 75 Years and over | 142 (8.8%) | 236 (9.5%) |
Technology Access in Garfield County
Computing Device Access in Garfield County
| Device Type | # Households | % Households |
| Desktop or Laptop | 17,008 | 71.4% |
| Smartphone | 20,813 | 87.4% |
| Tablet | 13,416 | 56.3% |
| No Computing Device | 1,428 | 6.0% |
| Total | 23,815 | 100.0% |
Internet Access in Garfield County
| Internet Type | # Households | % Households |
| Dial-Up Internet | 20 | 0.1% |
| Broadband Home | 15,356 | 64.5% |
| Cellular Data Only | 3,214 | 13.5% |
| Satellite Internet | 2,349 | 9.9% |
| No Internet | 3,540 | 14.9% |
| Total | 23,815 | 100.0% |
Garfield County Summary
Garfield County is located in the north-central region of Oklahoma, and is bordered by Grant, Kay, Noble, and Logan Counties. The county seat is Enid, and the county was named after James A. Garfield, the 20th President of the United States. Garfield County covers an area of 1,072 square miles, and is home to a population of 60,580 people, according to the 2010 census.
Geography
Garfield County is located in the Osage Plains region of Oklahoma, and is characterized by rolling hills and flat plains. The county is drained by the Cimarron River, which flows through the county from north to south. The county is also home to several small lakes, including Lake Watonga, Lake Burtschi, and Lake Lahoma. The county is home to several state parks, including Boiling Springs State Park, Great Salt Plains State Park, and Cherokee Landing State Park.
Climate
Garfield County has a humid subtropical climate, with hot summers and mild winters. The average annual temperature is 63°F, and the average annual precipitation is 33.5 inches.
Economy
Garfield County is home to a diverse economy, with a variety of industries providing employment opportunities. The county is home to several large employers, including Enid Regional Medical Center, Vance Air Force Base, and the Enid Public Schools. The county is also home to several manufacturing companies, including Enid Manufacturing, Inc., and Enid Industries, Inc. Agriculture is also an important part of the county’s economy, with wheat, sorghum, and hay being the primary crops.
Demographics
According to the 2010 census, Garfield County had a population of 60,580 people. The racial makeup of the county was 87.3% White, 5.3% African American, 1.2% Native American, 1.2% Asian, 0.2% Pacific Islander, and 3.7% from other races. The median household income was $41,945, and the median family income was $50,945.
Garfield County is home to a variety of religious denominations, including Baptist, Methodist, Catholic, and Lutheran. The county is also home to several colleges and universities, including Northwestern Oklahoma State University, Autry Technology Center, and Northern Oklahoma College.
Garfield County is a vibrant and diverse county, with a variety of industries providing employment opportunities and a variety of recreational activities available for residents and visitors alike. The county is home to a variety of religious denominations, and is home to several colleges and universities. The county is also home to a variety of state parks, providing residents and visitors with a variety of outdoor activities.
Common Questions
What is the Total Population of Garfield County?
Total Population of Garfield County is 62,456.
What is the Total Male Population of Garfield County?
Total Male Population of Garfield County is 31,386.
What is the Total Female Population of Garfield County?
Total Female Population of Garfield County is 31,070.
What is the Ratio of Males per 100 Females in Garfield County?
There are 101.02 Males per 100 Females in Garfield County.
What is the Ratio of Females per 100 Males in Garfield County?
There are 98.99 Females per 100 Males in Garfield County.
What is the Median Population Age in Garfield County?
Median Population Age in Garfield County is 35.7 Years.
What is the Average Family Size in Garfield County
Average Family Size in Garfield County is 3.2 People.
What is the Average Household Size in Garfield County
Average Household Size in Garfield County is 2.5 People.
What is Per Capita Income in Garfield County?
Per Capita income in Garfield County is $32,579.
What is the Median Family Income in Garfield County?
Median Family Income in Garfield County is $79,145.
What is the Median Household income in Garfield County?
Median Household Income in Garfield County is $64,165.
What is Income or Wage Gap in Garfield County?
Income or Wage Gap in Garfield County is 33.5%.
Women in Garfield County earn 66.5 cents for every dollar earned by a man.
What is Family Income Deficit in Garfield County?
Family Income Deficit in Garfield County is $10,554.
Families that are below poverty line in Garfield County earn $10,554 less on average than the poverty threshold level.
What is Inequality or Gini Index in Garfield County?
Inequality or Gini Index in Garfield County is 0.45.
How Large is the Labor Force in Garfield County?
There are 30,658 People in the Labor Forcein in Garfield County.
What is the Percentage of People in the Labor Force in Garfield County?
63.8% of People are in the Labor Force in Garfield County.
What is the Unemployment Rate in Garfield County?
Unemployment Rate in Garfield County is 4.6%.