Ellis County, OK
Ellis County Map
Ellis County Overview
3,755
TOTAL POPULATION
1,827
MALE POPULATION
1,928
FEMALE POPULATION
94.76
MALES / 100 FEMALES
105.53
FEMALES / 100 MALES
43.8
MEDIAN AGE
3.4
AVG FAMILY SIZE
2.6
AVG HOUSEHOLD SIZE
$31,331
PER CAPITA INCOME
$74,375
AVG FAMILY INCOME
$57,768
AVG HOUSEHOLD INCOME
29.6%
WAGE / INCOME GAP [ % ]
70.4¢/ $1
WAGE / INCOME GAP [ $ ]
$8,436
FAMILY INCOME DEFICIT
0.44
INEQUALITY / GINI INDEX
1,739
LABOR FORCE [ PEOPLE ]
57.1%
PERCENT IN LABOR FORCE
8.8%
UNEMPLOYMENT RATE
Ellis County Area Codes
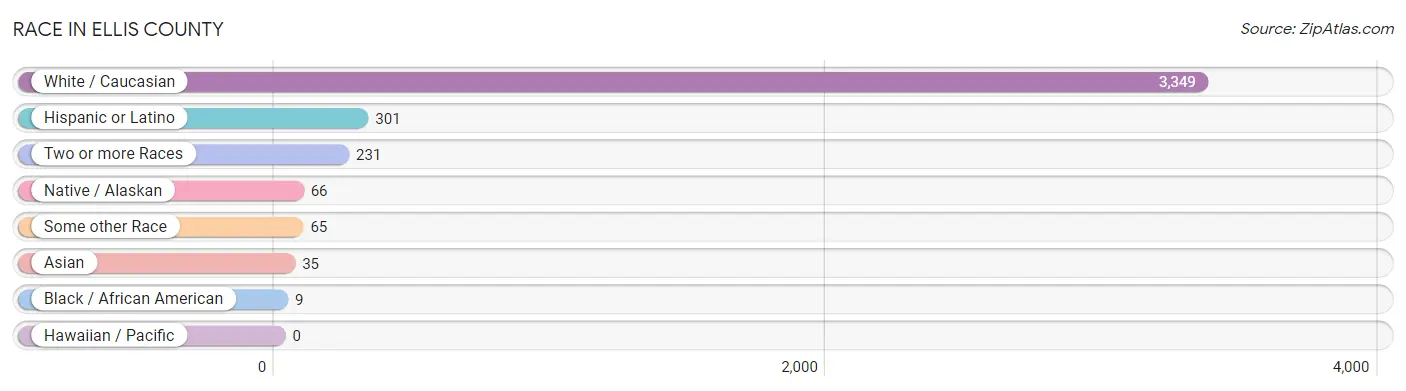
Race in Ellis County
The most populous races in Ellis County are White / Caucasian (3,349 | 89.2%), Hispanic or Latino (301 | 8.0%), and Two or more Races (231 | 6.1%).
| Race | # Population | % Population |
| Asian | 35 | 0.9% |
| Black / African American | 9 | 0.2% |
| Hawaiian / Pacific | 0 | 0.0% |
| Hispanic or Latino | 301 | 8.0% |
| Native / Alaskan | 66 | 1.8% |
| White / Caucasian | 3,349 | 89.2% |
| Two or more Races | 231 | 6.1% |
| Some other Race | 65 | 1.7% |
| Total | 3,755 | 100.0% |
Ancestry in Ellis County
The most populous ancestries reported in Ellis County are German (837 | 22.3%), Irish (586 | 15.6%), English (329 | 8.8%), Mexican (212 | 5.7%), and American (154 | 4.1%), together accounting for 56.4% of all Ellis County residents.

| Ancestry | # Population | % Population |
| American | 154 | 4.1% |
| Australian | 11 | 0.3% |
| Blackfeet | 20 | 0.5% |
| Brazilian | 7 | 0.2% |
| British | 7 | 0.2% |
| Central American | 32 | 0.9% |
| Cherokee | 107 | 2.9% |
| Chickasaw | 3 | 0.1% |
| Choctaw | 24 | 0.6% |
| Colombian | 9 | 0.2% |
| Creek | 4 | 0.1% |
| Cuban | 24 | 0.6% |
| Czech | 8 | 0.2% |
| Dutch | 61 | 1.6% |
| Dutch West Indian | 16 | 0.4% |
| Eastern European | 4 | 0.1% |
| English | 329 | 8.8% |
| European | 23 | 0.6% |
| French | 35 | 0.9% |
| German | 837 | 22.3% |
| German Russian | 3 | 0.1% |
| Guatemalan | 20 | 0.5% |
| Irish | 586 | 15.6% |
| Italian | 70 | 1.9% |
| Korean | 17 | 0.4% |
| Mexican | 212 | 5.7% |
| Native Hawaiian | 12 | 0.3% |
| Norwegian | 22 | 0.6% |
| Pennsylvania German | 7 | 0.2% |
| Polish | 7 | 0.2% |
| Potawatomi | 8 | 0.2% |
| Puerto Rican | 14 | 0.4% |
| Russian | 18 | 0.5% |
| Salvadoran | 12 | 0.3% |
| Scandinavian | 6 | 0.2% |
| Scotch-Irish | 67 | 1.8% |
| Scottish | 78 | 2.1% |
| Sioux | 2 | 0.1% |
| South American | 9 | 0.2% |
| Spaniard | 2 | 0.1% |
| Swedish | 8 | 0.2% |
| Thai | 1 | 0.0% |
| Welsh | 50 | 1.3% | View All 43 Rows |
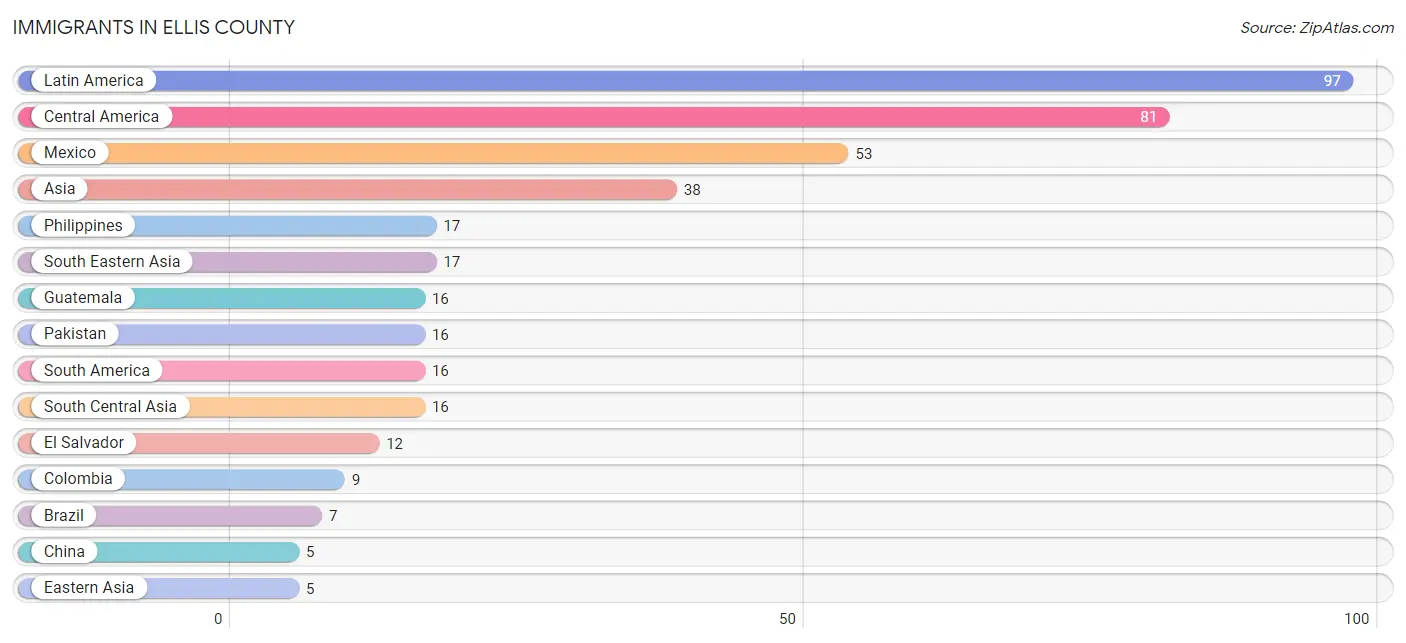
Immigrants in Ellis County
The most numerous immigrant groups reported in Ellis County came from Latin America (97 | 2.6%), Central America (81 | 2.2%), Mexico (53 | 1.4%), Asia (38 | 1.0%), and Philippines (17 | 0.4%), together accounting for 7.6% of all Ellis County residents.
| Immigration Origin | # Population | % Population |
| Asia | 38 | 1.0% |
| Brazil | 7 | 0.2% |
| Central America | 81 | 2.2% |
| China | 5 | 0.1% |
| Colombia | 9 | 0.2% |
| Eastern Asia | 5 | 0.1% |
| El Salvador | 12 | 0.3% |
| Europe | 4 | 0.1% |
| Germany | 4 | 0.1% |
| Guatemala | 16 | 0.4% |
| Hong Kong | 5 | 0.1% |
| Latin America | 97 | 2.6% |
| Mexico | 53 | 1.4% |
| Pakistan | 16 | 0.4% |
| Philippines | 17 | 0.4% |
| South America | 16 | 0.4% |
| South Central Asia | 16 | 0.4% |
| South Eastern Asia | 17 | 0.4% |
| Western Europe | 4 | 0.1% | View All 19 Rows |
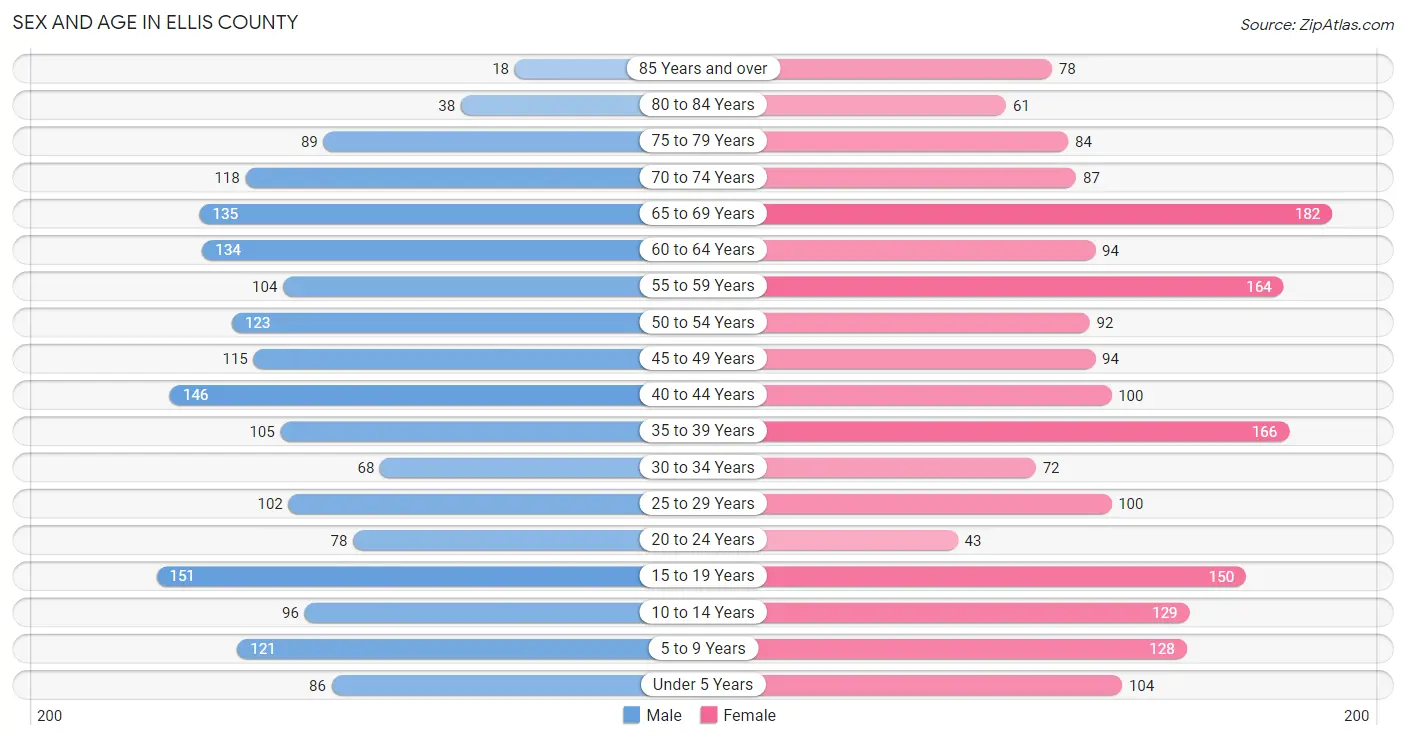
Sex and Age in Ellis County
Sex and Age in Ellis County
The most populous age groups in Ellis County are 15 to 19 Years (151 | 8.3%) for men and 65 to 69 Years (182 | 9.4%) for women.
| Age Bracket | Male | Female |
| Under 5 Years | 86 (4.7%) | 104 (5.4%) |
| 5 to 9 Years | 121 (6.6%) | 128 (6.6%) |
| 10 to 14 Years | 96 (5.2%) | 129 (6.7%) |
| 15 to 19 Years | 151 (8.3%) | 150 (7.8%) |
| 20 to 24 Years | 78 (4.3%) | 43 (2.2%) |
| 25 to 29 Years | 102 (5.6%) | 100 (5.2%) |
| 30 to 34 Years | 68 (3.7%) | 72 (3.7%) |
| 35 to 39 Years | 105 (5.8%) | 166 (8.6%) |
| 40 to 44 Years | 146 (8.0%) | 100 (5.2%) |
| 45 to 49 Years | 115 (6.3%) | 94 (4.9%) |
| 50 to 54 Years | 123 (6.7%) | 92 (4.8%) |
| 55 to 59 Years | 104 (5.7%) | 164 (8.5%) |
| 60 to 64 Years | 134 (7.3%) | 94 (4.9%) |
| 65 to 69 Years | 135 (7.4%) | 182 (9.4%) |
| 70 to 74 Years | 118 (6.5%) | 87 (4.5%) |
| 75 to 79 Years | 89 (4.9%) | 84 (4.4%) |
| 80 to 84 Years | 38 (2.1%) | 61 (3.2%) |
| 85 Years and over | 18 (1.0%) | 78 (4.1%) |
| Total | 1,827 (100.0%) | 1,928 (100.0%) |
Families and Households in Ellis County
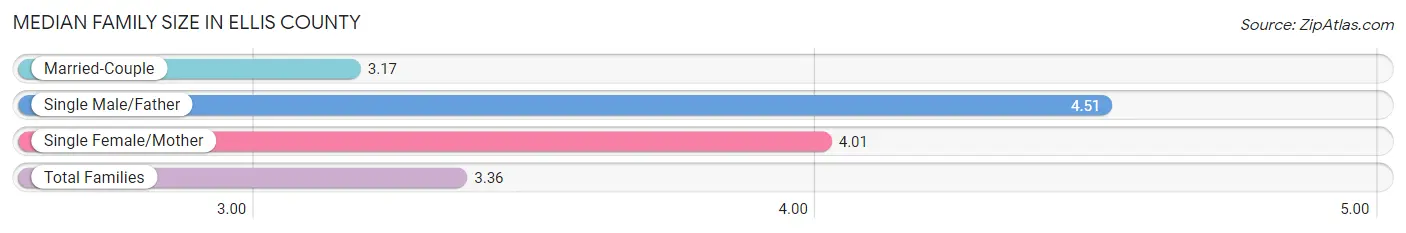
Median Family Size in Ellis County
The median family size in Ellis County is 3.36 persons per family, with single male/father families (65 | 7.2%) accounting for the largest median family size of 4.51 persons per family. On the other hand, married-couple families (739 | 81.7%) represent the smallest median family size with 3.17 persons per family.
| Family Type | # Families | Family Size |
| Married-Couple | 739 (81.7%) | 3.17 |
| Single Male/Father | 65 (7.2%) | 4.51 |
| Single Female/Mother | 101 (11.2%) | 4.01 |
| Total Families | 905 (100.0%) | 3.36 |
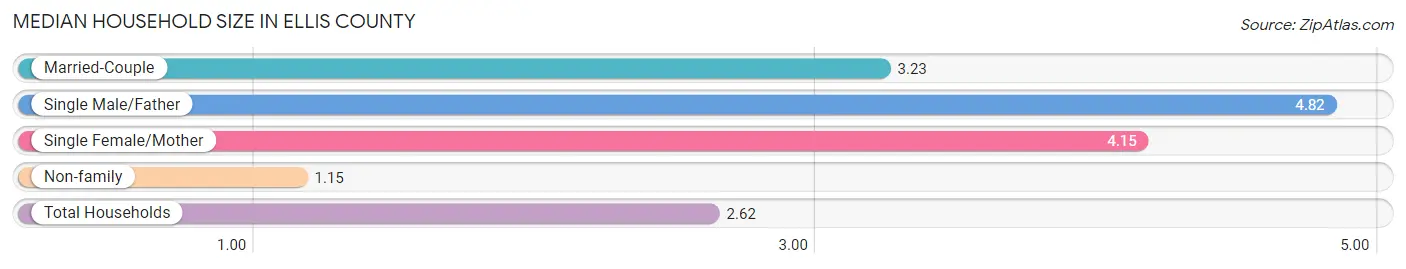
Median Household Size in Ellis County
The median household size in Ellis County is 2.62 persons per household, with single male/father households (65 | 4.6%) accounting for the largest median household size of 4.82 persons per household. non-family households (507 | 35.9%) represent the smallest median household size with 1.15 persons per household.
| Household Type | # Households | Household Size |
| Married-Couple | 739 (52.3%) | 3.23 |
| Single Male/Father | 65 (4.6%) | 4.82 |
| Single Female/Mother | 101 (7.1%) | 4.15 |
| Non-family | 507 (35.9%) | 1.15 |
| Total Households | 1,412 (100.0%) | 2.62 |
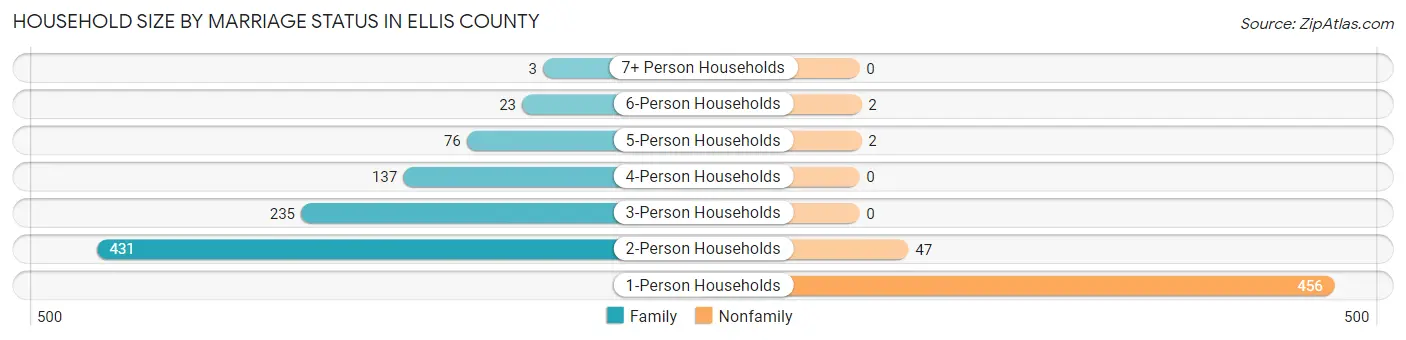
Household Size by Marriage Status in Ellis County
Out of a total of 1,412 households in Ellis County, 905 (64.1%) are family households, while 507 (35.9%) are nonfamily households. The most numerous type of family households are 2-person households, comprising 431, and the most common type of nonfamily households are 1-person households, comprising 456.
| Household Size | Family Households | Nonfamily Households |
| 1-Person Households | - | 456 (32.3%) |
| 2-Person Households | 431 (30.5%) | 47 (3.3%) |
| 3-Person Households | 235 (16.6%) | 0 (0.0%) |
| 4-Person Households | 137 (9.7%) | 0 (0.0%) |
| 5-Person Households | 76 (5.4%) | 2 (0.1%) |
| 6-Person Households | 23 (1.6%) | 2 (0.1%) |
| 7+ Person Households | 3 (0.2%) | 0 (0.0%) |
| Total | 905 (64.1%) | 507 (35.9%) |
Female Fertility in Ellis County
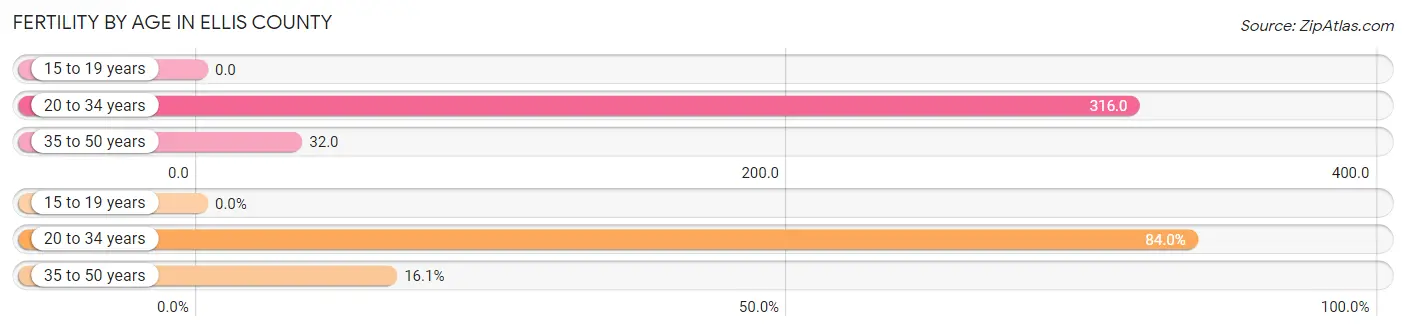
Fertility by Age in Ellis County
Average fertility rate in Ellis County is 105.0 births per 1,000 women. Women in the age bracket of 20 to 34 years have the highest fertility rate with 316.0 births per 1,000 women. Women in the age bracket of 20 to 34 years acount for 84.0% of all women with births.
| Age Bracket | Women with Births | Births / 1,000 Women |
| 15 to 19 years | 0 (0.0%) | 0.0 |
| 20 to 34 years | 68 (84.0%) | 316.0 |
| 35 to 50 years | 13 (16.1%) | 32.0 |
| Total | 81 (100.0%) | 105.0 |
Fertility by Age by Marriage Status in Ellis County
98.8% of women with births (81) in Ellis County are married. The highest percentage of unmarried women with births falls into 20 to 34 years age bracket with 1.5% of them unmarried at the time of birth, while the lowest percentage of unmarried women with births belong to 35 to 50 years age bracket with 0.0% of them unmarried.
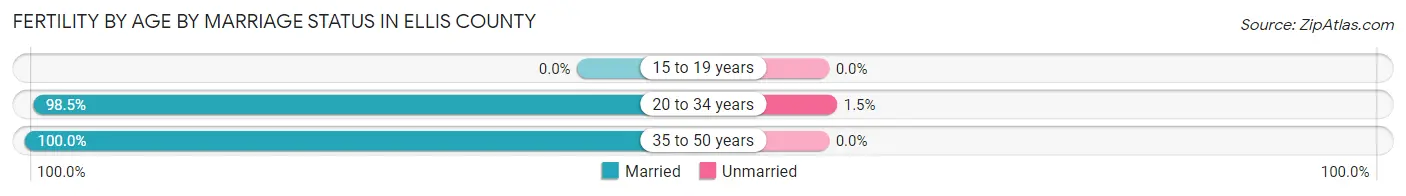
| Age Bracket | Married | Unmarried |
| 15 to 19 years | 0 (0.0%) | 0 (0.0%) |
| 20 to 34 years | 67 (98.5%) | 1 (1.5%) |
| 35 to 50 years | 13 (100.0%) | 0 (0.0%) |
| Total | 80 (98.8%) | 1 (1.2%) |
Fertility by Education in Ellis County
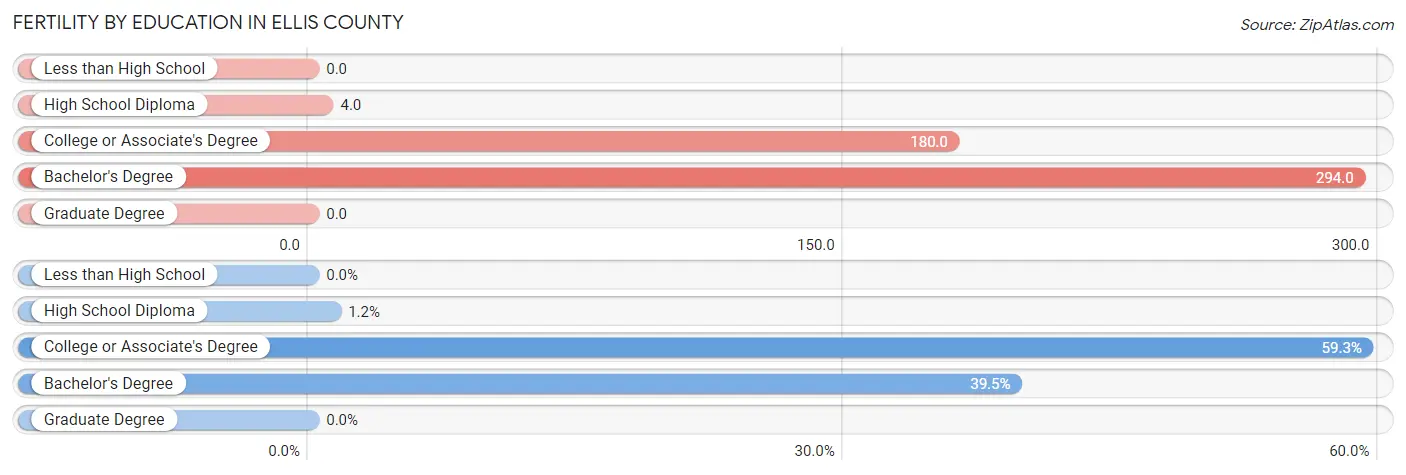
| Educational Attainment | Women with Births | Births / 1,000 Women |
| Less than High School | 0 (0.0%) | 0.0 |
| High School Diploma | 1 (1.2%) | 4.0 |
| College or Associate's Degree | 48 (59.3%) | 180.0 |
| Bachelor's Degree | 32 (39.5%) | 294.0 |
| Graduate Degree | 0 (0.0%) | 0.0 |
| Total | 81 (100.0%) | 105.0 |
Fertility by Education by Marriage Status in Ellis County
1.2% of women with births in Ellis County are unmarried. Women with the educational attainment of college or associate's degree are most likely to be married with 100.0% of them married at childbirth, while women with the educational attainment of high school diploma are least likely to be married with 100.0% of them unmarried at childbirth.
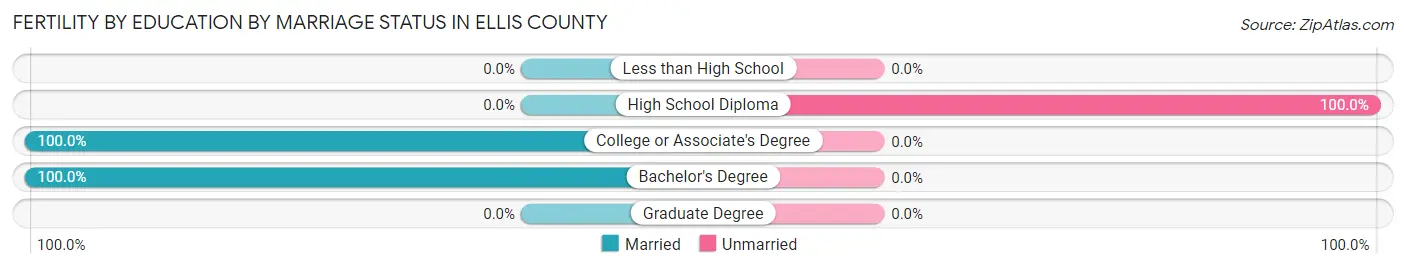
| Educational Attainment | Married | Unmarried |
| Less than High School | 0 (0.0%) | 0 (0.0%) |
| High School Diploma | 0 (0.0%) | 1 (100.0%) |
| College or Associate's Degree | 48 (100.0%) | 0 (0.0%) |
| Bachelor's Degree | 32 (100.0%) | 0 (0.0%) |
| Graduate Degree | 0 (0.0%) | 0 (0.0%) |
| Total | 80 (98.8%) | 1 (1.2%) |
Income in Ellis County
Income Overview in Ellis County
Per Capita Income in Ellis County is $31,331, while median incomes of families and households are $74,375 and $57,768 respectively.
| Characteristic | Number | Measure |
| Per Capita Income | 3,755 | $31,331 |
| Median Family Income | 905 | $74,375 |
| Mean Family Income | 905 | $89,803 |
| Median Household Income | 1,412 | $57,768 |
| Mean Household Income | 1,412 | $75,553 |
| Income Deficit | 905 | $8,436 |
| Wage / Income Gap (%) | 3,755 | 29.61% |
| Wage / Income Gap ($) | 3,755 | 70.39¢ per $1 |
| Gini / Inequality Index | 3,755 | 0.44 |
Earnings by Sex in Ellis County
Average Earnings in Ellis County are $31,581, $37,109 for men and $26,121 for women, a difference of 29.6%.
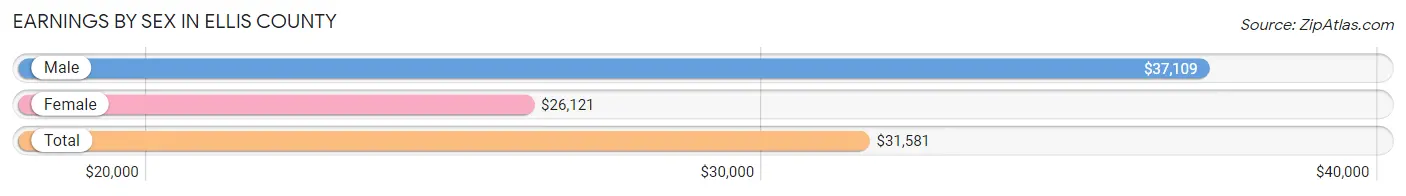
| Sex | Number | Average Earnings |
| Male | 1,017 (53.2%) | $37,109 |
| Female | 896 (46.8%) | $26,121 |
| Total | 1,913 (100.0%) | $31,581 |
Earnings by Sex by Income Bracket in Ellis County
The most common earnings brackets in Ellis County are $100,000+ for men (116 | 11.4%) and $2,499 or less for women (126 | 14.1%).
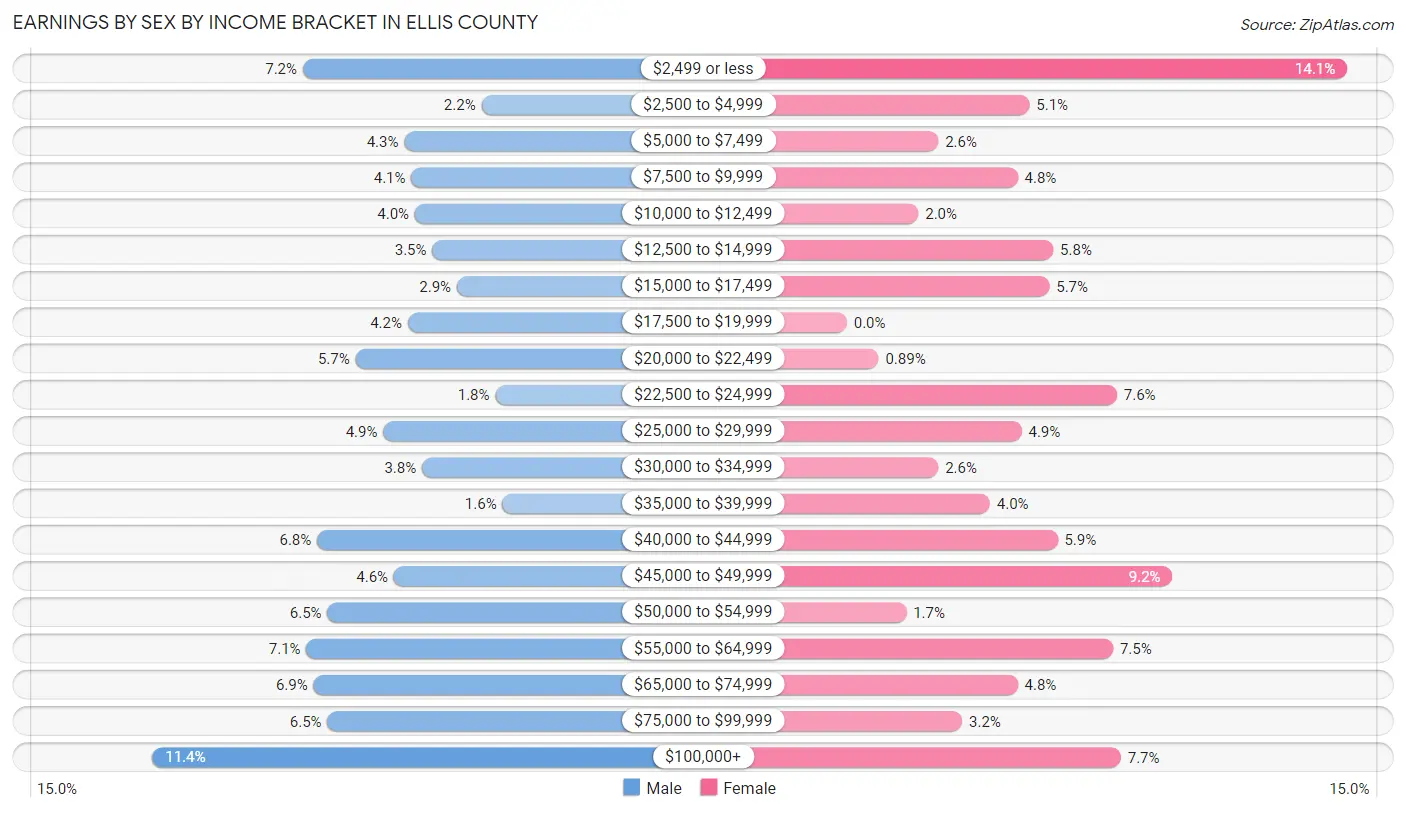
| Income | Male | Female |
| $2,499 or less | 73 (7.2%) | 126 (14.1%) |
| $2,500 to $4,999 | 22 (2.2%) | 46 (5.1%) |
| $5,000 to $7,499 | 44 (4.3%) | 23 (2.6%) |
| $7,500 to $9,999 | 42 (4.1%) | 43 (4.8%) |
| $10,000 to $12,499 | 41 (4.0%) | 18 (2.0%) |
| $12,500 to $14,999 | 36 (3.5%) | 52 (5.8%) |
| $15,000 to $17,499 | 29 (2.9%) | 51 (5.7%) |
| $17,500 to $19,999 | 43 (4.2%) | 0 (0.0%) |
| $20,000 to $22,499 | 58 (5.7%) | 8 (0.9%) |
| $22,500 to $24,999 | 18 (1.8%) | 68 (7.6%) |
| $25,000 to $29,999 | 50 (4.9%) | 44 (4.9%) |
| $30,000 to $34,999 | 39 (3.8%) | 23 (2.6%) |
| $35,000 to $39,999 | 16 (1.6%) | 36 (4.0%) |
| $40,000 to $44,999 | 69 (6.8%) | 53 (5.9%) |
| $45,000 to $49,999 | 47 (4.6%) | 82 (9.1%) |
| $50,000 to $54,999 | 66 (6.5%) | 15 (1.7%) |
| $55,000 to $64,999 | 72 (7.1%) | 67 (7.5%) |
| $65,000 to $74,999 | 70 (6.9%) | 43 (4.8%) |
| $75,000 to $99,999 | 66 (6.5%) | 29 (3.2%) |
| $100,000+ | 116 (11.4%) | 69 (7.7%) |
| Total | 1,017 (100.0%) | 896 (100.0%) |
Earnings by Sex by Educational Attainment in Ellis County
Average earnings in Ellis County are $43,606 for men and $29,583 for women, a difference of 32.2%. Men with an educational attainment of college or associate's degree enjoy the highest average annual earnings of $52,125, while those with less than high school education earn the least with $25,833. Women with an educational attainment of college or associate's degree earn the most with the average annual earnings of $46,458, while those with less than high school education have the smallest earnings of $8,889.

| Educational Attainment | Male Income | Female Income |
| Less than High School | $25,833 | $8,889 |
| High School Diploma | $40,893 | $15,909 |
| College or Associate's Degree | $52,125 | $46,458 |
| Bachelor's Degree | $50,625 | $41,250 |
| Graduate Degree | $43,571 | $41,667 |
| Total | $43,606 | $29,583 |
Family Income in Ellis County
Family Income Brackets in Ellis County
According to the Ellis County family income data, there are 202 families falling into the $50,000 to $74,999 income range, which is the most common income bracket and makes up 22.3% of all families. Conversely, the $10,000 to $14,999 income bracket is the least frequent group with only 19 families (2.1%) belonging to this category.
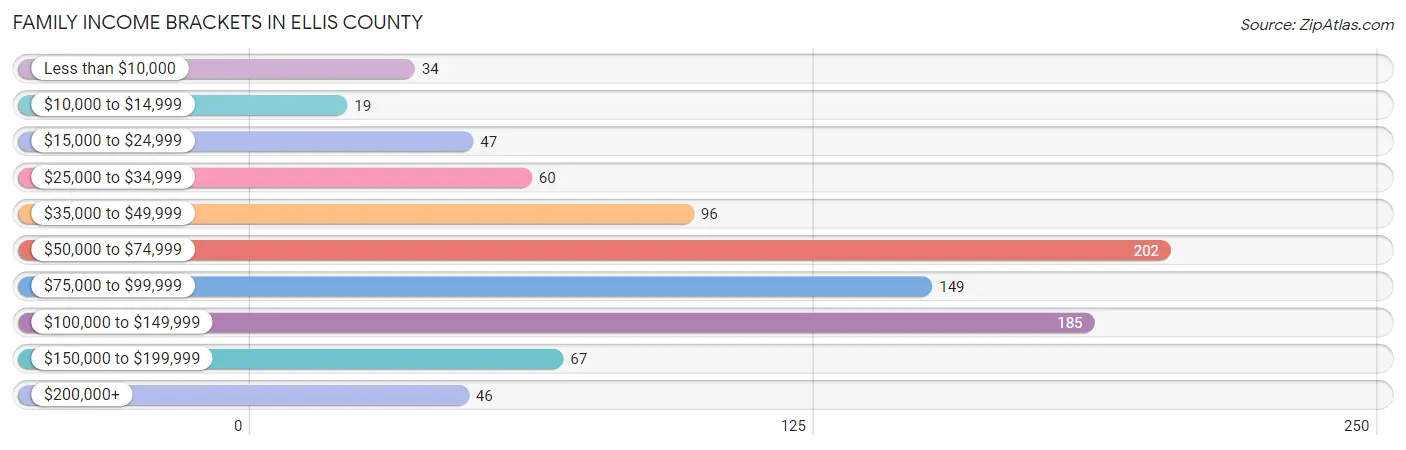
| Income Bracket | # Families | % Families |
| Less than $10,000 | 34 | 3.8% |
| $10,000 to $14,999 | 19 | 2.1% |
| $15,000 to $24,999 | 47 | 5.2% |
| $25,000 to $34,999 | 60 | 6.6% |
| $35,000 to $49,999 | 96 | 10.6% |
| $50,000 to $74,999 | 202 | 22.3% |
| $75,000 to $99,999 | 149 | 16.5% |
| $100,000 to $149,999 | 185 | 20.4% |
| $150,000 to $199,999 | 67 | 7.4% |
| $200,000+ | 46 | 5.1% |
Family Income by Famaliy Size in Ellis County
4-person families (137 | 15.1%) account for the highest median family income in Ellis County with $109,750 per family, while 2-person families (472 | 52.1%) have the highest median income of $37,250 per family member.
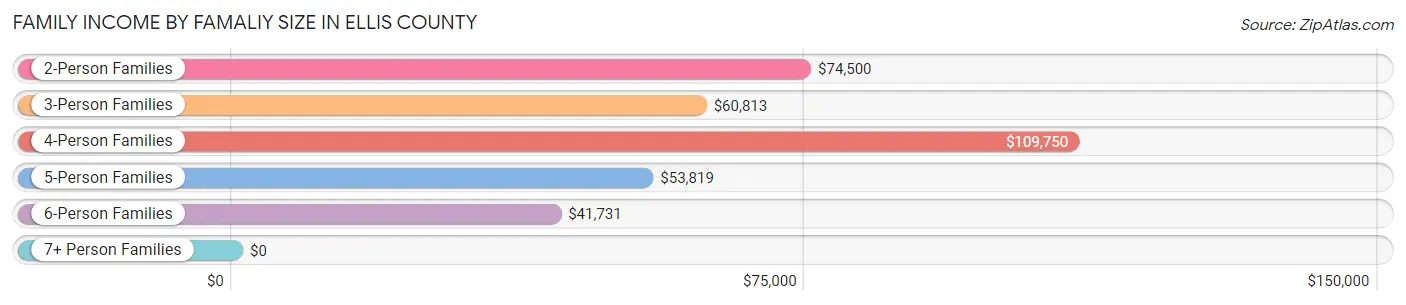
| Income Bracket | # Families | Median Income |
| 2-Person Families | 472 (52.1%) | $74,500 |
| 3-Person Families | 211 (23.3%) | $60,813 |
| 4-Person Families | 137 (15.1%) | $109,750 |
| 5-Person Families | 63 (7.0%) | $53,819 |
| 6-Person Families | 20 (2.2%) | $41,731 |
| 7+ Person Families | 2 (0.2%) | $0 |
| Total | 905 (100.0%) | $74,375 |
Family Income by Number of Earners in Ellis County
The median family income in Ellis County is $74,375, with families comprising 3+ earners (79) having the highest median family income of $131,023, while families with no earners (130) have the lowest median family income of $48,750, accounting for 8.7% and 14.4% of families, respectively.
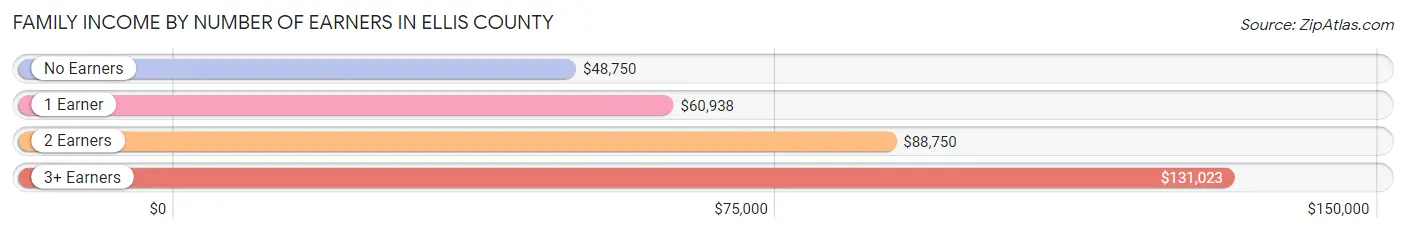
| Number of Earners | # Families | Median Income |
| No Earners | 130 (14.4%) | $48,750 |
| 1 Earner | 366 (40.4%) | $60,938 |
| 2 Earners | 330 (36.5%) | $88,750 |
| 3+ Earners | 79 (8.7%) | $131,023 |
| Total | 905 (100.0%) | $74,375 |
Household Income in Ellis County
Household Income Brackets in Ellis County
With 251 households falling in the category, the $50,000 to $74,999 income range is the most frequent in Ellis County, accounting for 17.8% of all households. In contrast, only 55 households (3.9%) fall into the $10,000 to $14,999 income bracket, making it the least populous group.
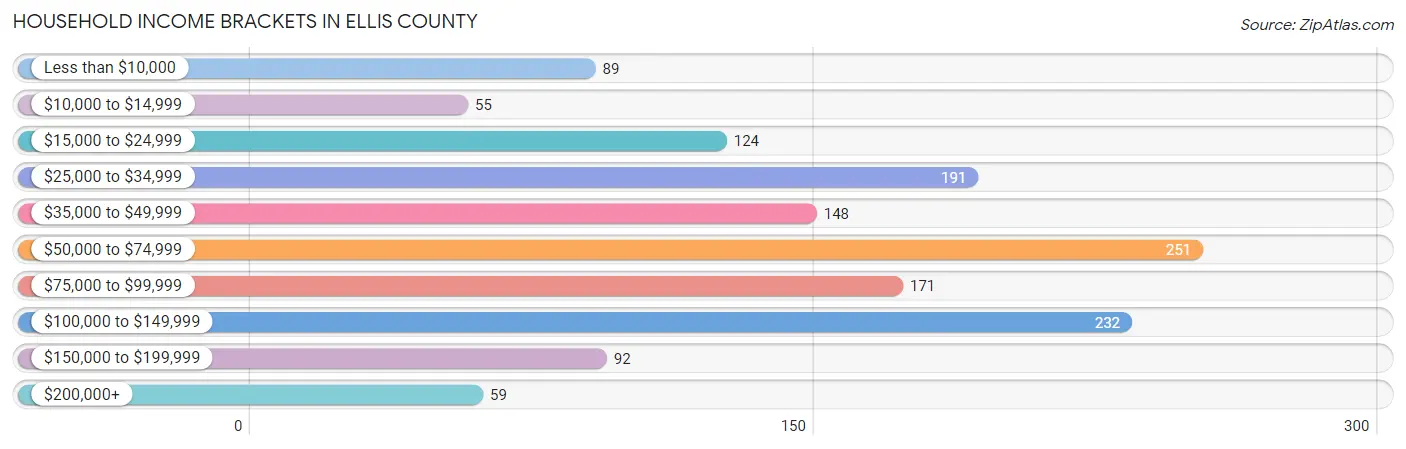
| Income Bracket | # Households | % Households |
| Less than $10,000 | 89 | 6.3% |
| $10,000 to $14,999 | 55 | 3.9% |
| $15,000 to $24,999 | 124 | 8.8% |
| $25,000 to $34,999 | 191 | 13.5% |
| $35,000 to $49,999 | 148 | 10.5% |
| $50,000 to $74,999 | 251 | 17.8% |
| $75,000 to $99,999 | 171 | 12.1% |
| $100,000 to $149,999 | 232 | 16.4% |
| $150,000 to $199,999 | 92 | 6.5% |
| $200,000+ | 59 | 4.2% |
Household Income by Householder Age in Ellis County
The median household income in Ellis County is $57,768, with the highest median household income of $72,679 found in the 25 to 44 years age bracket for the primary householder. A total of 339 households (24.0%) fall into this category. Meanwhile, the 65+ years age bracket for the primary householder has the lowest median household income of $42,857, with 546 households (38.7%) in this group.
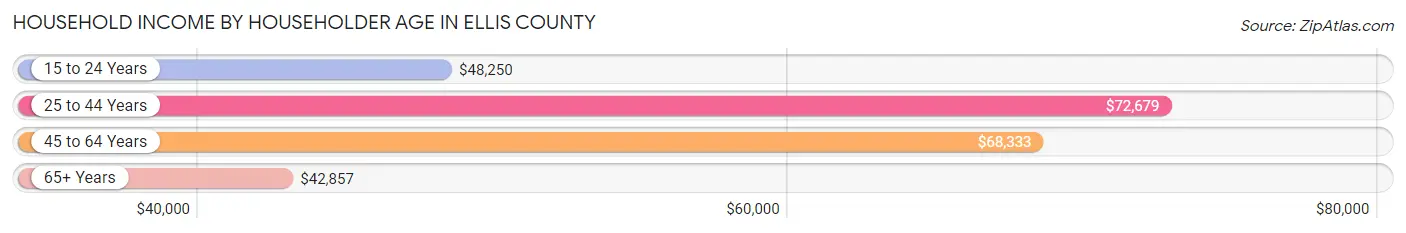
| Income Bracket | # Households | Median Income |
| 15 to 24 Years | 27 (1.9%) | $48,250 |
| 25 to 44 Years | 339 (24.0%) | $72,679 |
| 45 to 64 Years | 500 (35.4%) | $68,333 |
| 65+ Years | 546 (38.7%) | $42,857 |
| Total | 1,412 (100.0%) | $57,768 |
Poverty in Ellis County
Income Below Poverty by Sex and Age in Ellis County
With 13.6% poverty level for males and 15.7% for females among the residents of Ellis County, 16 and 17 year old males and 16 and 17 year old females are the most vulnerable to poverty, with 14 males (25.0%) and 21 females (29.6%) in their respective age groups living below the poverty level.
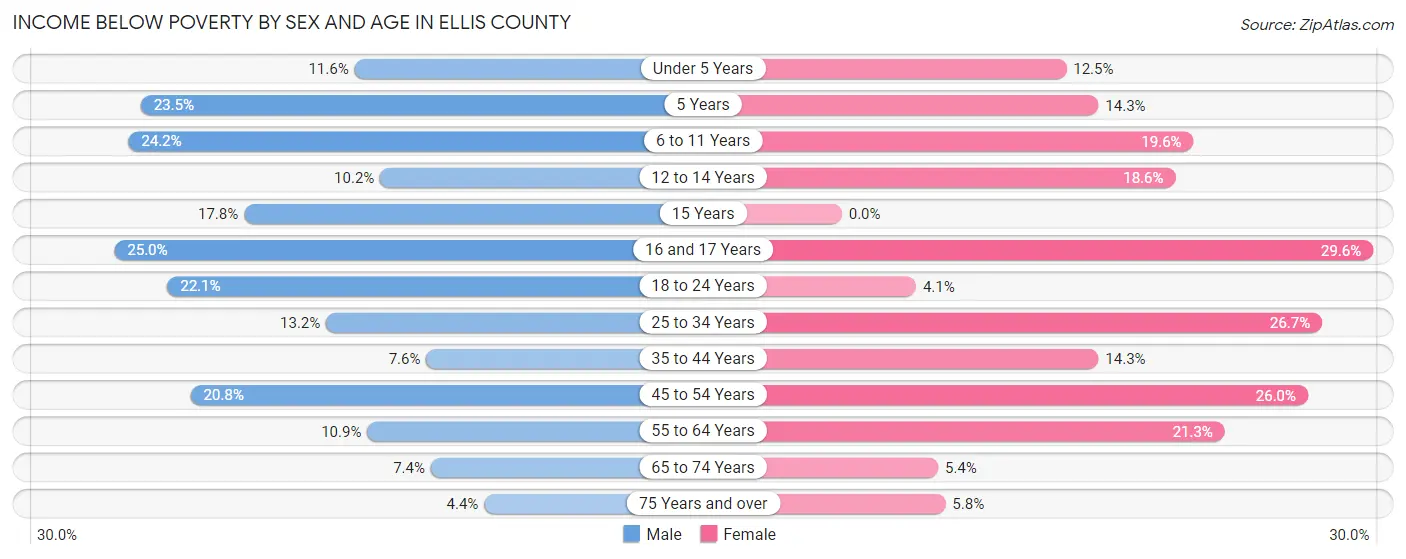
| Age Bracket | Male | Female |
| Under 5 Years | 10 (11.6%) | 13 (12.5%) |
| 5 Years | 8 (23.5%) | 5 (14.3%) |
| 6 to 11 Years | 31 (24.2%) | 28 (19.6%) |
| 12 to 14 Years | 5 (10.2%) | 13 (18.6%) |
| 15 Years | 8 (17.8%) | 0 (0.0%) |
| 16 and 17 Years | 14 (25.0%) | 21 (29.6%) |
| 18 to 24 Years | 28 (22.1%) | 5 (4.1%) |
| 25 to 34 Years | 21 (13.2%) | 46 (26.7%) |
| 35 to 44 Years | 19 (7.6%) | 38 (14.3%) |
| 45 to 54 Years | 49 (20.8%) | 48 (26.0%) |
| 55 to 64 Years | 26 (10.9%) | 55 (21.3%) |
| 65 to 74 Years | 18 (7.4%) | 14 (5.4%) |
| 75 Years and over | 6 (4.4%) | 12 (5.8%) |
| Total | 243 (13.6%) | 298 (15.7%) |
Income Above Poverty by Sex and Age in Ellis County
According to the poverty statistics in Ellis County, males aged 75 years and over and females aged 15 years are the age groups that are most secure financially, with 95.6% of males and 100.0% of females in these age groups living above the poverty line.
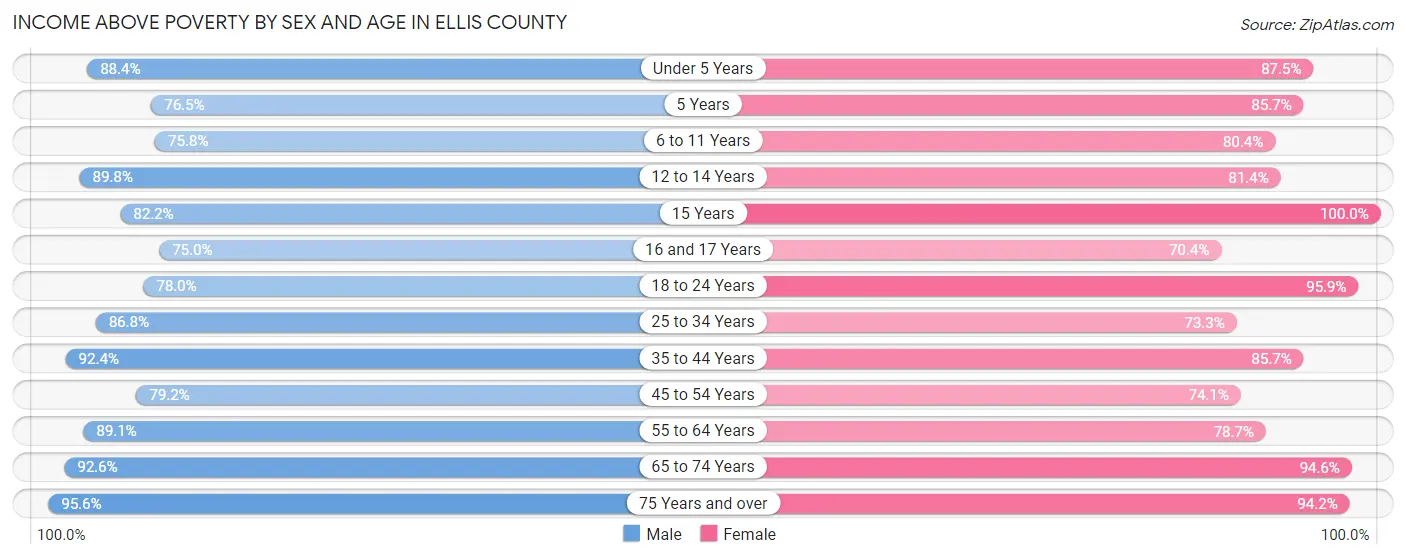
| Age Bracket | Male | Female |
| Under 5 Years | 76 (88.4%) | 91 (87.5%) |
| 5 Years | 26 (76.5%) | 30 (85.7%) |
| 6 to 11 Years | 97 (75.8%) | 115 (80.4%) |
| 12 to 14 Years | 44 (89.8%) | 57 (81.4%) |
| 15 Years | 37 (82.2%) | 1 (100.0%) |
| 16 and 17 Years | 42 (75.0%) | 50 (70.4%) |
| 18 to 24 Years | 99 (77.9%) | 116 (95.9%) |
| 25 to 34 Years | 138 (86.8%) | 126 (73.3%) |
| 35 to 44 Years | 230 (92.4%) | 228 (85.7%) |
| 45 to 54 Years | 187 (79.2%) | 137 (74.1%) |
| 55 to 64 Years | 212 (89.1%) | 203 (78.7%) |
| 65 to 74 Years | 226 (92.6%) | 247 (94.6%) |
| 75 Years and over | 130 (95.6%) | 196 (94.2%) |
| Total | 1,544 (86.4%) | 1,597 (84.3%) |
Income Below Poverty Among Married-Couple Families in Ellis County
The poverty statistics for married-couple families in Ellis County show that 5.9% or 44 of the total 739 families live below the poverty line. Families with 5 or more children have the highest poverty rate of 50.0%, comprising of 1 families. On the other hand, families with no children have the lowest poverty rate of 2.9%, which includes 13 families.
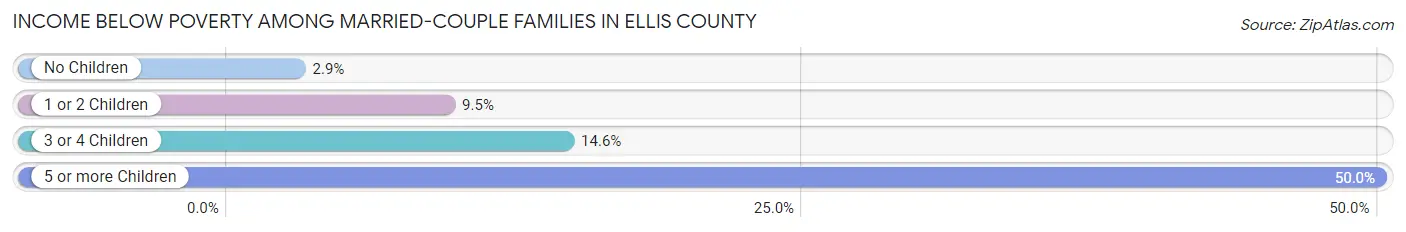
| Children | Above Poverty | Below Poverty |
| No Children | 429 (97.1%) | 13 (2.9%) |
| 1 or 2 Children | 230 (90.5%) | 24 (9.5%) |
| 3 or 4 Children | 35 (85.4%) | 6 (14.6%) |
| 5 or more Children | 1 (50.0%) | 1 (50.0%) |
| Total | 695 (94.1%) | 44 (5.9%) |
Income Below Poverty Among Single-Parent Households in Ellis County
According to the poverty data in Ellis County, 16.9% or 11 single-father households and 38.6% or 39 single-mother households are living below the poverty line. Among single-father households, those with 1 or 2 children have the highest poverty rate, with 9 households (23.7%) experiencing poverty. Likewise, among single-mother households, those with 5 or more children have the highest poverty rate, with 1 households (100.0%) falling below the poverty line.
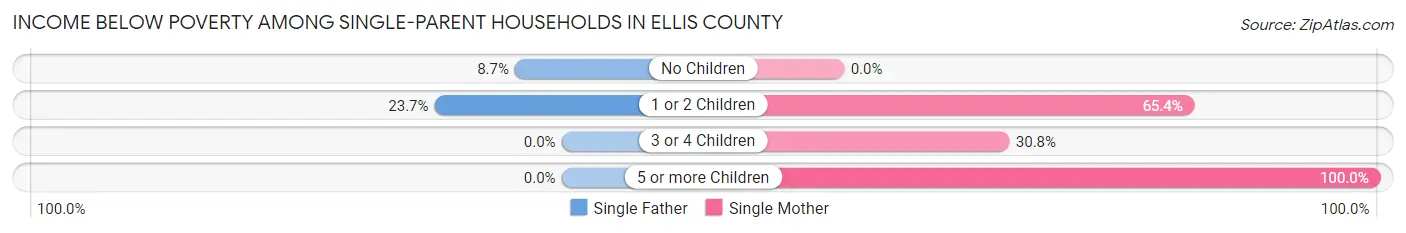
| Children | Single Father | Single Mother |
| No Children | 2 (8.7%) | 0 (0.0%) |
| 1 or 2 Children | 9 (23.7%) | 34 (65.4%) |
| 3 or 4 Children | 0 (0.0%) | 4 (30.8%) |
| 5 or more Children | 0 (0.0%) | 1 (100.0%) |
| Total | 11 (16.9%) | 39 (38.6%) |
Income Below Poverty Among Married-Couple vs Single-Parent Households in Ellis County
The poverty data for Ellis County shows that 44 of the married-couple family households (5.9%) and 50 of the single-parent households (30.1%) are living below the poverty level. Within the married-couple family households, those with 5 or more children have the highest poverty rate, with 1 households (50.0%) falling below the poverty line. Among the single-parent households, those with 5 or more children have the highest poverty rate, with 1 household (100.0%) living below poverty.
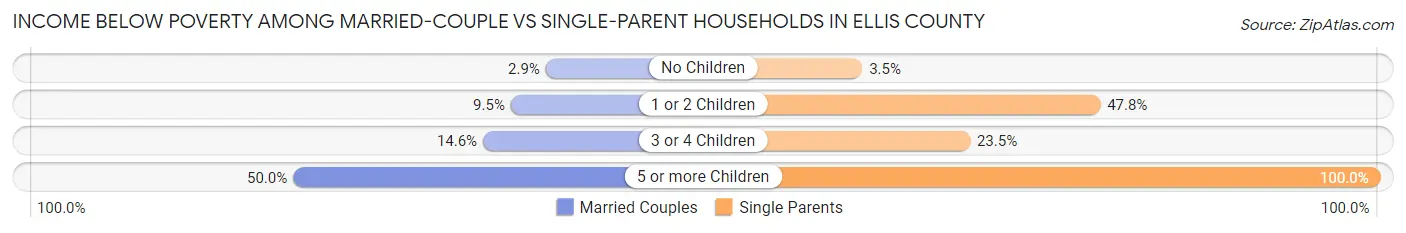
| Children | Married-Couple Families | Single-Parent Households |
| No Children | 13 (2.9%) | 2 (3.5%) |
| 1 or 2 Children | 24 (9.5%) | 43 (47.8%) |
| 3 or 4 Children | 6 (14.6%) | 4 (23.5%) |
| 5 or more Children | 1 (50.0%) | 1 (100.0%) |
| Total | 44 (5.9%) | 50 (30.1%) |
Employment Characteristics in Ellis County
Employment by Class of Employer in Ellis County
Among the 1,559 employed individuals in Ellis County, private company employees (811 | 52.0%), self-employed (not incorporated) (242 | 15.5%), and local government employees (188 | 12.1%) make up the most common classes of employment.
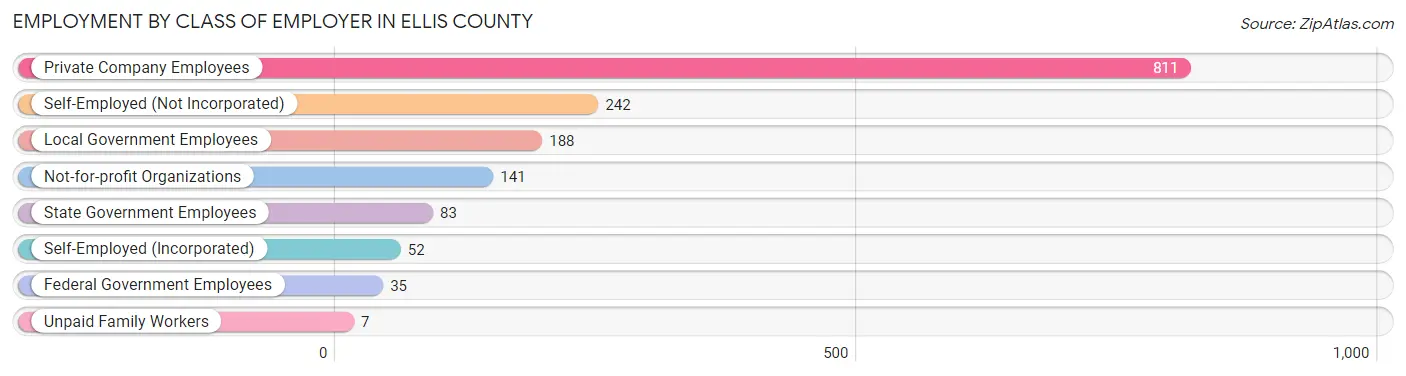
| Employer Class | # Employees | % Employees |
| Private Company Employees | 811 | 52.0% |
| Self-Employed (Incorporated) | 52 | 3.3% |
| Self-Employed (Not Incorporated) | 242 | 15.5% |
| Not-for-profit Organizations | 141 | 9.0% |
| Local Government Employees | 188 | 12.1% |
| State Government Employees | 83 | 5.3% |
| Federal Government Employees | 35 | 2.2% |
| Unpaid Family Workers | 7 | 0.4% |
| Total | 1,559 | 100.0% |
Employment Status by Age in Ellis County
According to the labor force statistics for Ellis County, out of the total population over 16 years of age (3,045), 57.1% or 1,739 individuals are in the labor force, with 8.8% or 153 of them unemployed. The age group with the highest labor force participation rate is 30 to 34 years, with 90.0% or 126 individuals in the labor force. Within the labor force, the 25 to 29 years age range has the highest percentage of unemployed individuals, with 29.9% or 41 of them being unemployed.

| Age Bracket | In Labor Force | Unemployed |
| 16 to 19 Years | 122 (47.8%) | 2 (1.6%) |
| 20 to 24 Years | 85 (70.2%) | 7 (8.2%) |
| 25 to 29 Years | 137 (67.8%) | 41 (29.9%) |
| 30 to 34 Years | 126 (90.0%) | 17 (13.5%) |
| 35 to 44 Years | 379 (73.3%) | 51 (13.5%) |
| 45 to 54 Years | 353 (83.3%) | 27 (7.6%) |
| 55 to 59 Years | 171 (63.8%) | 4 (2.3%) |
| 60 to 64 Years | 120 (52.6%) | 3 (2.5%) |
| 65 to 74 Years | 154 (29.5%) | 1 (0.6%) |
| 75 Years and over | 91 (24.7%) | 0 (0.0%) |
| Total | 1,739 (57.1%) | 153 (8.8%) |
Employment Status by Educational Attainment in Ellis County
According to labor force statistics for Ellis County, 72.3% of individuals (1,286) out of the total population between 25 and 64 years of age (1,779) are in the labor force, with 11.1% or 143 of them being unemployed. The group with the highest labor force participation rate are those with the educational attainment of bachelor's degree or higher, with 86.6% or 271 individuals in the labor force. Within the labor force, individuals with less than high school education have the highest percentage of unemployment, with 32.4% or 35 of them being unemployed.
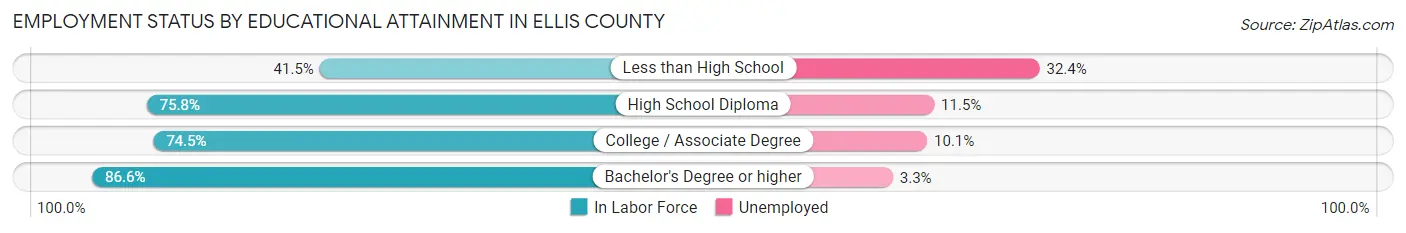
| Educational Attainment | In Labor Force | Unemployed |
| Less than High School | 108 (41.5%) | 84 (32.4%) |
| High School Diploma | 522 (75.8%) | 79 (11.5%) |
| College / Associate Degree | 385 (74.5%) | 52 (10.1%) |
| Bachelor's Degree or higher | 271 (86.6%) | 10 (3.3%) |
| Total | 1,286 (72.3%) | 197 (11.1%) |
Employment Occupations by Sex in Ellis County
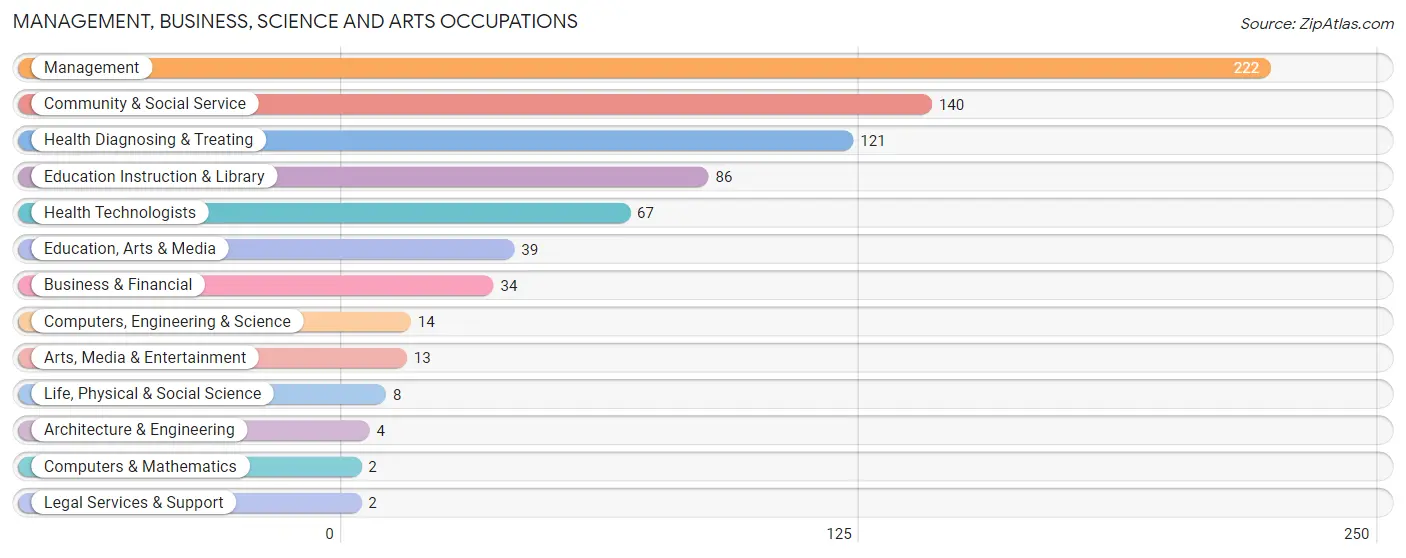
Management, Business, Science and Arts Occupations
The most common Management, Business, Science and Arts occupations in Ellis County are Management (222 | 14.0%), Community & Social Service (140 | 8.8%), Health Diagnosing & Treating (121 | 7.6%), Education Instruction & Library (86 | 5.4%), and Health Technologists (67 | 4.2%).
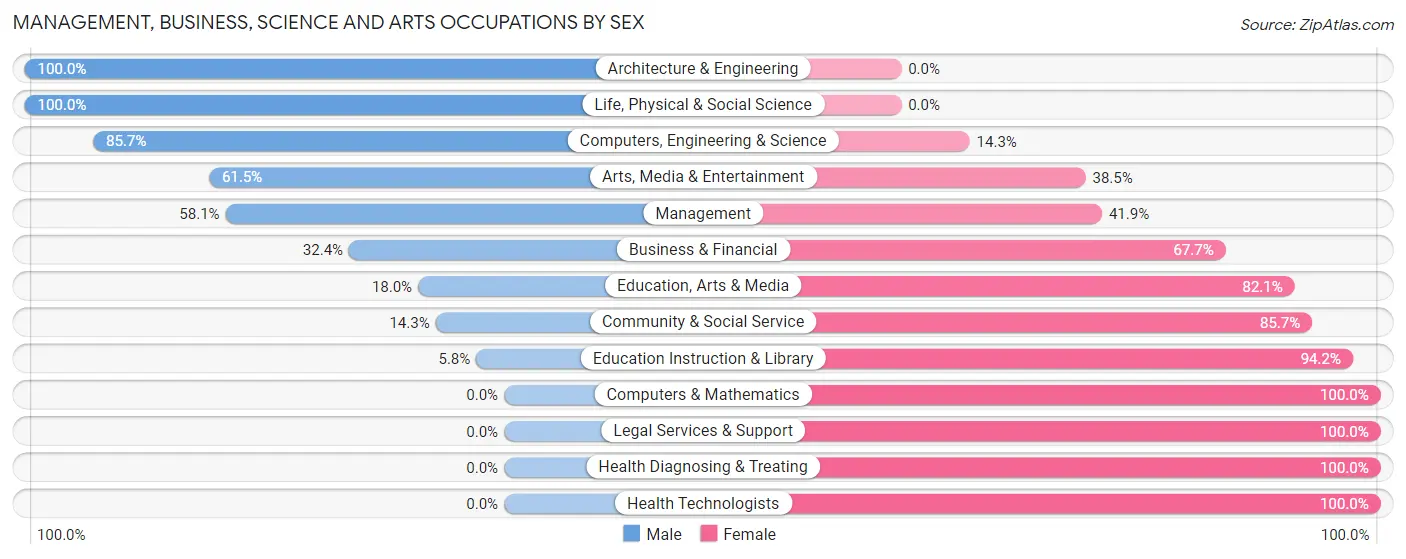
Management, Business, Science and Arts Occupations by Sex
Within the Management, Business, Science and Arts occupations in Ellis County, the most male-oriented occupations are Architecture & Engineering (100.0%), Life, Physical & Social Science (100.0%), and Computers, Engineering & Science (85.7%), while the most female-oriented occupations are Computers & Mathematics (100.0%), Legal Services & Support (100.0%), and Health Diagnosing & Treating (100.0%).
| Occupation | Male | Female |
| Management | 129 (58.1%) | 93 (41.9%) |
| Business & Financial | 11 (32.4%) | 23 (67.6%) |
| Computers, Engineering & Science | 12 (85.7%) | 2 (14.3%) |
| Computers & Mathematics | 0 (0.0%) | 2 (100.0%) |
| Architecture & Engineering | 4 (100.0%) | 0 (0.0%) |
| Life, Physical & Social Science | 8 (100.0%) | 0 (0.0%) |
| Community & Social Service | 20 (14.3%) | 120 (85.7%) |
| Education, Arts & Media | 7 (17.9%) | 32 (82.1%) |
| Legal Services & Support | 0 (0.0%) | 2 (100.0%) |
| Education Instruction & Library | 5 (5.8%) | 81 (94.2%) |
| Arts, Media & Entertainment | 8 (61.5%) | 5 (38.5%) |
| Health Diagnosing & Treating | 0 (0.0%) | 121 (100.0%) |
| Health Technologists | 0 (0.0%) | 67 (100.0%) |
| Total (Category) | 172 (32.4%) | 359 (67.6%) |
| Total (Overall) | 840 (53.0%) | 745 (47.0%) |
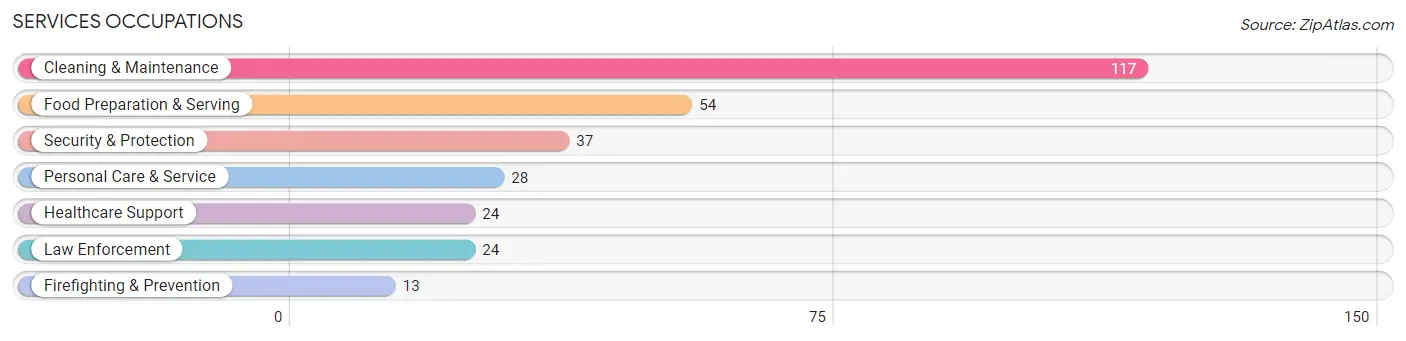
Services Occupations
The most common Services occupations in Ellis County are Cleaning & Maintenance (117 | 7.4%), Food Preparation & Serving (54 | 3.4%), Security & Protection (37 | 2.3%), Personal Care & Service (28 | 1.8%), and Healthcare Support (24 | 1.5%).
Services Occupations by Sex
Within the Services occupations in Ellis County, the most male-oriented occupations are Firefighting & Prevention (100.0%), Cleaning & Maintenance (72.7%), and Food Preparation & Serving (70.4%), while the most female-oriented occupations are Personal Care & Service (96.4%), Healthcare Support (70.8%), and Law Enforcement (54.2%).
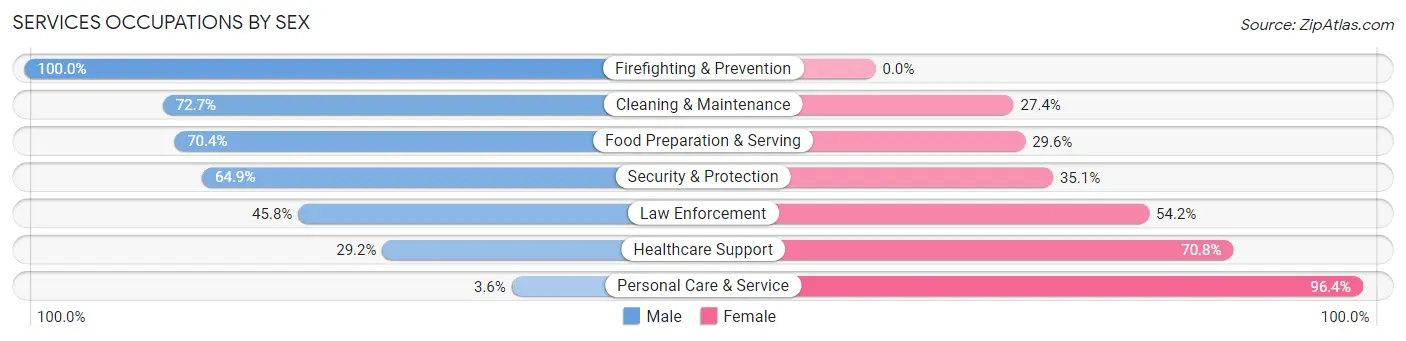
| Occupation | Male | Female |
| Healthcare Support | 7 (29.2%) | 17 (70.8%) |
| Security & Protection | 24 (64.9%) | 13 (35.1%) |
| Firefighting & Prevention | 13 (100.0%) | 0 (0.0%) |
| Law Enforcement | 11 (45.8%) | 13 (54.2%) |
| Food Preparation & Serving | 38 (70.4%) | 16 (29.6%) |
| Cleaning & Maintenance | 85 (72.7%) | 32 (27.4%) |
| Personal Care & Service | 1 (3.6%) | 27 (96.4%) |
| Total (Category) | 155 (59.6%) | 105 (40.4%) |
| Total (Overall) | 840 (53.0%) | 745 (47.0%) |
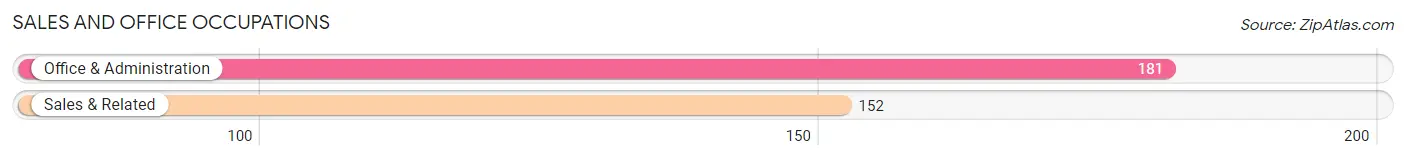
Sales and Office Occupations
The most common Sales and Office occupations in Ellis County are Office & Administration (181 | 11.4%), and Sales & Related (152 | 9.6%).
Sales and Office Occupations by Sex
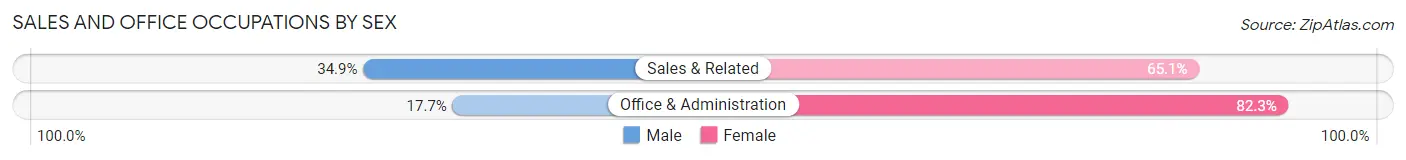
| Occupation | Male | Female |
| Sales & Related | 53 (34.9%) | 99 (65.1%) |
| Office & Administration | 32 (17.7%) | 149 (82.3%) |
| Total (Category) | 85 (25.5%) | 248 (74.5%) |
| Total (Overall) | 840 (53.0%) | 745 (47.0%) |
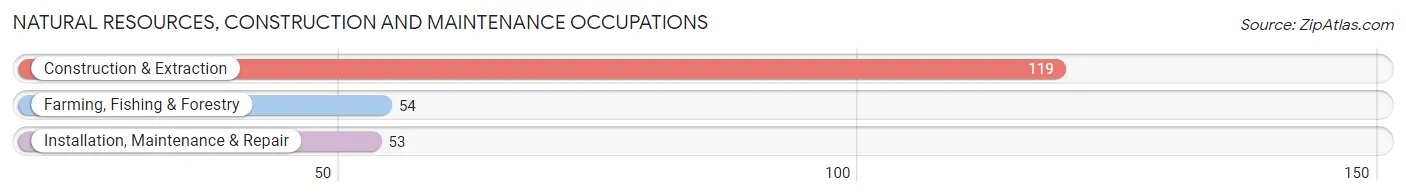
Natural Resources, Construction and Maintenance Occupations
The most common Natural Resources, Construction and Maintenance occupations in Ellis County are Construction & Extraction (119 | 7.5%), Farming, Fishing & Forestry (54 | 3.4%), and Installation, Maintenance & Repair (53 | 3.3%).
Natural Resources, Construction and Maintenance Occupations by Sex
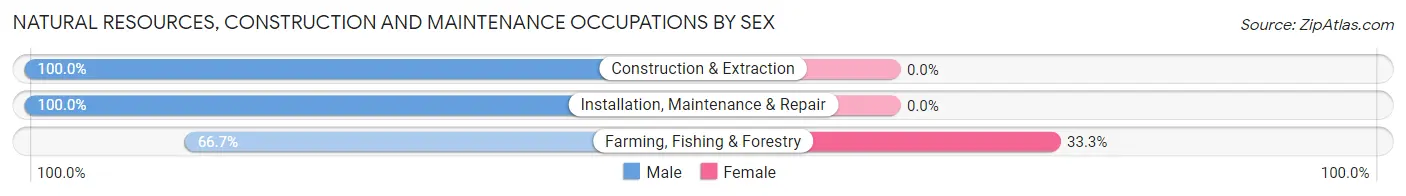
| Occupation | Male | Female |
| Farming, Fishing & Forestry | 36 (66.7%) | 18 (33.3%) |
| Construction & Extraction | 119 (100.0%) | 0 (0.0%) |
| Installation, Maintenance & Repair | 53 (100.0%) | 0 (0.0%) |
| Total (Category) | 208 (92.0%) | 18 (8.0%) |
| Total (Overall) | 840 (53.0%) | 745 (47.0%) |
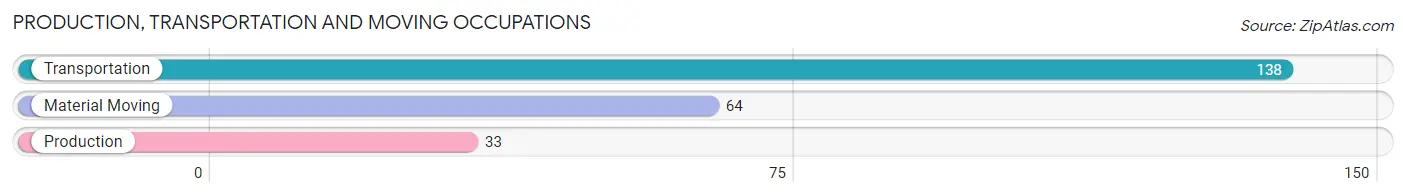
Production, Transportation and Moving Occupations
The most common Production, Transportation and Moving occupations in Ellis County are Transportation (138 | 8.7%), Material Moving (64 | 4.0%), and Production (33 | 2.1%).
Production, Transportation and Moving Occupations by Sex
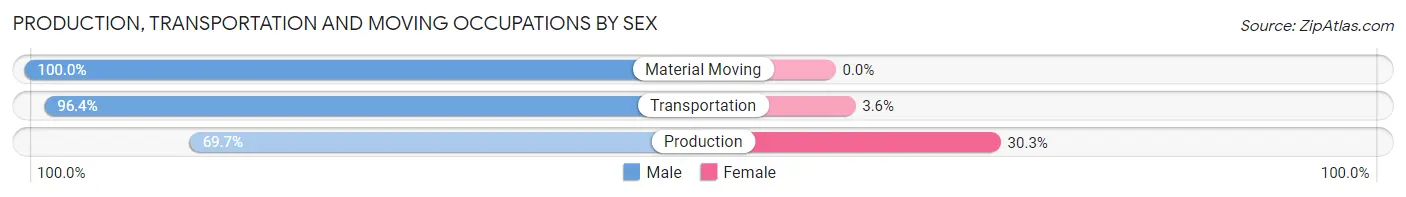
| Occupation | Male | Female |
| Production | 23 (69.7%) | 10 (30.3%) |
| Transportation | 133 (96.4%) | 5 (3.6%) |
| Material Moving | 64 (100.0%) | 0 (0.0%) |
| Total (Category) | 220 (93.6%) | 15 (6.4%) |
| Total (Overall) | 840 (53.0%) | 745 (47.0%) |
Employment Industries by Sex in Ellis County
Employment Industries in Ellis County
The major employment industries in Ellis County include Health Care & Social Assistance (203 | 12.8%), Agriculture, Fishing & Hunting (199 | 12.6%), Retail Trade (180 | 11.4%), Mining, Quarrying, & Extraction (149 | 9.4%), and Educational Services (133 | 8.4%).

Employment Industries by Sex in Ellis County
The Ellis County industries that see more men than women are Utilities (100.0%), Administrative & Support (100.0%), and Mining, Quarrying, & Extraction (96.6%), whereas the industries that tend to have a higher number of women are Health Care & Social Assistance (97.0%), Information (96.0%), and Educational Services (91.0%).
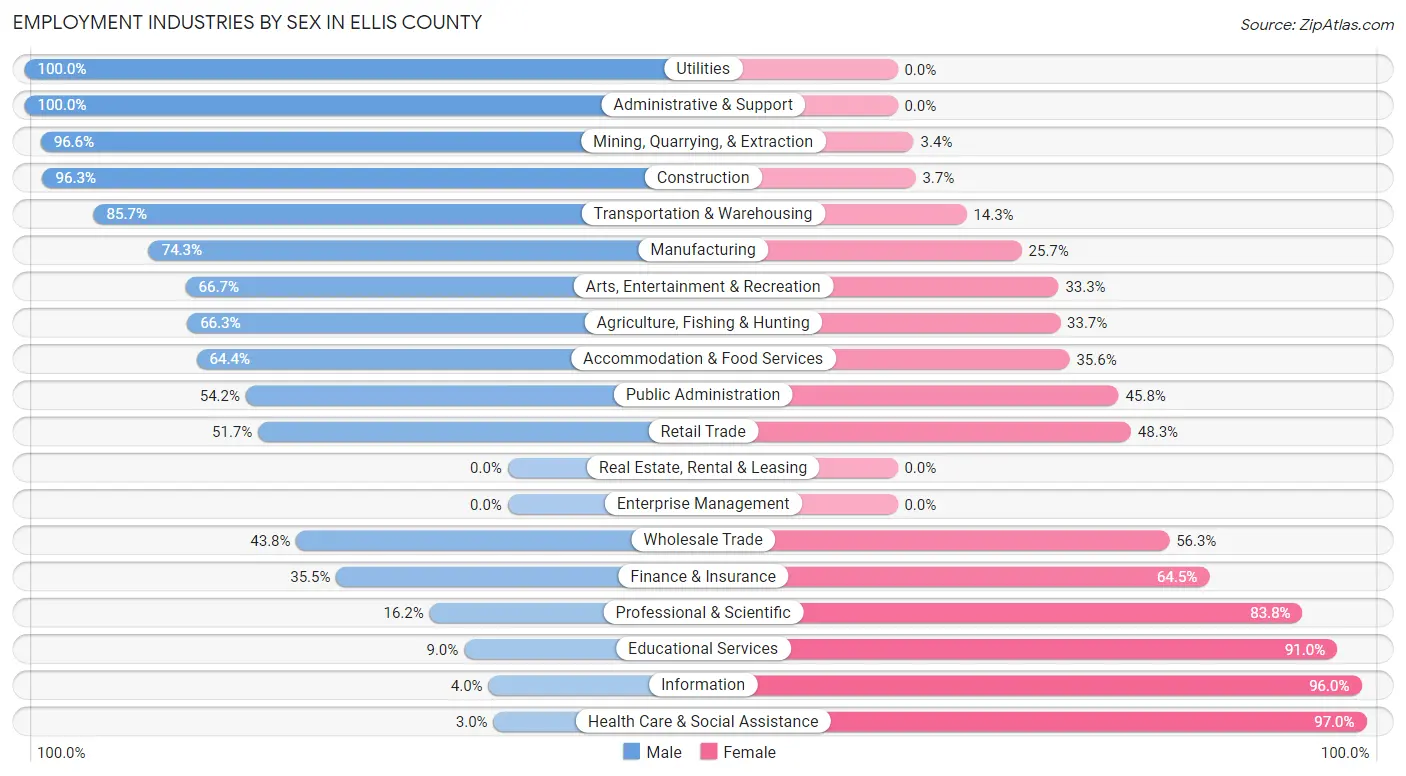
| Industry | Male | Female |
| Agriculture, Fishing & Hunting | 132 (66.3%) | 67 (33.7%) |
| Mining, Quarrying, & Extraction | 144 (96.6%) | 5 (3.4%) |
| Construction | 103 (96.3%) | 4 (3.7%) |
| Manufacturing | 26 (74.3%) | 9 (25.7%) |
| Wholesale Trade | 14 (43.8%) | 18 (56.2%) |
| Retail Trade | 93 (51.7%) | 87 (48.3%) |
| Transportation & Warehousing | 84 (85.7%) | 14 (14.3%) |
| Utilities | 14 (100.0%) | 0 (0.0%) |
| Information | 1 (4.0%) | 24 (96.0%) |
| Finance & Insurance | 11 (35.5%) | 20 (64.5%) |
| Real Estate, Rental & Leasing | 0 (0.0%) | 0 (0.0%) |
| Professional & Scientific | 11 (16.2%) | 57 (83.8%) |
| Enterprise Management | 0 (0.0%) | 0 (0.0%) |
| Administrative & Support | 24 (100.0%) | 0 (0.0%) |
| Educational Services | 12 (9.0%) | 121 (91.0%) |
| Health Care & Social Assistance | 6 (3.0%) | 197 (97.0%) |
| Arts, Entertainment & Recreation | 22 (66.7%) | 11 (33.3%) |
| Accommodation & Food Services | 47 (64.4%) | 26 (35.6%) |
| Public Administration | 58 (54.2%) | 49 (45.8%) |
| Total | 840 (53.0%) | 745 (47.0%) |
Education in Ellis County
School Enrollment in Ellis County
The most common levels of schooling among the 787 students in Ellis County are middle school (218 | 27.7%), high school (202 | 25.7%), and kindergarten (126 | 16.0%).
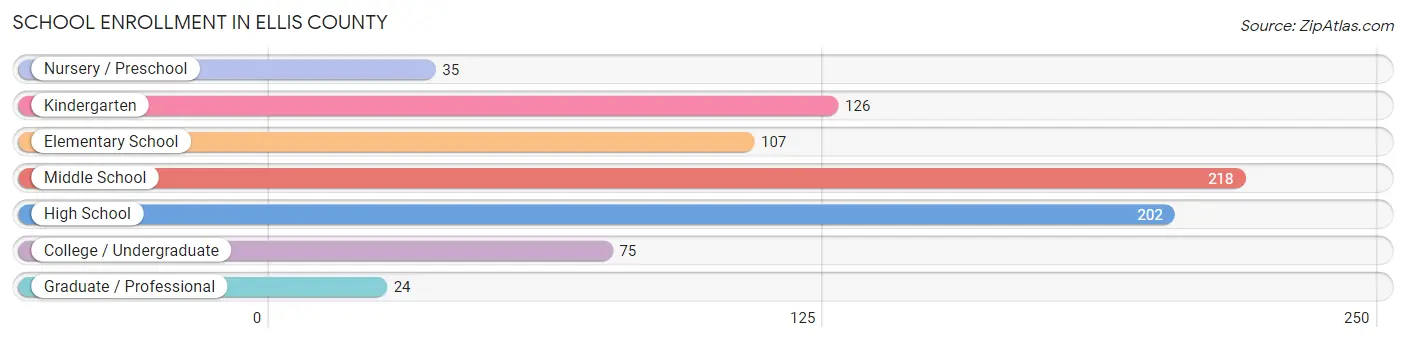
| School Level | # Students | % Students |
| Nursery / Preschool | 35 | 4.4% |
| Kindergarten | 126 | 16.0% |
| Elementary School | 107 | 13.6% |
| Middle School | 218 | 27.7% |
| High School | 202 | 25.7% |
| College / Undergraduate | 75 | 9.5% |
| Graduate / Professional | 24 | 3.0% |
| Total | 787 | 100.0% |
School Enrollment by Age by Funding Source in Ellis County
Out of a total of 787 students who are enrolled in schools in Ellis County, 40 (5.1%) attend a private institution, while the remaining 747 (94.9%) are enrolled in public schools. The age group of 25 to 34 year olds has the highest likelihood of being enrolled in private schools, with 3 (21.4% in the age bracket) enrolled. Conversely, the age group of 3 to 4 year olds has the lowest likelihood of being enrolled in a private school, with 15 (100.0% in the age bracket) attending a public institution.
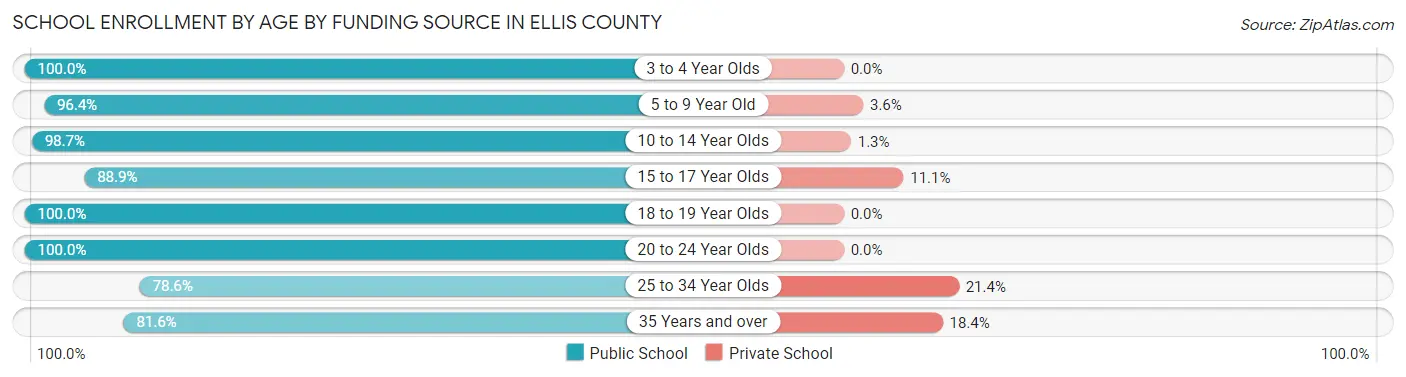
| Age Bracket | Public School | Private School |
| 3 to 4 Year Olds | 15 (100.0%) | 0 (0.0%) |
| 5 to 9 Year Old | 240 (96.4%) | 9 (3.6%) |
| 10 to 14 Year Olds | 222 (98.7%) | 3 (1.3%) |
| 15 to 17 Year Olds | 144 (88.9%) | 18 (11.1%) |
| 18 to 19 Year Olds | 78 (100.0%) | 0 (0.0%) |
| 20 to 24 Year Olds | 6 (100.0%) | 0 (0.0%) |
| 25 to 34 Year Olds | 11 (78.6%) | 3 (21.4%) |
| 35 Years and over | 31 (81.6%) | 7 (18.4%) |
| Total | 747 (94.9%) | 40 (5.1%) |
Educational Attainment by Field of Study in Ellis County
Education (146 | 24.3%), business (117 | 19.5%), bio, nature & agricultural (77 | 12.8%), science & technology (66 | 11.0%), and arts & humanities (38 | 6.3%) are the most common fields of study among 601 individuals in Ellis County who have obtained a bachelor's degree or higher.

| Field of Study | # Graduates | % Graduates |
| Computers & Mathematics | 4 | 0.7% |
| Bio, Nature & Agricultural | 77 | 12.8% |
| Physical & Health Sciences | 11 | 1.8% |
| Psychology | 16 | 2.7% |
| Social Sciences | 13 | 2.2% |
| Engineering | 14 | 2.3% |
| Multidisciplinary Studies | 0 | 0.0% |
| Science & Technology | 66 | 11.0% |
| Business | 117 | 19.5% |
| Education | 146 | 24.3% |
| Literature & Languages | 26 | 4.3% |
| Liberal Arts & History | 34 | 5.7% |
| Visual & Performing Arts | 29 | 4.8% |
| Communications | 10 | 1.7% |
| Arts & Humanities | 38 | 6.3% |
| Total | 601 | 100.0% |
Transportation & Commute in Ellis County
Vehicle Availability by Sex in Ellis County
The most prevalent vehicle ownership categories in Ellis County are males with 2 vehicles (327, accounting for 39.9%) and females with 2 vehicles (200, making up 44.2%).
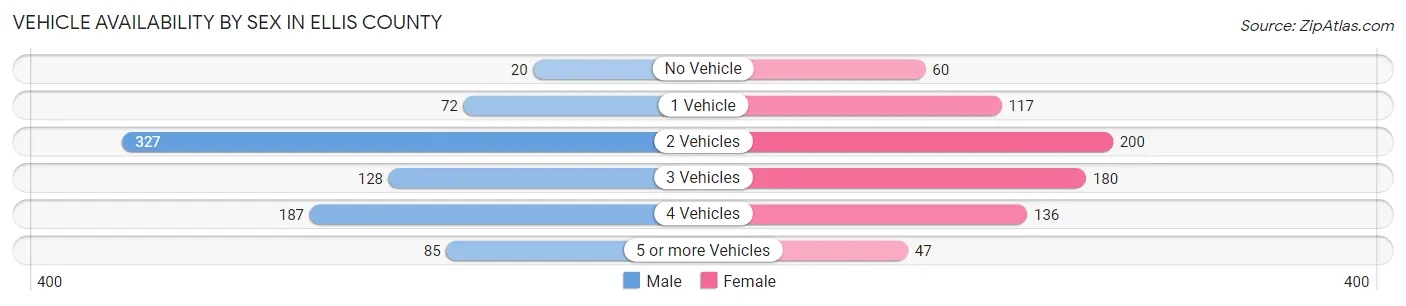
| Vehicles Available | Male | Female |
| No Vehicle | 20 (2.4%) | 60 (8.1%) |
| 1 Vehicle | 72 (8.8%) | 117 (15.8%) |
| 2 Vehicles | 327 (39.9%) | 200 (27.0%) |
| 3 Vehicles | 128 (15.6%) | 180 (24.3%) |
| 4 Vehicles | 187 (22.8%) | 136 (18.4%) |
| 5 or more Vehicles | 85 (10.4%) | 47 (6.4%) |
| Total | 819 (100.0%) | 740 (100.0%) |
Commute Time in Ellis County
The most frequently occuring commute durations in Ellis County are less than 5 minutes (308 commuters, 21.3%), 10 to 14 minutes (231 commuters, 16.0%), and 5 to 9 minutes (195 commuters, 13.5%).
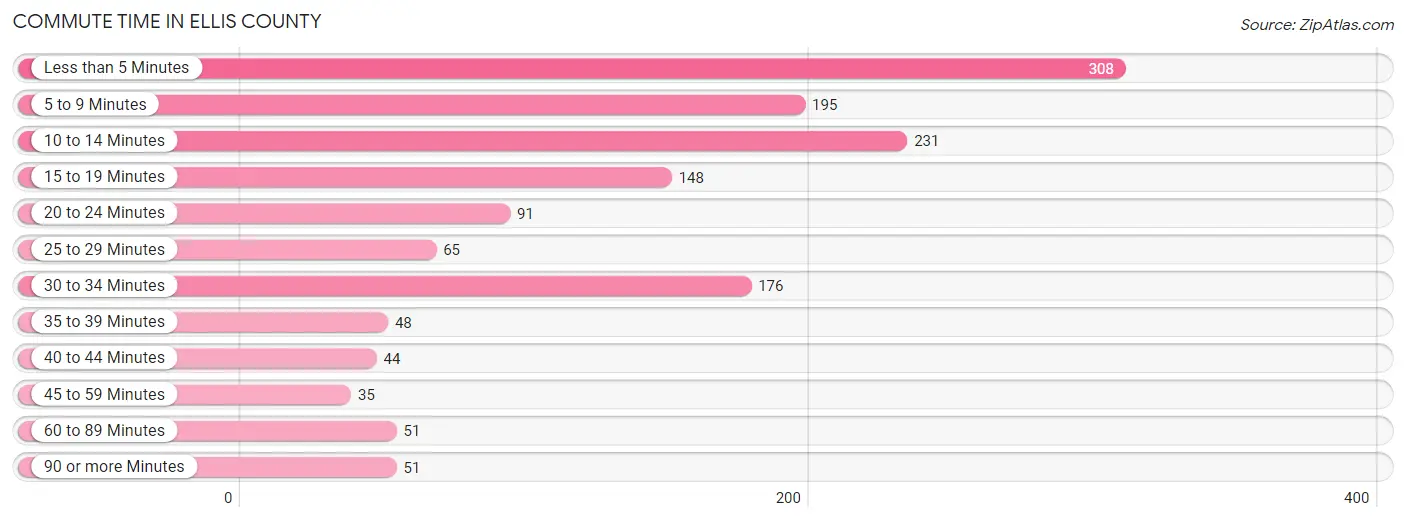
| Commute Time | # Commuters | % Commuters |
| Less than 5 Minutes | 308 | 21.3% |
| 5 to 9 Minutes | 195 | 13.5% |
| 10 to 14 Minutes | 231 | 16.0% |
| 15 to 19 Minutes | 148 | 10.3% |
| 20 to 24 Minutes | 91 | 6.3% |
| 25 to 29 Minutes | 65 | 4.5% |
| 30 to 34 Minutes | 176 | 12.2% |
| 35 to 39 Minutes | 48 | 3.3% |
| 40 to 44 Minutes | 44 | 3.0% |
| 45 to 59 Minutes | 35 | 2.4% |
| 60 to 89 Minutes | 51 | 3.5% |
| 90 or more Minutes | 51 | 3.5% |
Commute Time by Sex in Ellis County
The most common commute times in Ellis County are 10 to 14 minutes (125 commuters, 16.3%) for males and less than 5 minutes (191 commuters, 28.2%) for females.
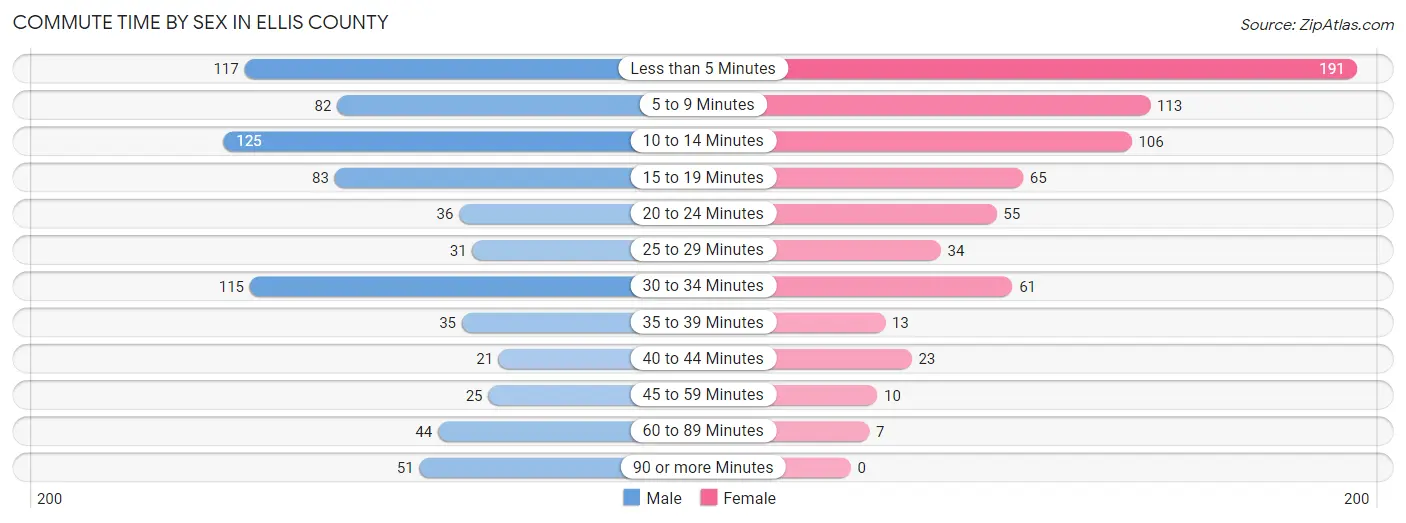
| Commute Time | Male | Female |
| Less than 5 Minutes | 117 (15.3%) | 191 (28.2%) |
| 5 to 9 Minutes | 82 (10.7%) | 113 (16.7%) |
| 10 to 14 Minutes | 125 (16.3%) | 106 (15.6%) |
| 15 to 19 Minutes | 83 (10.8%) | 65 (9.6%) |
| 20 to 24 Minutes | 36 (4.7%) | 55 (8.1%) |
| 25 to 29 Minutes | 31 (4.1%) | 34 (5.0%) |
| 30 to 34 Minutes | 115 (15.0%) | 61 (9.0%) |
| 35 to 39 Minutes | 35 (4.6%) | 13 (1.9%) |
| 40 to 44 Minutes | 21 (2.8%) | 23 (3.4%) |
| 45 to 59 Minutes | 25 (3.3%) | 10 (1.5%) |
| 60 to 89 Minutes | 44 (5.8%) | 7 (1.0%) |
| 90 or more Minutes | 51 (6.7%) | 0 (0.0%) |
Time of Departure to Work by Sex in Ellis County
The most frequent times of departure to work in Ellis County are 5:30 AM to 5:59 AM (104, 13.6%) for males and 7:30 AM to 7:59 AM (172, 25.4%) for females.
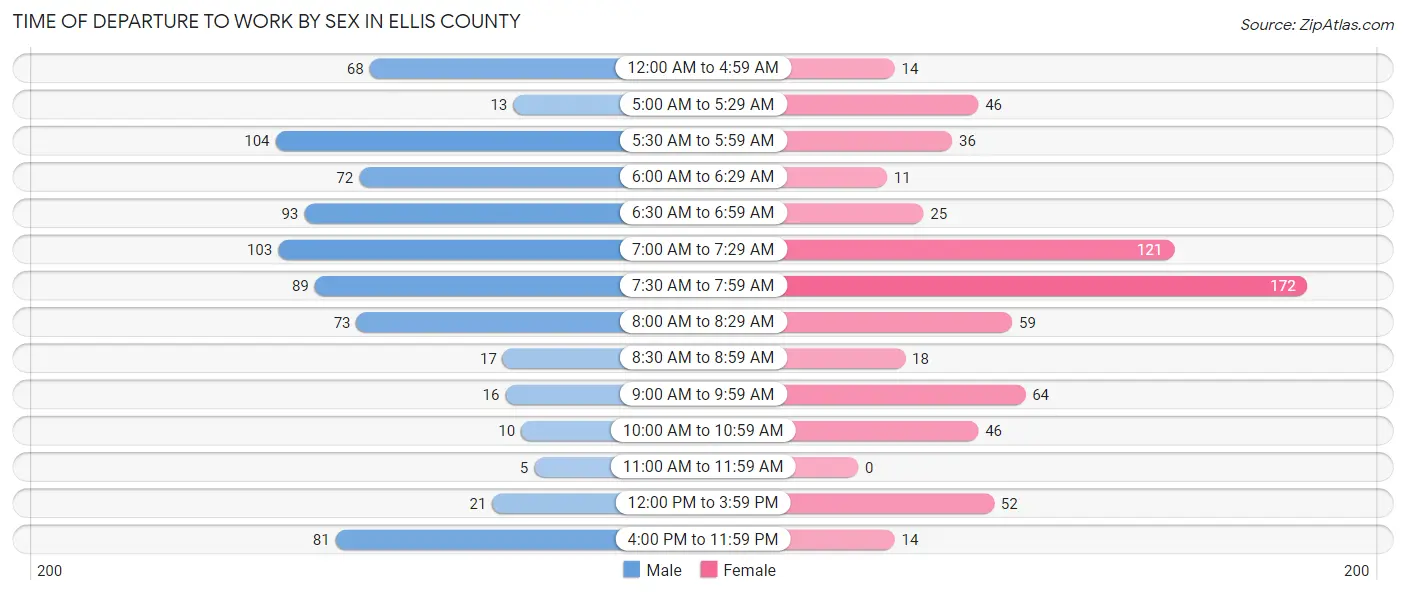
| Time of Departure | Male | Female |
| 12:00 AM to 4:59 AM | 68 (8.9%) | 14 (2.1%) |
| 5:00 AM to 5:29 AM | 13 (1.7%) | 46 (6.8%) |
| 5:30 AM to 5:59 AM | 104 (13.6%) | 36 (5.3%) |
| 6:00 AM to 6:29 AM | 72 (9.4%) | 11 (1.6%) |
| 6:30 AM to 6:59 AM | 93 (12.2%) | 25 (3.7%) |
| 7:00 AM to 7:29 AM | 103 (13.5%) | 121 (17.8%) |
| 7:30 AM to 7:59 AM | 89 (11.6%) | 172 (25.4%) |
| 8:00 AM to 8:29 AM | 73 (9.5%) | 59 (8.7%) |
| 8:30 AM to 8:59 AM | 17 (2.2%) | 18 (2.6%) |
| 9:00 AM to 9:59 AM | 16 (2.1%) | 64 (9.4%) |
| 10:00 AM to 10:59 AM | 10 (1.3%) | 46 (6.8%) |
| 11:00 AM to 11:59 AM | 5 (0.6%) | 0 (0.0%) |
| 12:00 PM to 3:59 PM | 21 (2.8%) | 52 (7.7%) |
| 4:00 PM to 11:59 PM | 81 (10.6%) | 14 (2.1%) |
| Total | 765 (100.0%) | 678 (100.0%) |
Housing Occupancy in Ellis County
Occupancy by Ownership in Ellis County
Of the total 1,412 dwellings in Ellis County, owner-occupied units account for 1,152 (81.6%), while renter-occupied units make up 260 (18.4%).
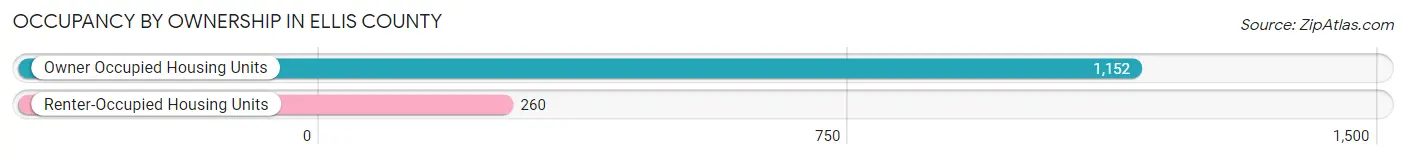
| Occupancy | # Housing Units | % Housing Units |
| Owner Occupied Housing Units | 1,152 | 81.6% |
| Renter-Occupied Housing Units | 260 | 18.4% |
| Total Occupied Housing Units | 1,412 | 100.0% |
Occupancy by Household Size in Ellis County
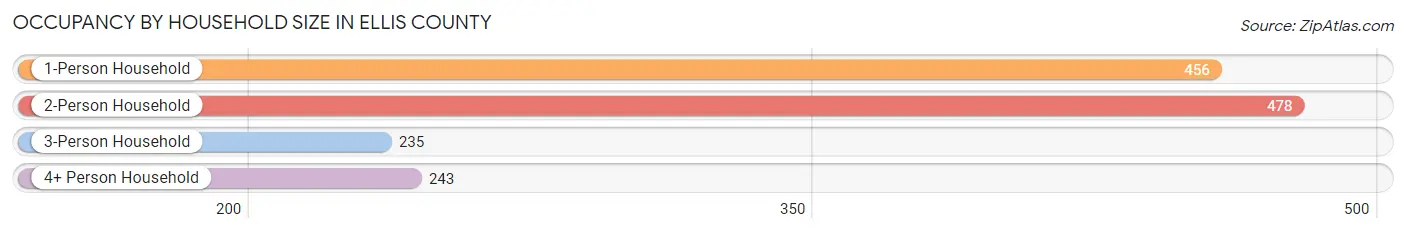
| Household Size | # Housing Units | % Housing Units |
| 1-Person Household | 456 | 32.3% |
| 2-Person Household | 478 | 33.9% |
| 3-Person Household | 235 | 16.6% |
| 4+ Person Household | 243 | 17.2% |
| Total Housing Units | 1,412 | 100.0% |
Occupancy by Ownership by Household Size in Ellis County
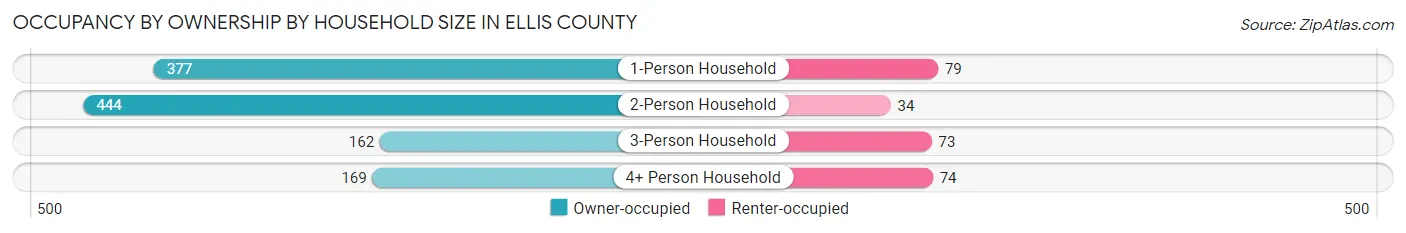
| Household Size | Owner-occupied | Renter-occupied |
| 1-Person Household | 377 (82.7%) | 79 (17.3%) |
| 2-Person Household | 444 (92.9%) | 34 (7.1%) |
| 3-Person Household | 162 (68.9%) | 73 (31.1%) |
| 4+ Person Household | 169 (69.6%) | 74 (30.4%) |
| Total Housing Units | 1,152 (81.6%) | 260 (18.4%) |
Occupancy by Educational Attainment in Ellis County
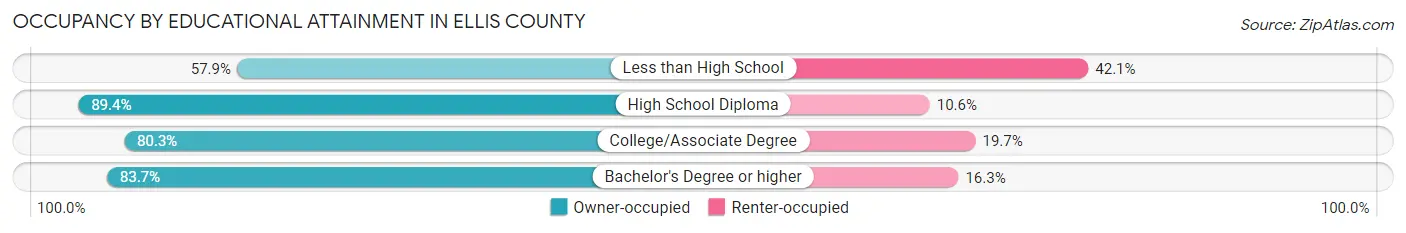
| Household Size | Owner-occupied | Renter-occupied |
| Less than High School | 95 (57.9%) | 69 (42.1%) |
| High School Diploma | 445 (89.4%) | 53 (10.6%) |
| College/Associate Degree | 371 (80.3%) | 91 (19.7%) |
| Bachelor's Degree or higher | 241 (83.7%) | 47 (16.3%) |
Occupancy by Age of Householder in Ellis County
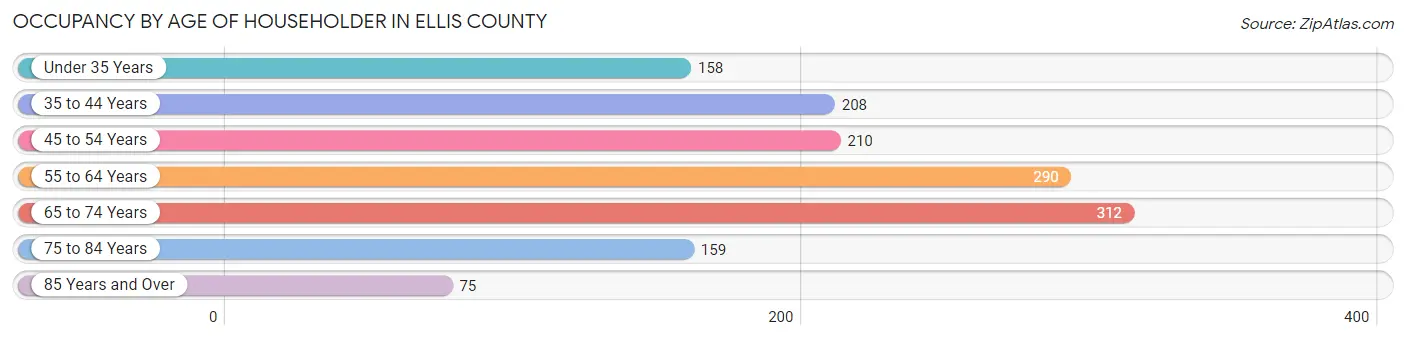
| Age Bracket | # Households | % Households |
| Under 35 Years | 158 | 11.2% |
| 35 to 44 Years | 208 | 14.7% |
| 45 to 54 Years | 210 | 14.9% |
| 55 to 64 Years | 290 | 20.5% |
| 65 to 74 Years | 312 | 22.1% |
| 75 to 84 Years | 159 | 11.3% |
| 85 Years and Over | 75 | 5.3% |
| Total | 1,412 | 100.0% |
Housing Finances in Ellis County
Median Income by Occupancy in Ellis County
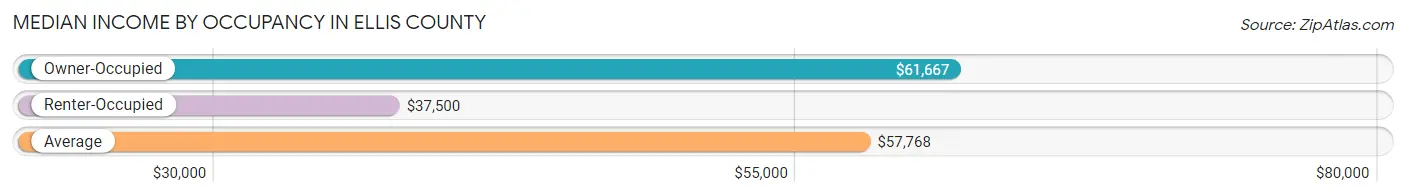
| Occupancy Type | # Households | Median Income |
| Owner-Occupied | 1,152 (81.6%) | $61,667 |
| Renter-Occupied | 260 (18.4%) | $37,500 |
| Average | 1,412 (100.0%) | $57,768 |
Occupancy by Householder Income Bracket in Ellis County
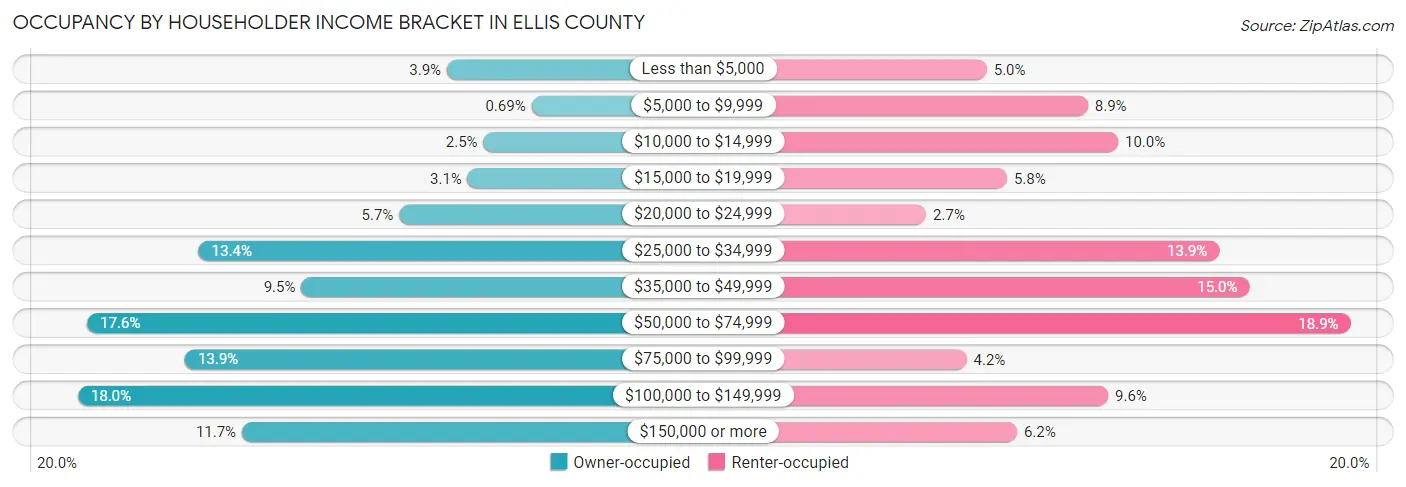
| Income Bracket | Owner-occupied | Renter-occupied |
| Less than $5,000 | 45 (3.9%) | 13 (5.0%) |
| $5,000 to $9,999 | 8 (0.7%) | 23 (8.8%) |
| $10,000 to $14,999 | 29 (2.5%) | 26 (10.0%) |
| $15,000 to $19,999 | 36 (3.1%) | 15 (5.8%) |
| $20,000 to $24,999 | 66 (5.7%) | 7 (2.7%) |
| $25,000 to $34,999 | 154 (13.4%) | 36 (13.9%) |
| $35,000 to $49,999 | 109 (9.5%) | 39 (15.0%) |
| $50,000 to $74,999 | 203 (17.6%) | 49 (18.9%) |
| $75,000 to $99,999 | 160 (13.9%) | 11 (4.2%) |
| $100,000 to $149,999 | 207 (18.0%) | 25 (9.6%) |
| $150,000 or more | 135 (11.7%) | 16 (6.1%) |
| Total | 1,152 (100.0%) | 260 (100.0%) |
Monthly Housing Cost Tiers in Ellis County
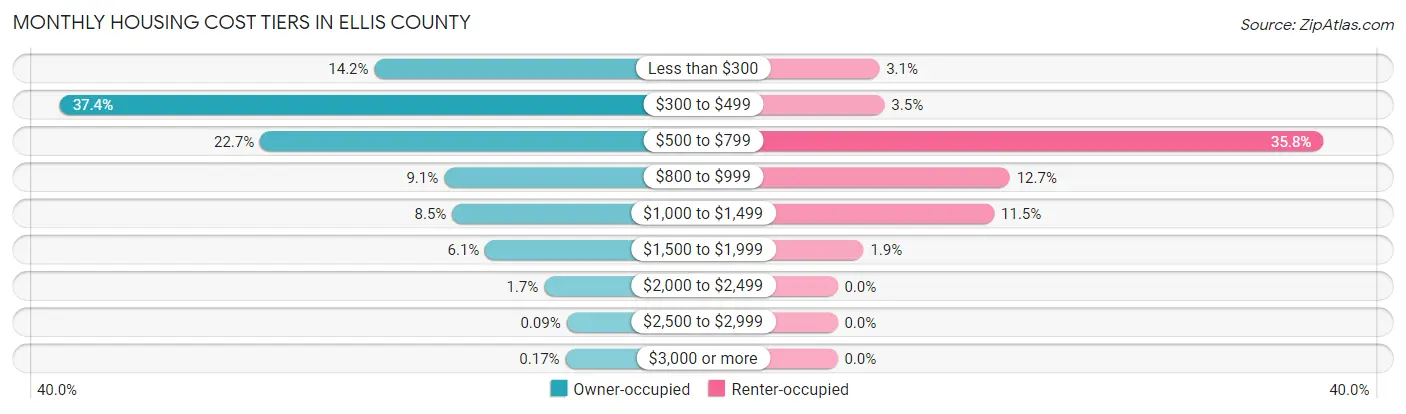
| Monthly Cost | Owner-occupied | Renter-occupied |
| Less than $300 | 164 (14.2%) | 8 (3.1%) |
| $300 to $499 | 431 (37.4%) | 9 (3.5%) |
| $500 to $799 | 261 (22.7%) | 93 (35.8%) |
| $800 to $999 | 105 (9.1%) | 33 (12.7%) |
| $1,000 to $1,499 | 98 (8.5%) | 30 (11.5%) |
| $1,500 to $1,999 | 70 (6.1%) | 5 (1.9%) |
| $2,000 to $2,499 | 20 (1.7%) | 0 (0.0%) |
| $2,500 to $2,999 | 1 (0.1%) | 0 (0.0%) |
| $3,000 or more | 2 (0.2%) | 0 (0.0%) |
| Total | 1,152 (100.0%) | 260 (100.0%) |
Physical Housing Characteristics in Ellis County
Housing Structures in Ellis County
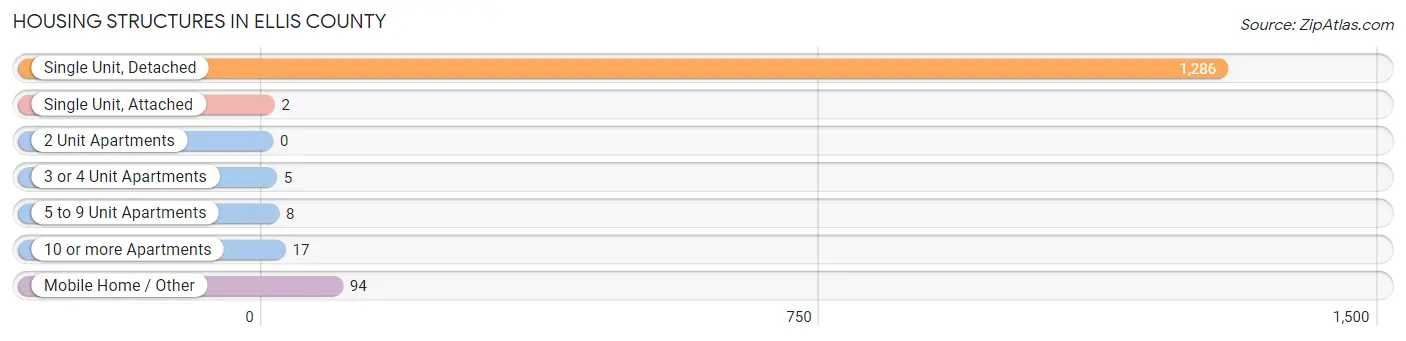
| Structure Type | # Housing Units | % Housing Units |
| Single Unit, Detached | 1,286 | 91.1% |
| Single Unit, Attached | 2 | 0.1% |
| 2 Unit Apartments | 0 | 0.0% |
| 3 or 4 Unit Apartments | 5 | 0.4% |
| 5 to 9 Unit Apartments | 8 | 0.6% |
| 10 or more Apartments | 17 | 1.2% |
| Mobile Home / Other | 94 | 6.7% |
| Total | 1,412 | 100.0% |
Housing Structures by Occupancy in Ellis County
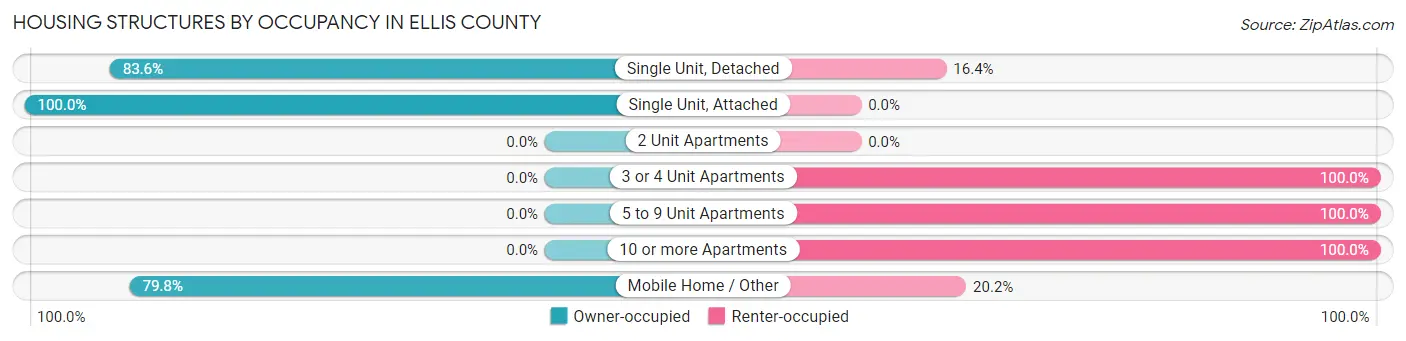
| Structure Type | Owner-occupied | Renter-occupied |
| Single Unit, Detached | 1,075 (83.6%) | 211 (16.4%) |
| Single Unit, Attached | 2 (100.0%) | 0 (0.0%) |
| 2 Unit Apartments | 0 (0.0%) | 0 (0.0%) |
| 3 or 4 Unit Apartments | 0 (0.0%) | 5 (100.0%) |
| 5 to 9 Unit Apartments | 0 (0.0%) | 8 (100.0%) |
| 10 or more Apartments | 0 (0.0%) | 17 (100.0%) |
| Mobile Home / Other | 75 (79.8%) | 19 (20.2%) |
| Total | 1,152 (81.6%) | 260 (18.4%) |
Housing Structures by Number of Rooms in Ellis County
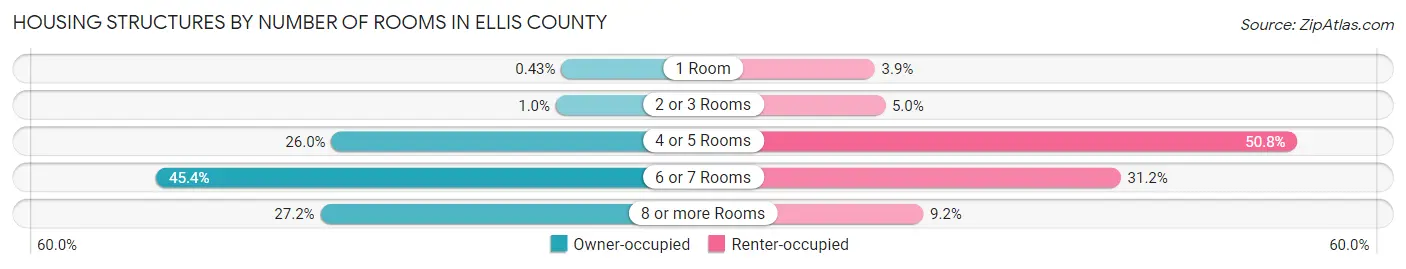
| Number of Rooms | Owner-occupied | Renter-occupied |
| 1 Room | 5 (0.4%) | 10 (3.8%) |
| 2 or 3 Rooms | 12 (1.0%) | 13 (5.0%) |
| 4 or 5 Rooms | 299 (26.0%) | 132 (50.8%) |
| 6 or 7 Rooms | 523 (45.4%) | 81 (31.1%) |
| 8 or more Rooms | 313 (27.2%) | 24 (9.2%) |
| Total | 1,152 (100.0%) | 260 (100.0%) |
Housing Structure by Heating Type in Ellis County
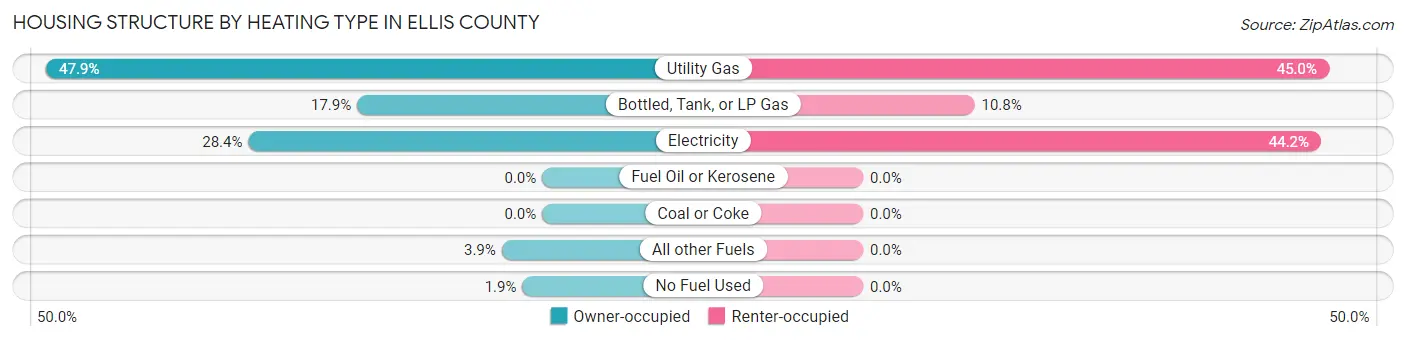
| Heating Type | Owner-occupied | Renter-occupied |
| Utility Gas | 552 (47.9%) | 117 (45.0%) |
| Bottled, Tank, or LP Gas | 206 (17.9%) | 28 (10.8%) |
| Electricity | 327 (28.4%) | 115 (44.2%) |
| Fuel Oil or Kerosene | 0 (0.0%) | 0 (0.0%) |
| Coal or Coke | 0 (0.0%) | 0 (0.0%) |
| All other Fuels | 45 (3.9%) | 0 (0.0%) |
| No Fuel Used | 22 (1.9%) | 0 (0.0%) |
| Total | 1,152 (100.0%) | 260 (100.0%) |
Household Vehicle Usage in Ellis County
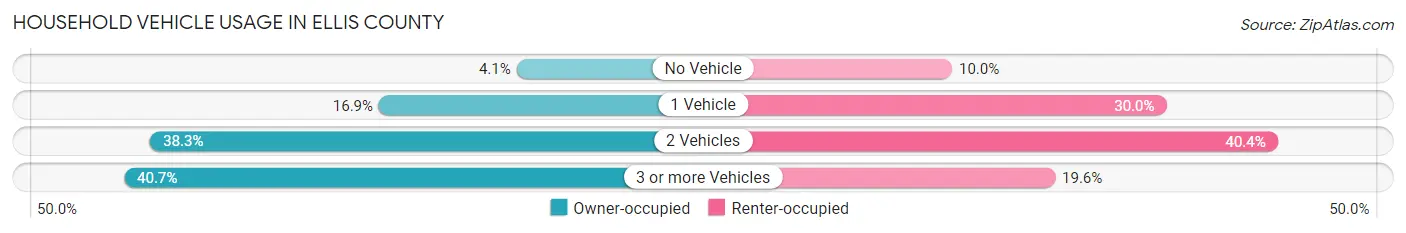
| Vehicles per Household | Owner-occupied | Renter-occupied |
| No Vehicle | 47 (4.1%) | 26 (10.0%) |
| 1 Vehicle | 195 (16.9%) | 78 (30.0%) |
| 2 Vehicles | 441 (38.3%) | 105 (40.4%) |
| 3 or more Vehicles | 469 (40.7%) | 51 (19.6%) |
| Total | 1,152 (100.0%) | 260 (100.0%) |
Real Estate & Mortgages in Ellis County
Real Estate and Mortgage Overview in Ellis County
| Characteristic | Without Mortgage | With Mortgage |
| Housing Units | 873 | 279 |
| Median Property Value | $101,300 | $128,400 |
| Median Household Income | $52,550 | $38 |
| Monthly Housing Costs | $392 | $2 |
| Real Estate Taxes | $751 | $26 |
Property Value by Mortgage Status in Ellis County
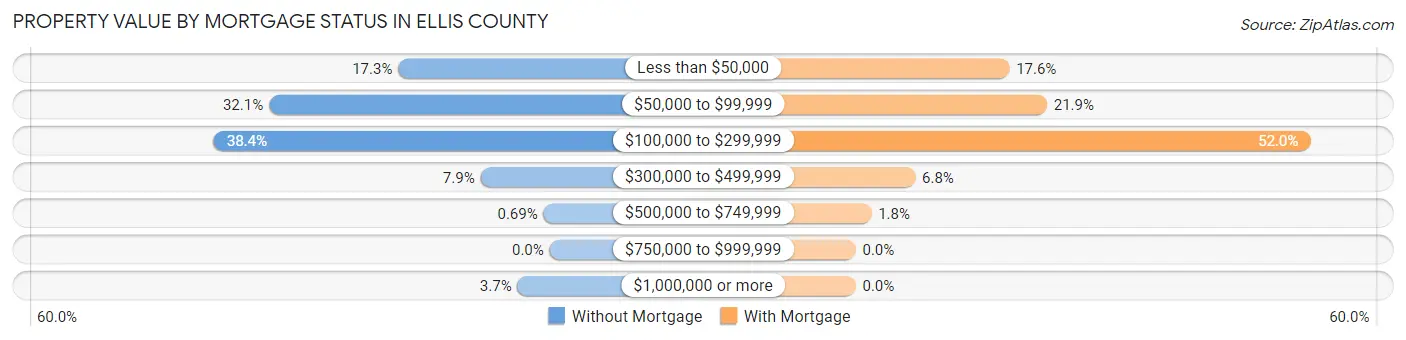
| Property Value | Without Mortgage | With Mortgage |
| Less than $50,000 | 151 (17.3%) | 49 (17.6%) |
| $50,000 to $99,999 | 280 (32.1%) | 61 (21.9%) |
| $100,000 to $299,999 | 335 (38.4%) | 145 (52.0%) |
| $300,000 to $499,999 | 69 (7.9%) | 19 (6.8%) |
| $500,000 to $749,999 | 6 (0.7%) | 5 (1.8%) |
| $750,000 to $999,999 | 0 (0.0%) | 0 (0.0%) |
| $1,000,000 or more | 32 (3.7%) | 0 (0.0%) |
| Total | 873 (100.0%) | 279 (100.0%) |
Household Income by Mortgage Status in Ellis County

| Household Income | Without Mortgage | With Mortgage |
| Less than $10,000 | 49 (5.6%) | 0 (0.0%) |
| $10,000 to $24,999 | 123 (14.1%) | 4 (1.4%) |
| $25,000 to $34,999 | 152 (17.4%) | 8 (2.9%) |
| $35,000 to $49,999 | 81 (9.3%) | 2 (0.7%) |
| $50,000 to $74,999 | 155 (17.7%) | 28 (10.0%) |
| $75,000 to $99,999 | 102 (11.7%) | 48 (17.2%) |
| $100,000 to $149,999 | 114 (13.1%) | 58 (20.8%) |
| $150,000 or more | 97 (11.1%) | 93 (33.3%) |
| Total | 873 (100.0%) | 279 (100.0%) |
Property Value to Household Income Ratio in Ellis County
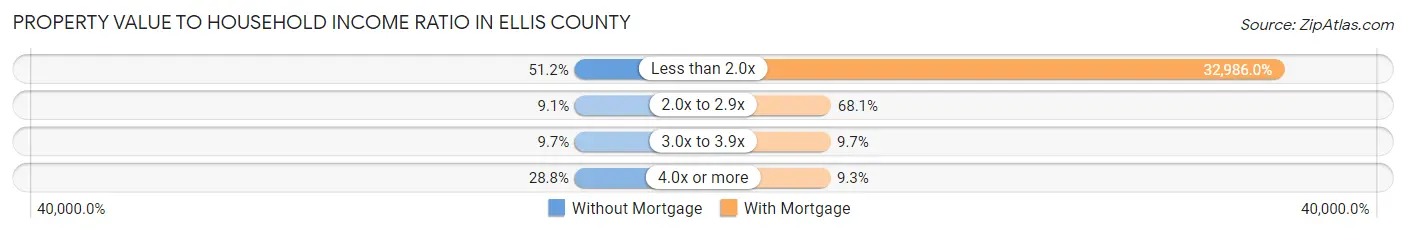
| Value-to-Income Ratio | Without Mortgage | With Mortgage |
| Less than 2.0x | 447 (51.2%) | 92,031 (32,986.0%) |
| 2.0x to 2.9x | 79 (9.0%) | 190 (68.1%) |
| 3.0x to 3.9x | 85 (9.7%) | 27 (9.7%) |
| 4.0x or more | 251 (28.7%) | 26 (9.3%) |
| Total | 873 (100.0%) | 279 (100.0%) |
Real Estate Taxes by Mortgage Status in Ellis County
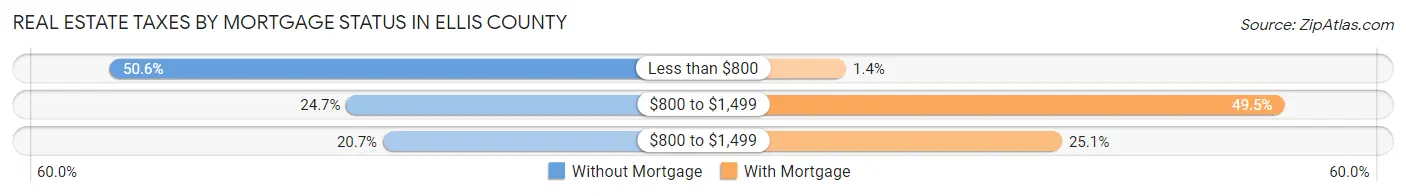
| Property Taxes | Without Mortgage | With Mortgage |
| Less than $800 | 442 (50.6%) | 4 (1.4%) |
| $800 to $1,499 | 216 (24.7%) | 138 (49.5%) |
| $800 to $1,499 | 181 (20.7%) | 70 (25.1%) |
| Total | 873 (100.0%) | 279 (100.0%) |
Health & Disability in Ellis County
Health Insurance Coverage by Age in Ellis County
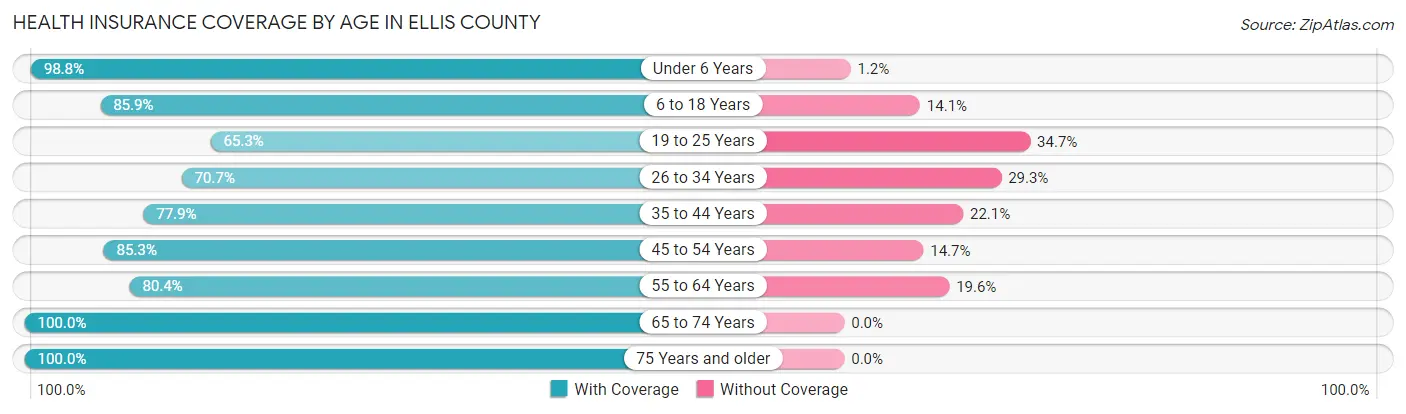
| Age Bracket | With Coverage | Without Coverage |
| Under 6 Years | 256 (98.8%) | 3 (1.2%) |
| 6 to 18 Years | 524 (85.9%) | 86 (14.1%) |
| 19 to 25 Years | 181 (65.3%) | 96 (34.7%) |
| 26 to 34 Years | 191 (70.7%) | 79 (29.3%) |
| 35 to 44 Years | 401 (77.9%) | 114 (22.1%) |
| 45 to 54 Years | 359 (85.3%) | 62 (14.7%) |
| 55 to 64 Years | 399 (80.4%) | 97 (19.6%) |
| 65 to 74 Years | 505 (100.0%) | 0 (0.0%) |
| 75 Years and older | 344 (100.0%) | 0 (0.0%) |
| Total | 3,160 (85.5%) | 537 (14.5%) |
Health Insurance Coverage by Citizenship Status in Ellis County

| Citizenship Status | With Coverage | Without Coverage |
| Native Born | 256 (98.8%) | 3 (1.2%) |
| Foreign Born, Citizen | 524 (85.9%) | 86 (14.1%) |
| Foreign Born, not a Citizen | 181 (65.3%) | 96 (34.7%) |
Health Insurance Coverage by Household Income in Ellis County
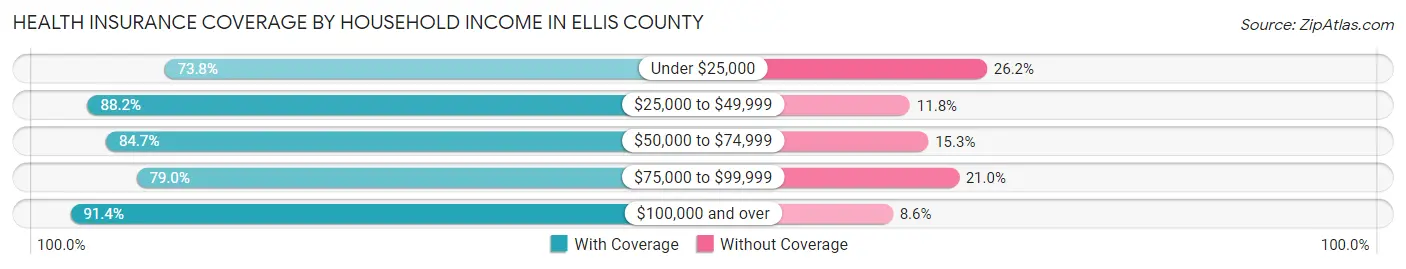
| Household Income | With Coverage | Without Coverage |
| Under $25,000 | 326 (73.8%) | 116 (26.2%) |
| $25,000 to $49,999 | 604 (88.2%) | 81 (11.8%) |
| $50,000 to $74,999 | 733 (84.7%) | 132 (15.3%) |
| $75,000 to $99,999 | 392 (79.0%) | 104 (21.0%) |
| $100,000 and over | 1,105 (91.4%) | 104 (8.6%) |
Public vs Private Health Insurance Coverage by Age in Ellis County
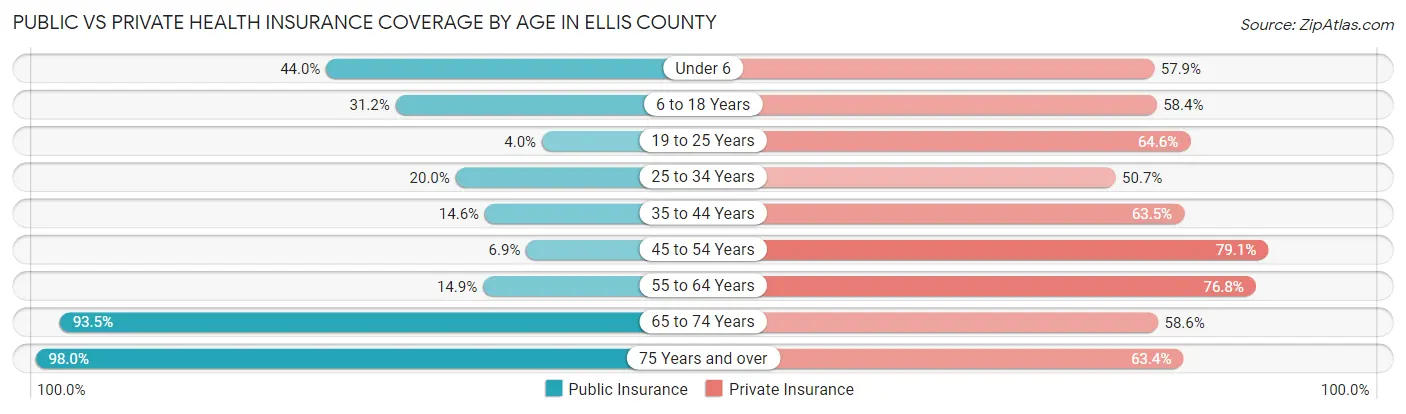
| Age Bracket | Public Insurance | Private Insurance |
| Under 6 | 114 (44.0%) | 150 (57.9%) |
| 6 to 18 Years | 190 (31.1%) | 356 (58.4%) |
| 19 to 25 Years | 11 (4.0%) | 179 (64.6%) |
| 25 to 34 Years | 54 (20.0%) | 137 (50.7%) |
| 35 to 44 Years | 75 (14.6%) | 327 (63.5%) |
| 45 to 54 Years | 29 (6.9%) | 333 (79.1%) |
| 55 to 64 Years | 74 (14.9%) | 381 (76.8%) |
| 65 to 74 Years | 472 (93.5%) | 296 (58.6%) |
| 75 Years and over | 337 (98.0%) | 218 (63.4%) |
| Total | 1,356 (36.7%) | 2,377 (64.3%) |
Disability Status by Sex by Age in Ellis County
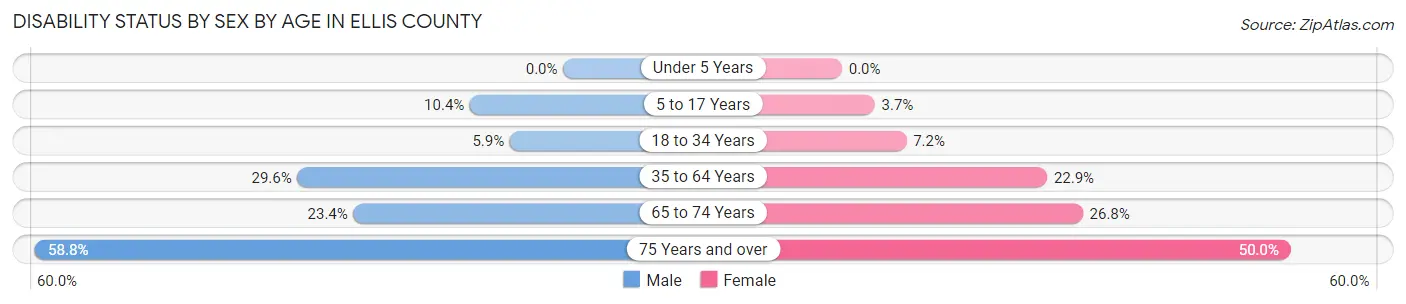
| Age Bracket | Male | Female |
| Under 5 Years | 0 (0.0%) | 0 (0.0%) |
| 5 to 17 Years | 33 (10.4%) | 12 (3.6%) |
| 18 to 34 Years | 17 (5.9%) | 21 (7.2%) |
| 35 to 64 Years | 214 (29.6%) | 162 (22.9%) |
| 65 to 74 Years | 57 (23.4%) | 70 (26.8%) |
| 75 Years and over | 80 (58.8%) | 104 (50.0%) |
Disability Class by Sex by Age in Ellis County
Disability Class: Hearing Difficulty
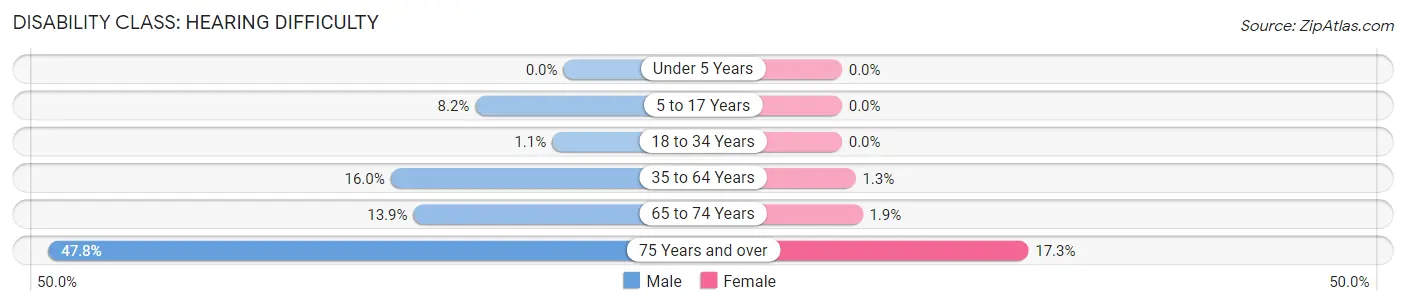
| Age Bracket | Male | Female |
| Under 5 Years | 0 (0.0%) | 0 (0.0%) |
| 5 to 17 Years | 26 (8.2%) | 0 (0.0%) |
| 18 to 34 Years | 3 (1.1%) | 0 (0.0%) |
| 35 to 64 Years | 116 (16.0%) | 9 (1.3%) |
| 65 to 74 Years | 34 (13.9%) | 5 (1.9%) |
| 75 Years and over | 65 (47.8%) | 36 (17.3%) |
Disability Class: Vision Difficulty
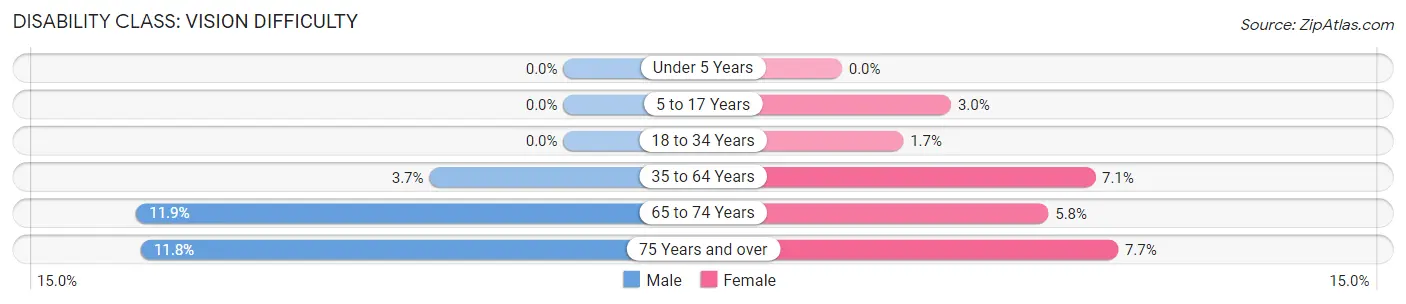
| Age Bracket | Male | Female |
| Under 5 Years | 0 (0.0%) | 0 (0.0%) |
| 5 to 17 Years | 0 (0.0%) | 10 (3.0%) |
| 18 to 34 Years | 0 (0.0%) | 5 (1.7%) |
| 35 to 64 Years | 27 (3.7%) | 50 (7.0%) |
| 65 to 74 Years | 29 (11.9%) | 15 (5.8%) |
| 75 Years and over | 16 (11.8%) | 16 (7.7%) |
Disability Class: Cognitive Difficulty

| Age Bracket | Male | Female |
| 5 to 17 Years | 7 (2.2%) | 2 (0.6%) |
| 18 to 34 Years | 9 (3.2%) | 16 (5.5%) |
| 35 to 64 Years | 103 (14.2%) | 58 (8.2%) |
| 65 to 74 Years | 32 (13.1%) | 27 (10.3%) |
| 75 Years and over | 17 (12.5%) | 55 (26.4%) |
Disability Class: Ambulatory Difficulty

| Age Bracket | Male | Female |
| 5 to 17 Years | 0 (0.0%) | 2 (0.6%) |
| 18 to 34 Years | 11 (3.8%) | 0 (0.0%) |
| 35 to 64 Years | 82 (11.3%) | 93 (13.1%) |
| 65 to 74 Years | 32 (13.1%) | 65 (24.9%) |
| 75 Years and over | 21 (15.4%) | 54 (26.0%) |
Disability Class: Self-Care Difficulty
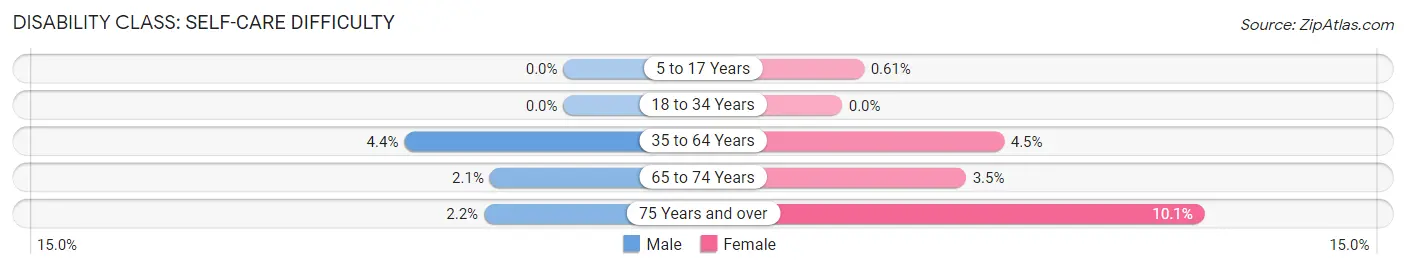
| Age Bracket | Male | Female |
| 5 to 17 Years | 0 (0.0%) | 2 (0.6%) |
| 18 to 34 Years | 0 (0.0%) | 0 (0.0%) |
| 35 to 64 Years | 32 (4.4%) | 32 (4.5%) |
| 65 to 74 Years | 5 (2.1%) | 9 (3.5%) |
| 75 Years and over | 3 (2.2%) | 21 (10.1%) |
Technology Access in Ellis County
Computing Device Access in Ellis County

| Device Type | # Households | % Households |
| Desktop or Laptop | 963 | 68.2% |
| Smartphone | 1,182 | 83.7% |
| Tablet | 759 | 53.7% |
| No Computing Device | 118 | 8.4% |
| Total | 1,412 | 100.0% |
Internet Access in Ellis County
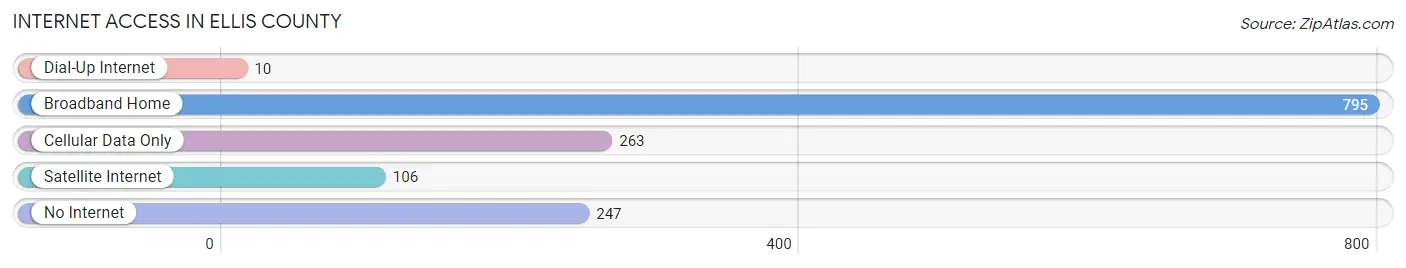
| Internet Type | # Households | % Households |
| Dial-Up Internet | 10 | 0.7% |
| Broadband Home | 795 | 56.3% |
| Cellular Data Only | 263 | 18.6% |
| Satellite Internet | 106 | 7.5% |
| No Internet | 247 | 17.5% |
| Total | 1,412 | 100.0% |
Ellis County Summary
Ellis County is located in the southwestern corner of Oklahoma, and is bordered by Beckham County to the north, Washita County to the east, Custer County to the south, and Roger Mills County to the west. The county seat is Arnett, and the largest city is Shattuck. The county was named for Albert Gallatin Ellis, a prominent early settler.
Geography
Ellis County covers an area of 1,072 square miles, making it the fourth-largest county in Oklahoma. The terrain is mostly flat, with some rolling hills in the western part of the county. The county is drained by the North Canadian River and its tributaries, including the Salt Fork of the Arkansas River. The county is part of the Red Bed Plains physiographic region.
The climate is semi-arid, with hot summers and mild winters. The average annual precipitation is about 22 inches, with most of it falling in the spring and summer months.
Demographics
As of the 2010 census, the population of Ellis County was 4,151, a decrease of 8.3% from the 2000 census. The population density was 3.9 people per square mile. The racial makeup of the county was 94.2% White, 0.3% Black or African American, 2.2% Native American, 0.2% Asian, 0.1% Pacific Islander, 0.7% from other races, and 2.3% from two or more races. Hispanic or Latino of any race were 2.3% of the population.
The median household income was $31,944, and the median family income was $37,813. The per capita income was $15,945. About 17.2% of the population was below the poverty line.
Economy
The economy of Ellis County is largely based on agriculture. The county is home to several large farms, and the main crops are wheat, sorghum, and hay. Cattle and sheep are also raised in the county.
Oil and gas production is also an important part of the economy. The county is home to several oil and gas fields, and there are several oil and gas related businesses in the county.
The county also has a growing tourism industry. The county is home to several state parks, including the Black Kettle National Grassland, and the Foss State Park. The county also has several historic sites, including the Fort Supply Historic Site and the Washita Battlefield National Historic Site.
History
The area that is now Ellis County was part of the Comanche and Kiowa Indian Territory until the late 19th century. The area was opened to settlement in the Land Run of 1893, and the county was officially established in 1907.
The county was named for Albert Gallatin Ellis, a prominent early settler who served as the county's first sheriff. The county seat was originally located in Shattuck, but was moved to Arnett in 1910.
The county experienced a period of rapid growth in the early 20th century, as oil and gas production began to take off. The county's population peaked in 1930, at 10,845. Since then, the population has steadily declined, as the county has become increasingly rural.
Common Questions
What is the Total Population of Ellis County?
Total Population of Ellis County is 3,755.
What is the Total Male Population of Ellis County?
Total Male Population of Ellis County is 1,827.
What is the Total Female Population of Ellis County?
Total Female Population of Ellis County is 1,928.
What is the Ratio of Males per 100 Females in Ellis County?
There are 94.76 Males per 100 Females in Ellis County.
What is the Ratio of Females per 100 Males in Ellis County?
There are 105.53 Females per 100 Males in Ellis County.
What is the Median Population Age in Ellis County?
Median Population Age in Ellis County is 43.8 Years.
What is the Average Family Size in Ellis County
Average Family Size in Ellis County is 3.4 People.
What is the Average Household Size in Ellis County
Average Household Size in Ellis County is 2.6 People.
What is Per Capita Income in Ellis County?
Per Capita income in Ellis County is $31,331.
What is the Median Family Income in Ellis County?
Median Family Income in Ellis County is $74,375.
What is the Median Household income in Ellis County?
Median Household Income in Ellis County is $57,768.
What is Income or Wage Gap in Ellis County?
Income or Wage Gap in Ellis County is 29.6%.
Women in Ellis County earn 70.4 cents for every dollar earned by a man.
What is Family Income Deficit in Ellis County?
Family Income Deficit in Ellis County is $8,436.
Families that are below poverty line in Ellis County earn $8,436 less on average than the poverty threshold level.
What is Inequality or Gini Index in Ellis County?
Inequality or Gini Index in Ellis County is 0.44.
How Large is the Labor Force in Ellis County?
There are 1,739 People in the Labor Forcein in Ellis County.
What is the Percentage of People in the Labor Force in Ellis County?
57.1% of People are in the Labor Force in Ellis County.
What is the Unemployment Rate in Ellis County?
Unemployment Rate in Ellis County is 8.8%.