Delaware County, OK
Delaware County Map
Delaware County Overview
40,791
TOTAL POPULATION
20,200
MALE POPULATION
20,591
FEMALE POPULATION
98.10
MALES / 100 FEMALES
101.94
FEMALES / 100 MALES
46.8
MEDIAN AGE
3.0
AVG FAMILY SIZE
2.4
AVG HOUSEHOLD SIZE
$34,489
PER CAPITA INCOME
$66,368
AVG FAMILY INCOME
$53,290
AVG HOUSEHOLD INCOME
28.1%
WAGE / INCOME GAP [ % ]
71.9¢/ $1
WAGE / INCOME GAP [ $ ]
$11,587
FAMILY INCOME DEFICIT
0.47
INEQUALITY / GINI INDEX
16,968
LABOR FORCE [ PEOPLE ]
50.3%
PERCENT IN LABOR FORCE
5.2%
UNEMPLOYMENT RATE
Delaware County Area Codes
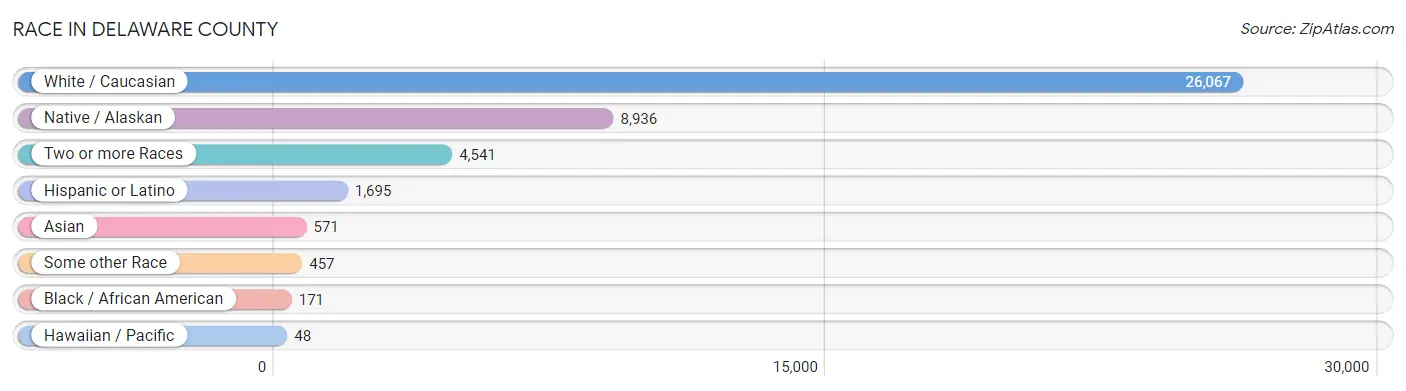
Race in Delaware County
The most populous races in Delaware County are White / Caucasian (26,067 | 63.9%), Native / Alaskan (8,936 | 21.9%), and Two or more Races (4,541 | 11.1%).
| Race | # Population | % Population |
| Asian | 571 | 1.4% |
| Black / African American | 171 | 0.4% |
| Hawaiian / Pacific | 48 | 0.1% |
| Hispanic or Latino | 1,695 | 4.2% |
| Native / Alaskan | 8,936 | 21.9% |
| White / Caucasian | 26,067 | 63.9% |
| Two or more Races | 4,541 | 11.1% |
| Some other Race | 457 | 1.1% |
| Total | 40,791 | 100.0% |
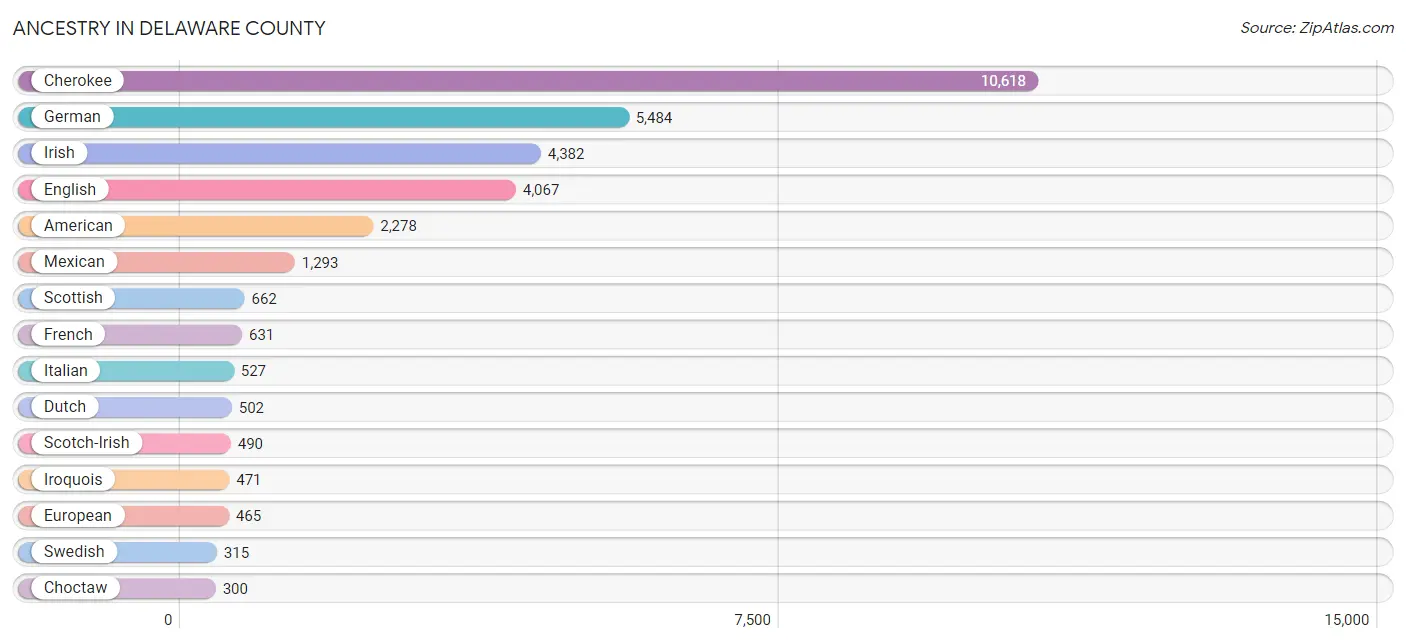
Ancestry in Delaware County
The most populous ancestries reported in Delaware County are Cherokee (10,618 | 26.0%), German (5,484 | 13.4%), Irish (4,382 | 10.7%), English (4,067 | 10.0%), and American (2,278 | 5.6%), together accounting for 65.8% of all Delaware County residents.
| Ancestry | # Population | % Population |
| African | 5 | 0.0% |
| Aleut | 11 | 0.0% |
| American | 2,278 | 5.6% |
| Apache | 94 | 0.2% |
| Arab | 6 | 0.0% |
| Argentinean | 9 | 0.0% |
| Austrian | 15 | 0.0% |
| Bangladeshi | 298 | 0.7% |
| Belgian | 65 | 0.2% |
| Bhutanese | 8 | 0.0% |
| Blackfeet | 29 | 0.1% |
| Brazilian | 13 | 0.0% |
| British | 239 | 0.6% |
| Burmese | 53 | 0.1% |
| Cajun | 10 | 0.0% |
| Canadian | 13 | 0.0% |
| Central American | 68 | 0.2% |
| Cherokee | 10,618 | 26.0% |
| Cheyenne | 36 | 0.1% |
| Chickasaw | 49 | 0.1% |
| Chippewa | 2 | 0.0% |
| Choctaw | 300 | 0.7% |
| Colombian | 13 | 0.0% |
| Comanche | 39 | 0.1% |
| Creek | 225 | 0.5% |
| Czech | 28 | 0.1% |
| Czechoslovakian | 46 | 0.1% |
| Danish | 45 | 0.1% |
| Delaware | 48 | 0.1% |
| Dutch | 502 | 1.2% |
| Dutch West Indian | 144 | 0.4% |
| Eastern European | 53 | 0.1% |
| English | 4,067 | 10.0% |
| Estonian | 9 | 0.0% |
| Ethiopian | 1 | 0.0% |
| European | 465 | 1.1% |
| Fijian | 10 | 0.0% |
| Filipino | 24 | 0.1% |
| French | 631 | 1.5% |
| French American Indian | 7 | 0.0% |
| French Canadian | 127 | 0.3% |
| German | 5,484 | 13.4% |
| Greek | 2 | 0.0% |
| Guamanian / Chamorro | 9 | 0.0% |
| Guatemalan | 16 | 0.0% |
| Honduran | 25 | 0.1% |
| Hungarian | 29 | 0.1% |
| Indian (Asian) | 61 | 0.2% |
| Inupiat | 6 | 0.0% |
| Iranian | 36 | 0.1% |
| Irish | 4,382 | 10.7% |
| Iroquois | 471 | 1.1% |
| Israeli | 1 | 0.0% |
| Italian | 527 | 1.3% |
| Japanese | 9 | 0.0% |
| Korean | 118 | 0.3% |
| Malaysian | 4 | 0.0% |
| Mexican | 1,293 | 3.2% |
| Mexican American Indian | 55 | 0.1% |
| Native Hawaiian | 43 | 0.1% |
| Navajo | 20 | 0.1% |
| Northern European | 69 | 0.2% |
| Norwegian | 262 | 0.6% |
| Osage | 72 | 0.2% |
| Ottawa | 1 | 0.0% |
| Pakistani | 9 | 0.0% |
| Pennsylvania German | 1 | 0.0% |
| Peruvian | 2 | 0.0% |
| Polish | 289 | 0.7% |
| Portuguese | 64 | 0.2% |
| Potawatomi | 9 | 0.0% |
| Pueblo | 52 | 0.1% |
| Puerto Rican | 120 | 0.3% |
| Russian | 125 | 0.3% |
| Salvadoran | 27 | 0.1% |
| Samoan | 1 | 0.0% |
| Scandinavian | 21 | 0.1% |
| Scotch-Irish | 490 | 1.2% |
| Scottish | 662 | 1.6% |
| Seminole | 4 | 0.0% |
| Sioux | 39 | 0.1% |
| South African | 19 | 0.1% |
| South American | 24 | 0.1% |
| Spaniard | 104 | 0.3% |
| Spanish | 41 | 0.1% |
| Sri Lankan | 66 | 0.2% |
| Subsaharan African | 25 | 0.1% |
| Swedish | 315 | 0.8% |
| Swiss | 96 | 0.2% |
| Thai | 28 | 0.1% |
| Ukrainian | 8 | 0.0% |
| Welsh | 289 | 0.7% | View All 92 Rows |
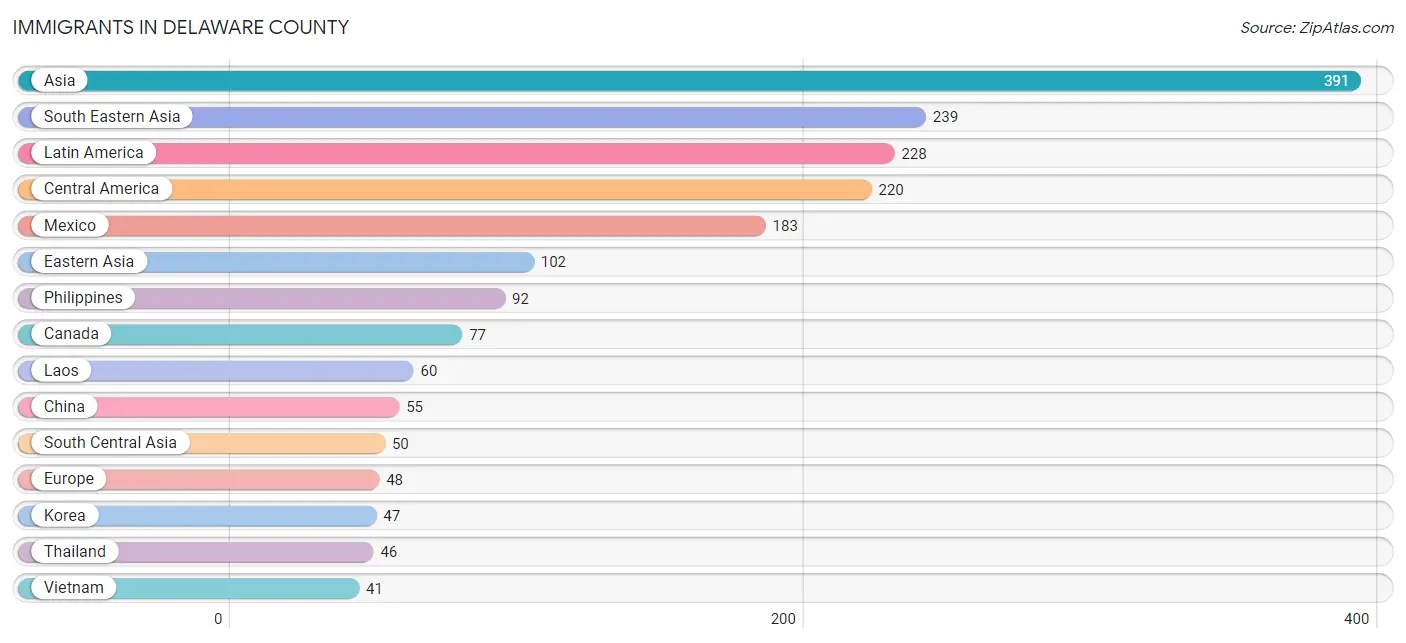
Immigrants in Delaware County
The most numerous immigrant groups reported in Delaware County came from Asia (391 | 1.0%), South Eastern Asia (239 | 0.6%), Latin America (228 | 0.6%), Central America (220 | 0.5%), and Mexico (183 | 0.4%), together accounting for 3.1% of all Delaware County residents.
| Immigration Origin | # Population | % Population |
| Africa | 19 | 0.1% |
| Asia | 391 | 1.0% |
| Brazil | 6 | 0.0% |
| Canada | 77 | 0.2% |
| Central America | 220 | 0.5% |
| China | 55 | 0.1% |
| Eastern Africa | 17 | 0.0% |
| Eastern Asia | 102 | 0.3% |
| Eastern Europe | 8 | 0.0% |
| El Salvador | 24 | 0.1% |
| England | 11 | 0.0% |
| Europe | 48 | 0.1% |
| France | 4 | 0.0% |
| Germany | 15 | 0.0% |
| Guatemala | 11 | 0.0% |
| Honduras | 2 | 0.0% |
| Iran | 36 | 0.1% |
| Italy | 1 | 0.0% |
| Korea | 47 | 0.1% |
| Laos | 60 | 0.2% |
| Latin America | 228 | 0.6% |
| Mexico | 183 | 0.4% |
| Micronesia | 2 | 0.0% |
| Nepal | 14 | 0.0% |
| Netherlands | 6 | 0.0% |
| Northern Europe | 14 | 0.0% |
| Oceania | 9 | 0.0% |
| Peru | 2 | 0.0% |
| Philippines | 92 | 0.2% |
| Scotland | 3 | 0.0% |
| South Africa | 2 | 0.0% |
| South America | 8 | 0.0% |
| South Central Asia | 50 | 0.1% |
| South Eastern Asia | 239 | 0.6% |
| Southern Europe | 1 | 0.0% |
| Taiwan | 15 | 0.0% |
| Thailand | 46 | 0.1% |
| Ukraine | 8 | 0.0% |
| Vietnam | 41 | 0.1% |
| Western Europe | 25 | 0.1% |
| Zimbabwe | 17 | 0.0% | View All 41 Rows |
Sex and Age in Delaware County
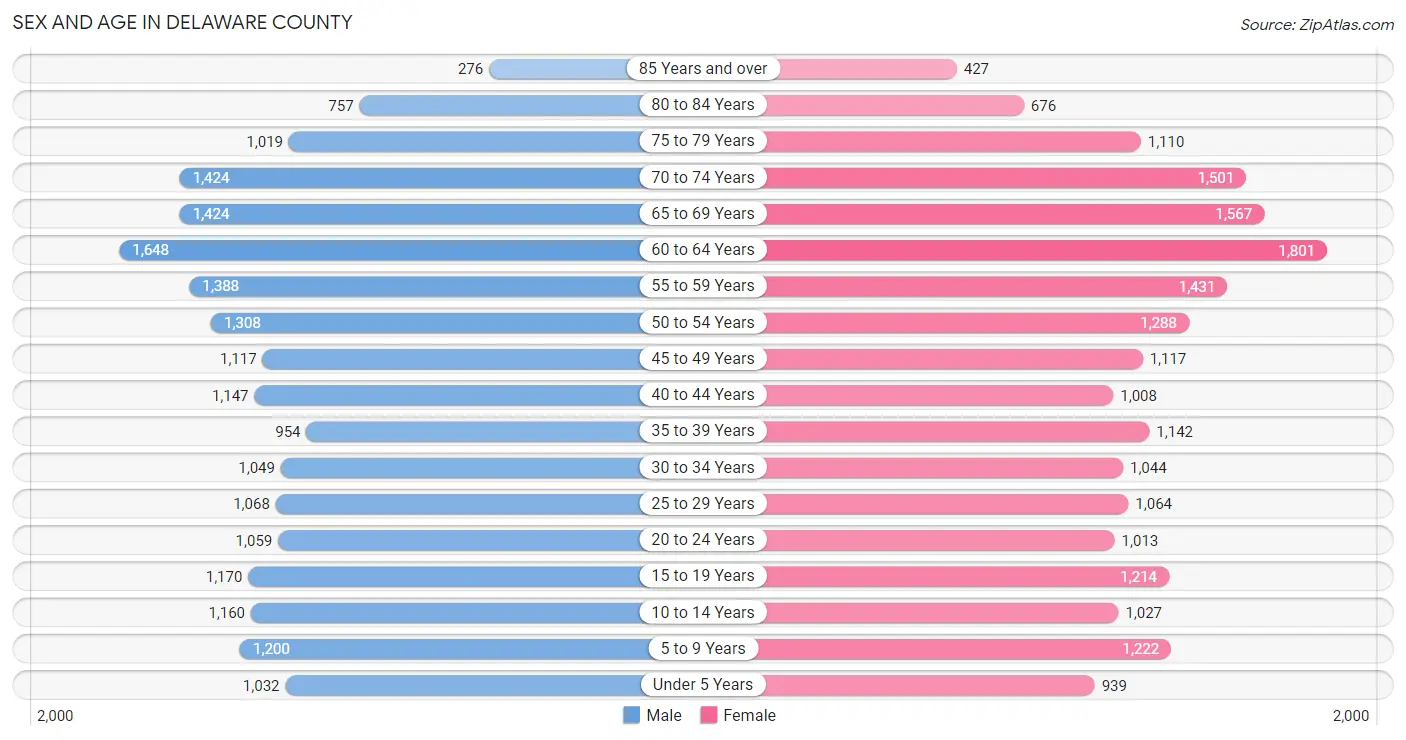
Sex and Age in Delaware County
The most populous age groups in Delaware County are 60 to 64 Years (1,648 | 8.2%) for men and 60 to 64 Years (1,801 | 8.7%) for women.
| Age Bracket | Male | Female |
| Under 5 Years | 1,032 (5.1%) | 939 (4.6%) |
| 5 to 9 Years | 1,200 (5.9%) | 1,222 (5.9%) |
| 10 to 14 Years | 1,160 (5.7%) | 1,027 (5.0%) |
| 15 to 19 Years | 1,170 (5.8%) | 1,214 (5.9%) |
| 20 to 24 Years | 1,059 (5.2%) | 1,013 (4.9%) |
| 25 to 29 Years | 1,068 (5.3%) | 1,064 (5.2%) |
| 30 to 34 Years | 1,049 (5.2%) | 1,044 (5.1%) |
| 35 to 39 Years | 954 (4.7%) | 1,142 (5.6%) |
| 40 to 44 Years | 1,147 (5.7%) | 1,008 (4.9%) |
| 45 to 49 Years | 1,117 (5.5%) | 1,117 (5.4%) |
| 50 to 54 Years | 1,308 (6.5%) | 1,288 (6.3%) |
| 55 to 59 Years | 1,388 (6.9%) | 1,431 (7.0%) |
| 60 to 64 Years | 1,648 (8.2%) | 1,801 (8.7%) |
| 65 to 69 Years | 1,424 (7.0%) | 1,567 (7.6%) |
| 70 to 74 Years | 1,424 (7.0%) | 1,501 (7.3%) |
| 75 to 79 Years | 1,019 (5.0%) | 1,110 (5.4%) |
| 80 to 84 Years | 757 (3.7%) | 676 (3.3%) |
| 85 Years and over | 276 (1.4%) | 427 (2.1%) |
| Total | 20,200 (100.0%) | 20,591 (100.0%) |
Families and Households in Delaware County
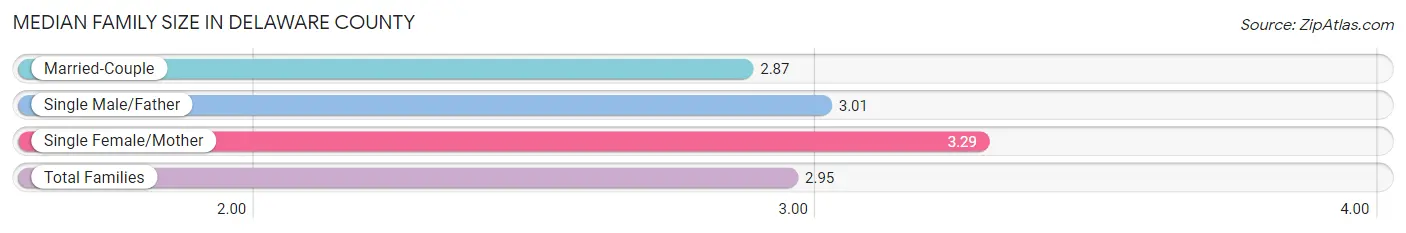
Median Family Size in Delaware County
The median family size in Delaware County is 2.95 persons per family, with single female/mother families (1,880 | 17.2%) accounting for the largest median family size of 3.29 persons per family. On the other hand, married-couple families (8,245 | 75.4%) represent the smallest median family size with 2.87 persons per family.
| Family Type | # Families | Family Size |
| Married-Couple | 8,245 (75.4%) | 2.87 |
| Single Male/Father | 803 (7.3%) | 3.01 |
| Single Female/Mother | 1,880 (17.2%) | 3.29 |
| Total Families | 10,928 (100.0%) | 2.95 |
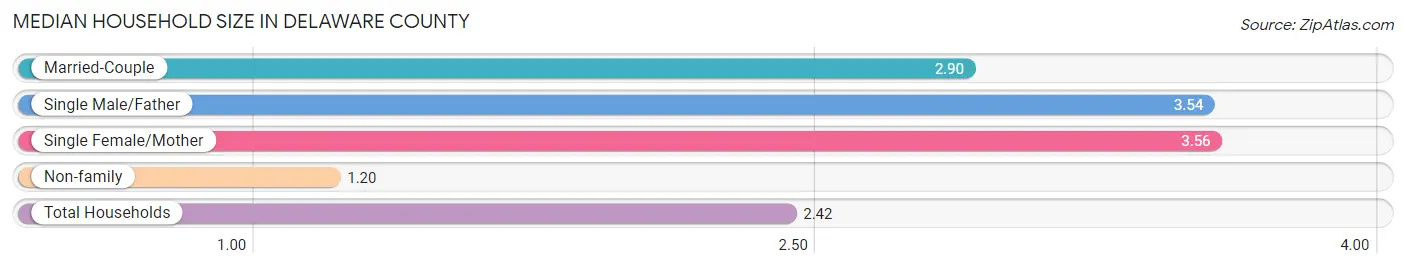
Median Household Size in Delaware County
The median household size in Delaware County is 2.42 persons per household, with single female/mother households (1,880 | 11.3%) accounting for the largest median household size of 3.56 persons per household. non-family households (5,692 | 34.3%) represent the smallest median household size with 1.20 persons per household.
| Household Type | # Households | Household Size |
| Married-Couple | 8,245 (49.6%) | 2.90 |
| Single Male/Father | 803 (4.8%) | 3.54 |
| Single Female/Mother | 1,880 (11.3%) | 3.56 |
| Non-family | 5,692 (34.3%) | 1.20 |
| Total Households | 16,620 (100.0%) | 2.42 |
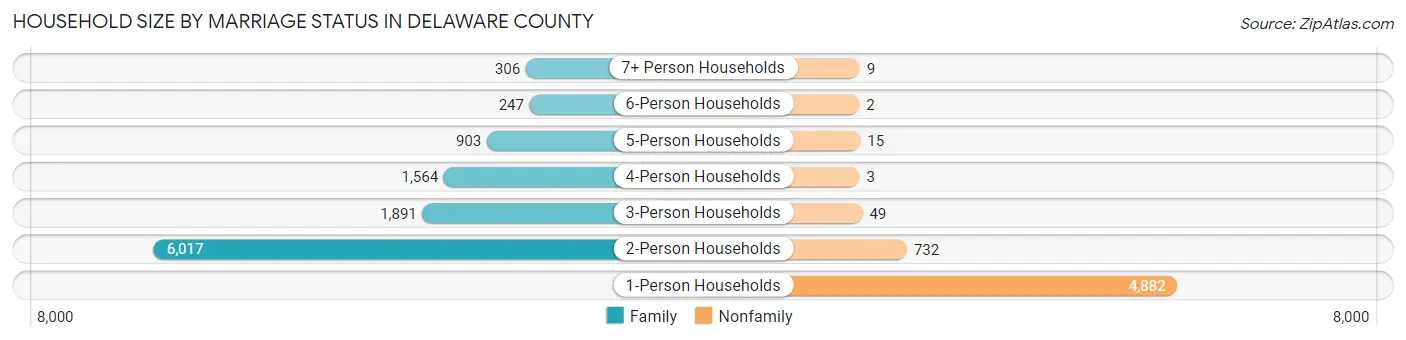
Household Size by Marriage Status in Delaware County
Out of a total of 16,620 households in Delaware County, 10,928 (65.7%) are family households, while 5,692 (34.3%) are nonfamily households. The most numerous type of family households are 2-person households, comprising 6,017, and the most common type of nonfamily households are 1-person households, comprising 4,882.
| Household Size | Family Households | Nonfamily Households |
| 1-Person Households | - | 4,882 (29.4%) |
| 2-Person Households | 6,017 (36.2%) | 732 (4.4%) |
| 3-Person Households | 1,891 (11.4%) | 49 (0.3%) |
| 4-Person Households | 1,564 (9.4%) | 3 (0.0%) |
| 5-Person Households | 903 (5.4%) | 15 (0.1%) |
| 6-Person Households | 247 (1.5%) | 2 (0.0%) |
| 7+ Person Households | 306 (1.8%) | 9 (0.1%) |
| Total | 10,928 (65.7%) | 5,692 (34.3%) |
Female Fertility in Delaware County
Fertility by Age in Delaware County
Average fertility rate in Delaware County is 57.0 births per 1,000 women. Women in the age bracket of 20 to 34 years have the highest fertility rate with 114.0 births per 1,000 women. Women in the age bracket of 20 to 34 years acount for 78.9% of all women with births.
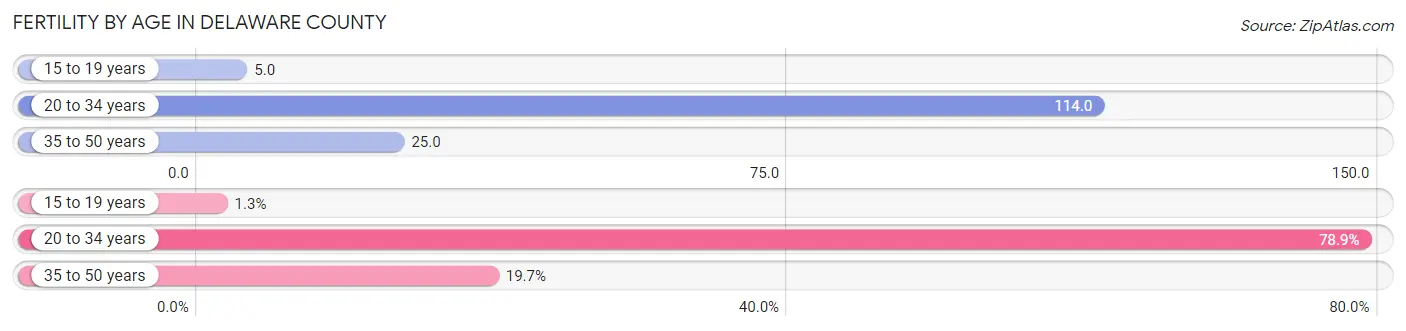
| Age Bracket | Women with Births | Births / 1,000 Women |
| 15 to 19 years | 6 (1.3%) | 5.0 |
| 20 to 34 years | 356 (78.9%) | 114.0 |
| 35 to 50 years | 89 (19.7%) | 25.0 |
| Total | 451 (100.0%) | 57.0 |
Fertility by Age by Marriage Status in Delaware County
66.5% of women with births (451) in Delaware County are married. The highest percentage of unmarried women with births falls into 15 to 19 years age bracket with 100.0% of them unmarried at the time of birth, while the lowest percentage of unmarried women with births belong to 20 to 34 years age bracket with 19.9% of them unmarried.
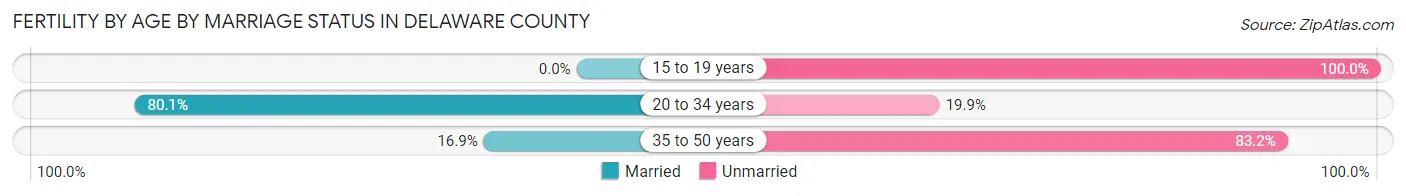
| Age Bracket | Married | Unmarried |
| 15 to 19 years | 0 (0.0%) | 6 (100.0%) |
| 20 to 34 years | 285 (80.1%) | 71 (19.9%) |
| 35 to 50 years | 15 (16.9%) | 74 (83.2%) |
| Total | 300 (66.5%) | 151 (33.5%) |
Fertility by Education in Delaware County
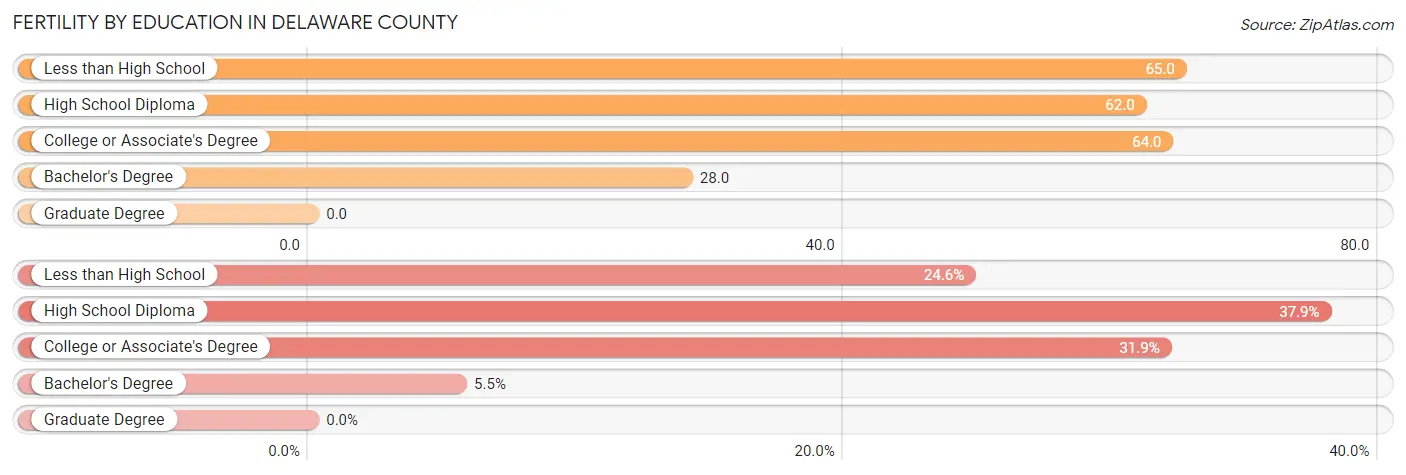
| Educational Attainment | Women with Births | Births / 1,000 Women |
| Less than High School | 111 (24.6%) | 65.0 |
| High School Diploma | 171 (37.9%) | 62.0 |
| College or Associate's Degree | 144 (31.9%) | 64.0 |
| Bachelor's Degree | 25 (5.5%) | 28.0 |
| Graduate Degree | 0 (0.0%) | 0.0 |
| Total | 451 (100.0%) | 57.0 |
Fertility by Education by Marriage Status in Delaware County
33.5% of women with births in Delaware County are unmarried. Women with the educational attainment of bachelor's degree are most likely to be married with 100.0% of them married at childbirth, while women with the educational attainment of high school diploma are least likely to be married with 49.7% of them unmarried at childbirth.
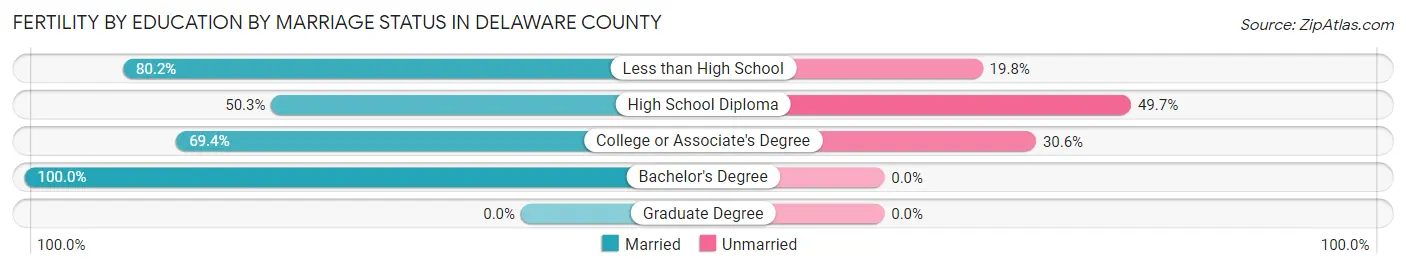
| Educational Attainment | Married | Unmarried |
| Less than High School | 89 (80.2%) | 22 (19.8%) |
| High School Diploma | 86 (50.3%) | 85 (49.7%) |
| College or Associate's Degree | 100 (69.4%) | 44 (30.6%) |
| Bachelor's Degree | 25 (100.0%) | 0 (0.0%) |
| Graduate Degree | 0 (0.0%) | 0 (0.0%) |
| Total | 300 (66.5%) | 151 (33.5%) |
Income in Delaware County
Income Overview in Delaware County
Per Capita Income in Delaware County is $34,489, while median incomes of families and households are $66,368 and $53,290 respectively.
| Characteristic | Number | Measure |
| Per Capita Income | 40,791 | $34,489 |
| Median Family Income | 10,928 | $66,368 |
| Mean Family Income | 10,928 | $86,311 |
| Median Household Income | 16,620 | $53,290 |
| Mean Household Income | 16,620 | $72,688 |
| Income Deficit | 10,928 | $11,587 |
| Wage / Income Gap (%) | 40,791 | 28.07% |
| Wage / Income Gap ($) | 40,791 | 71.93¢ per $1 |
| Gini / Inequality Index | 40,791 | 0.47 |
Earnings by Sex in Delaware County
Average Earnings in Delaware County are $31,603, $37,233 for men and $26,780 for women, a difference of 28.1%.
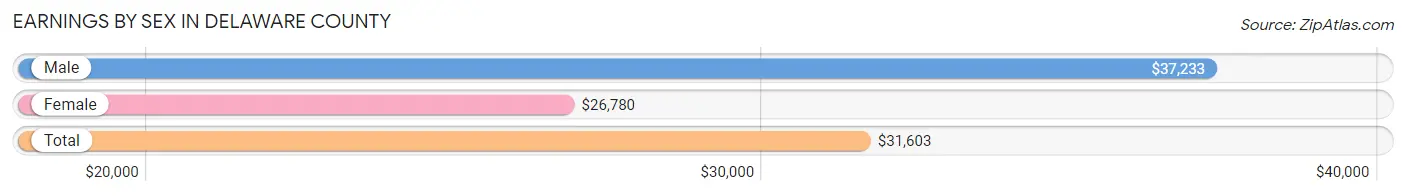
| Sex | Number | Average Earnings |
| Male | 9,457 (51.6%) | $37,233 |
| Female | 8,879 (48.4%) | $26,780 |
| Total | 18,336 (100.0%) | $31,603 |
Earnings by Sex by Income Bracket in Delaware County
The most common earnings brackets in Delaware County are $100,000+ for men (1,026 | 10.8%) and $25,000 to $29,999 for women (826 | 9.3%).
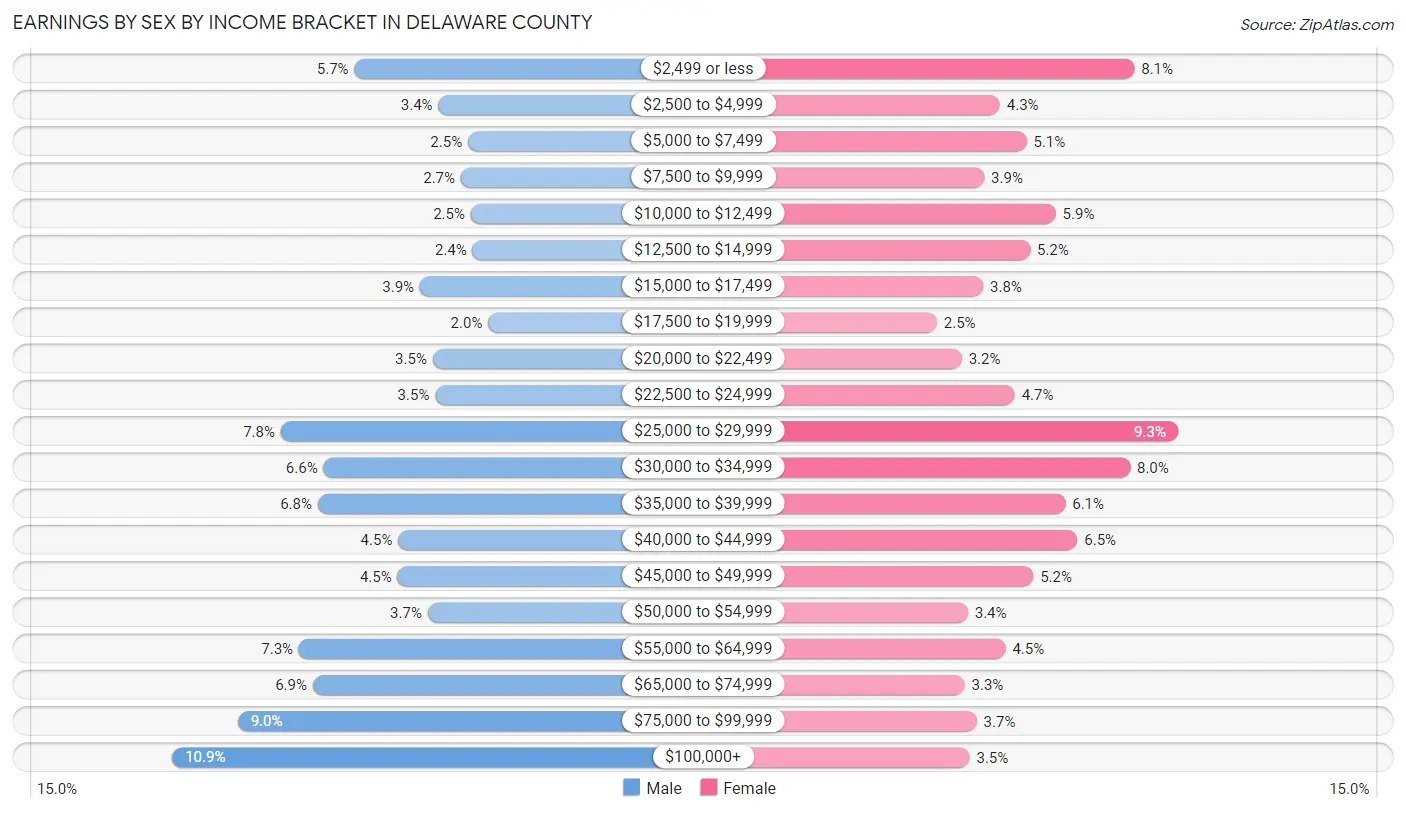
| Income | Male | Female |
| $2,499 or less | 542 (5.7%) | 717 (8.1%) |
| $2,500 to $4,999 | 319 (3.4%) | 382 (4.3%) |
| $5,000 to $7,499 | 240 (2.5%) | 448 (5.1%) |
| $7,500 to $9,999 | 259 (2.7%) | 343 (3.9%) |
| $10,000 to $12,499 | 233 (2.5%) | 521 (5.9%) |
| $12,500 to $14,999 | 228 (2.4%) | 457 (5.1%) |
| $15,000 to $17,499 | 368 (3.9%) | 340 (3.8%) |
| $17,500 to $19,999 | 186 (2.0%) | 225 (2.5%) |
| $20,000 to $22,499 | 334 (3.5%) | 287 (3.2%) |
| $22,500 to $24,999 | 327 (3.5%) | 419 (4.7%) |
| $25,000 to $29,999 | 738 (7.8%) | 826 (9.3%) |
| $30,000 to $34,999 | 624 (6.6%) | 707 (8.0%) |
| $35,000 to $39,999 | 639 (6.8%) | 545 (6.1%) |
| $40,000 to $44,999 | 426 (4.5%) | 575 (6.5%) |
| $45,000 to $49,999 | 427 (4.5%) | 465 (5.2%) |
| $50,000 to $54,999 | 347 (3.7%) | 302 (3.4%) |
| $55,000 to $64,999 | 689 (7.3%) | 396 (4.5%) |
| $65,000 to $74,999 | 653 (6.9%) | 294 (3.3%) |
| $75,000 to $99,999 | 852 (9.0%) | 324 (3.6%) |
| $100,000+ | 1,026 (10.8%) | 306 (3.5%) |
| Total | 9,457 (100.0%) | 8,879 (100.0%) |
Earnings by Sex by Educational Attainment in Delaware County
Average earnings in Delaware County are $41,597 for men and $29,207 for women, a difference of 29.8%. Men with an educational attainment of graduate degree enjoy the highest average annual earnings of $71,311, while those with less than high school education earn the least with $29,049. Women with an educational attainment of graduate degree earn the most with the average annual earnings of $57,522, while those with less than high school education have the smallest earnings of $19,671.
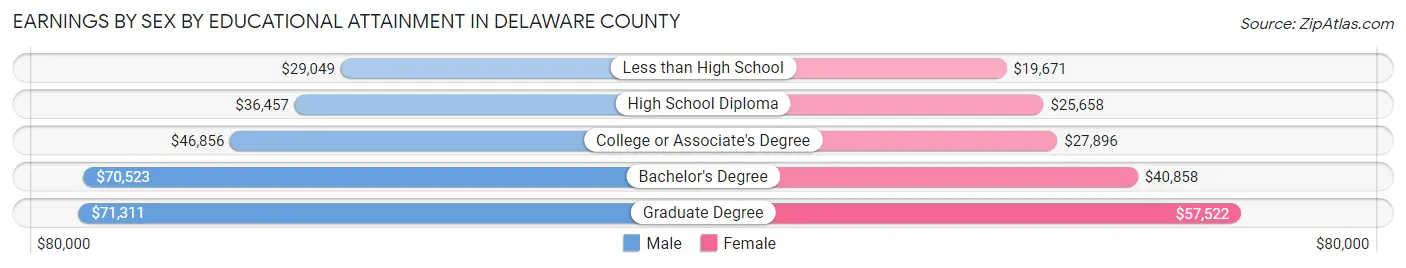
| Educational Attainment | Male Income | Female Income |
| Less than High School | $29,049 | $19,671 |
| High School Diploma | $36,457 | $25,658 |
| College or Associate's Degree | $46,856 | $27,896 |
| Bachelor's Degree | $70,523 | $40,858 |
| Graduate Degree | $71,311 | $57,522 |
| Total | $41,597 | $29,207 |
Family Income in Delaware County
Family Income Brackets in Delaware County
According to the Delaware County family income data, there are 2,470 families falling into the $50,000 to $74,999 income range, which is the most common income bracket and makes up 22.6% of all families. Conversely, the $10,000 to $14,999 income bracket is the least frequent group with only 372 families (3.4%) belonging to this category.
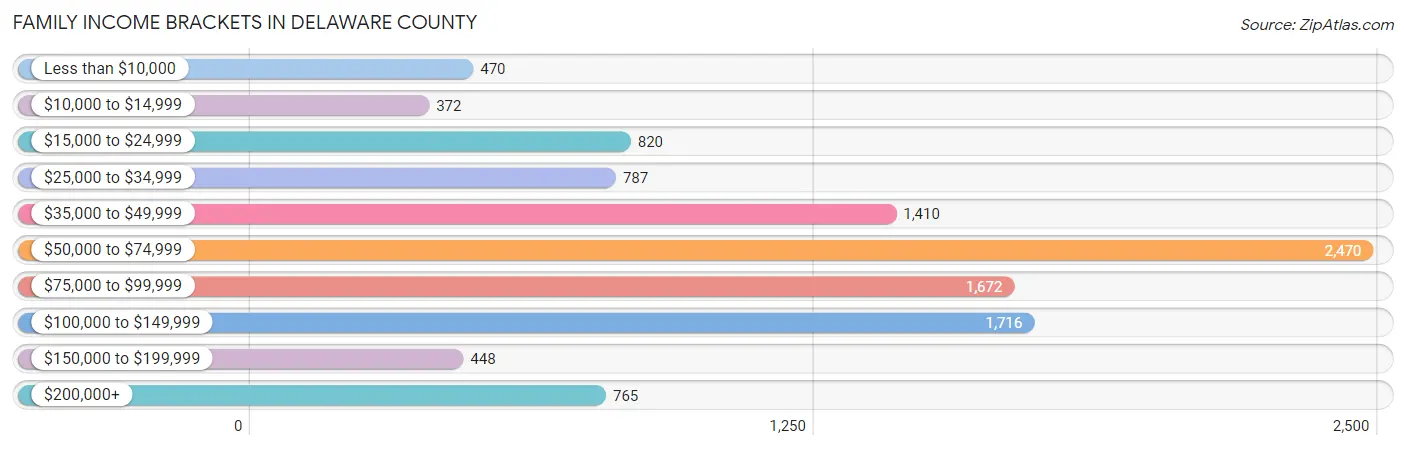
| Income Bracket | # Families | % Families |
| Less than $10,000 | 470 | 4.3% |
| $10,000 to $14,999 | 372 | 3.4% |
| $15,000 to $24,999 | 820 | 7.5% |
| $25,000 to $34,999 | 787 | 7.2% |
| $35,000 to $49,999 | 1,410 | 12.9% |
| $50,000 to $74,999 | 2,470 | 22.6% |
| $75,000 to $99,999 | 1,672 | 15.3% |
| $100,000 to $149,999 | 1,716 | 15.7% |
| $150,000 to $199,999 | 448 | 4.1% |
| $200,000+ | 765 | 7.0% |
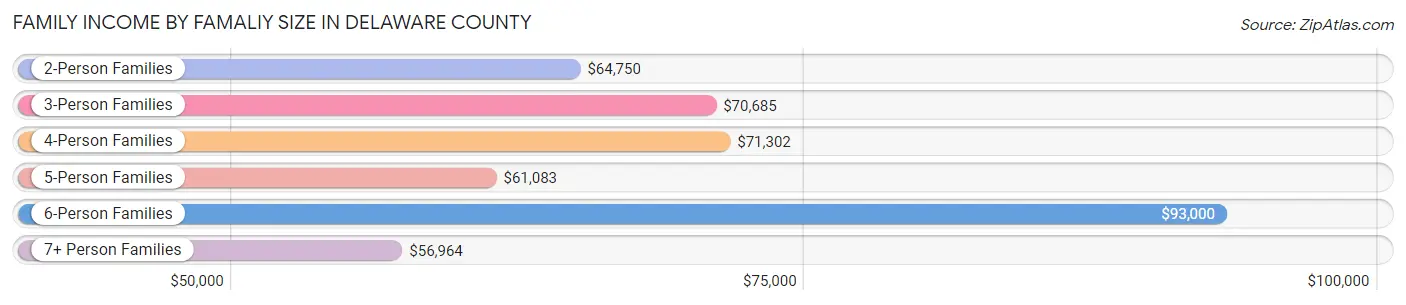
Family Income by Famaliy Size in Delaware County
6-person families (218 | 2.0%) account for the highest median family income in Delaware County with $93,000 per family, while 2-person families (6,337 | 58.0%) have the highest median income of $32,375 per family member.
| Income Bracket | # Families | Median Income |
| 2-Person Families | 6,337 (58.0%) | $64,750 |
| 3-Person Families | 1,875 (17.2%) | $70,685 |
| 4-Person Families | 1,383 (12.7%) | $71,302 |
| 5-Person Families | 867 (7.9%) | $61,083 |
| 6-Person Families | 218 (2.0%) | $93,000 |
| 7+ Person Families | 248 (2.3%) | $56,964 |
| Total | 10,928 (100.0%) | $66,368 |
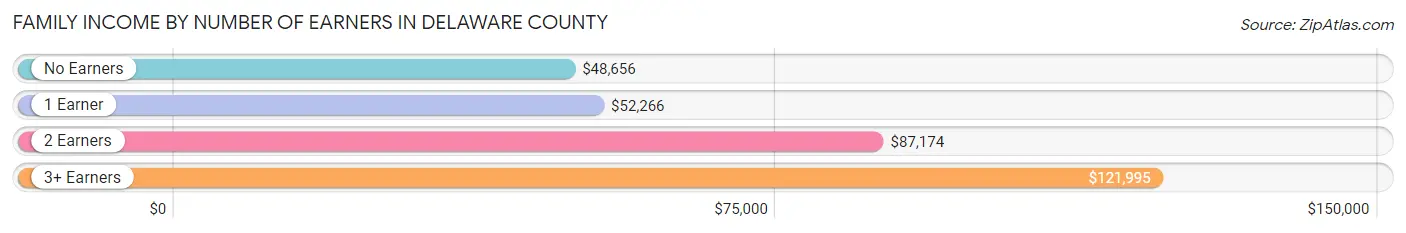
Family Income by Number of Earners in Delaware County
The median family income in Delaware County is $66,368, with families comprising 3+ earners (775) having the highest median family income of $121,995, while families with no earners (2,776) have the lowest median family income of $48,656, accounting for 7.1% and 25.4% of families, respectively.
| Number of Earners | # Families | Median Income |
| No Earners | 2,776 (25.4%) | $48,656 |
| 1 Earner | 3,557 (32.6%) | $52,266 |
| 2 Earners | 3,820 (35.0%) | $87,174 |
| 3+ Earners | 775 (7.1%) | $121,995 |
| Total | 10,928 (100.0%) | $66,368 |
Household Income in Delaware County
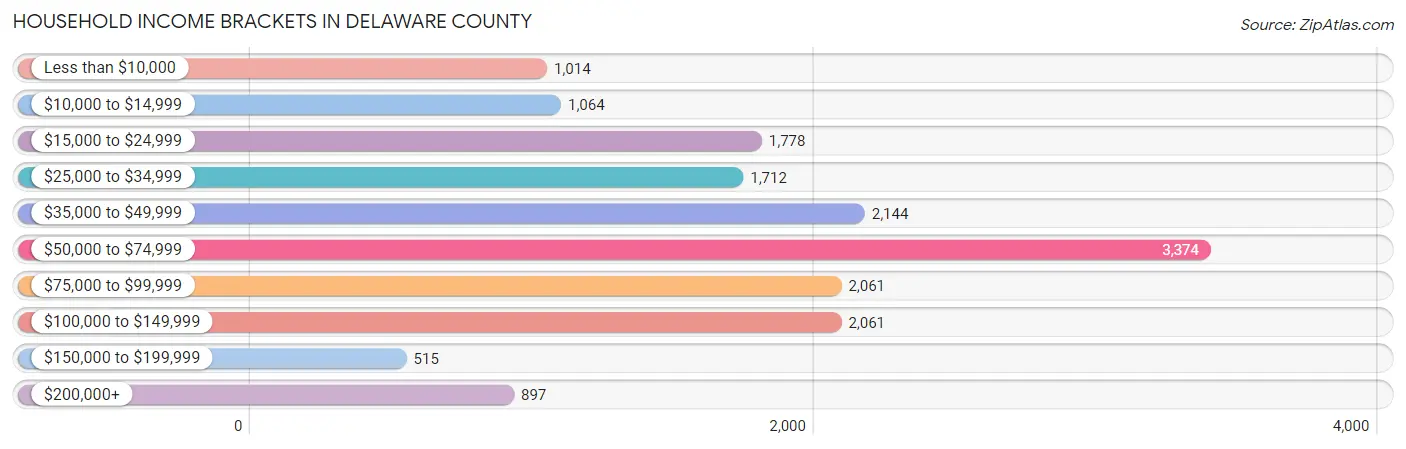
Household Income Brackets in Delaware County
With 3,374 households falling in the category, the $50,000 to $74,999 income range is the most frequent in Delaware County, accounting for 20.3% of all households. In contrast, only 515 households (3.1%) fall into the $150,000 to $199,999 income bracket, making it the least populous group.
| Income Bracket | # Households | % Households |
| Less than $10,000 | 1,014 | 6.1% |
| $10,000 to $14,999 | 1,064 | 6.4% |
| $15,000 to $24,999 | 1,778 | 10.7% |
| $25,000 to $34,999 | 1,712 | 10.3% |
| $35,000 to $49,999 | 2,144 | 12.9% |
| $50,000 to $74,999 | 3,374 | 20.3% |
| $75,000 to $99,999 | 2,061 | 12.4% |
| $100,000 to $149,999 | 2,061 | 12.4% |
| $150,000 to $199,999 | 515 | 3.1% |
| $200,000+ | 897 | 5.4% |
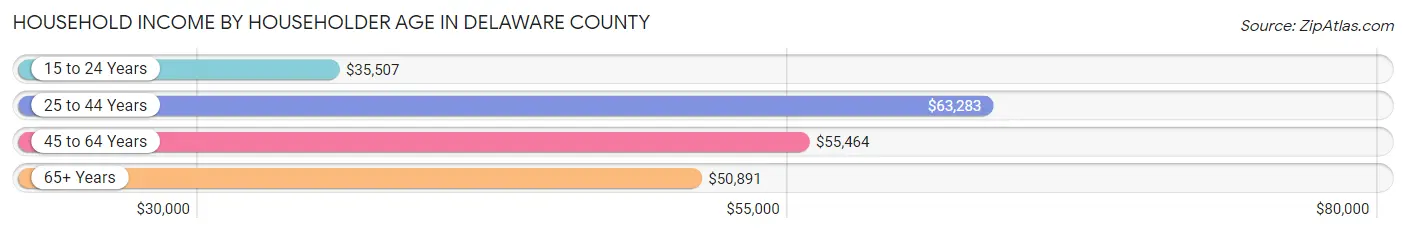
Household Income by Householder Age in Delaware County
The median household income in Delaware County is $53,290, with the highest median household income of $63,283 found in the 25 to 44 years age bracket for the primary householder. A total of 3,583 households (21.6%) fall into this category. Meanwhile, the 15 to 24 years age bracket for the primary householder has the lowest median household income of $35,507, with 509 households (3.1%) in this group.
| Income Bracket | # Households | Median Income |
| 15 to 24 Years | 509 (3.1%) | $35,507 |
| 25 to 44 Years | 3,583 (21.6%) | $63,283 |
| 45 to 64 Years | 5,840 (35.1%) | $55,464 |
| 65+ Years | 6,688 (40.2%) | $50,891 |
| Total | 16,620 (100.0%) | $53,290 |
Poverty in Delaware County
Income Below Poverty by Sex and Age in Delaware County
With 17.7% poverty level for males and 20.3% for females among the residents of Delaware County, 6 to 11 year old males and 15 year old females are the most vulnerable to poverty, with 501 males (38.6%) and 69 females (41.3%) in their respective age groups living below the poverty level.
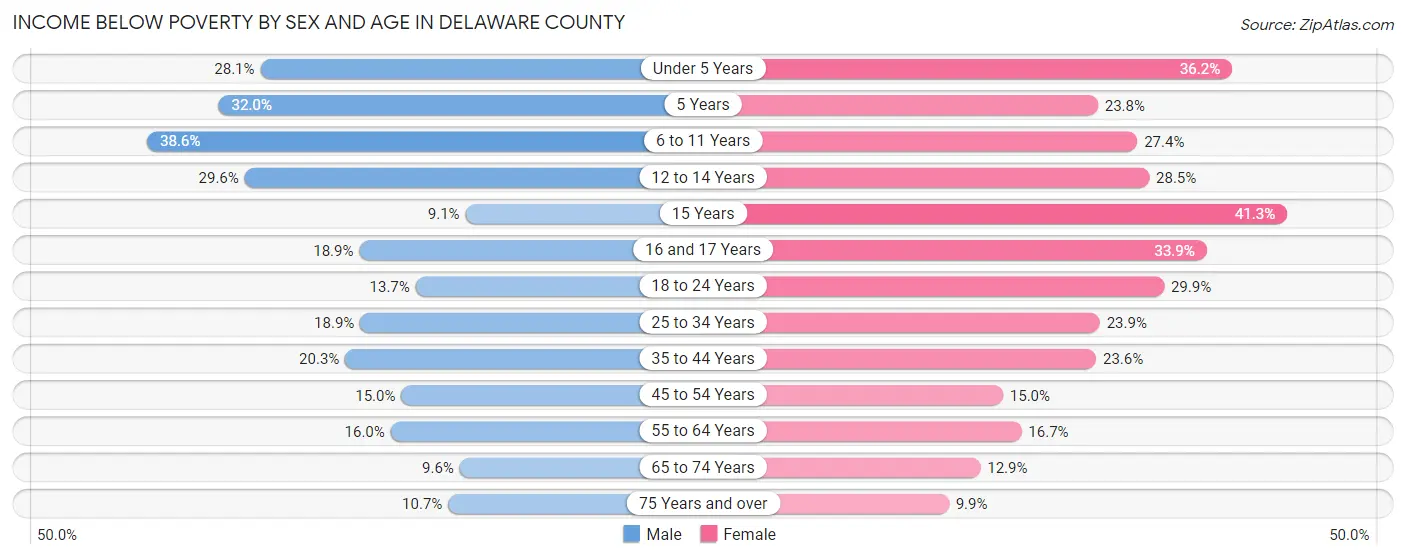
| Age Bracket | Male | Female |
| Under 5 Years | 284 (28.1%) | 336 (36.2%) |
| 5 Years | 64 (32.0%) | 72 (23.8%) |
| 6 to 11 Years | 501 (38.6%) | 334 (27.4%) |
| 12 to 14 Years | 223 (29.6%) | 170 (28.5%) |
| 15 Years | 26 (9.1%) | 69 (41.3%) |
| 16 and 17 Years | 82 (18.9%) | 197 (33.9%) |
| 18 to 24 Years | 202 (13.7%) | 432 (29.9%) |
| 25 to 34 Years | 397 (18.9%) | 504 (23.9%) |
| 35 to 44 Years | 419 (20.3%) | 507 (23.6%) |
| 45 to 54 Years | 364 (15.0%) | 358 (14.9%) |
| 55 to 64 Years | 485 (16.0%) | 533 (16.7%) |
| 65 to 74 Years | 271 (9.6%) | 392 (12.9%) |
| 75 Years and over | 216 (10.7%) | 209 (9.9%) |
| Total | 3,534 (17.7%) | 4,113 (20.3%) |
Income Above Poverty by Sex and Age in Delaware County
According to the poverty statistics in Delaware County, males aged 15 years and females aged 75 years and over are the age groups that are most secure financially, with 90.9% of males and 90.1% of females in these age groups living above the poverty line.
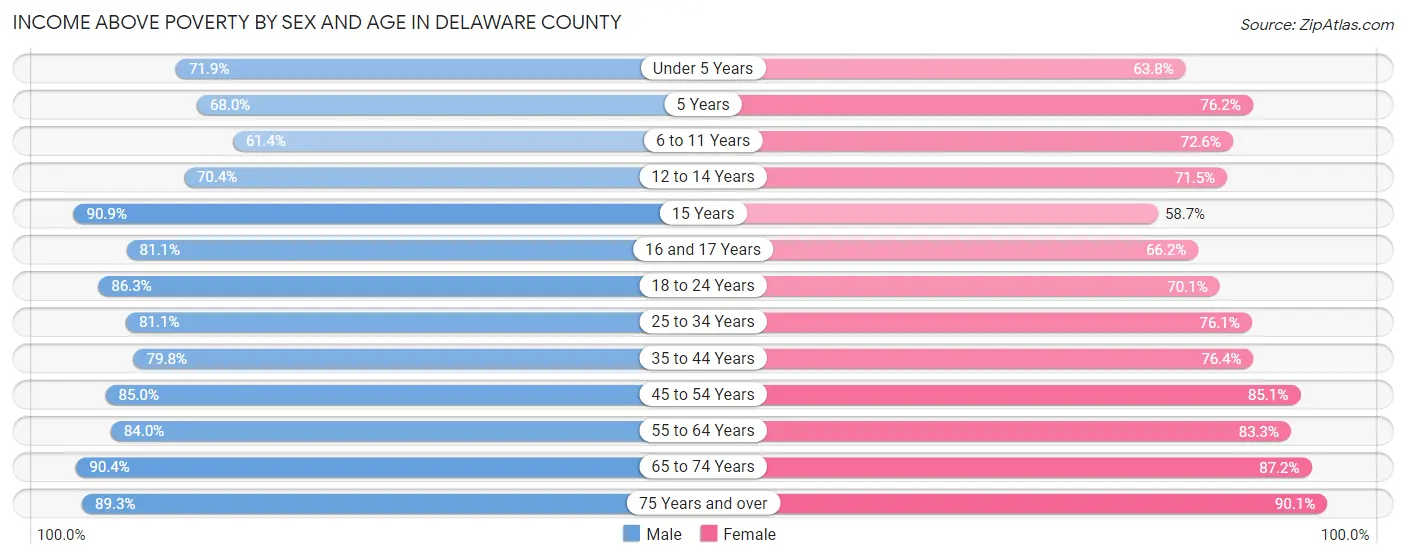
| Age Bracket | Male | Female |
| Under 5 Years | 726 (71.9%) | 592 (63.8%) |
| 5 Years | 136 (68.0%) | 231 (76.2%) |
| 6 to 11 Years | 796 (61.4%) | 884 (72.6%) |
| 12 to 14 Years | 531 (70.4%) | 426 (71.5%) |
| 15 Years | 260 (90.9%) | 98 (58.7%) |
| 16 and 17 Years | 351 (81.1%) | 385 (66.1%) |
| 18 to 24 Years | 1,271 (86.3%) | 1,013 (70.1%) |
| 25 to 34 Years | 1,708 (81.1%) | 1,601 (76.1%) |
| 35 to 44 Years | 1,650 (79.7%) | 1,641 (76.4%) |
| 45 to 54 Years | 2,056 (85.0%) | 2,037 (85.1%) |
| 55 to 64 Years | 2,541 (84.0%) | 2,664 (83.3%) |
| 65 to 74 Years | 2,545 (90.4%) | 2,659 (87.2%) |
| 75 Years and over | 1,805 (89.3%) | 1,898 (90.1%) |
| Total | 16,376 (82.3%) | 16,129 (79.7%) |
Income Below Poverty Among Married-Couple Families in Delaware County
The poverty statistics for married-couple families in Delaware County show that 8.4% or 690 of the total 8,245 families live below the poverty line. Families with 3 or 4 children have the highest poverty rate of 27.2%, comprising of 154 families. On the other hand, families with no children have the lowest poverty rate of 4.9%, which includes 280 families.
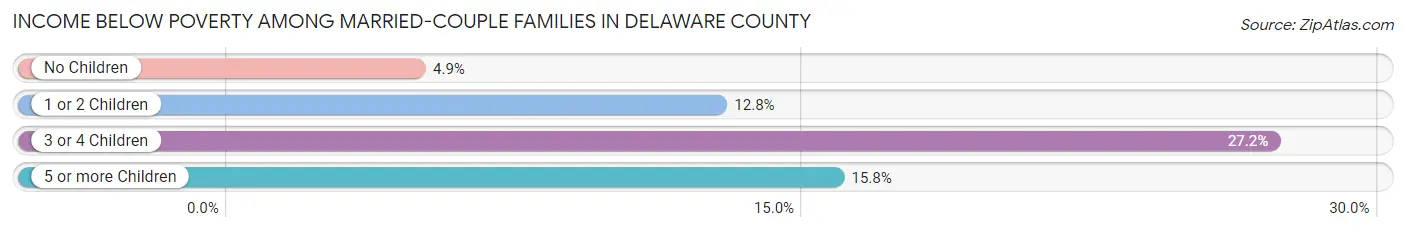
| Children | Above Poverty | Below Poverty |
| No Children | 5,420 (95.1%) | 280 (4.9%) |
| 1 or 2 Children | 1,638 (87.2%) | 240 (12.8%) |
| 3 or 4 Children | 412 (72.8%) | 154 (27.2%) |
| 5 or more Children | 85 (84.2%) | 16 (15.8%) |
| Total | 7,555 (91.6%) | 690 (8.4%) |
Income Below Poverty Among Single-Parent Households in Delaware County
According to the poverty data in Delaware County, 18.9% or 152 single-father households and 33.9% or 637 single-mother households are living below the poverty line. Among single-father households, those with 5 or more children have the highest poverty rate, with 6 households (100.0%) experiencing poverty. Likewise, among single-mother households, those with 5 or more children have the highest poverty rate, with 24 households (92.3%) falling below the poverty line.
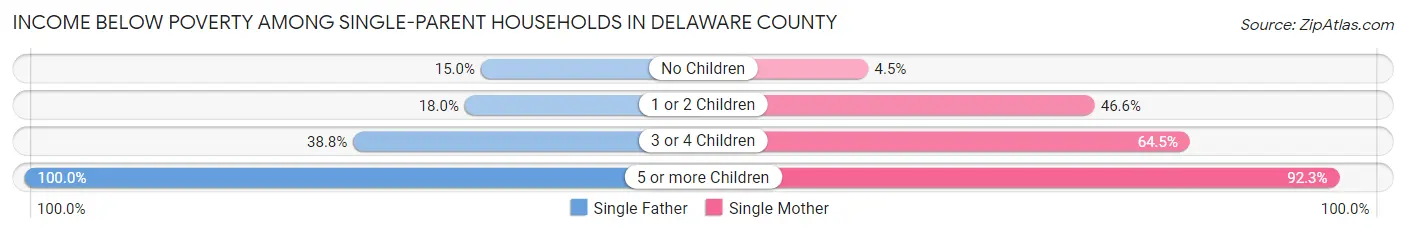
| Children | Single Father | Single Mother |
| No Children | 58 (15.0%) | 32 (4.5%) |
| 1 or 2 Children | 62 (18.0%) | 396 (46.6%) |
| 3 or 4 Children | 26 (38.8%) | 185 (64.5%) |
| 5 or more Children | 6 (100.0%) | 24 (92.3%) |
| Total | 152 (18.9%) | 637 (33.9%) |
Income Below Poverty Among Married-Couple vs Single-Parent Households in Delaware County
The poverty data for Delaware County shows that 690 of the married-couple family households (8.4%) and 789 of the single-parent households (29.4%) are living below the poverty level. Within the married-couple family households, those with 3 or 4 children have the highest poverty rate, with 154 households (27.2%) falling below the poverty line. Among the single-parent households, those with 5 or more children have the highest poverty rate, with 30 household (93.8%) living below poverty.
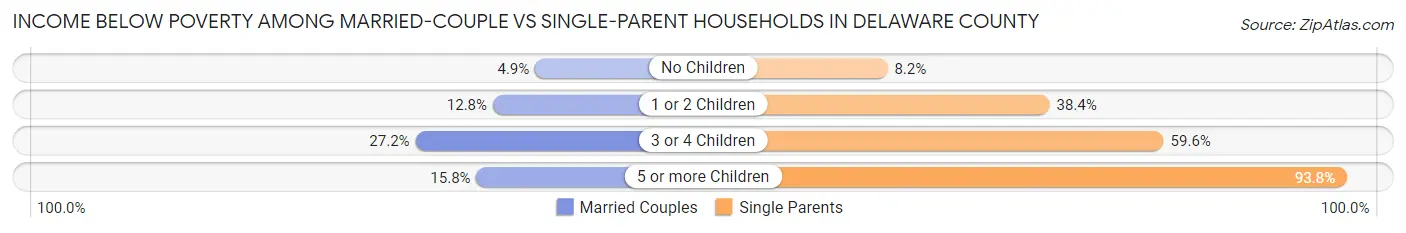
| Children | Married-Couple Families | Single-Parent Households |
| No Children | 280 (4.9%) | 90 (8.2%) |
| 1 or 2 Children | 240 (12.8%) | 458 (38.4%) |
| 3 or 4 Children | 154 (27.2%) | 211 (59.6%) |
| 5 or more Children | 16 (15.8%) | 30 (93.8%) |
| Total | 690 (8.4%) | 789 (29.4%) |
Employment Characteristics in Delaware County
Employment by Class of Employer in Delaware County
Among the 15,849 employed individuals in Delaware County, private company employees (9,444 | 59.6%), self-employed (not incorporated) (1,670 | 10.5%), and local government employees (1,164 | 7.3%) make up the most common classes of employment.
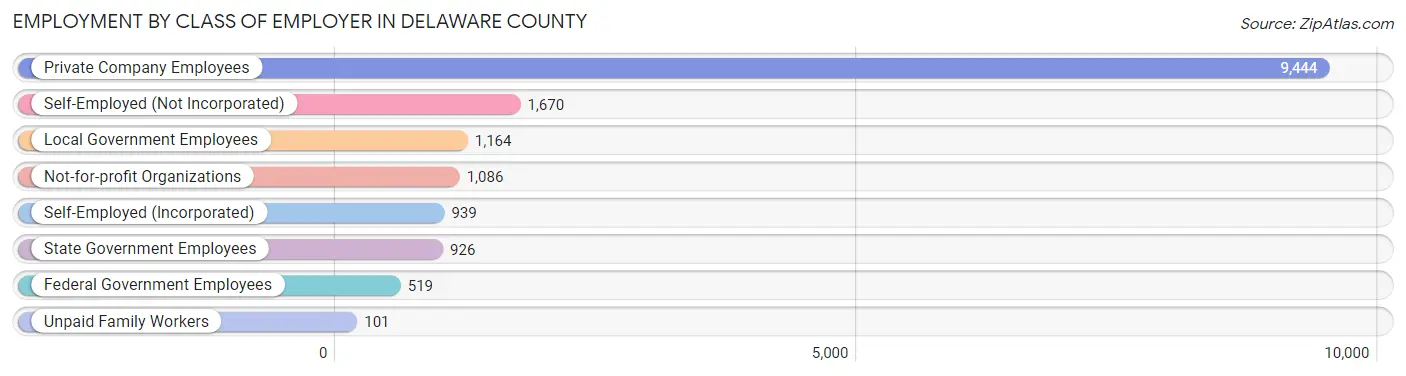
| Employer Class | # Employees | % Employees |
| Private Company Employees | 9,444 | 59.6% |
| Self-Employed (Incorporated) | 939 | 5.9% |
| Self-Employed (Not Incorporated) | 1,670 | 10.5% |
| Not-for-profit Organizations | 1,086 | 6.9% |
| Local Government Employees | 1,164 | 7.3% |
| State Government Employees | 926 | 5.8% |
| Federal Government Employees | 519 | 3.3% |
| Unpaid Family Workers | 101 | 0.6% |
| Total | 15,849 | 100.0% |
Employment Status by Age in Delaware County
According to the labor force statistics for Delaware County, out of the total population over 16 years of age (33,733), 50.3% or 16,968 individuals are in the labor force, with 5.2% or 882 of them unemployed. The age group with the highest labor force participation rate is 35 to 44 years, with 77.1% or 3,278 individuals in the labor force. Within the labor force, the 16 to 19 years age range has the highest percentage of unemployed individuals, with 11.6% or 86 of them being unemployed.
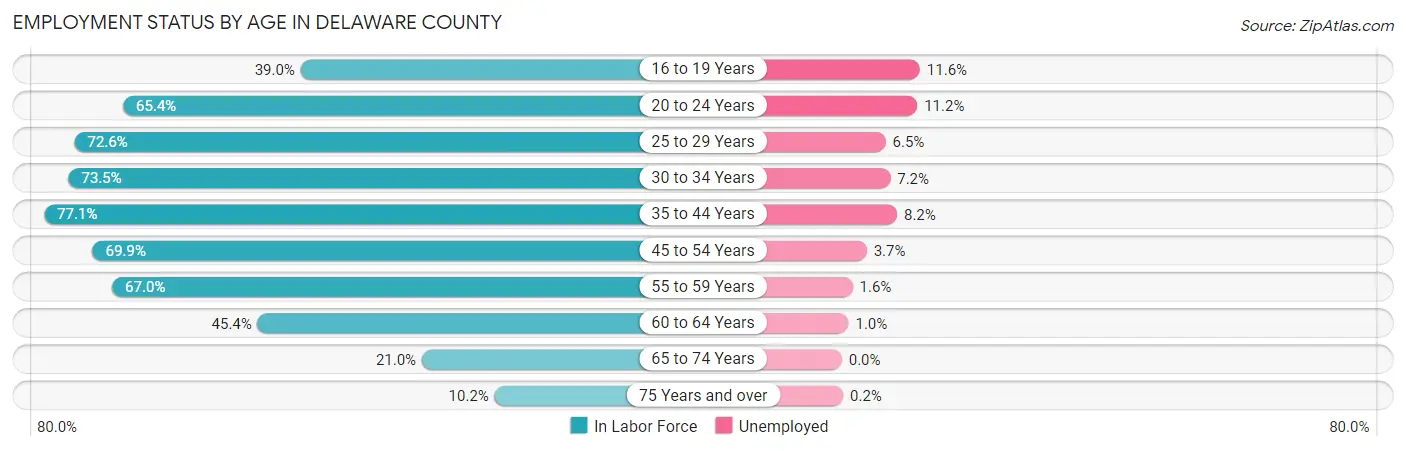
| Age Bracket | In Labor Force | Unemployed |
| 16 to 19 Years | 743 (39.0%) | 86 (11.6%) |
| 20 to 24 Years | 1,355 (65.4%) | 152 (11.2%) |
| 25 to 29 Years | 1,548 (72.6%) | 101 (6.5%) |
| 30 to 34 Years | 1,538 (73.5%) | 111 (7.2%) |
| 35 to 44 Years | 3,278 (77.1%) | 269 (8.2%) |
| 45 to 54 Years | 3,376 (69.9%) | 125 (3.7%) |
| 55 to 59 Years | 1,889 (67.0%) | 30 (1.6%) |
| 60 to 64 Years | 1,566 (45.4%) | 16 (1.0%) |
| 65 to 74 Years | 1,242 (21.0%) | 0 (0.0%) |
| 75 Years and over | 435 (10.2%) | 1 (0.2%) |
| Total | 16,968 (50.3%) | 882 (5.2%) |
Employment Status by Educational Attainment in Delaware County
According to labor force statistics for Delaware County, 67.4% of individuals (13,193) out of the total population between 25 and 64 years of age (19,574) are in the labor force, with 4.9% or 646 of them being unemployed. The group with the highest labor force participation rate are those with the educational attainment of bachelor's degree or higher, with 80.4% or 2,788 individuals in the labor force. Within the labor force, individuals with less than high school education have the highest percentage of unemployment, with 8.1% or 105 of them being unemployed.
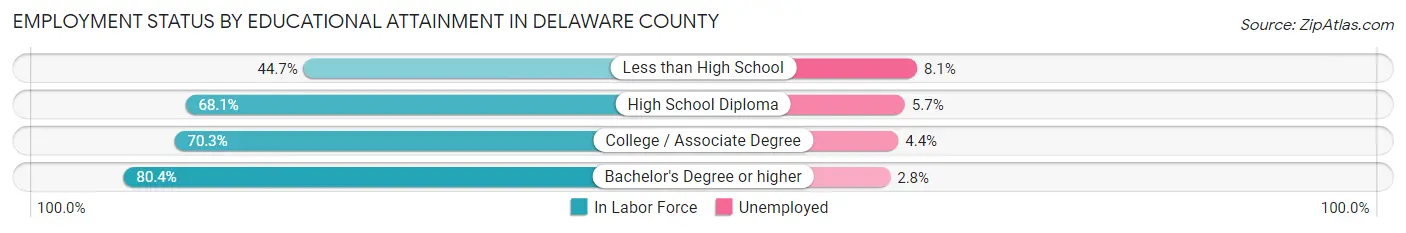
| Educational Attainment | In Labor Force | Unemployed |
| Less than High School | 1,302 (44.7%) | 236 (8.1%) |
| High School Diploma | 5,140 (68.1%) | 430 (5.7%) |
| College / Associate Degree | 3,969 (70.3%) | 248 (4.4%) |
| Bachelor's Degree or higher | 2,788 (80.4%) | 97 (2.8%) |
| Total | 13,193 (67.4%) | 959 (4.9%) |
Employment Occupations by Sex in Delaware County
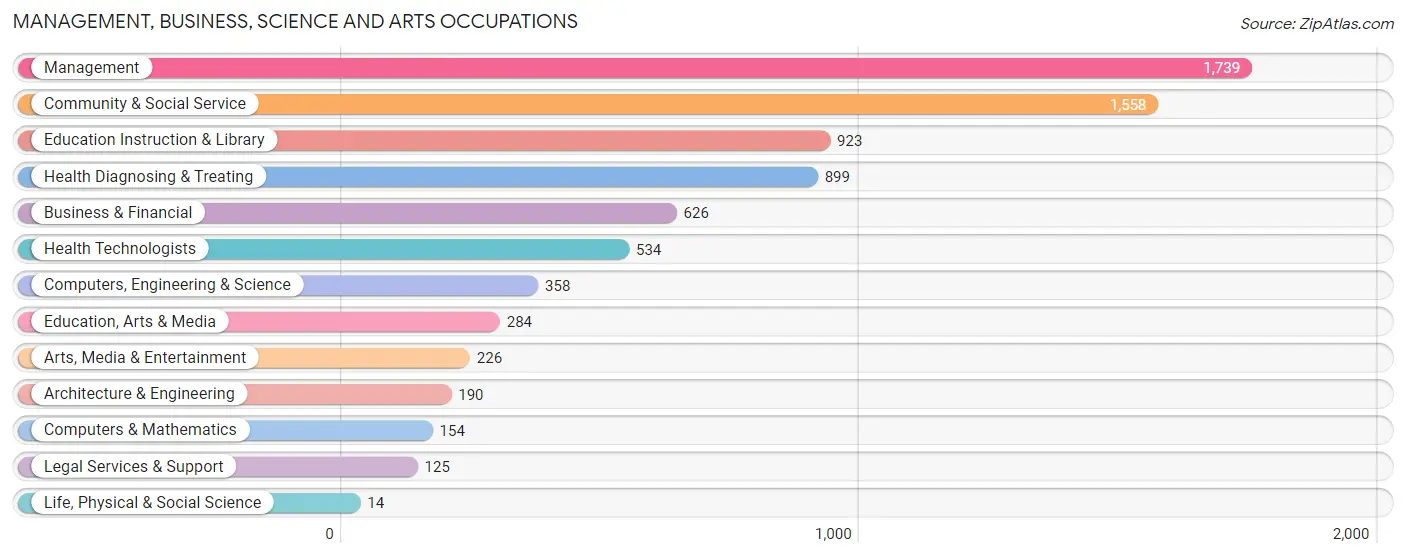
Management, Business, Science and Arts Occupations
The most common Management, Business, Science and Arts occupations in Delaware County are Management (1,739 | 10.8%), Community & Social Service (1,558 | 9.7%), Education Instruction & Library (923 | 5.7%), Health Diagnosing & Treating (899 | 5.6%), and Business & Financial (626 | 3.9%).
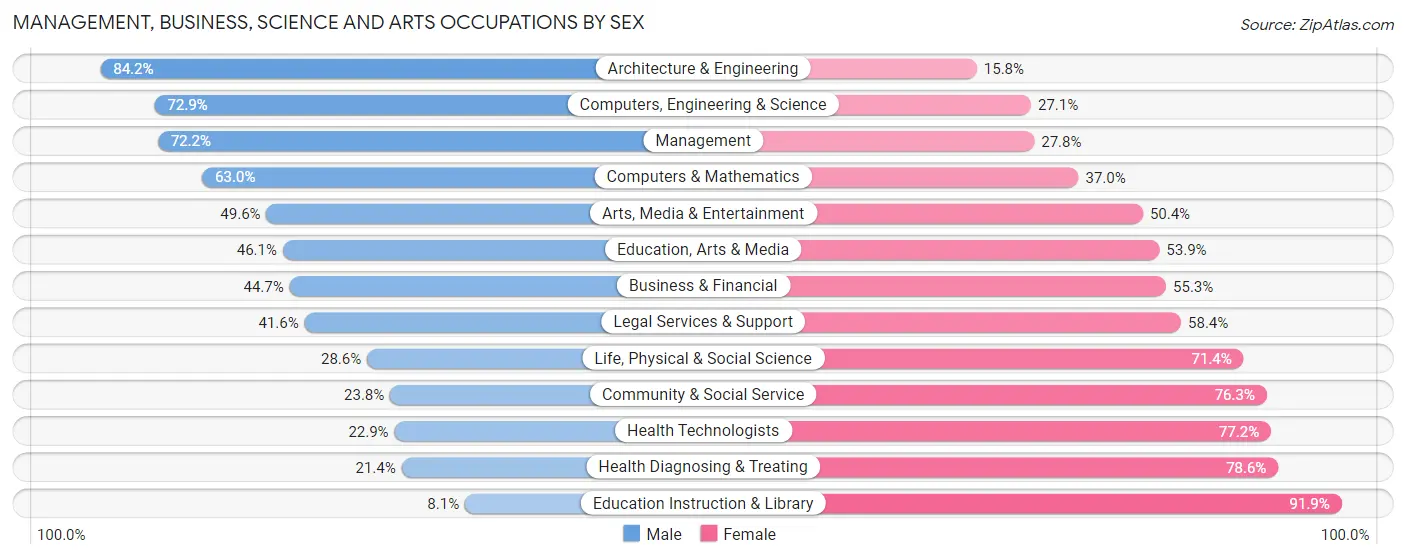
Management, Business, Science and Arts Occupations by Sex
Within the Management, Business, Science and Arts occupations in Delaware County, the most male-oriented occupations are Architecture & Engineering (84.2%), Computers, Engineering & Science (72.9%), and Management (72.2%), while the most female-oriented occupations are Education Instruction & Library (91.9%), Health Diagnosing & Treating (78.6%), and Health Technologists (77.1%).
| Occupation | Male | Female |
| Management | 1,256 (72.2%) | 483 (27.8%) |
| Business & Financial | 280 (44.7%) | 346 (55.3%) |
| Computers, Engineering & Science | 261 (72.9%) | 97 (27.1%) |
| Computers & Mathematics | 97 (63.0%) | 57 (37.0%) |
| Architecture & Engineering | 160 (84.2%) | 30 (15.8%) |
| Life, Physical & Social Science | 4 (28.6%) | 10 (71.4%) |
| Community & Social Service | 370 (23.7%) | 1,188 (76.2%) |
| Education, Arts & Media | 131 (46.1%) | 153 (53.9%) |
| Legal Services & Support | 52 (41.6%) | 73 (58.4%) |
| Education Instruction & Library | 75 (8.1%) | 848 (91.9%) |
| Arts, Media & Entertainment | 112 (49.6%) | 114 (50.4%) |
| Health Diagnosing & Treating | 192 (21.4%) | 707 (78.6%) |
| Health Technologists | 122 (22.9%) | 412 (77.1%) |
| Total (Category) | 2,359 (45.5%) | 2,821 (54.5%) |
| Total (Overall) | 8,264 (51.4%) | 7,812 (48.6%) |
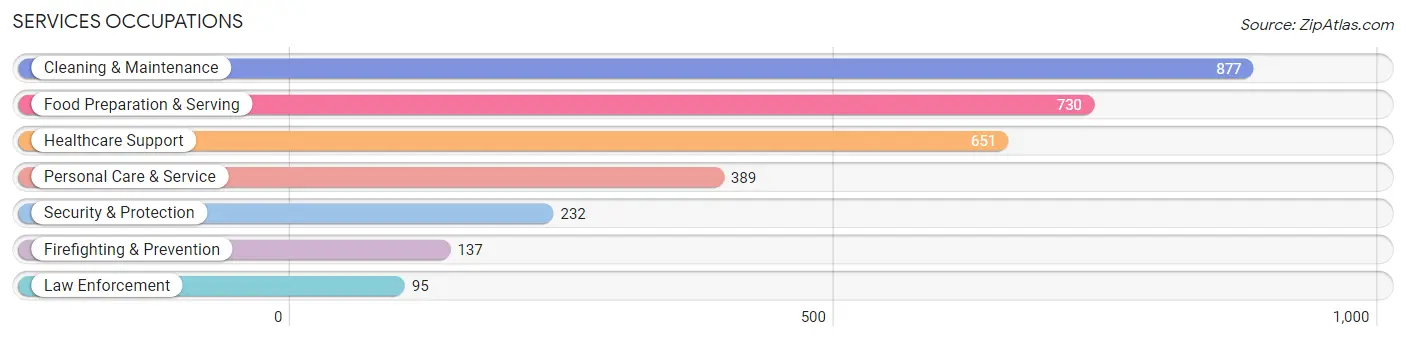
Services Occupations
The most common Services occupations in Delaware County are Cleaning & Maintenance (877 | 5.5%), Food Preparation & Serving (730 | 4.5%), Healthcare Support (651 | 4.1%), Personal Care & Service (389 | 2.4%), and Security & Protection (232 | 1.4%).
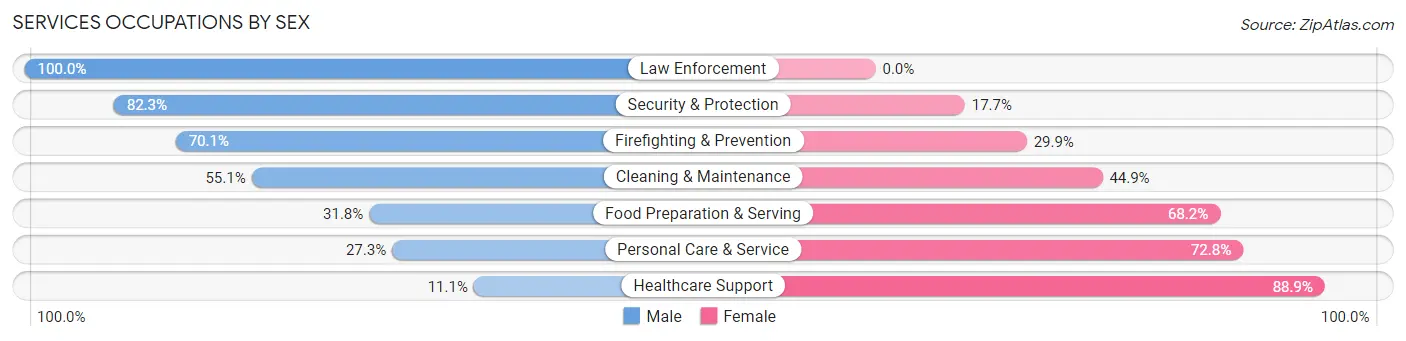
Services Occupations by Sex
Within the Services occupations in Delaware County, the most male-oriented occupations are Law Enforcement (100.0%), Security & Protection (82.3%), and Firefighting & Prevention (70.1%), while the most female-oriented occupations are Healthcare Support (88.9%), Personal Care & Service (72.8%), and Food Preparation & Serving (68.2%).
| Occupation | Male | Female |
| Healthcare Support | 72 (11.1%) | 579 (88.9%) |
| Security & Protection | 191 (82.3%) | 41 (17.7%) |
| Firefighting & Prevention | 96 (70.1%) | 41 (29.9%) |
| Law Enforcement | 95 (100.0%) | 0 (0.0%) |
| Food Preparation & Serving | 232 (31.8%) | 498 (68.2%) |
| Cleaning & Maintenance | 483 (55.1%) | 394 (44.9%) |
| Personal Care & Service | 106 (27.3%) | 283 (72.8%) |
| Total (Category) | 1,084 (37.7%) | 1,795 (62.4%) |
| Total (Overall) | 8,264 (51.4%) | 7,812 (48.6%) |
Sales and Office Occupations
The most common Sales and Office occupations in Delaware County are Office & Administration (1,912 | 11.9%), and Sales & Related (1,447 | 9.0%).

Sales and Office Occupations by Sex

| Occupation | Male | Female |
| Sales & Related | 650 (44.9%) | 797 (55.1%) |
| Office & Administration | 257 (13.4%) | 1,655 (86.6%) |
| Total (Category) | 907 (27.0%) | 2,452 (73.0%) |
| Total (Overall) | 8,264 (51.4%) | 7,812 (48.6%) |
Natural Resources, Construction and Maintenance Occupations
The most common Natural Resources, Construction and Maintenance occupations in Delaware County are Construction & Extraction (1,137 | 7.1%), Installation, Maintenance & Repair (678 | 4.2%), and Farming, Fishing & Forestry (218 | 1.4%).

Natural Resources, Construction and Maintenance Occupations by Sex
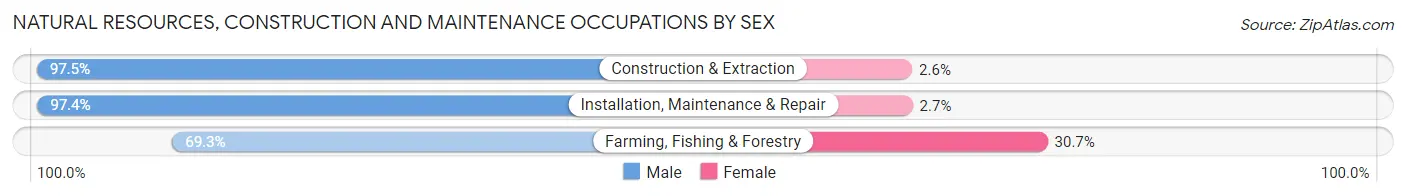
| Occupation | Male | Female |
| Farming, Fishing & Forestry | 151 (69.3%) | 67 (30.7%) |
| Construction & Extraction | 1,108 (97.5%) | 29 (2.5%) |
| Installation, Maintenance & Repair | 660 (97.4%) | 18 (2.6%) |
| Total (Category) | 1,919 (94.4%) | 114 (5.6%) |
| Total (Overall) | 8,264 (51.4%) | 7,812 (48.6%) |
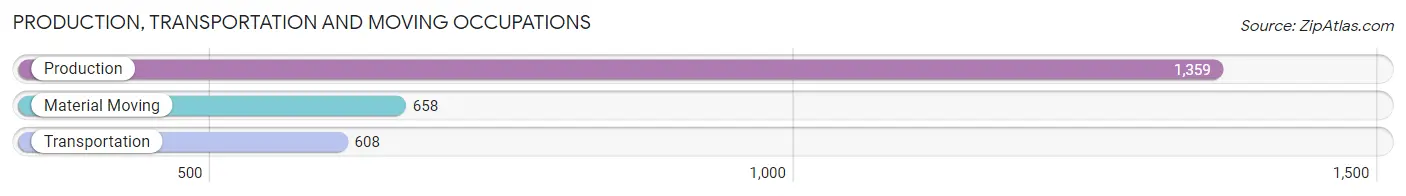
Production, Transportation and Moving Occupations
The most common Production, Transportation and Moving occupations in Delaware County are Production (1,359 | 8.5%), Material Moving (658 | 4.1%), and Transportation (608 | 3.8%).
Production, Transportation and Moving Occupations by Sex
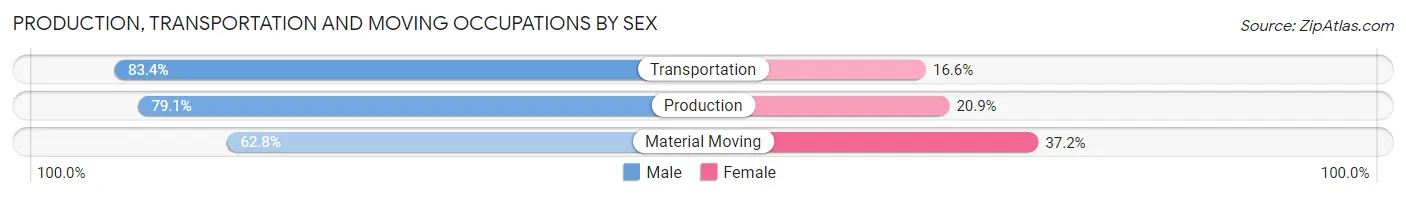
| Occupation | Male | Female |
| Production | 1,075 (79.1%) | 284 (20.9%) |
| Transportation | 507 (83.4%) | 101 (16.6%) |
| Material Moving | 413 (62.8%) | 245 (37.2%) |
| Total (Category) | 1,995 (76.0%) | 630 (24.0%) |
| Total (Overall) | 8,264 (51.4%) | 7,812 (48.6%) |
Employment Industries by Sex in Delaware County
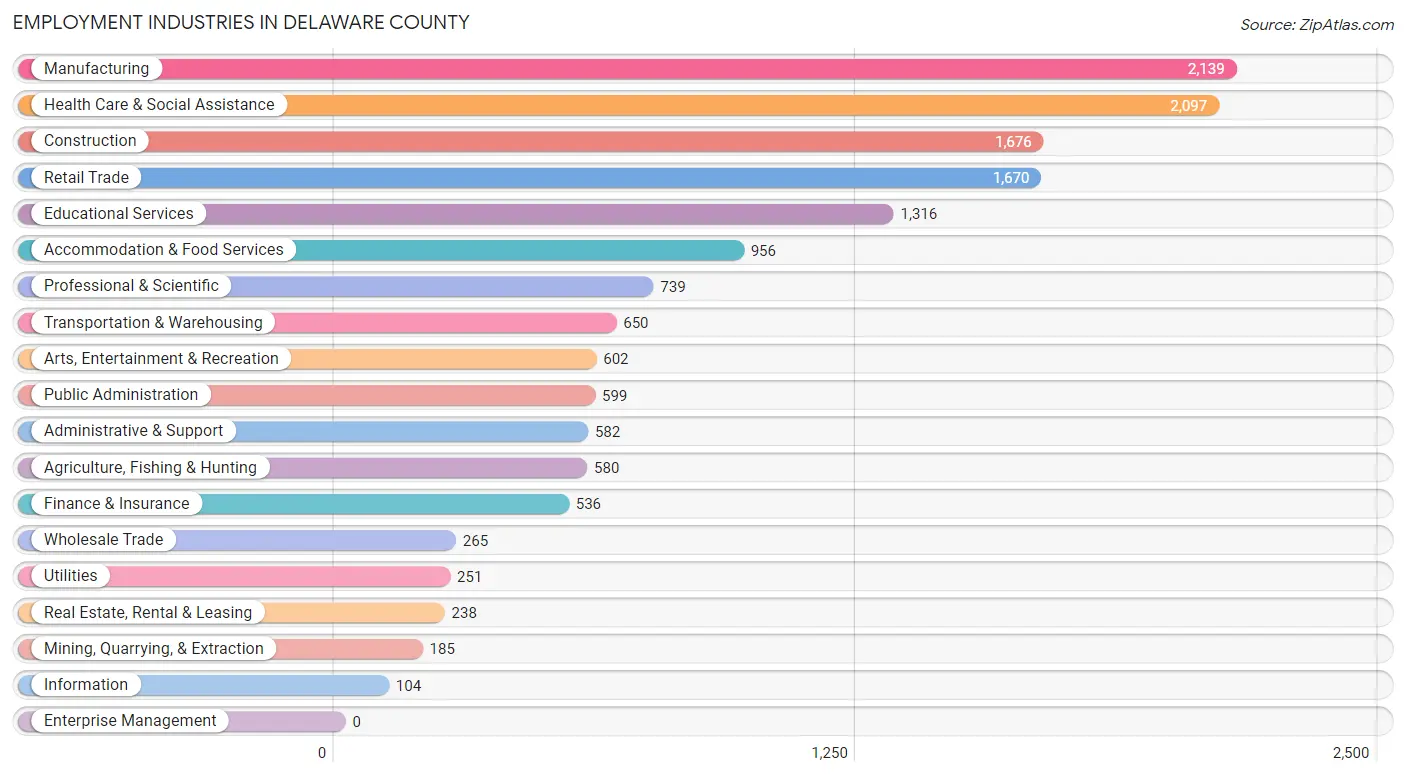
Employment Industries in Delaware County
The major employment industries in Delaware County include Manufacturing (2,139 | 13.3%), Health Care & Social Assistance (2,097 | 13.0%), Construction (1,676 | 10.4%), Retail Trade (1,670 | 10.4%), and Educational Services (1,316 | 8.2%).
Employment Industries by Sex in Delaware County
The Delaware County industries that see more men than women are Mining, Quarrying, & Extraction (87.6%), Construction (87.0%), and Utilities (86.5%), whereas the industries that tend to have a higher number of women are Health Care & Social Assistance (82.6%), Educational Services (79.9%), and Finance & Insurance (68.8%).
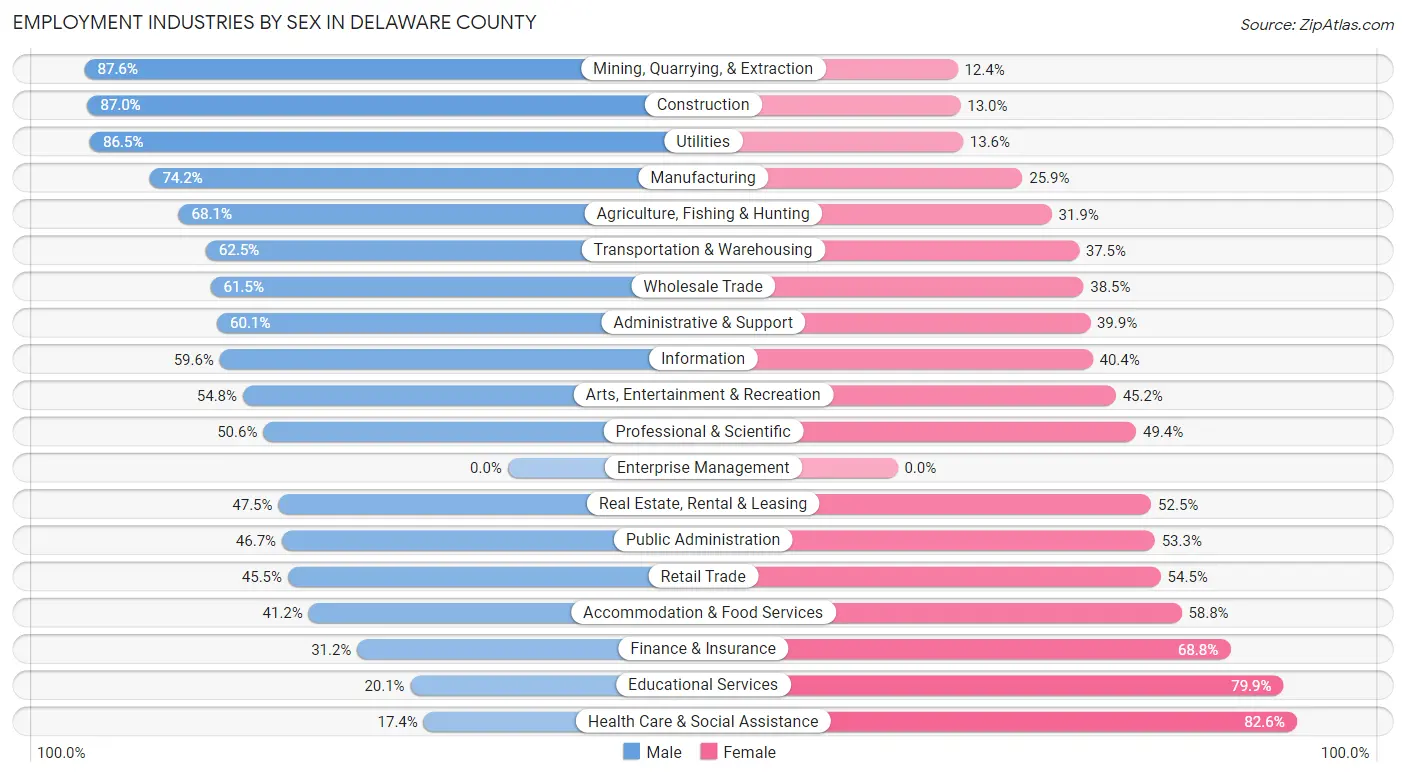
| Industry | Male | Female |
| Agriculture, Fishing & Hunting | 395 (68.1%) | 185 (31.9%) |
| Mining, Quarrying, & Extraction | 162 (87.6%) | 23 (12.4%) |
| Construction | 1,458 (87.0%) | 218 (13.0%) |
| Manufacturing | 1,586 (74.2%) | 553 (25.9%) |
| Wholesale Trade | 163 (61.5%) | 102 (38.5%) |
| Retail Trade | 760 (45.5%) | 910 (54.5%) |
| Transportation & Warehousing | 406 (62.5%) | 244 (37.5%) |
| Utilities | 217 (86.5%) | 34 (13.6%) |
| Information | 62 (59.6%) | 42 (40.4%) |
| Finance & Insurance | 167 (31.2%) | 369 (68.8%) |
| Real Estate, Rental & Leasing | 113 (47.5%) | 125 (52.5%) |
| Professional & Scientific | 374 (50.6%) | 365 (49.4%) |
| Enterprise Management | 0 (0.0%) | 0 (0.0%) |
| Administrative & Support | 350 (60.1%) | 232 (39.9%) |
| Educational Services | 265 (20.1%) | 1,051 (79.9%) |
| Health Care & Social Assistance | 365 (17.4%) | 1,732 (82.6%) |
| Arts, Entertainment & Recreation | 330 (54.8%) | 272 (45.2%) |
| Accommodation & Food Services | 394 (41.2%) | 562 (58.8%) |
| Public Administration | 280 (46.7%) | 319 (53.3%) |
| Total | 8,264 (51.4%) | 7,812 (48.6%) |
Education in Delaware County
School Enrollment in Delaware County
The most common levels of schooling among the 7,555 students in Delaware County are elementary school (1,901 | 25.2%), high school (1,865 | 24.7%), and middle school (1,732 | 22.9%).
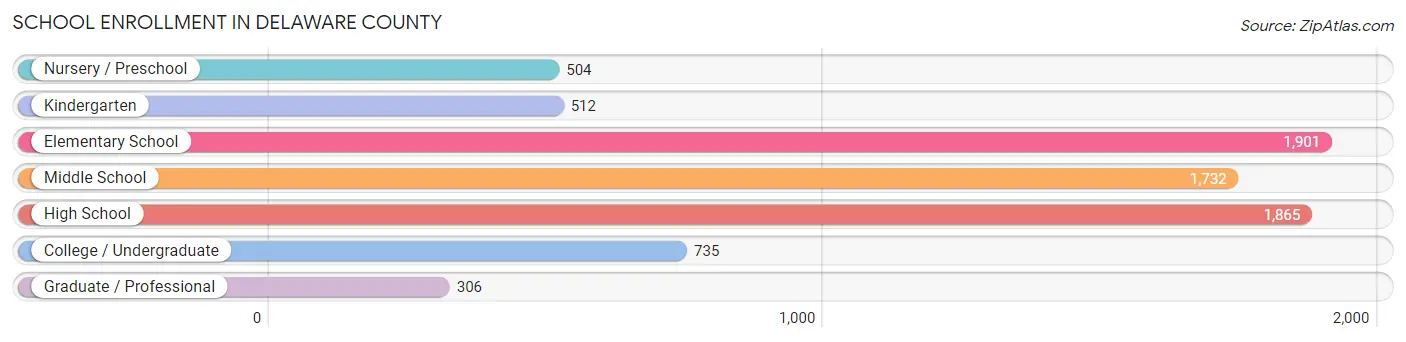
| School Level | # Students | % Students |
| Nursery / Preschool | 504 | 6.7% |
| Kindergarten | 512 | 6.8% |
| Elementary School | 1,901 | 25.2% |
| Middle School | 1,732 | 22.9% |
| High School | 1,865 | 24.7% |
| College / Undergraduate | 735 | 9.7% |
| Graduate / Professional | 306 | 4.1% |
| Total | 7,555 | 100.0% |
School Enrollment by Age by Funding Source in Delaware County
Out of a total of 7,555 students who are enrolled in schools in Delaware County, 846 (11.2%) attend a private institution, while the remaining 6,709 (88.8%) are enrolled in public schools. The age group of 35 years and over has the highest likelihood of being enrolled in private schools, with 58 (26.5% in the age bracket) enrolled. Conversely, the age group of 10 to 14 year olds has the lowest likelihood of being enrolled in a private school, with 1,978 (91.8% in the age bracket) attending a public institution.
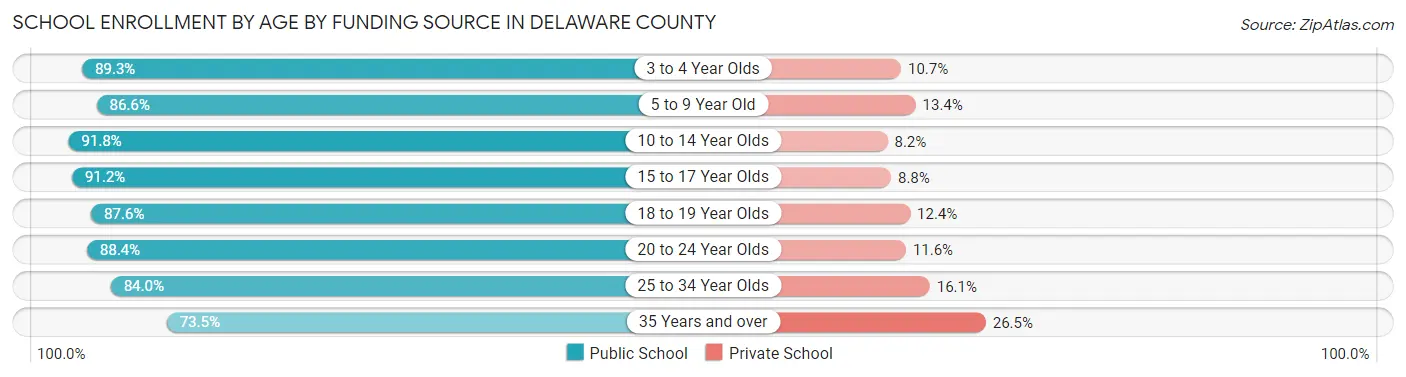
| Age Bracket | Public School | Private School |
| 3 to 4 Year Olds | 234 (89.3%) | 28 (10.7%) |
| 5 to 9 Year Old | 1,964 (86.6%) | 304 (13.4%) |
| 10 to 14 Year Olds | 1,978 (91.8%) | 176 (8.2%) |
| 15 to 17 Year Olds | 1,313 (91.2%) | 127 (8.8%) |
| 18 to 19 Year Olds | 411 (87.6%) | 58 (12.4%) |
| 20 to 24 Year Olds | 442 (88.4%) | 58 (11.6%) |
| 25 to 34 Year Olds | 204 (84.0%) | 39 (16.1%) |
| 35 Years and over | 161 (73.5%) | 58 (26.5%) |
| Total | 6,709 (88.8%) | 846 (11.2%) |
Educational Attainment by Field of Study in Delaware County
Education (1,456 | 24.6%), business (1,368 | 23.1%), arts & humanities (641 | 10.8%), science & technology (415 | 7.0%), and bio, nature & agricultural (341 | 5.8%) are the most common fields of study among 5,918 individuals in Delaware County who have obtained a bachelor's degree or higher.
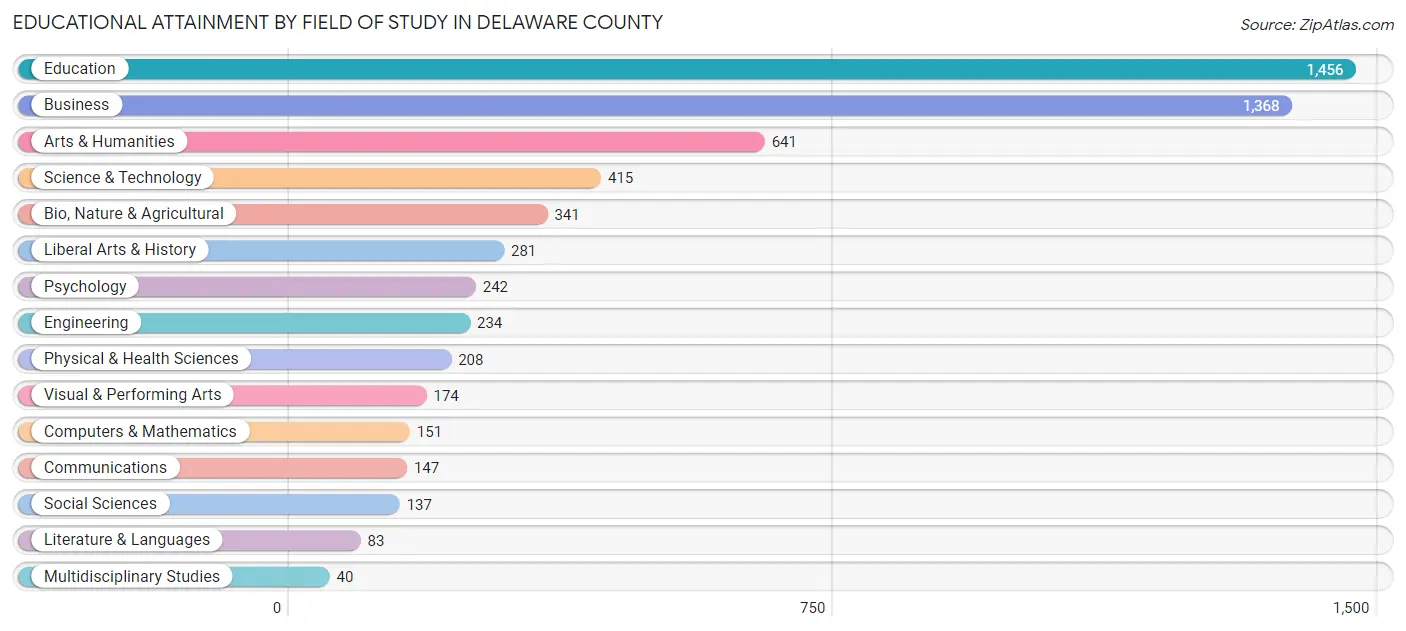
| Field of Study | # Graduates | % Graduates |
| Computers & Mathematics | 151 | 2.5% |
| Bio, Nature & Agricultural | 341 | 5.8% |
| Physical & Health Sciences | 208 | 3.5% |
| Psychology | 242 | 4.1% |
| Social Sciences | 137 | 2.3% |
| Engineering | 234 | 4.0% |
| Multidisciplinary Studies | 40 | 0.7% |
| Science & Technology | 415 | 7.0% |
| Business | 1,368 | 23.1% |
| Education | 1,456 | 24.6% |
| Literature & Languages | 83 | 1.4% |
| Liberal Arts & History | 281 | 4.8% |
| Visual & Performing Arts | 174 | 2.9% |
| Communications | 147 | 2.5% |
| Arts & Humanities | 641 | 10.8% |
| Total | 5,918 | 100.0% |
Transportation & Commute in Delaware County
Vehicle Availability by Sex in Delaware County
The most prevalent vehicle ownership categories in Delaware County are males with 2 vehicles (3,357, accounting for 41.2%) and females with 2 vehicles (2,971, making up 43.6%).
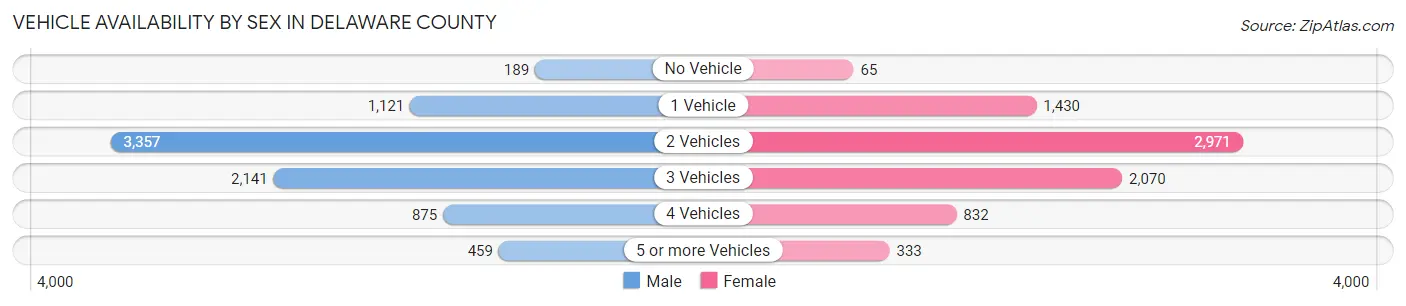
| Vehicles Available | Male | Female |
| No Vehicle | 189 (2.3%) | 65 (0.8%) |
| 1 Vehicle | 1,121 (13.8%) | 1,430 (18.6%) |
| 2 Vehicles | 3,357 (41.2%) | 2,971 (38.6%) |
| 3 Vehicles | 2,141 (26.3%) | 2,070 (26.9%) |
| 4 Vehicles | 875 (10.7%) | 832 (10.8%) |
| 5 or more Vehicles | 459 (5.6%) | 333 (4.3%) |
| Total | 8,142 (100.0%) | 7,701 (100.0%) |
Commute Time in Delaware County
The most frequently occuring commute durations in Delaware County are 30 to 34 minutes (1,877 commuters, 12.9%), 10 to 14 minutes (1,818 commuters, 12.5%), and 20 to 24 minutes (1,802 commuters, 12.3%).
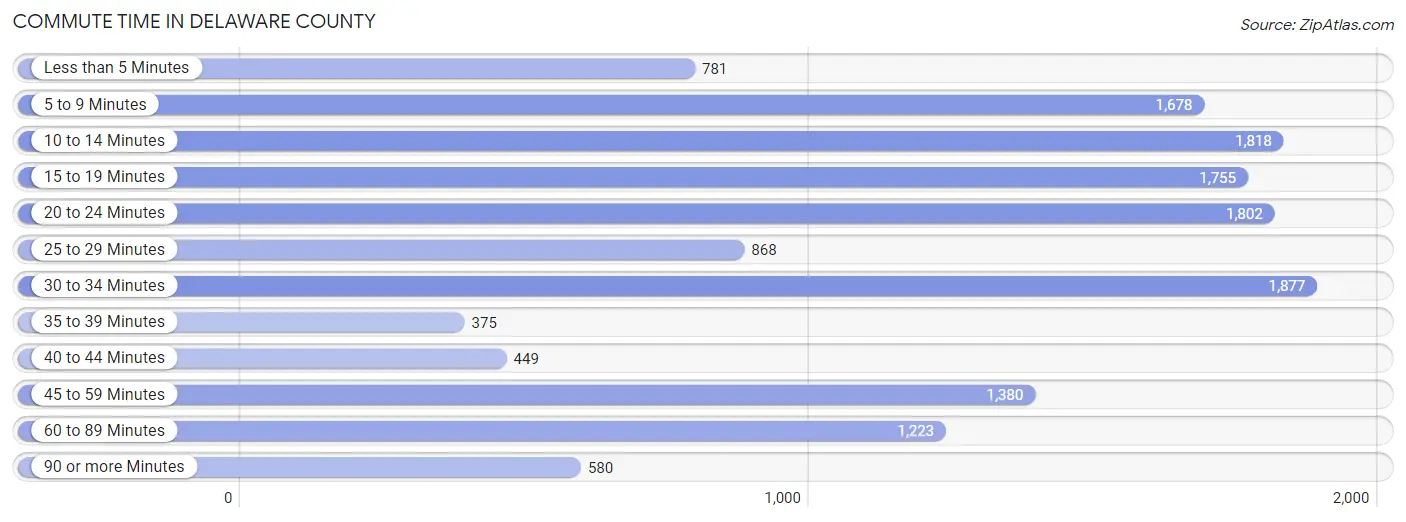
| Commute Time | # Commuters | % Commuters |
| Less than 5 Minutes | 781 | 5.3% |
| 5 to 9 Minutes | 1,678 | 11.5% |
| 10 to 14 Minutes | 1,818 | 12.5% |
| 15 to 19 Minutes | 1,755 | 12.0% |
| 20 to 24 Minutes | 1,802 | 12.3% |
| 25 to 29 Minutes | 868 | 5.9% |
| 30 to 34 Minutes | 1,877 | 12.9% |
| 35 to 39 Minutes | 375 | 2.6% |
| 40 to 44 Minutes | 449 | 3.1% |
| 45 to 59 Minutes | 1,380 | 9.5% |
| 60 to 89 Minutes | 1,223 | 8.4% |
| 90 or more Minutes | 580 | 4.0% |
Commute Time by Sex in Delaware County
The most common commute times in Delaware County are 30 to 34 minutes (952 commuters, 12.6%) for males and 5 to 9 minutes (940 commuters, 13.4%) for females.
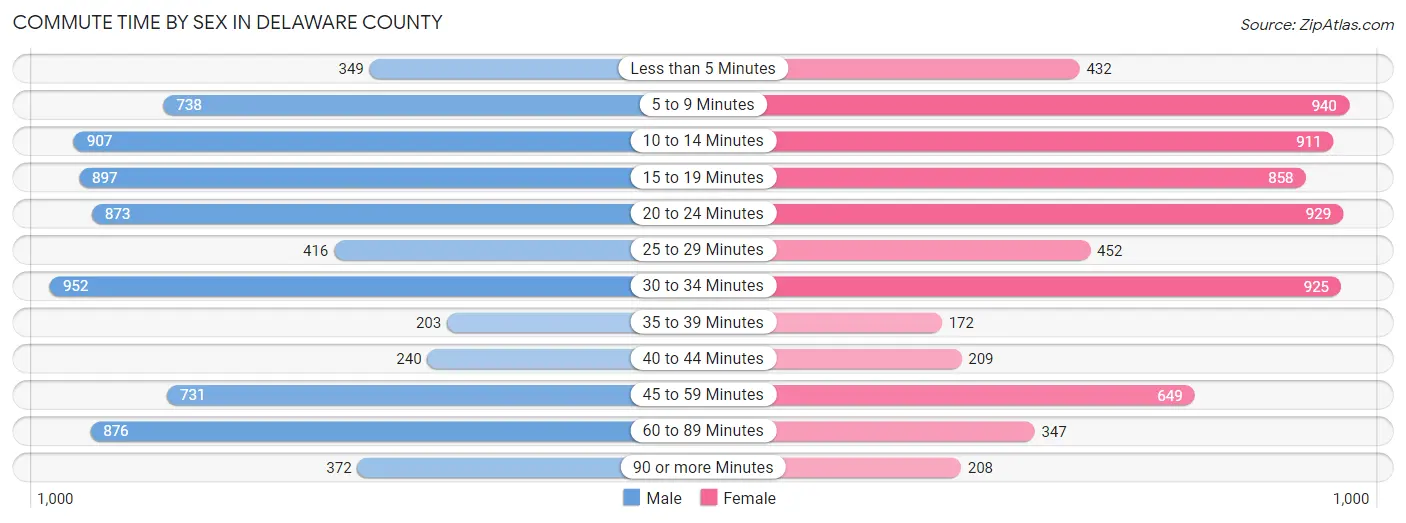
| Commute Time | Male | Female |
| Less than 5 Minutes | 349 (4.6%) | 432 (6.1%) |
| 5 to 9 Minutes | 738 (9.8%) | 940 (13.4%) |
| 10 to 14 Minutes | 907 (12.0%) | 911 (13.0%) |
| 15 to 19 Minutes | 897 (11.9%) | 858 (12.2%) |
| 20 to 24 Minutes | 873 (11.6%) | 929 (13.2%) |
| 25 to 29 Minutes | 416 (5.5%) | 452 (6.4%) |
| 30 to 34 Minutes | 952 (12.6%) | 925 (13.2%) |
| 35 to 39 Minutes | 203 (2.7%) | 172 (2.5%) |
| 40 to 44 Minutes | 240 (3.2%) | 209 (3.0%) |
| 45 to 59 Minutes | 731 (9.7%) | 649 (9.2%) |
| 60 to 89 Minutes | 876 (11.6%) | 347 (4.9%) |
| 90 or more Minutes | 372 (4.9%) | 208 (3.0%) |
Time of Departure to Work by Sex in Delaware County
The most frequent times of departure to work in Delaware County are 7:00 AM to 7:29 AM (1,151, 15.2%) for males and 7:30 AM to 7:59 AM (1,117, 15.9%) for females.
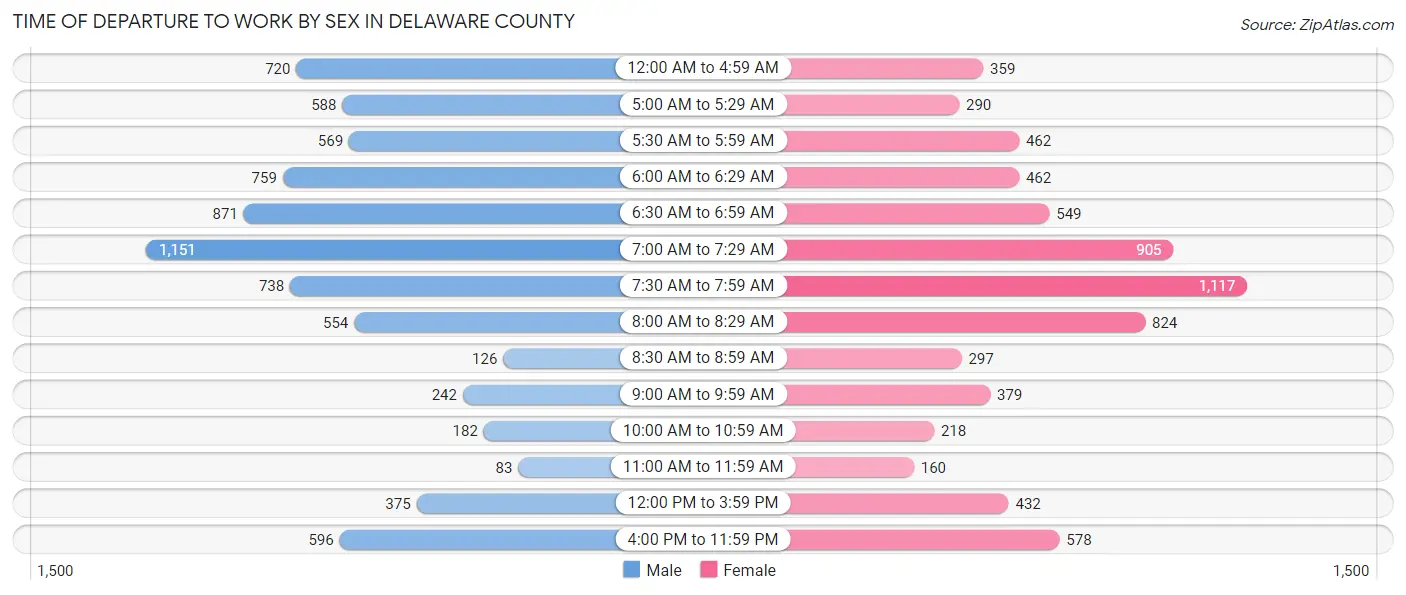
| Time of Departure | Male | Female |
| 12:00 AM to 4:59 AM | 720 (9.5%) | 359 (5.1%) |
| 5:00 AM to 5:29 AM | 588 (7.8%) | 290 (4.1%) |
| 5:30 AM to 5:59 AM | 569 (7.5%) | 462 (6.6%) |
| 6:00 AM to 6:29 AM | 759 (10.1%) | 462 (6.6%) |
| 6:30 AM to 6:59 AM | 871 (11.5%) | 549 (7.8%) |
| 7:00 AM to 7:29 AM | 1,151 (15.2%) | 905 (12.9%) |
| 7:30 AM to 7:59 AM | 738 (9.8%) | 1,117 (15.9%) |
| 8:00 AM to 8:29 AM | 554 (7.3%) | 824 (11.7%) |
| 8:30 AM to 8:59 AM | 126 (1.7%) | 297 (4.2%) |
| 9:00 AM to 9:59 AM | 242 (3.2%) | 379 (5.4%) |
| 10:00 AM to 10:59 AM | 182 (2.4%) | 218 (3.1%) |
| 11:00 AM to 11:59 AM | 83 (1.1%) | 160 (2.3%) |
| 12:00 PM to 3:59 PM | 375 (5.0%) | 432 (6.1%) |
| 4:00 PM to 11:59 PM | 596 (7.9%) | 578 (8.2%) |
| Total | 7,554 (100.0%) | 7,032 (100.0%) |
Housing Occupancy in Delaware County
Occupancy by Ownership in Delaware County
Of the total 16,620 dwellings in Delaware County, owner-occupied units account for 12,451 (74.9%), while renter-occupied units make up 4,169 (25.1%).
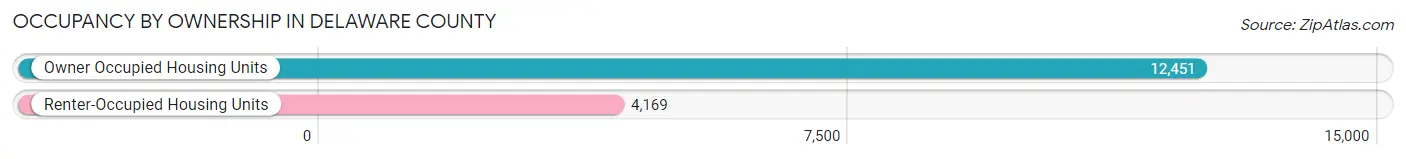
| Occupancy | # Housing Units | % Housing Units |
| Owner Occupied Housing Units | 12,451 | 74.9% |
| Renter-Occupied Housing Units | 4,169 | 25.1% |
| Total Occupied Housing Units | 16,620 | 100.0% |
Occupancy by Household Size in Delaware County
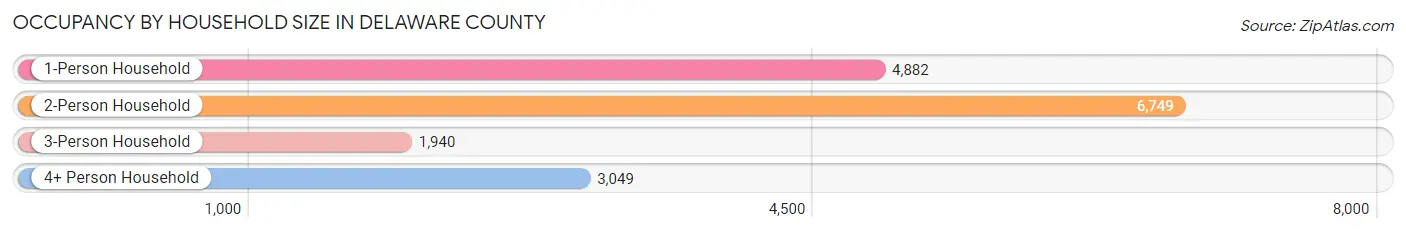
| Household Size | # Housing Units | % Housing Units |
| 1-Person Household | 4,882 | 29.4% |
| 2-Person Household | 6,749 | 40.6% |
| 3-Person Household | 1,940 | 11.7% |
| 4+ Person Household | 3,049 | 18.3% |
| Total Housing Units | 16,620 | 100.0% |
Occupancy by Ownership by Household Size in Delaware County
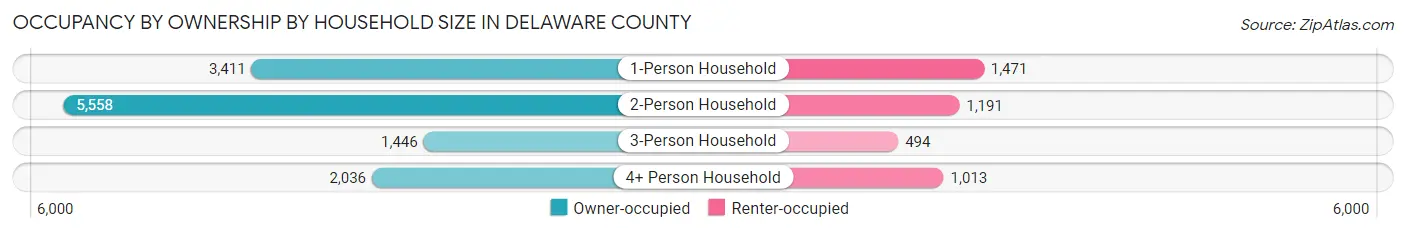
| Household Size | Owner-occupied | Renter-occupied |
| 1-Person Household | 3,411 (69.9%) | 1,471 (30.1%) |
| 2-Person Household | 5,558 (82.4%) | 1,191 (17.6%) |
| 3-Person Household | 1,446 (74.5%) | 494 (25.5%) |
| 4+ Person Household | 2,036 (66.8%) | 1,013 (33.2%) |
| Total Housing Units | 12,451 (74.9%) | 4,169 (25.1%) |
Occupancy by Educational Attainment in Delaware County
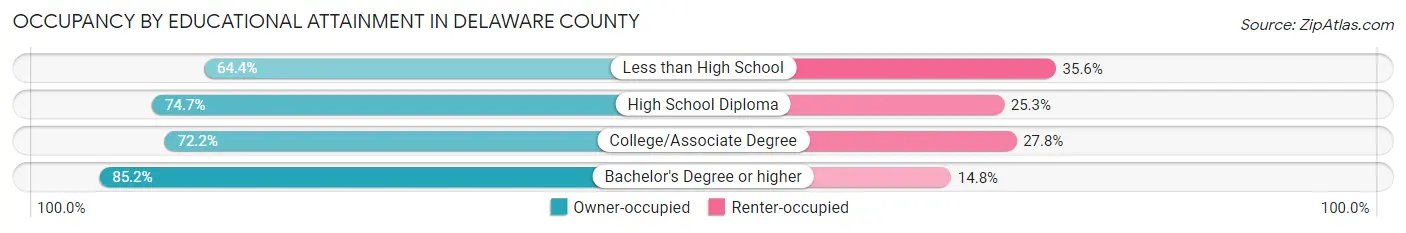
| Household Size | Owner-occupied | Renter-occupied |
| Less than High School | 1,240 (64.4%) | 685 (35.6%) |
| High School Diploma | 4,432 (74.7%) | 1,501 (25.3%) |
| College/Associate Degree | 3,820 (72.2%) | 1,468 (27.8%) |
| Bachelor's Degree or higher | 2,959 (85.2%) | 515 (14.8%) |
Occupancy by Age of Householder in Delaware County
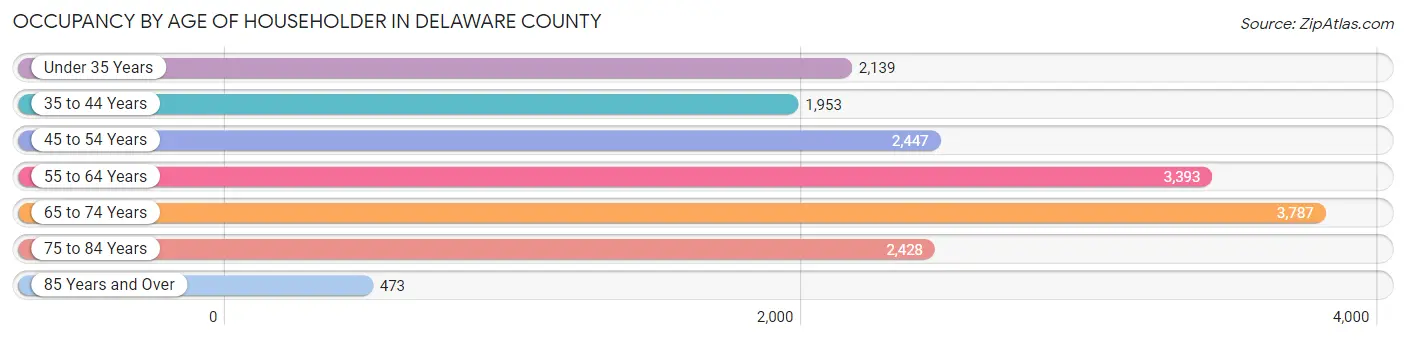
| Age Bracket | # Households | % Households |
| Under 35 Years | 2,139 | 12.9% |
| 35 to 44 Years | 1,953 | 11.7% |
| 45 to 54 Years | 2,447 | 14.7% |
| 55 to 64 Years | 3,393 | 20.4% |
| 65 to 74 Years | 3,787 | 22.8% |
| 75 to 84 Years | 2,428 | 14.6% |
| 85 Years and Over | 473 | 2.9% |
| Total | 16,620 | 100.0% |
Housing Finances in Delaware County
Median Income by Occupancy in Delaware County
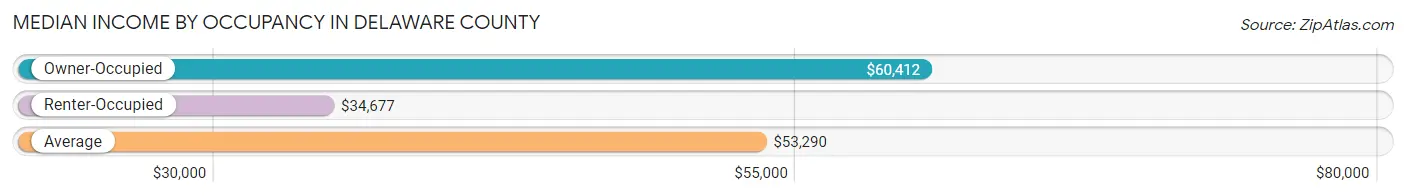
| Occupancy Type | # Households | Median Income |
| Owner-Occupied | 12,451 (74.9%) | $60,412 |
| Renter-Occupied | 4,169 (25.1%) | $34,677 |
| Average | 16,620 (100.0%) | $53,290 |
Occupancy by Householder Income Bracket in Delaware County
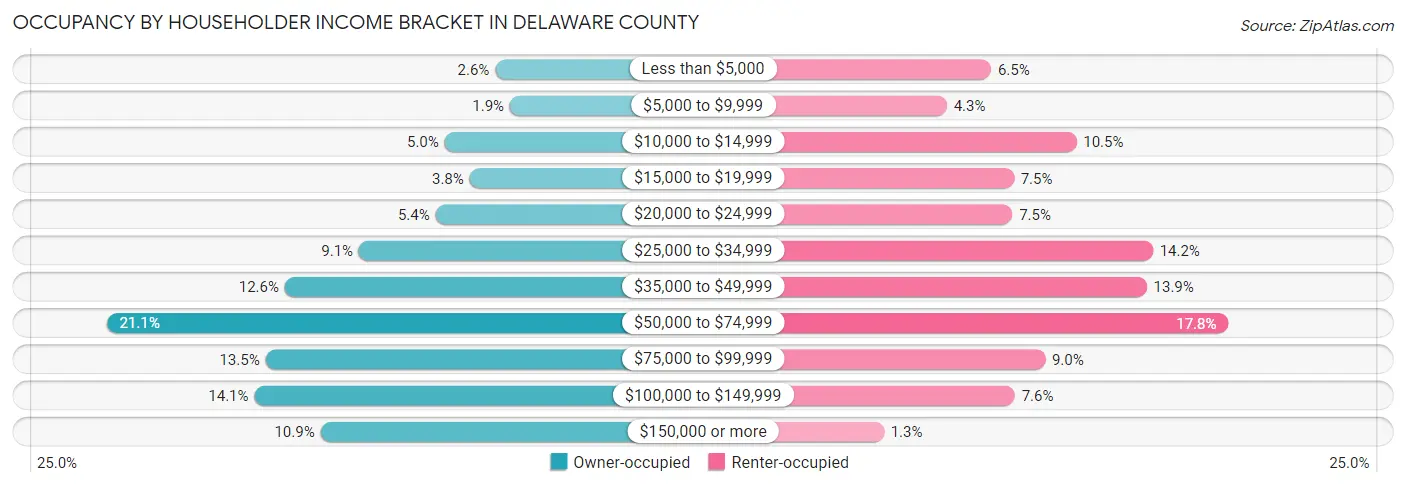
| Income Bracket | Owner-occupied | Renter-occupied |
| Less than $5,000 | 323 (2.6%) | 269 (6.5%) |
| $5,000 to $9,999 | 235 (1.9%) | 181 (4.3%) |
| $10,000 to $14,999 | 623 (5.0%) | 438 (10.5%) |
| $15,000 to $19,999 | 474 (3.8%) | 314 (7.5%) |
| $20,000 to $24,999 | 676 (5.4%) | 311 (7.5%) |
| $25,000 to $34,999 | 1,130 (9.1%) | 590 (14.1%) |
| $35,000 to $49,999 | 1,570 (12.6%) | 578 (13.9%) |
| $50,000 to $74,999 | 2,627 (21.1%) | 740 (17.7%) |
| $75,000 to $99,999 | 1,684 (13.5%) | 376 (9.0%) |
| $100,000 to $149,999 | 1,750 (14.1%) | 316 (7.6%) |
| $150,000 or more | 1,359 (10.9%) | 56 (1.3%) |
| Total | 12,451 (100.0%) | 4,169 (100.0%) |
Monthly Housing Cost Tiers in Delaware County
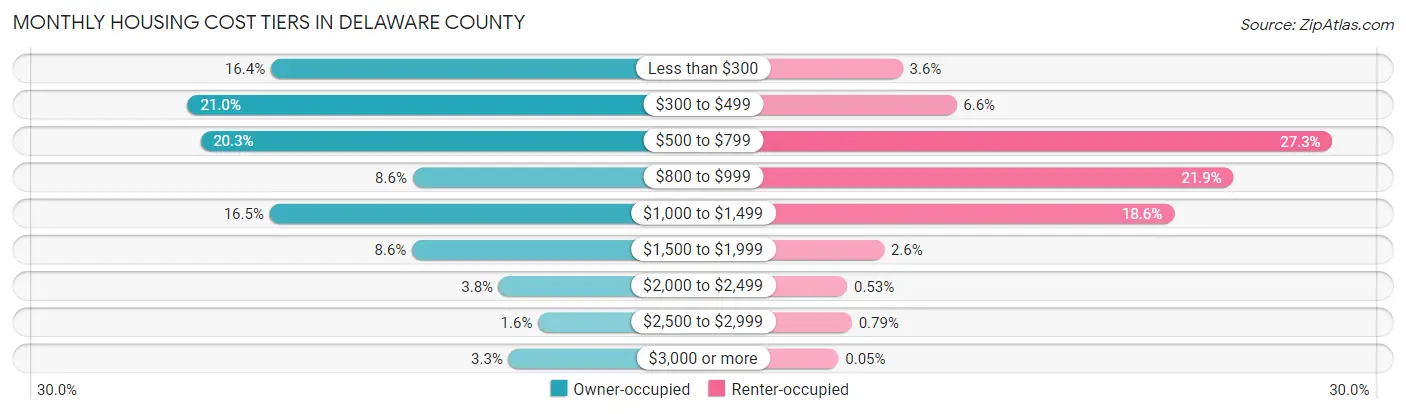
| Monthly Cost | Owner-occupied | Renter-occupied |
| Less than $300 | 2,041 (16.4%) | 150 (3.6%) |
| $300 to $499 | 2,615 (21.0%) | 274 (6.6%) |
| $500 to $799 | 2,528 (20.3%) | 1,140 (27.3%) |
| $800 to $999 | 1,066 (8.6%) | 912 (21.9%) |
| $1,000 to $1,499 | 2,050 (16.5%) | 775 (18.6%) |
| $1,500 to $1,999 | 1,069 (8.6%) | 107 (2.6%) |
| $2,000 to $2,499 | 473 (3.8%) | 22 (0.5%) |
| $2,500 to $2,999 | 203 (1.6%) | 33 (0.8%) |
| $3,000 or more | 406 (3.3%) | 2 (0.1%) |
| Total | 12,451 (100.0%) | 4,169 (100.0%) |
Physical Housing Characteristics in Delaware County
Housing Structures in Delaware County
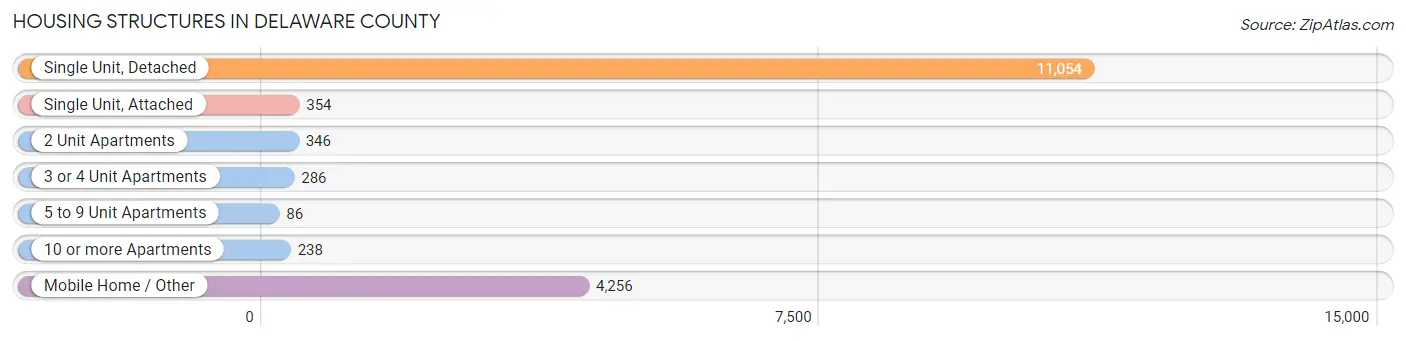
| Structure Type | # Housing Units | % Housing Units |
| Single Unit, Detached | 11,054 | 66.5% |
| Single Unit, Attached | 354 | 2.1% |
| 2 Unit Apartments | 346 | 2.1% |
| 3 or 4 Unit Apartments | 286 | 1.7% |
| 5 to 9 Unit Apartments | 86 | 0.5% |
| 10 or more Apartments | 238 | 1.4% |
| Mobile Home / Other | 4,256 | 25.6% |
| Total | 16,620 | 100.0% |
Housing Structures by Occupancy in Delaware County
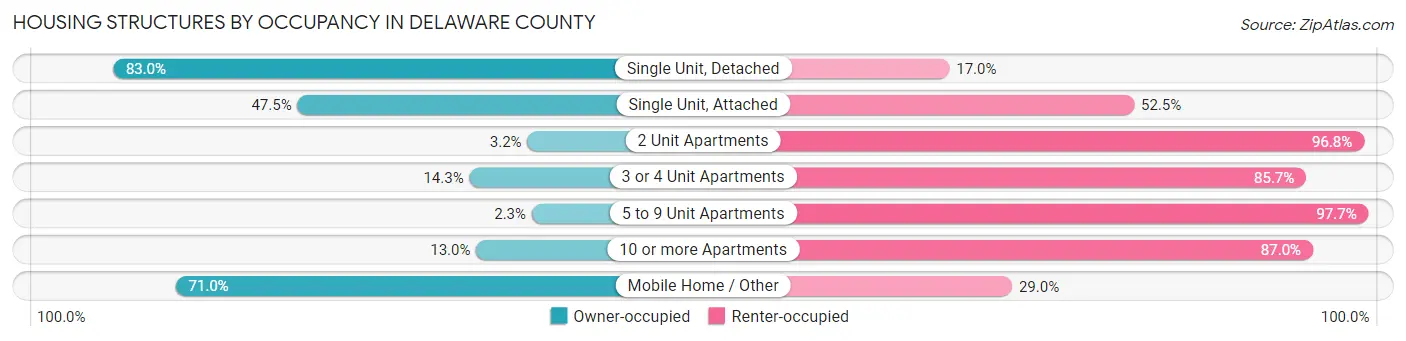
| Structure Type | Owner-occupied | Renter-occupied |
| Single Unit, Detached | 9,178 (83.0%) | 1,876 (17.0%) |
| Single Unit, Attached | 168 (47.5%) | 186 (52.5%) |
| 2 Unit Apartments | 11 (3.2%) | 335 (96.8%) |
| 3 or 4 Unit Apartments | 41 (14.3%) | 245 (85.7%) |
| 5 to 9 Unit Apartments | 2 (2.3%) | 84 (97.7%) |
| 10 or more Apartments | 31 (13.0%) | 207 (87.0%) |
| Mobile Home / Other | 3,020 (71.0%) | 1,236 (29.0%) |
| Total | 12,451 (74.9%) | 4,169 (25.1%) |
Housing Structures by Number of Rooms in Delaware County

| Number of Rooms | Owner-occupied | Renter-occupied |
| 1 Room | 54 (0.4%) | 150 (3.6%) |
| 2 or 3 Rooms | 866 (7.0%) | 697 (16.7%) |
| 4 or 5 Rooms | 4,448 (35.7%) | 2,188 (52.5%) |
| 6 or 7 Rooms | 4,740 (38.1%) | 897 (21.5%) |
| 8 or more Rooms | 2,343 (18.8%) | 237 (5.7%) |
| Total | 12,451 (100.0%) | 4,169 (100.0%) |
Housing Structure by Heating Type in Delaware County
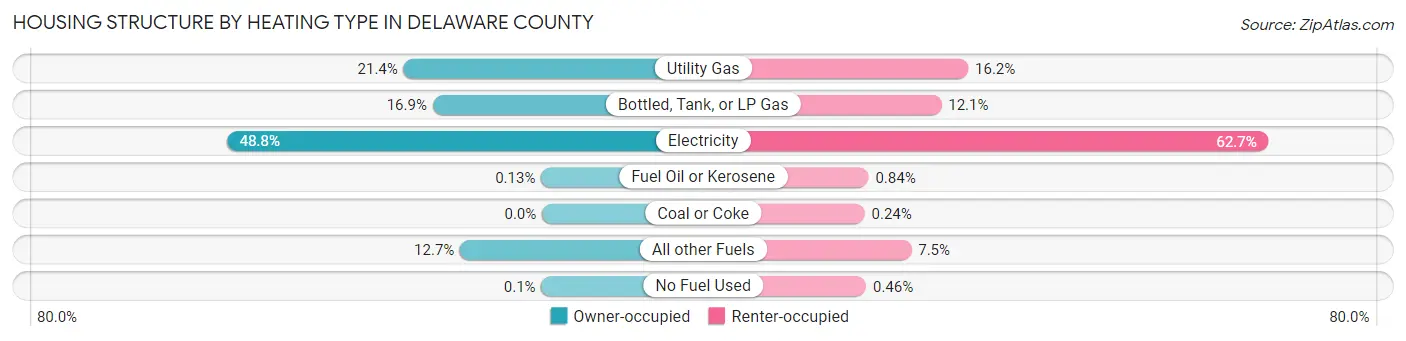
| Heating Type | Owner-occupied | Renter-occupied |
| Utility Gas | 2,666 (21.4%) | 677 (16.2%) |
| Bottled, Tank, or LP Gas | 2,106 (16.9%) | 504 (12.1%) |
| Electricity | 6,073 (48.8%) | 2,613 (62.7%) |
| Fuel Oil or Kerosene | 16 (0.1%) | 35 (0.8%) |
| Coal or Coke | 0 (0.0%) | 10 (0.2%) |
| All other Fuels | 1,578 (12.7%) | 311 (7.5%) |
| No Fuel Used | 12 (0.1%) | 19 (0.5%) |
| Total | 12,451 (100.0%) | 4,169 (100.0%) |
Household Vehicle Usage in Delaware County
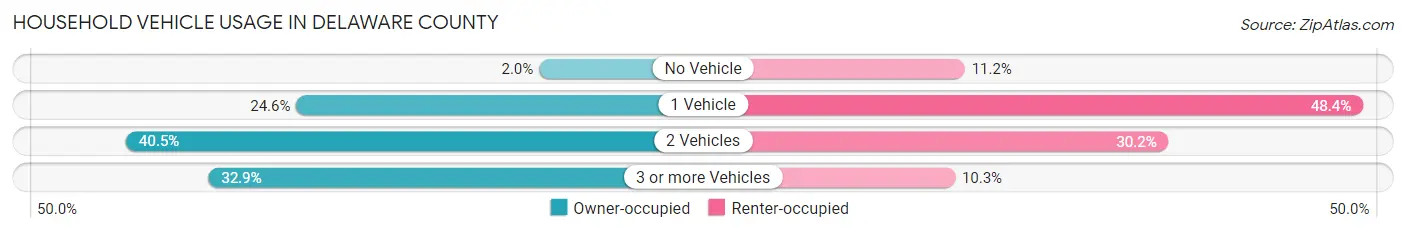
| Vehicles per Household | Owner-occupied | Renter-occupied |
| No Vehicle | 245 (2.0%) | 466 (11.2%) |
| 1 Vehicle | 3,068 (24.6%) | 2,016 (48.4%) |
| 2 Vehicles | 5,048 (40.5%) | 1,259 (30.2%) |
| 3 or more Vehicles | 4,090 (32.9%) | 428 (10.3%) |
| Total | 12,451 (100.0%) | 4,169 (100.0%) |
Real Estate & Mortgages in Delaware County
Real Estate and Mortgage Overview in Delaware County
| Characteristic | Without Mortgage | With Mortgage |
| Housing Units | 7,024 | 5,427 |
| Median Property Value | $110,200 | $186,200 |
| Median Household Income | $48,507 | $846 |
| Monthly Housing Costs | $409 | $406 |
| Real Estate Taxes | $663 | $394 |
Property Value by Mortgage Status in Delaware County
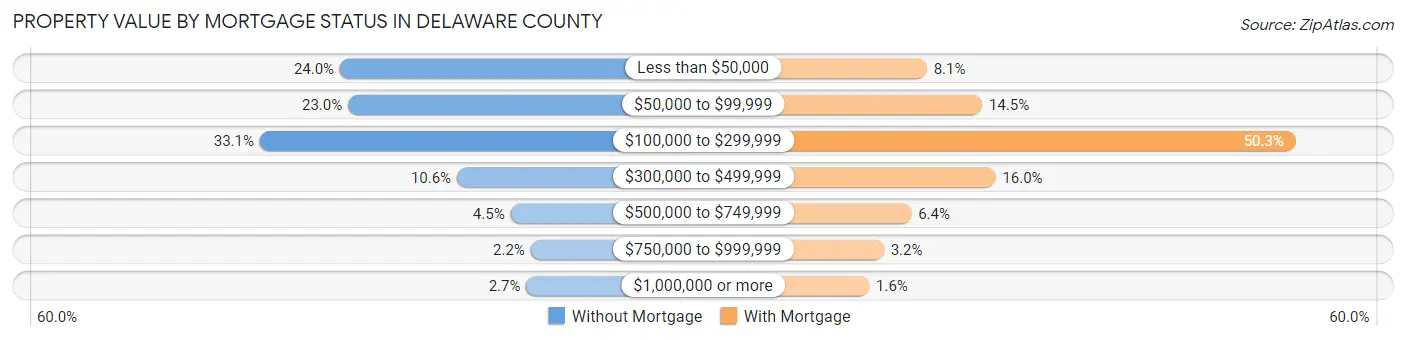
| Property Value | Without Mortgage | With Mortgage |
| Less than $50,000 | 1,683 (24.0%) | 441 (8.1%) |
| $50,000 to $99,999 | 1,618 (23.0%) | 784 (14.4%) |
| $100,000 to $299,999 | 2,326 (33.1%) | 2,730 (50.3%) |
| $300,000 to $499,999 | 744 (10.6%) | 868 (16.0%) |
| $500,000 to $749,999 | 314 (4.5%) | 345 (6.4%) |
| $750,000 to $999,999 | 152 (2.2%) | 175 (3.2%) |
| $1,000,000 or more | 187 (2.7%) | 84 (1.5%) |
| Total | 7,024 (100.0%) | 5,427 (100.0%) |
Household Income by Mortgage Status in Delaware County
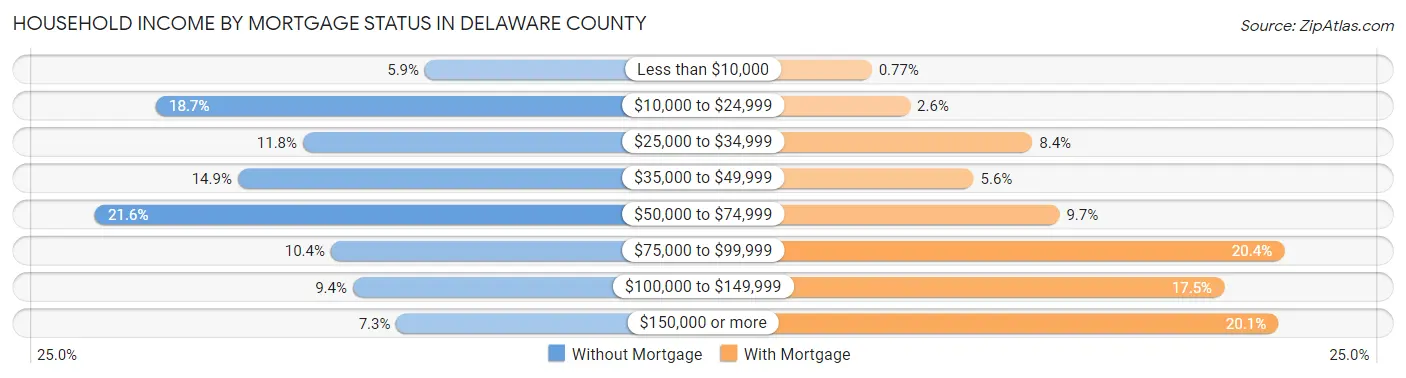
| Household Income | Without Mortgage | With Mortgage |
| Less than $10,000 | 417 (5.9%) | 42 (0.8%) |
| $10,000 to $24,999 | 1,316 (18.7%) | 141 (2.6%) |
| $25,000 to $34,999 | 825 (11.7%) | 457 (8.4%) |
| $35,000 to $49,999 | 1,043 (14.8%) | 305 (5.6%) |
| $50,000 to $74,999 | 1,520 (21.6%) | 527 (9.7%) |
| $75,000 to $99,999 | 732 (10.4%) | 1,107 (20.4%) |
| $100,000 to $149,999 | 658 (9.4%) | 952 (17.5%) |
| $150,000 or more | 513 (7.3%) | 1,092 (20.1%) |
| Total | 7,024 (100.0%) | 5,427 (100.0%) |
Property Value to Household Income Ratio in Delaware County
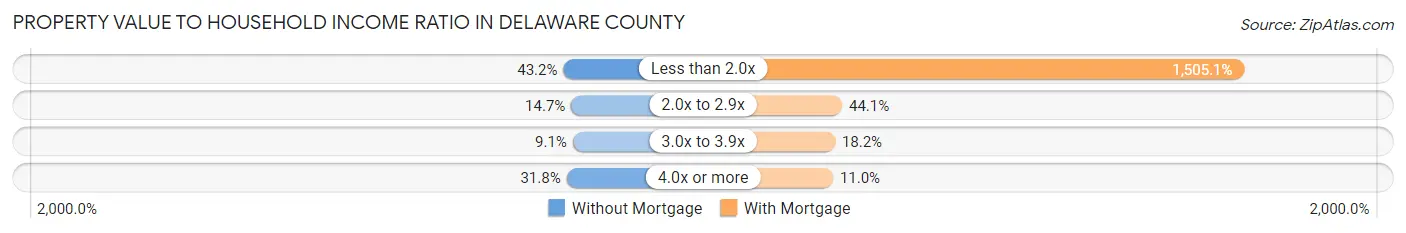
| Value-to-Income Ratio | Without Mortgage | With Mortgage |
| Less than 2.0x | 3,036 (43.2%) | 81,683 (1,505.1%) |
| 2.0x to 2.9x | 1,032 (14.7%) | 2,394 (44.1%) |
| 3.0x to 3.9x | 641 (9.1%) | 987 (18.2%) |
| 4.0x or more | 2,230 (31.8%) | 595 (11.0%) |
| Total | 7,024 (100.0%) | 5,427 (100.0%) |
Real Estate Taxes by Mortgage Status in Delaware County

| Property Taxes | Without Mortgage | With Mortgage |
| Less than $800 | 3,644 (51.9%) | 45 (0.8%) |
| $800 to $1,499 | 1,070 (15.2%) | 1,487 (27.4%) |
| $800 to $1,499 | 1,705 (24.3%) | 1,316 (24.2%) |
| Total | 7,024 (100.0%) | 5,427 (100.0%) |
Health & Disability in Delaware County
Health Insurance Coverage by Age in Delaware County
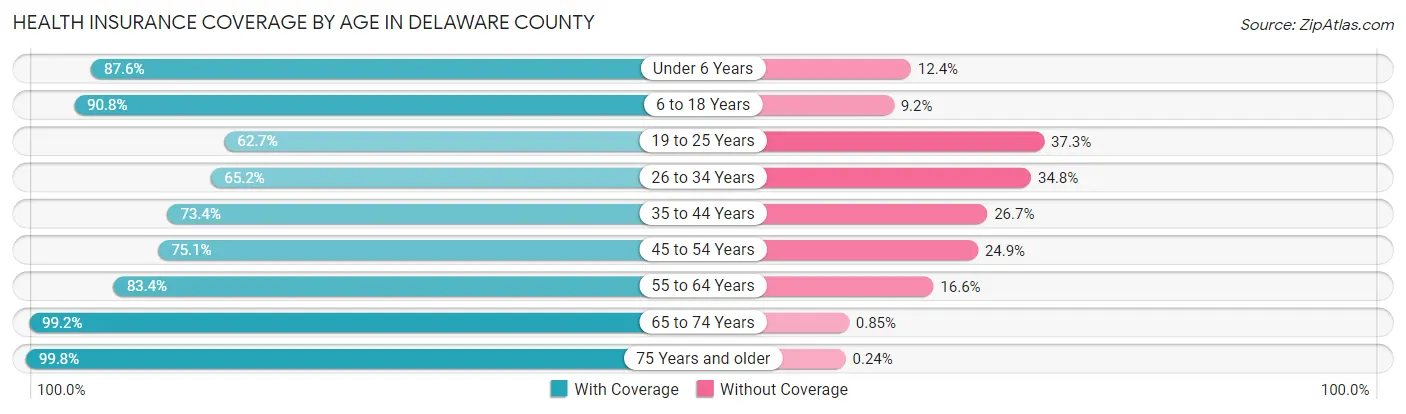
| Age Bracket | With Coverage | Without Coverage |
| Under 6 Years | 2,194 (87.6%) | 311 (12.4%) |
| 6 to 18 Years | 5,457 (90.8%) | 554 (9.2%) |
| 19 to 25 Years | 1,847 (62.7%) | 1,097 (37.3%) |
| 26 to 34 Years | 2,409 (65.2%) | 1,288 (34.8%) |
| 35 to 44 Years | 3,093 (73.4%) | 1,124 (26.7%) |
| 45 to 54 Years | 3,612 (75.1%) | 1,199 (24.9%) |
| 55 to 64 Years | 5,189 (83.4%) | 1,034 (16.6%) |
| 65 to 74 Years | 5,817 (99.2%) | 50 (0.9%) |
| 75 Years and older | 4,118 (99.8%) | 10 (0.2%) |
| Total | 33,736 (83.5%) | 6,667 (16.5%) |
Health Insurance Coverage by Citizenship Status in Delaware County

| Citizenship Status | With Coverage | Without Coverage |
| Native Born | 2,194 (87.6%) | 311 (12.4%) |
| Foreign Born, Citizen | 5,457 (90.8%) | 554 (9.2%) |
| Foreign Born, not a Citizen | 1,847 (62.7%) | 1,097 (37.3%) |
Health Insurance Coverage by Household Income in Delaware County
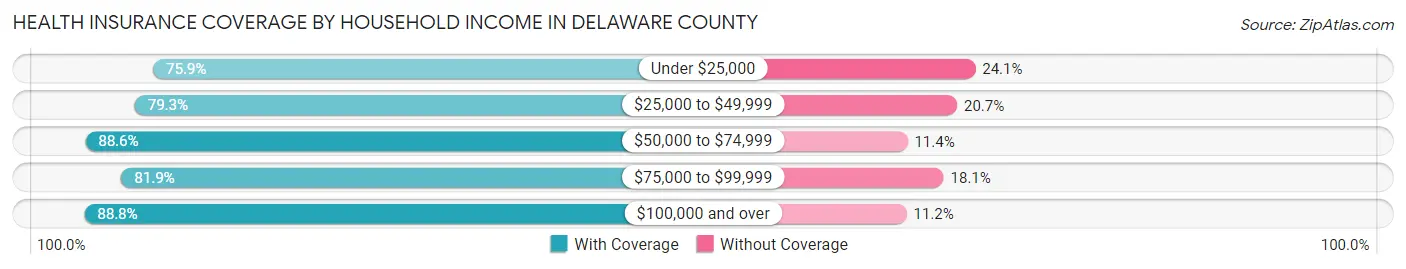
| Household Income | With Coverage | Without Coverage |
| Under $25,000 | 5,464 (75.9%) | 1,733 (24.1%) |
| $25,000 to $49,999 | 6,964 (79.3%) | 1,813 (20.7%) |
| $50,000 to $74,999 | 7,406 (88.6%) | 950 (11.4%) |
| $75,000 to $99,999 | 4,525 (81.9%) | 1,003 (18.1%) |
| $100,000 and over | 9,248 (88.8%) | 1,167 (11.2%) |
Public vs Private Health Insurance Coverage by Age in Delaware County
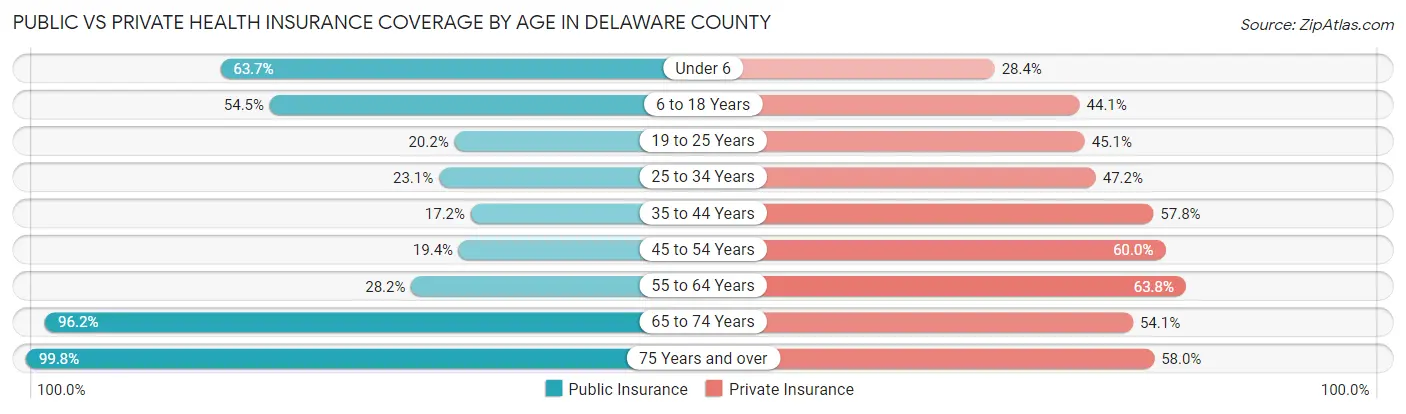
| Age Bracket | Public Insurance | Private Insurance |
| Under 6 | 1,595 (63.7%) | 711 (28.4%) |
| 6 to 18 Years | 3,274 (54.5%) | 2,653 (44.1%) |
| 19 to 25 Years | 595 (20.2%) | 1,328 (45.1%) |
| 25 to 34 Years | 853 (23.1%) | 1,743 (47.1%) |
| 35 to 44 Years | 724 (17.2%) | 2,439 (57.8%) |
| 45 to 54 Years | 933 (19.4%) | 2,888 (60.0%) |
| 55 to 64 Years | 1,757 (28.2%) | 3,973 (63.8%) |
| 65 to 74 Years | 5,643 (96.2%) | 3,171 (54.0%) |
| 75 Years and over | 4,118 (99.8%) | 2,394 (58.0%) |
| Total | 19,492 (48.2%) | 21,300 (52.7%) |
Disability Status by Sex by Age in Delaware County
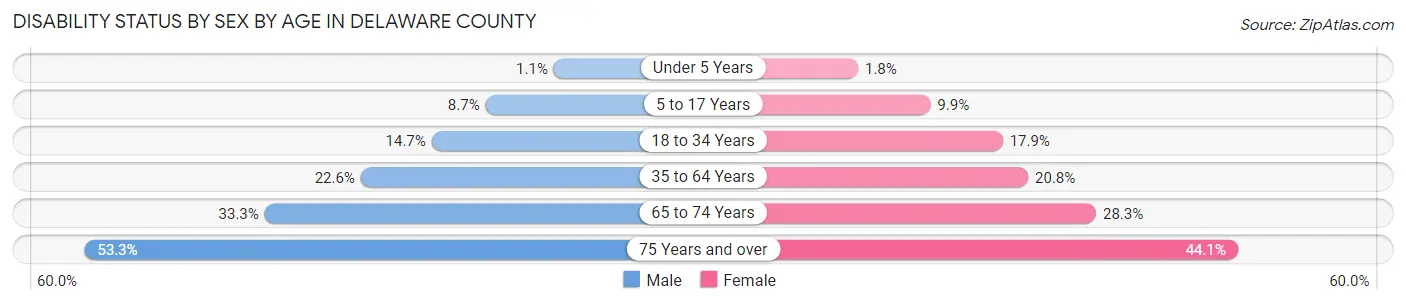
| Age Bracket | Male | Female |
| Under 5 Years | 11 (1.1%) | 17 (1.8%) |
| 5 to 17 Years | 266 (8.7%) | 295 (9.9%) |
| 18 to 34 Years | 525 (14.7%) | 636 (17.9%) |
| 35 to 64 Years | 1,695 (22.6%) | 1,606 (20.7%) |
| 65 to 74 Years | 937 (33.3%) | 864 (28.3%) |
| 75 Years and over | 1,078 (53.3%) | 929 (44.1%) |
Disability Class by Sex by Age in Delaware County
Disability Class: Hearing Difficulty
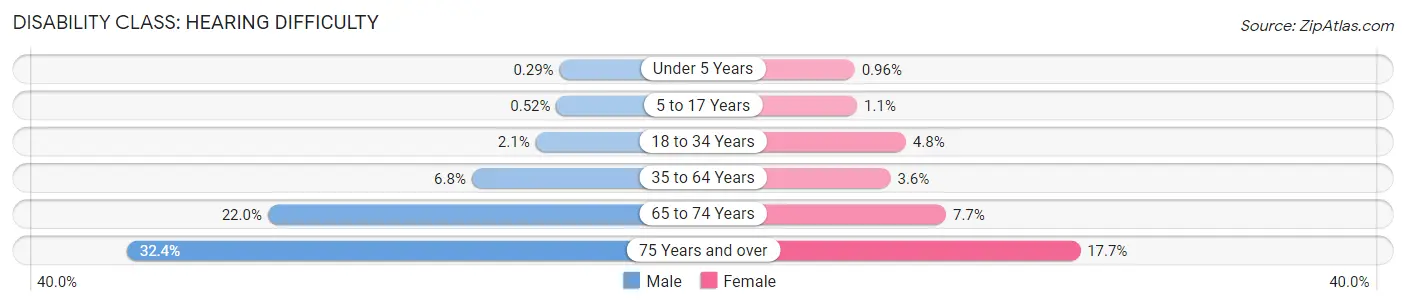
| Age Bracket | Male | Female |
| Under 5 Years | 3 (0.3%) | 9 (1.0%) |
| 5 to 17 Years | 16 (0.5%) | 34 (1.1%) |
| 18 to 34 Years | 74 (2.1%) | 169 (4.8%) |
| 35 to 64 Years | 511 (6.8%) | 280 (3.6%) |
| 65 to 74 Years | 618 (22.0%) | 236 (7.7%) |
| 75 Years and over | 655 (32.4%) | 373 (17.7%) |
Disability Class: Vision Difficulty
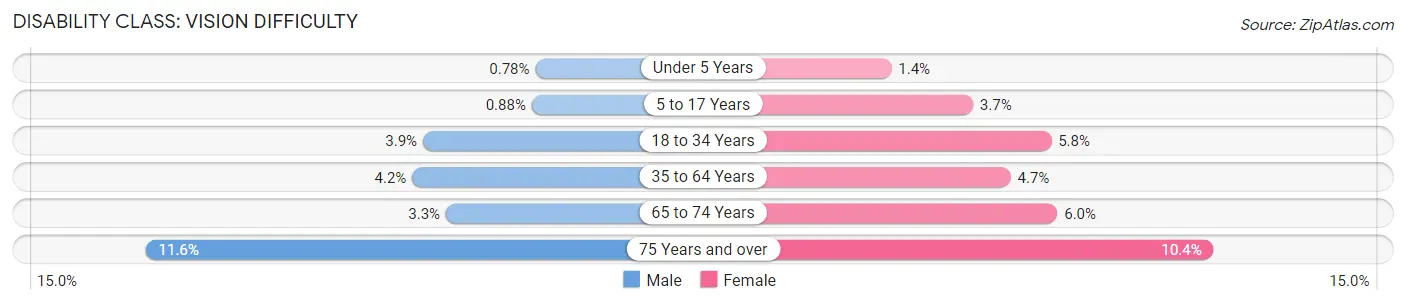
| Age Bracket | Male | Female |
| Under 5 Years | 8 (0.8%) | 13 (1.4%) |
| 5 to 17 Years | 27 (0.9%) | 109 (3.6%) |
| 18 to 34 Years | 140 (3.9%) | 207 (5.8%) |
| 35 to 64 Years | 316 (4.2%) | 364 (4.7%) |
| 65 to 74 Years | 92 (3.3%) | 183 (6.0%) |
| 75 Years and over | 235 (11.6%) | 218 (10.3%) |
Disability Class: Cognitive Difficulty
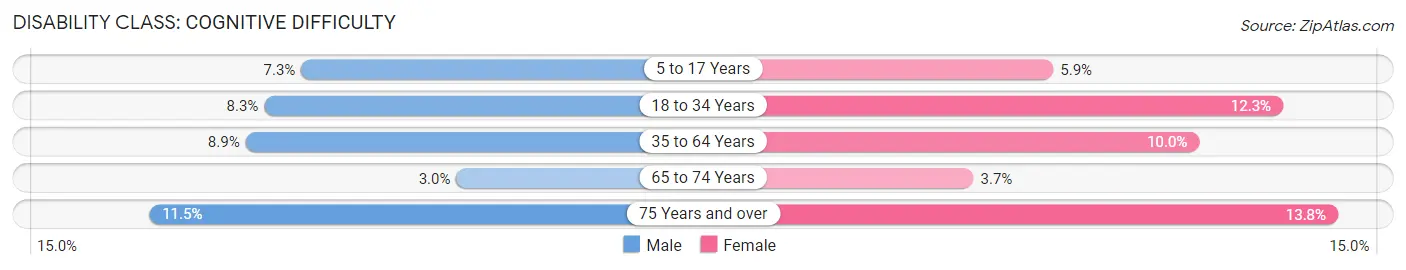
| Age Bracket | Male | Female |
| 5 to 17 Years | 224 (7.3%) | 176 (5.9%) |
| 18 to 34 Years | 298 (8.3%) | 436 (12.3%) |
| 35 to 64 Years | 665 (8.8%) | 770 (10.0%) |
| 65 to 74 Years | 84 (3.0%) | 112 (3.7%) |
| 75 Years and over | 233 (11.5%) | 291 (13.8%) |
Disability Class: Ambulatory Difficulty
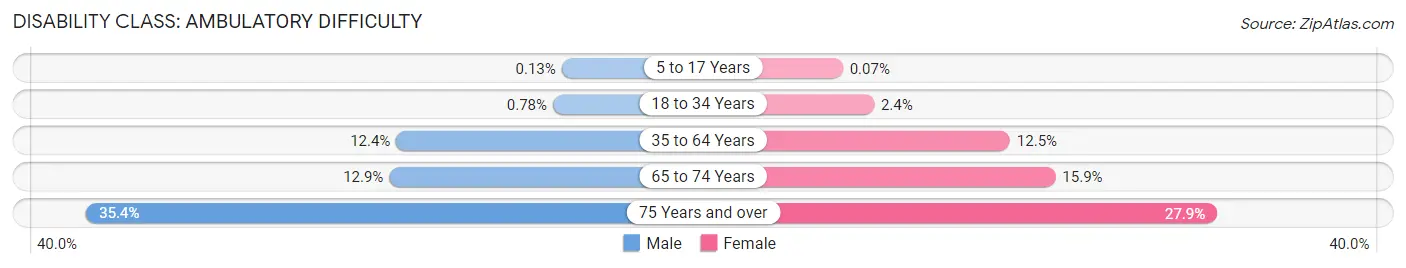
| Age Bracket | Male | Female |
| 5 to 17 Years | 4 (0.1%) | 2 (0.1%) |
| 18 to 34 Years | 28 (0.8%) | 85 (2.4%) |
| 35 to 64 Years | 932 (12.4%) | 966 (12.5%) |
| 65 to 74 Years | 364 (12.9%) | 484 (15.9%) |
| 75 Years and over | 716 (35.4%) | 587 (27.9%) |
Disability Class: Self-Care Difficulty
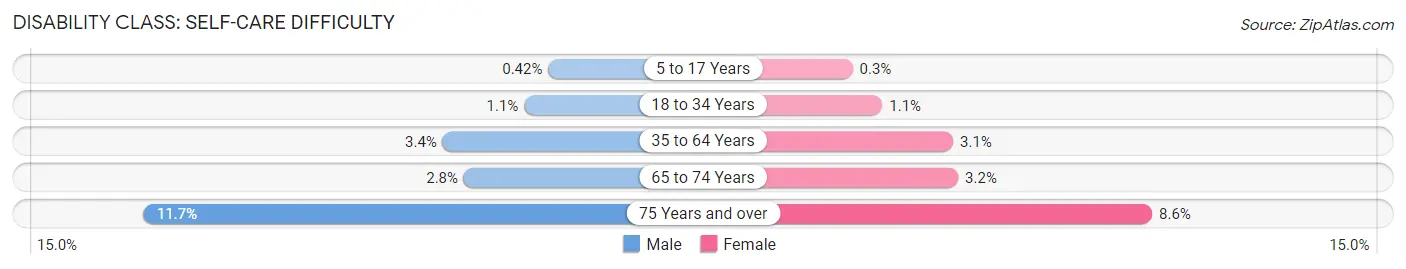
| Age Bracket | Male | Female |
| 5 to 17 Years | 13 (0.4%) | 9 (0.3%) |
| 18 to 34 Years | 39 (1.1%) | 40 (1.1%) |
| 35 to 64 Years | 252 (3.4%) | 240 (3.1%) |
| 65 to 74 Years | 78 (2.8%) | 99 (3.2%) |
| 75 Years and over | 236 (11.7%) | 182 (8.6%) |
Technology Access in Delaware County
Computing Device Access in Delaware County
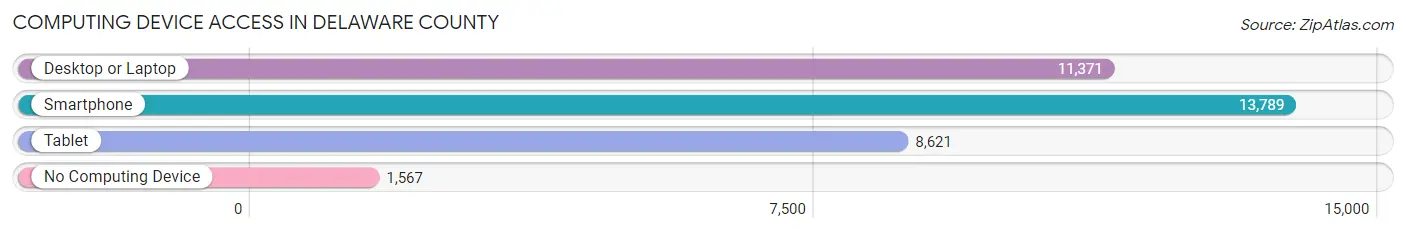
| Device Type | # Households | % Households |
| Desktop or Laptop | 11,371 | 68.4% |
| Smartphone | 13,789 | 83.0% |
| Tablet | 8,621 | 51.9% |
| No Computing Device | 1,567 | 9.4% |
| Total | 16,620 | 100.0% |
Internet Access in Delaware County
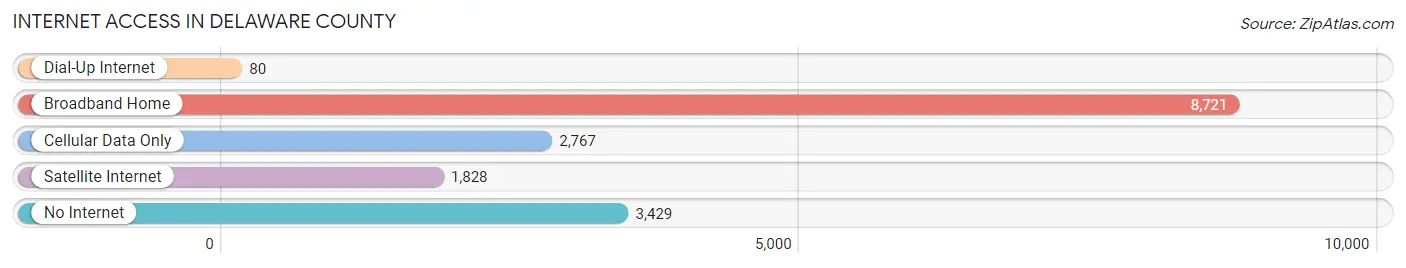
| Internet Type | # Households | % Households |
| Dial-Up Internet | 80 | 0.5% |
| Broadband Home | 8,721 | 52.5% |
| Cellular Data Only | 2,767 | 16.7% |
| Satellite Internet | 1,828 | 11.0% |
| No Internet | 3,429 | 20.6% |
| Total | 16,620 | 100.0% |
Delaware County Summary
Delaware County, Oklahoma is located in the northeastern corner of the state and is part of the Ozark Plateau. It is bordered by Ottawa County to the north, Mayes County to the east, Adair County to the south, and Craig County to the west. The county seat is Jay, and the largest city is Grove. The county was named for the Delaware Indians who were relocated to the area in 1829.
Geography
Delaware County covers an area of 745 square miles and is located in the Ozark Plateau region of Oklahoma. The terrain is mostly hilly and forested, with some flat areas in the valleys. The highest point in the county is located in the northwest corner, at 1,890 feet above sea level. The county is drained by the Grand River, which flows through the center of the county. Other major waterways include the Elk River, the Neosho River, and the Illinois River.
The climate of Delaware County is humid subtropical, with hot summers and mild winters. The average annual temperature is around 63°F, and the average annual precipitation is around 45 inches.
Economy
The economy of Delaware County is largely based on agriculture and tourism. The county is home to several large farms, which produce a variety of crops, including corn, soybeans, wheat, and hay. The county also has a thriving tourism industry, with many visitors coming to enjoy the area’s natural beauty and recreational activities.
The county is also home to several manufacturing companies, including a large poultry processing plant and a furniture factory. The county also has a growing service sector, with many businesses providing services such as banking, insurance, and healthcare.
Demographics
As of the 2010 census, the population of Delaware County was 41,487. The population has grown steadily since the 2000 census, when it was 37,845. The population is spread out across the county, with the largest cities being Grove (9,845) and Jay (3,945).
The racial makeup of the county is predominantly white (90.2%), with small percentages of African American (3.2%), Native American (2.2%), Asian (0.7%), and other races (3.7%). The median household income is $41,945, and the median family income is $48,945. The poverty rate is 13.2%.
The largest employers in the county are the poultry processing plant, the furniture factory, and the school district. Other major employers include the county government, the hospital, and the local retail stores.
Education
Delaware County is served by the Jay Public Schools, which includes four elementary schools, one middle school, and one high school. The county also has several private schools, including a Catholic school and a Christian school. The county is also home to a branch of Northeastern State University.
Conclusion
Delaware County, Oklahoma is a rural county located in the northeastern corner of the state. The county is home to a variety of industries, including agriculture, manufacturing, and tourism. The population is predominantly white, and the median household income is $41,945. The county is served by the Jay Public Schools, as well as several private schools and a branch of Northeastern State University.
Common Questions
What is the Total Population of Delaware County?
Total Population of Delaware County is 40,791.
What is the Total Male Population of Delaware County?
Total Male Population of Delaware County is 20,200.
What is the Total Female Population of Delaware County?
Total Female Population of Delaware County is 20,591.
What is the Ratio of Males per 100 Females in Delaware County?
There are 98.10 Males per 100 Females in Delaware County.
What is the Ratio of Females per 100 Males in Delaware County?
There are 101.94 Females per 100 Males in Delaware County.
What is the Median Population Age in Delaware County?
Median Population Age in Delaware County is 46.8 Years.
What is the Average Family Size in Delaware County
Average Family Size in Delaware County is 3.0 People.
What is the Average Household Size in Delaware County
Average Household Size in Delaware County is 2.4 People.
What is Per Capita Income in Delaware County?
Per Capita income in Delaware County is $34,489.
What is the Median Family Income in Delaware County?
Median Family Income in Delaware County is $66,368.
What is the Median Household income in Delaware County?
Median Household Income in Delaware County is $53,290.
What is Income or Wage Gap in Delaware County?
Income or Wage Gap in Delaware County is 28.1%.
Women in Delaware County earn 71.9 cents for every dollar earned by a man.
What is Family Income Deficit in Delaware County?
Family Income Deficit in Delaware County is $11,587.
Families that are below poverty line in Delaware County earn $11,587 less on average than the poverty threshold level.
What is Inequality or Gini Index in Delaware County?
Inequality or Gini Index in Delaware County is 0.47.
How Large is the Labor Force in Delaware County?
There are 16,968 People in the Labor Forcein in Delaware County.
What is the Percentage of People in the Labor Force in Delaware County?
50.3% of People are in the Labor Force in Delaware County.
What is the Unemployment Rate in Delaware County?
Unemployment Rate in Delaware County is 5.2%.