Custer County, OK
Custer County Map
Custer County Overview
28,391
TOTAL POPULATION
13,842
MALE POPULATION
14,549
FEMALE POPULATION
95.14
MALES / 100 FEMALES
105.11
FEMALES / 100 MALES
32.4
MEDIAN AGE
3.2
AVG FAMILY SIZE
2.5
AVG HOUSEHOLD SIZE
$30,880
PER CAPITA INCOME
$78,768
AVG FAMILY INCOME
$58,669
AVG HOUSEHOLD INCOME
40.1%
WAGE / INCOME GAP [ % ]
59.9¢/ $1
WAGE / INCOME GAP [ $ ]
$10,075
FAMILY INCOME DEFICIT
0.48
INEQUALITY / GINI INDEX
14,687
LABOR FORCE [ PEOPLE ]
66.6%
PERCENT IN LABOR FORCE
2.9%
UNEMPLOYMENT RATE
Custer County Area Codes
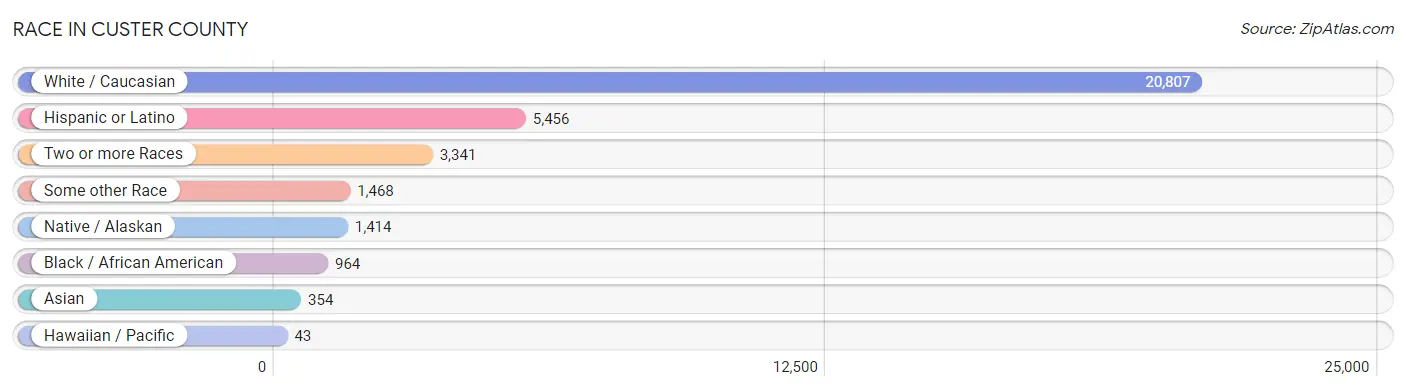
Race in Custer County
The most populous races in Custer County are White / Caucasian (20,807 | 73.3%), Hispanic or Latino (5,456 | 19.2%), and Two or more Races (3,341 | 11.8%).
| Race | # Population | % Population |
| Asian | 354 | 1.3% |
| Black / African American | 964 | 3.4% |
| Hawaiian / Pacific | 43 | 0.2% |
| Hispanic or Latino | 5,456 | 19.2% |
| Native / Alaskan | 1,414 | 5.0% |
| White / Caucasian | 20,807 | 73.3% |
| Two or more Races | 3,341 | 11.8% |
| Some other Race | 1,468 | 5.2% |
| Total | 28,391 | 100.0% |
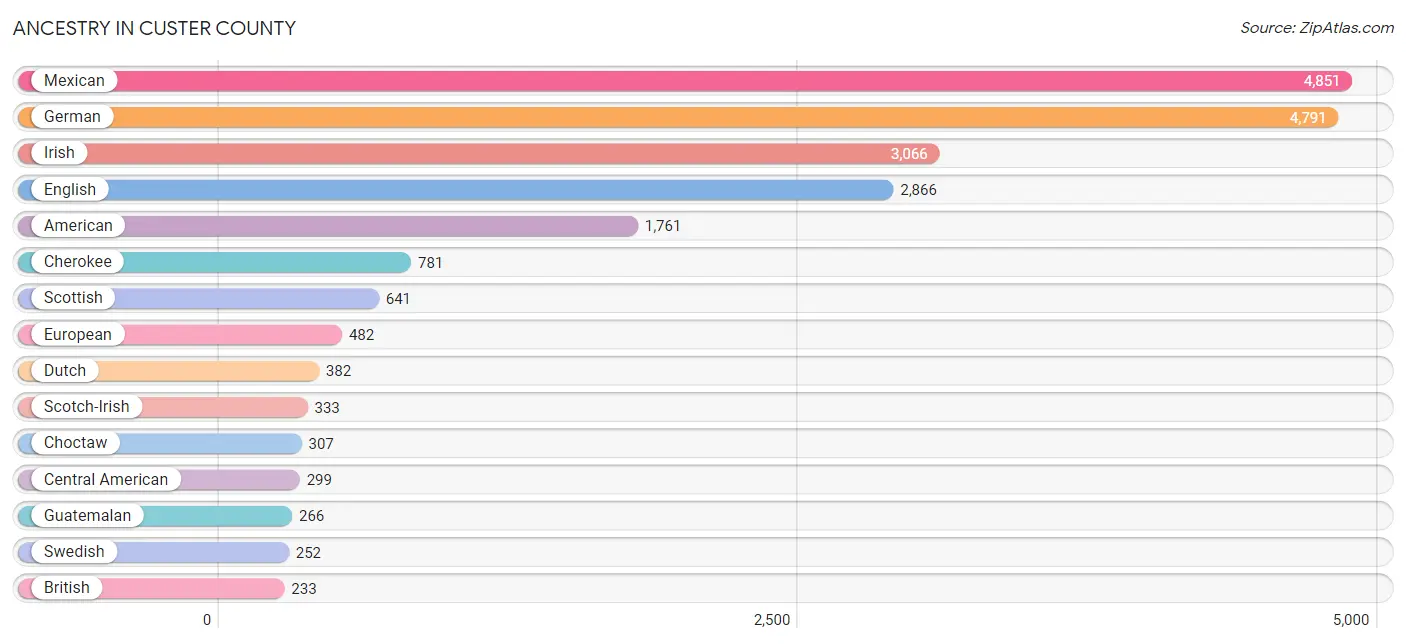
Ancestry in Custer County
The most populous ancestries reported in Custer County are Mexican (4,851 | 17.1%), German (4,791 | 16.9%), Irish (3,066 | 10.8%), English (2,866 | 10.1%), and American (1,761 | 6.2%), together accounting for 61.1% of all Custer County residents.
| Ancestry | # Population | % Population |
| African | 9 | 0.0% |
| American | 1,761 | 6.2% |
| Apache | 105 | 0.4% |
| Arab | 6 | 0.0% |
| Belgian | 73 | 0.3% |
| Bhutanese | 62 | 0.2% |
| Blackfeet | 2 | 0.0% |
| British | 233 | 0.8% |
| Burmese | 27 | 0.1% |
| Canadian | 45 | 0.2% |
| Central American | 299 | 1.1% |
| Central American Indian | 2 | 0.0% |
| Cherokee | 781 | 2.8% |
| Cheyenne | 194 | 0.7% |
| Chickasaw | 110 | 0.4% |
| Chippewa | 9 | 0.0% |
| Choctaw | 307 | 1.1% |
| Comanche | 31 | 0.1% |
| Creek | 229 | 0.8% |
| Cuban | 2 | 0.0% |
| Czech | 55 | 0.2% |
| Danish | 18 | 0.1% |
| Delaware | 17 | 0.1% |
| Dutch | 382 | 1.3% |
| Dutch West Indian | 34 | 0.1% |
| English | 2,866 | 10.1% |
| European | 482 | 1.7% |
| Filipino | 38 | 0.1% |
| Finnish | 3 | 0.0% |
| French | 206 | 0.7% |
| French American Indian | 13 | 0.1% |
| French Canadian | 8 | 0.0% |
| German | 4,791 | 16.9% |
| Guatemalan | 266 | 0.9% |
| Hungarian | 11 | 0.0% |
| Indian (Asian) | 141 | 0.5% |
| Irish | 3,066 | 10.8% |
| Israeli | 21 | 0.1% |
| Italian | 200 | 0.7% |
| Kiowa | 63 | 0.2% |
| Korean | 169 | 0.6% |
| Mexican | 4,851 | 17.1% |
| Moroccan | 6 | 0.0% |
| Native Hawaiian | 57 | 0.2% |
| Navajo | 2 | 0.0% |
| Nicaraguan | 3 | 0.0% |
| Northern European | 25 | 0.1% |
| Norwegian | 122 | 0.4% |
| Osage | 209 | 0.7% |
| Pakistani | 31 | 0.1% |
| Panamanian | 7 | 0.0% |
| Pennsylvania German | 127 | 0.4% |
| Peruvian | 8 | 0.0% |
| Polish | 187 | 0.7% |
| Potawatomi | 125 | 0.4% |
| Puerto Rican | 40 | 0.1% |
| Russian | 136 | 0.5% |
| Salvadoran | 23 | 0.1% |
| Scandinavian | 179 | 0.6% |
| Scotch-Irish | 333 | 1.2% |
| Scottish | 641 | 2.3% |
| Seminole | 53 | 0.2% |
| Shoshone | 2 | 0.0% |
| Sioux | 16 | 0.1% |
| South American | 8 | 0.0% |
| Spaniard | 59 | 0.2% |
| Spanish | 57 | 0.2% |
| Sri Lankan | 148 | 0.5% |
| Subsaharan African | 9 | 0.0% |
| Swedish | 252 | 0.9% |
| Swiss | 62 | 0.2% |
| Thai | 29 | 0.1% |
| Tlingit-Haida | 12 | 0.0% |
| Trinidadian and Tobagonian | 25 | 0.1% |
| Ukrainian | 22 | 0.1% |
| Welsh | 31 | 0.1% | View All 76 Rows |
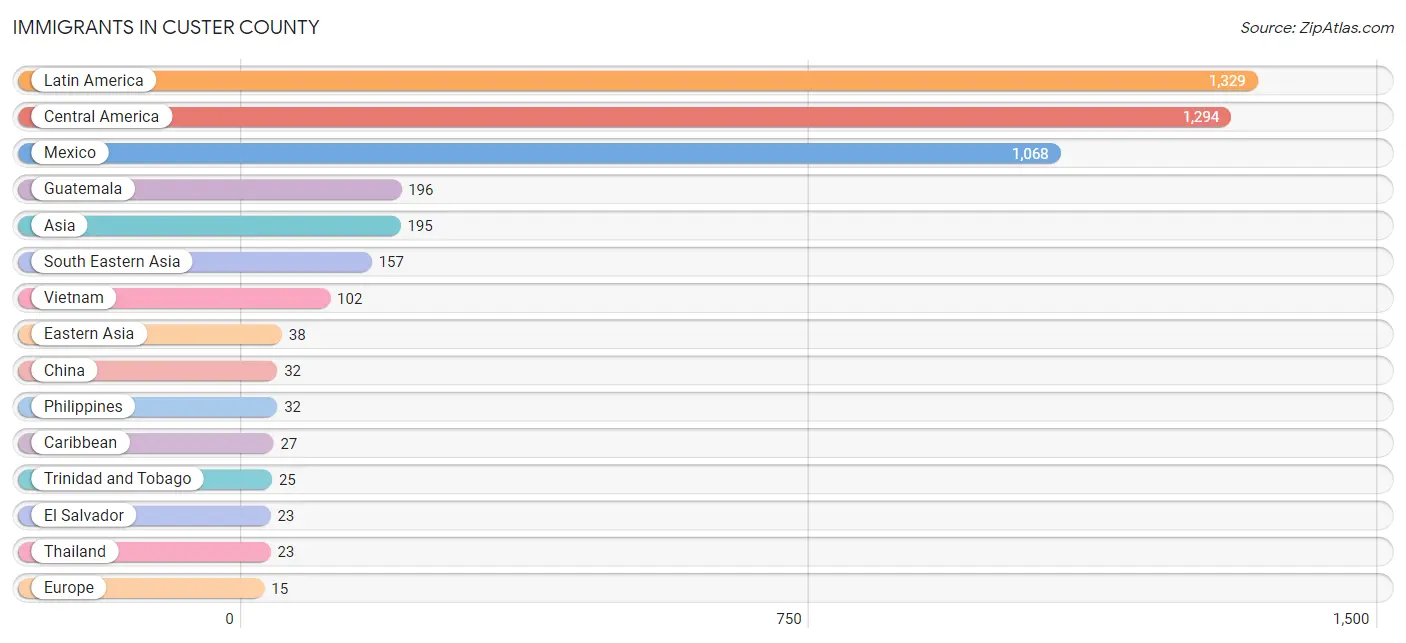
Immigrants in Custer County
The most numerous immigrant groups reported in Custer County came from Latin America (1,329 | 4.7%), Central America (1,294 | 4.6%), Mexico (1,068 | 3.8%), Guatemala (196 | 0.7%), and Asia (195 | 0.7%), together accounting for 14.4% of all Custer County residents.
| Immigration Origin | # Population | % Population |
| Africa | 6 | 0.0% |
| Asia | 195 | 0.7% |
| Australia | 3 | 0.0% |
| Caribbean | 27 | 0.1% |
| Central America | 1,294 | 4.6% |
| China | 32 | 0.1% |
| Cuba | 2 | 0.0% |
| Eastern Asia | 38 | 0.1% |
| El Salvador | 23 | 0.1% |
| Europe | 15 | 0.1% |
| Germany | 4 | 0.0% |
| Guatemala | 196 | 0.7% |
| Japan | 6 | 0.0% |
| Latin America | 1,329 | 4.7% |
| Mexico | 1,068 | 3.8% |
| Morocco | 6 | 0.0% |
| Northern Africa | 6 | 0.0% |
| Oceania | 3 | 0.0% |
| Panama | 7 | 0.0% |
| Peru | 8 | 0.0% |
| Philippines | 32 | 0.1% |
| South America | 8 | 0.0% |
| South Eastern Asia | 157 | 0.5% |
| Switzerland | 11 | 0.0% |
| Taiwan | 11 | 0.0% |
| Thailand | 23 | 0.1% |
| Trinidad and Tobago | 25 | 0.1% |
| Vietnam | 102 | 0.4% |
| Western Europe | 15 | 0.1% | View All 29 Rows |
Sex and Age in Custer County
Sex and Age in Custer County
The most populous age groups in Custer County are 20 to 24 Years (1,854 | 13.4%) for men and 20 to 24 Years (1,481 | 10.2%) for women.

| Age Bracket | Male | Female |
| Under 5 Years | 890 (6.4%) | 969 (6.7%) |
| 5 to 9 Years | 985 (7.1%) | 987 (6.8%) |
| 10 to 14 Years | 951 (6.9%) | 1,111 (7.6%) |
| 15 to 19 Years | 1,051 (7.6%) | 1,452 (10.0%) |
| 20 to 24 Years | 1,854 (13.4%) | 1,481 (10.2%) |
| 25 to 29 Years | 879 (6.4%) | 857 (5.9%) |
| 30 to 34 Years | 764 (5.5%) | 771 (5.3%) |
| 35 to 39 Years | 1,042 (7.5%) | 1,184 (8.1%) |
| 40 to 44 Years | 862 (6.2%) | 584 (4.0%) |
| 45 to 49 Years | 667 (4.8%) | 588 (4.0%) |
| 50 to 54 Years | 569 (4.1%) | 699 (4.8%) |
| 55 to 59 Years | 780 (5.6%) | 794 (5.5%) |
| 60 to 64 Years | 839 (6.1%) | 856 (5.9%) |
| 65 to 69 Years | 467 (3.4%) | 691 (4.8%) |
| 70 to 74 Years | 573 (4.1%) | 513 (3.5%) |
| 75 to 79 Years | 305 (2.2%) | 242 (1.7%) |
| 80 to 84 Years | 158 (1.1%) | 332 (2.3%) |
| 85 Years and over | 206 (1.5%) | 438 (3.0%) |
| Total | 13,842 (100.0%) | 14,549 (100.0%) |
Families and Households in Custer County
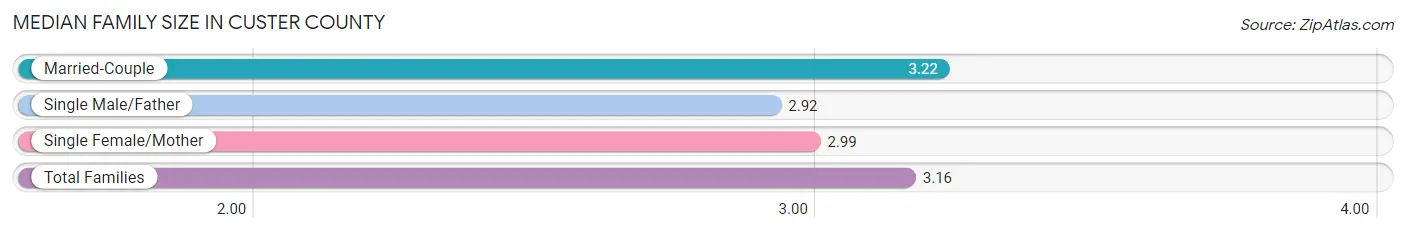
Median Family Size in Custer County
The median family size in Custer County is 3.16 persons per family, with married-couple families (5,066 | 76.8%) accounting for the largest median family size of 3.22 persons per family. On the other hand, single male/father families (584 | 8.8%) represent the smallest median family size with 2.92 persons per family.
| Family Type | # Families | Family Size |
| Married-Couple | 5,066 (76.8%) | 3.22 |
| Single Male/Father | 584 (8.8%) | 2.92 |
| Single Female/Mother | 946 (14.3%) | 2.99 |
| Total Families | 6,596 (100.0%) | 3.16 |
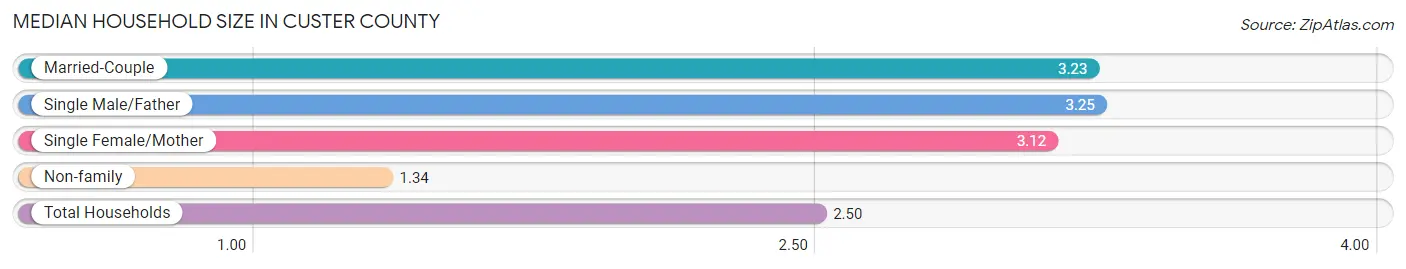
Median Household Size in Custer County
The median household size in Custer County is 2.50 persons per household, with single male/father households (584 | 5.5%) accounting for the largest median household size of 3.25 persons per household. non-family households (4,104 | 38.4%) represent the smallest median household size with 1.34 persons per household.
| Household Type | # Households | Household Size |
| Married-Couple | 5,066 (47.3%) | 3.23 |
| Single Male/Father | 584 (5.5%) | 3.25 |
| Single Female/Mother | 946 (8.8%) | 3.12 |
| Non-family | 4,104 (38.4%) | 1.34 |
| Total Households | 10,700 (100.0%) | 2.50 |
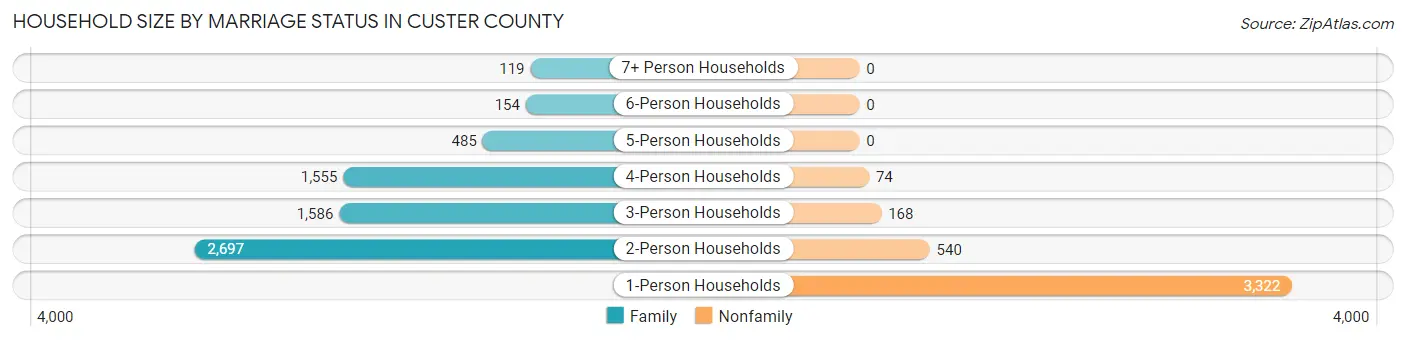
Household Size by Marriage Status in Custer County
Out of a total of 10,700 households in Custer County, 6,596 (61.6%) are family households, while 4,104 (38.4%) are nonfamily households. The most numerous type of family households are 2-person households, comprising 2,697, and the most common type of nonfamily households are 1-person households, comprising 3,322.
| Household Size | Family Households | Nonfamily Households |
| 1-Person Households | - | 3,322 (31.0%) |
| 2-Person Households | 2,697 (25.2%) | 540 (5.1%) |
| 3-Person Households | 1,586 (14.8%) | 168 (1.6%) |
| 4-Person Households | 1,555 (14.5%) | 74 (0.7%) |
| 5-Person Households | 485 (4.5%) | 0 (0.0%) |
| 6-Person Households | 154 (1.4%) | 0 (0.0%) |
| 7+ Person Households | 119 (1.1%) | 0 (0.0%) |
| Total | 6,596 (61.6%) | 4,104 (38.4%) |
Female Fertility in Custer County
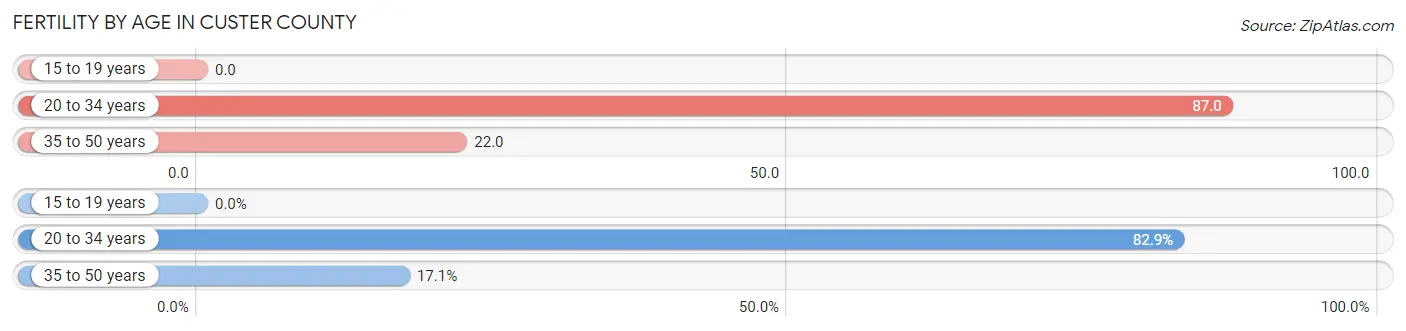
Fertility by Age in Custer County
Average fertility rate in Custer County is 46.0 births per 1,000 women. Women in the age bracket of 20 to 34 years have the highest fertility rate with 87.0 births per 1,000 women. Women in the age bracket of 20 to 34 years acount for 82.9% of all women with births.
| Age Bracket | Women with Births | Births / 1,000 Women |
| 15 to 19 years | 0 (0.0%) | 0.0 |
| 20 to 34 years | 271 (82.9%) | 87.0 |
| 35 to 50 years | 56 (17.1%) | 22.0 |
| Total | 327 (100.0%) | 46.0 |
Fertility by Age by Marriage Status in Custer County
62.7% of women with births (327) in Custer County are married. The highest percentage of unmarried women with births falls into 20 to 34 years age bracket with 45.0% of them unmarried at the time of birth, while the lowest percentage of unmarried women with births belong to 35 to 50 years age bracket with 0.0% of them unmarried.
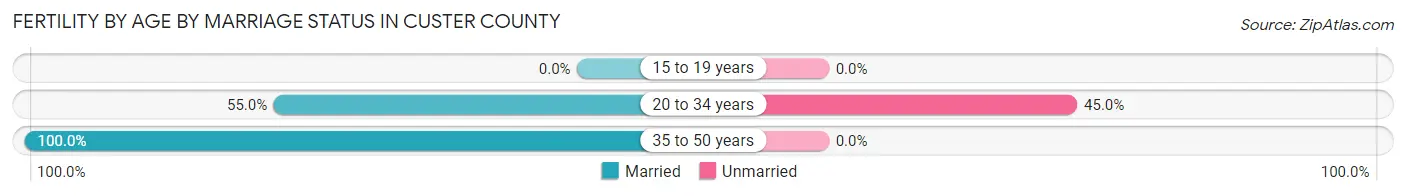
| Age Bracket | Married | Unmarried |
| 15 to 19 years | 0 (0.0%) | 0 (0.0%) |
| 20 to 34 years | 149 (55.0%) | 122 (45.0%) |
| 35 to 50 years | 56 (100.0%) | 0 (0.0%) |
| Total | 205 (62.7%) | 122 (37.3%) |
Fertility by Education in Custer County
Average fertility rate in Custer County is 46.0 births per 1,000 women. Women with the education attainment of high school diploma have the highest fertility rate of 108.0 births per 1,000 women, while women with the education attainment of less than high school have the lowest fertility at 8.0 births per 1,000 women. Women with the education attainment of high school diploma represent 48.3% of all women with births.
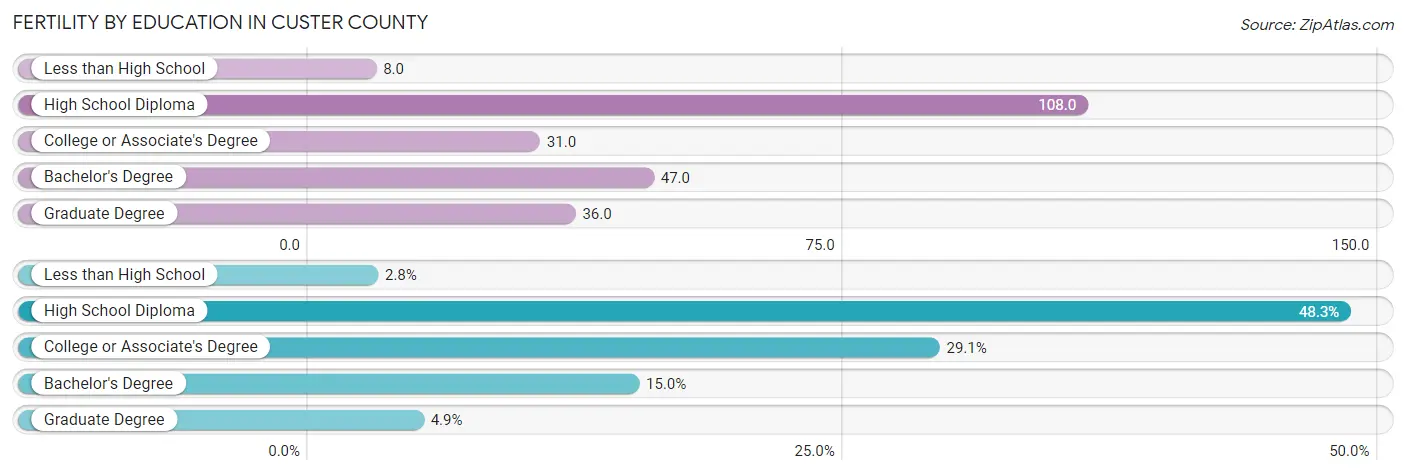
| Educational Attainment | Women with Births | Births / 1,000 Women |
| Less than High School | 9 (2.8%) | 8.0 |
| High School Diploma | 158 (48.3%) | 108.0 |
| College or Associate's Degree | 95 (29.0%) | 31.0 |
| Bachelor's Degree | 49 (15.0%) | 47.0 |
| Graduate Degree | 16 (4.9%) | 36.0 |
| Total | 327 (100.0%) | 46.0 |
Fertility by Education by Marriage Status in Custer County
37.3% of women with births in Custer County are unmarried. Women with the educational attainment of less than high school are most likely to be married with 100.0% of them married at childbirth, while women with the educational attainment of high school diploma are least likely to be married with 60.8% of them unmarried at childbirth.
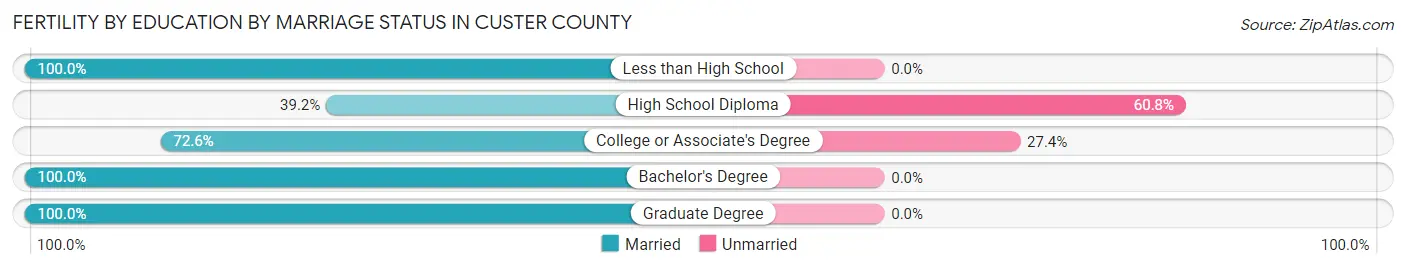
| Educational Attainment | Married | Unmarried |
| Less than High School | 9 (100.0%) | 0 (0.0%) |
| High School Diploma | 62 (39.2%) | 96 (60.8%) |
| College or Associate's Degree | 69 (72.6%) | 26 (27.4%) |
| Bachelor's Degree | 49 (100.0%) | 0 (0.0%) |
| Graduate Degree | 16 (100.0%) | 0 (0.0%) |
| Total | 205 (62.7%) | 122 (37.3%) |
Income in Custer County
Income Overview in Custer County
Per Capita Income in Custer County is $30,880, while median incomes of families and households are $78,768 and $58,669 respectively.
| Characteristic | Number | Measure |
| Per Capita Income | 28,391 | $30,880 |
| Median Family Income | 6,596 | $78,768 |
| Mean Family Income | 6,596 | $103,417 |
| Median Household Income | 10,700 | $58,669 |
| Mean Household Income | 10,700 | $81,410 |
| Income Deficit | 6,596 | $10,075 |
| Wage / Income Gap (%) | 28,391 | 40.07% |
| Wage / Income Gap ($) | 28,391 | 59.93¢ per $1 |
| Gini / Inequality Index | 28,391 | 0.48 |
Earnings by Sex in Custer County
Average Earnings in Custer County are $31,270, $39,895 for men and $23,910 for women, a difference of 40.1%.
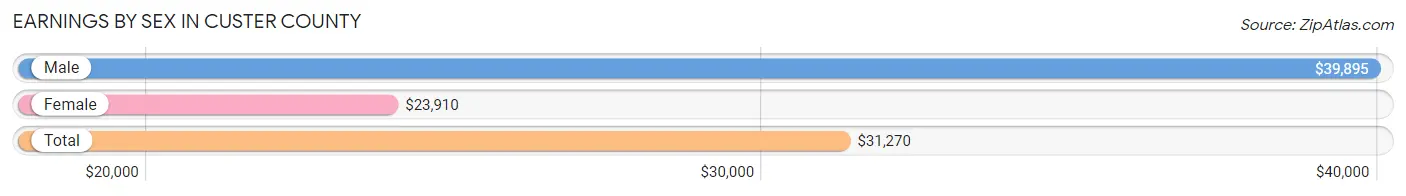
| Sex | Number | Average Earnings |
| Male | 8,331 (53.3%) | $39,895 |
| Female | 7,306 (46.7%) | $23,910 |
| Total | 15,637 (100.0%) | $31,270 |
Earnings by Sex by Income Bracket in Custer County
The most common earnings brackets in Custer County are $100,000+ for men (1,069 | 12.8%) and $25,000 to $29,999 for women (631 | 8.6%).
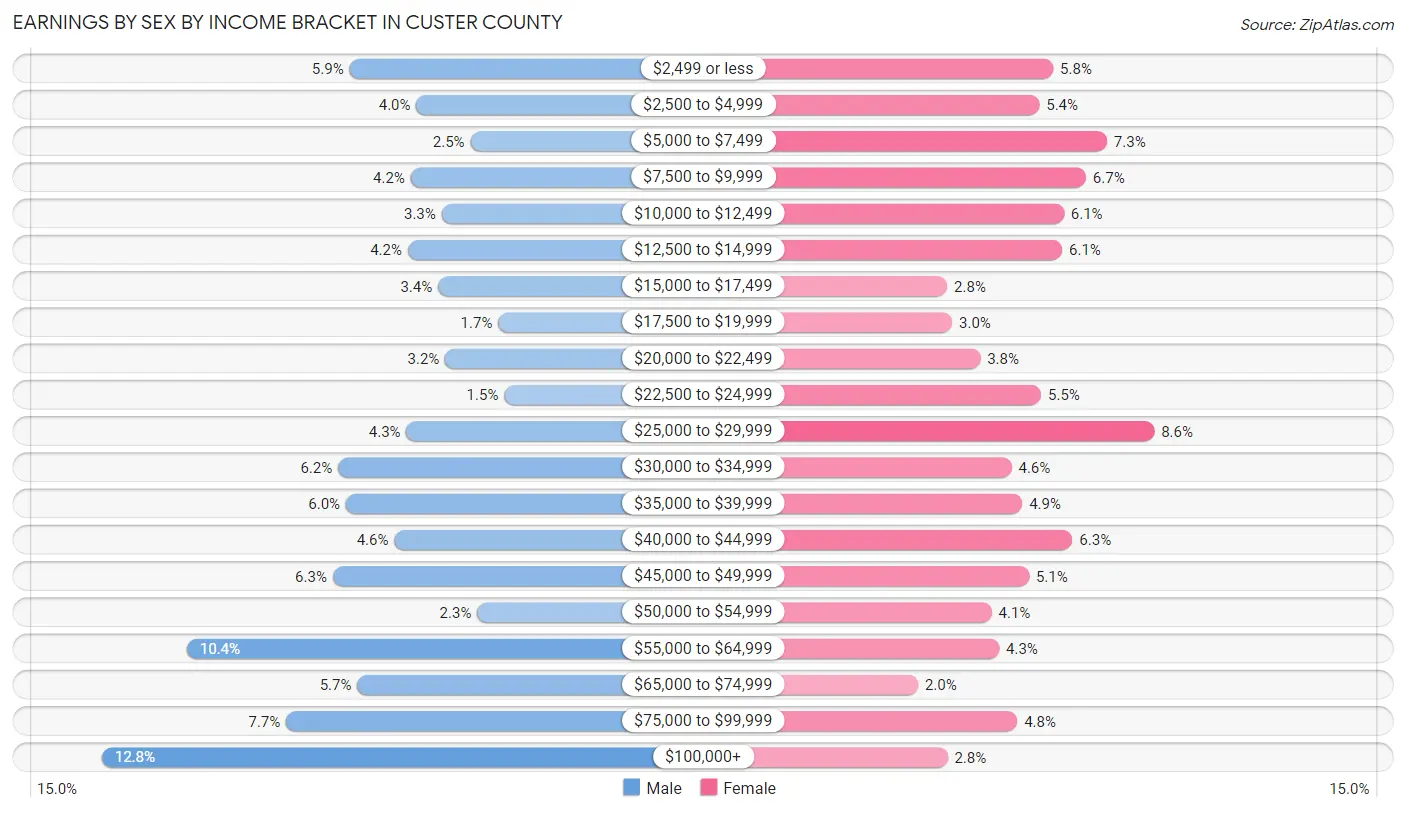
| Income | Male | Female |
| $2,499 or less | 489 (5.9%) | 424 (5.8%) |
| $2,500 to $4,999 | 332 (4.0%) | 395 (5.4%) |
| $5,000 to $7,499 | 206 (2.5%) | 534 (7.3%) |
| $7,500 to $9,999 | 346 (4.2%) | 491 (6.7%) |
| $10,000 to $12,499 | 273 (3.3%) | 446 (6.1%) |
| $12,500 to $14,999 | 352 (4.2%) | 442 (6.0%) |
| $15,000 to $17,499 | 282 (3.4%) | 206 (2.8%) |
| $17,500 to $19,999 | 141 (1.7%) | 216 (3.0%) |
| $20,000 to $22,499 | 265 (3.2%) | 274 (3.7%) |
| $22,500 to $24,999 | 127 (1.5%) | 399 (5.5%) |
| $25,000 to $29,999 | 356 (4.3%) | 631 (8.6%) |
| $30,000 to $34,999 | 516 (6.2%) | 338 (4.6%) |
| $35,000 to $39,999 | 497 (6.0%) | 360 (4.9%) |
| $40,000 to $44,999 | 384 (4.6%) | 463 (6.3%) |
| $45,000 to $49,999 | 528 (6.3%) | 374 (5.1%) |
| $50,000 to $54,999 | 190 (2.3%) | 297 (4.1%) |
| $55,000 to $64,999 | 870 (10.4%) | 313 (4.3%) |
| $65,000 to $74,999 | 471 (5.7%) | 146 (2.0%) |
| $75,000 to $99,999 | 637 (7.6%) | 350 (4.8%) |
| $100,000+ | 1,069 (12.8%) | 207 (2.8%) |
| Total | 8,331 (100.0%) | 7,306 (100.0%) |
Earnings by Sex by Educational Attainment in Custer County
Average earnings in Custer County are $55,326 for men and $30,009 for women, a difference of 45.8%. Men with an educational attainment of graduate degree enjoy the highest average annual earnings of $79,583, while those with less than high school education earn the least with $45,663. Women with an educational attainment of graduate degree earn the most with the average annual earnings of $58,333, while those with less than high school education have the smallest earnings of $16,741.
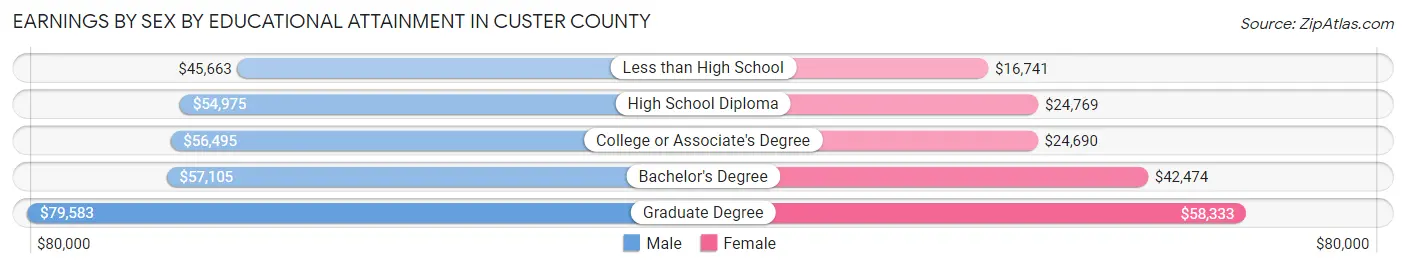
| Educational Attainment | Male Income | Female Income |
| Less than High School | $45,663 | $16,741 |
| High School Diploma | $54,975 | $24,769 |
| College or Associate's Degree | $56,495 | $24,690 |
| Bachelor's Degree | $57,105 | $42,474 |
| Graduate Degree | $79,583 | $58,333 |
| Total | $55,326 | $30,009 |
Family Income in Custer County
Family Income Brackets in Custer County
According to the Custer County family income data, there are 1,240 families falling into the $50,000 to $74,999 income range, which is the most common income bracket and makes up 18.8% of all families. Conversely, the less than $10,000 income bracket is the least frequent group with only 185 families (2.8%) belonging to this category.
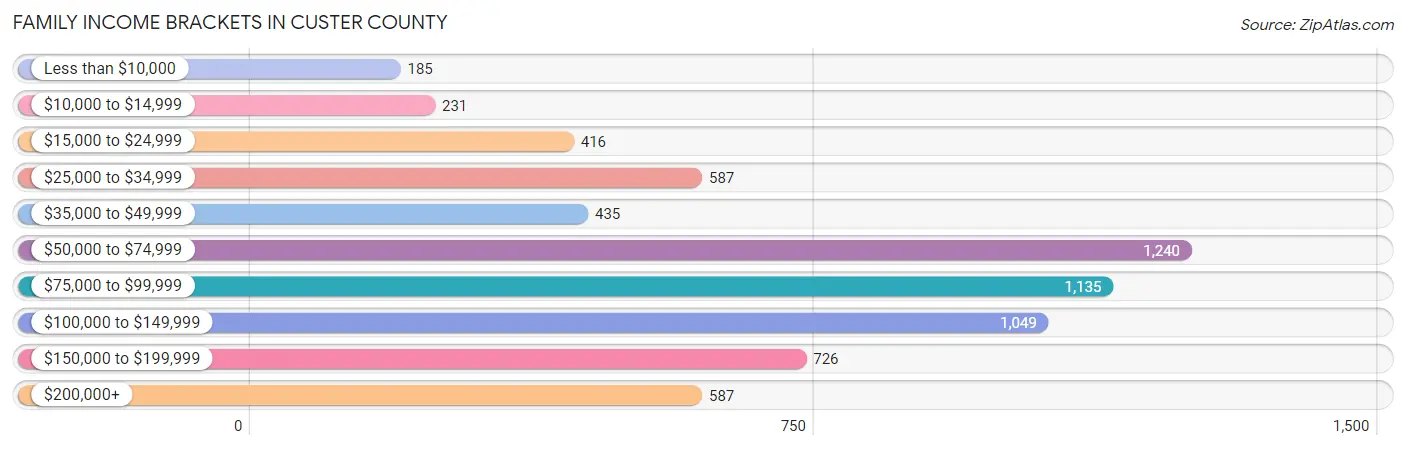
| Income Bracket | # Families | % Families |
| Less than $10,000 | 185 | 2.8% |
| $10,000 to $14,999 | 231 | 3.5% |
| $15,000 to $24,999 | 416 | 6.3% |
| $25,000 to $34,999 | 587 | 8.9% |
| $35,000 to $49,999 | 435 | 6.6% |
| $50,000 to $74,999 | 1,240 | 18.8% |
| $75,000 to $99,999 | 1,135 | 17.2% |
| $100,000 to $149,999 | 1,049 | 15.9% |
| $150,000 to $199,999 | 726 | 11.0% |
| $200,000+ | 587 | 8.9% |
Family Income by Famaliy Size in Custer County
4-person families (1,402 | 21.3%) account for the highest median family income in Custer County with $123,182 per family, while 2-person families (2,776 | 42.1%) have the highest median income of $38,900 per family member.
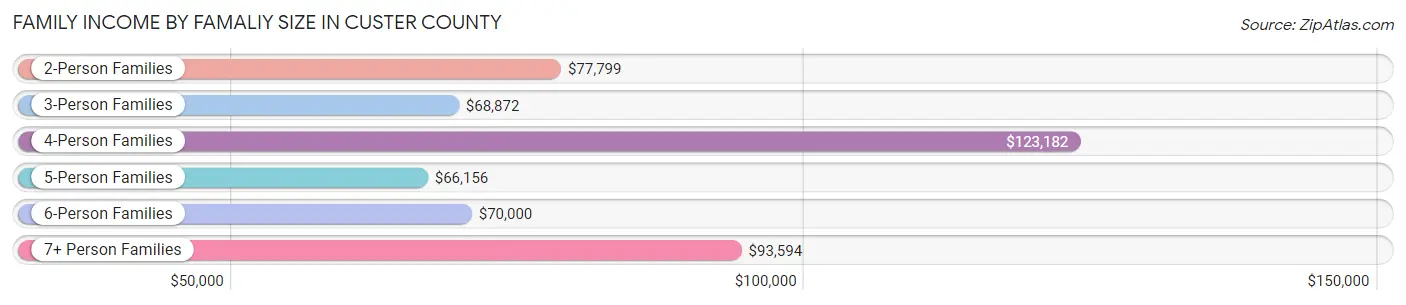
| Income Bracket | # Families | Median Income |
| 2-Person Families | 2,776 (42.1%) | $77,799 |
| 3-Person Families | 1,703 (25.8%) | $68,872 |
| 4-Person Families | 1,402 (21.3%) | $123,182 |
| 5-Person Families | 511 (7.7%) | $66,156 |
| 6-Person Families | 114 (1.7%) | $70,000 |
| 7+ Person Families | 90 (1.4%) | $93,594 |
| Total | 6,596 (100.0%) | $78,768 |
Family Income by Number of Earners in Custer County
The median family income in Custer County is $78,768, with families comprising 3+ earners (605) having the highest median family income of $150,865, while families with 1 earner (2,308) have the lowest median family income of $46,410, accounting for 9.2% and 35.0% of families, respectively.
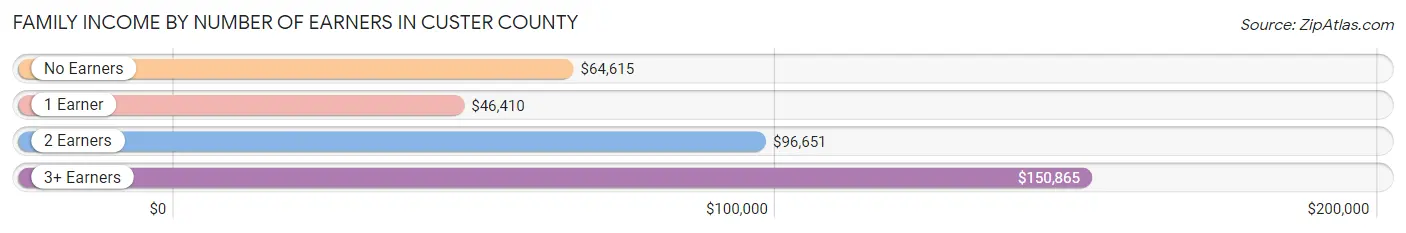
| Number of Earners | # Families | Median Income |
| No Earners | 764 (11.6%) | $64,615 |
| 1 Earner | 2,308 (35.0%) | $46,410 |
| 2 Earners | 2,919 (44.3%) | $96,651 |
| 3+ Earners | 605 (9.2%) | $150,865 |
| Total | 6,596 (100.0%) | $78,768 |
Household Income in Custer County
Household Income Brackets in Custer County
With 1,851 households falling in the category, the $50,000 to $74,999 income range is the most frequent in Custer County, accounting for 17.3% of all households. In contrast, only 610 households (5.7%) fall into the $200,000+ income bracket, making it the least populous group.
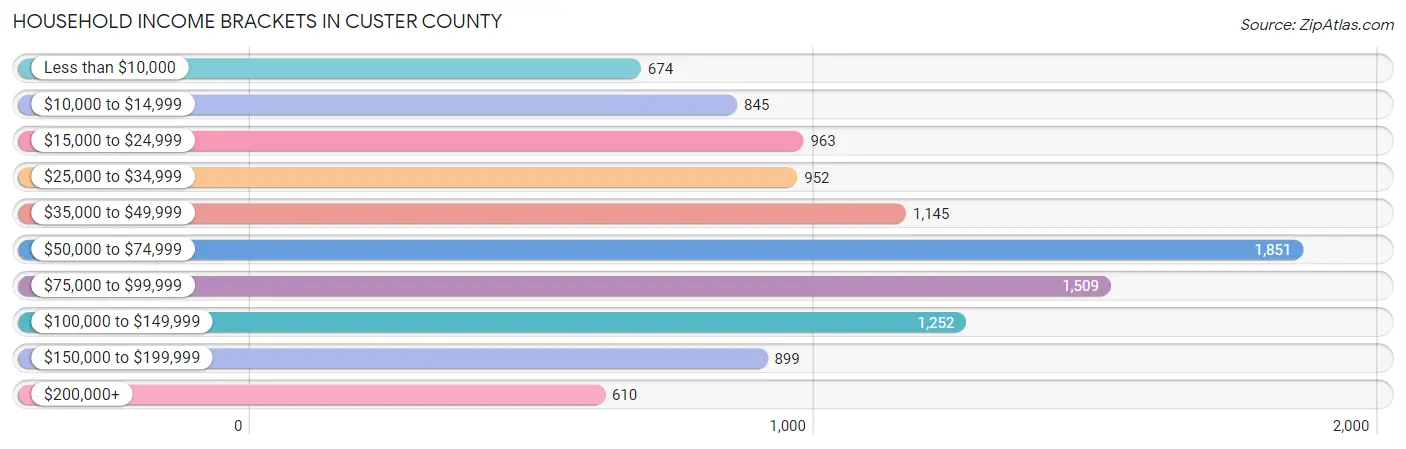
| Income Bracket | # Households | % Households |
| Less than $10,000 | 674 | 6.3% |
| $10,000 to $14,999 | 845 | 7.9% |
| $15,000 to $24,999 | 963 | 9.0% |
| $25,000 to $34,999 | 952 | 8.9% |
| $35,000 to $49,999 | 1,145 | 10.7% |
| $50,000 to $74,999 | 1,851 | 17.3% |
| $75,000 to $99,999 | 1,509 | 14.1% |
| $100,000 to $149,999 | 1,252 | 11.7% |
| $150,000 to $199,999 | 899 | 8.4% |
| $200,000+ | 610 | 5.7% |
Household Income by Householder Age in Custer County
The median household income in Custer County is $58,669, with the highest median household income of $71,238 found in the 45 to 64 years age bracket for the primary householder. A total of 3,280 households (30.6%) fall into this category. Meanwhile, the 15 to 24 years age bracket for the primary householder has the lowest median household income of $25,476, with 1,352 households (12.6%) in this group.

| Income Bracket | # Households | Median Income |
| 15 to 24 Years | 1,352 (12.6%) | $25,476 |
| 25 to 44 Years | 3,837 (35.9%) | $66,197 |
| 45 to 64 Years | 3,280 (30.6%) | $71,238 |
| 65+ Years | 2,231 (20.8%) | $56,763 |
| Total | 10,700 (100.0%) | $58,669 |
Poverty in Custer County
Income Below Poverty by Sex and Age in Custer County
With 14.4% poverty level for males and 17.6% for females among the residents of Custer County, 18 to 24 year old males and 18 to 24 year old females are the most vulnerable to poverty, with 923 males (48.6%) and 834 females (48.9%) in their respective age groups living below the poverty level.

| Age Bracket | Male | Female |
| Under 5 Years | 58 (6.8%) | 116 (12.1%) |
| 5 Years | 0 (0.0%) | 26 (10.4%) |
| 6 to 11 Years | 94 (8.1%) | 111 (10.1%) |
| 12 to 14 Years | 117 (19.5%) | 55 (7.4%) |
| 15 Years | 25 (10.3%) | 60 (29.7%) |
| 16 and 17 Years | 90 (27.3%) | 50 (13.5%) |
| 18 to 24 Years | 923 (48.6%) | 834 (48.9%) |
| 25 to 34 Years | 68 (4.3%) | 372 (22.9%) |
| 35 to 44 Years | 173 (9.2%) | 175 (9.9%) |
| 45 to 54 Years | 45 (3.7%) | 175 (13.6%) |
| 55 to 64 Years | 190 (12.2%) | 101 (6.2%) |
| 65 to 74 Years | 94 (9.6%) | 186 (16.8%) |
| 75 Years and over | 4 (0.7%) | 148 (15.8%) |
| Total | 1,881 (14.4%) | 2,409 (17.6%) |
Income Above Poverty by Sex and Age in Custer County
According to the poverty statistics in Custer County, males aged 5 years and females aged 55 to 64 years are the age groups that are most secure financially, with 100.0% of males and 93.8% of females in these age groups living above the poverty line.
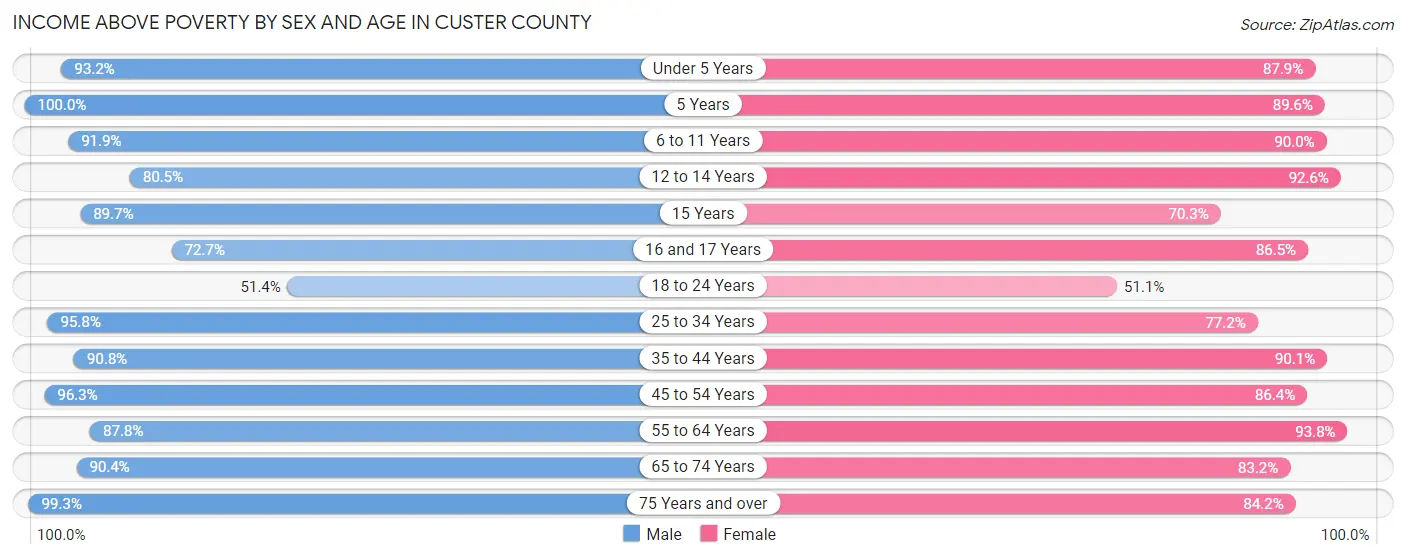
| Age Bracket | Male | Female |
| Under 5 Years | 790 (93.2%) | 839 (87.8%) |
| 5 Years | 173 (100.0%) | 225 (89.6%) |
| 6 to 11 Years | 1,066 (91.9%) | 993 (89.9%) |
| 12 to 14 Years | 482 (80.5%) | 688 (92.6%) |
| 15 Years | 217 (89.7%) | 142 (70.3%) |
| 16 and 17 Years | 240 (72.7%) | 321 (86.5%) |
| 18 to 24 Years | 975 (51.4%) | 872 (51.1%) |
| 25 to 34 Years | 1,531 (95.8%) | 1,256 (77.1%) |
| 35 to 44 Years | 1,716 (90.8%) | 1,585 (90.1%) |
| 45 to 54 Years | 1,183 (96.3%) | 1,108 (86.4%) |
| 55 to 64 Years | 1,373 (87.8%) | 1,539 (93.8%) |
| 65 to 74 Years | 882 (90.4%) | 922 (83.2%) |
| 75 Years and over | 542 (99.3%) | 790 (84.2%) |
| Total | 11,170 (85.6%) | 11,280 (82.4%) |
Income Below Poverty Among Married-Couple Families in Custer County
The poverty statistics for married-couple families in Custer County show that 4.1% or 206 of the total 5,066 families live below the poverty line. Families with 5 or more children have the highest poverty rate of 7.3%, comprising of 6 families. On the other hand, families with 3 or 4 children have the lowest poverty rate of 0.6%, which includes 2 families.

| Children | Above Poverty | Below Poverty |
| No Children | 2,399 (95.3%) | 119 (4.7%) |
| 1 or 2 Children | 2,046 (96.3%) | 79 (3.7%) |
| 3 or 4 Children | 339 (99.4%) | 2 (0.6%) |
| 5 or more Children | 76 (92.7%) | 6 (7.3%) |
| Total | 4,860 (95.9%) | 206 (4.1%) |
Income Below Poverty Among Single-Parent Households in Custer County
According to the poverty data in Custer County, 9.4% or 55 single-father households and 39.4% or 373 single-mother households are living below the poverty line. Among single-father households, those with 1 or 2 children have the highest poverty rate, with 55 households (12.2%) experiencing poverty. Likewise, among single-mother households, those with 3 or 4 children have the highest poverty rate, with 70 households (64.2%) falling below the poverty line.
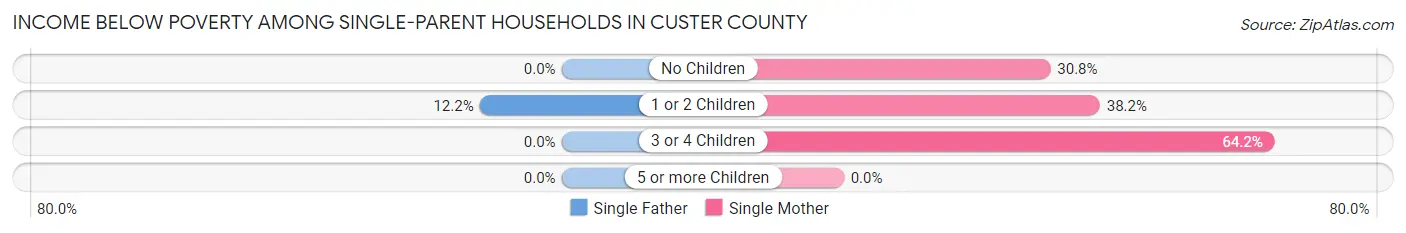
| Children | Single Father | Single Mother |
| No Children | 0 (0.0%) | 69 (30.8%) |
| 1 or 2 Children | 55 (12.2%) | 234 (38.2%) |
| 3 or 4 Children | 0 (0.0%) | 70 (64.2%) |
| 5 or more Children | 0 (0.0%) | 0 (0.0%) |
| Total | 55 (9.4%) | 373 (39.4%) |
Income Below Poverty Among Married-Couple vs Single-Parent Households in Custer County
The poverty data for Custer County shows that 206 of the married-couple family households (4.1%) and 428 of the single-parent households (28.0%) are living below the poverty level. Within the married-couple family households, those with 5 or more children have the highest poverty rate, with 6 households (7.3%) falling below the poverty line. Among the single-parent households, those with 3 or 4 children have the highest poverty rate, with 70 household (44.3%) living below poverty.
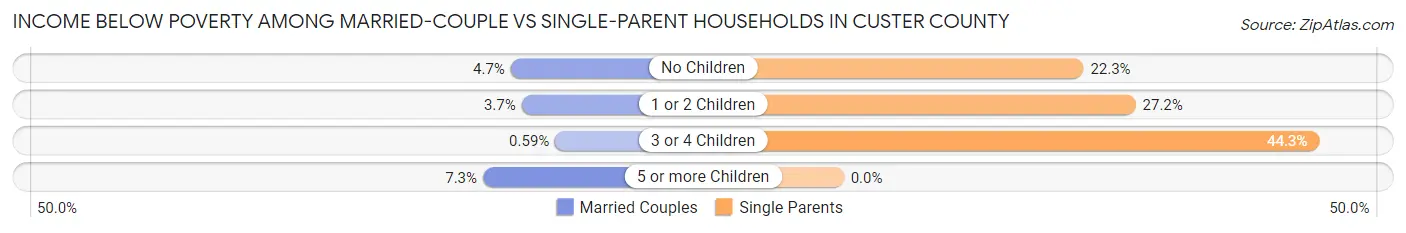
| Children | Married-Couple Families | Single-Parent Households |
| No Children | 119 (4.7%) | 69 (22.3%) |
| 1 or 2 Children | 79 (3.7%) | 289 (27.2%) |
| 3 or 4 Children | 2 (0.6%) | 70 (44.3%) |
| 5 or more Children | 6 (7.3%) | 0 (0.0%) |
| Total | 206 (4.1%) | 428 (28.0%) |
Employment Characteristics in Custer County
Employment by Class of Employer in Custer County
Among the 14,054 employed individuals in Custer County, private company employees (9,228 | 65.7%), state government employees (1,123 | 8.0%), and not-for-profit organizations (993 | 7.1%) make up the most common classes of employment.
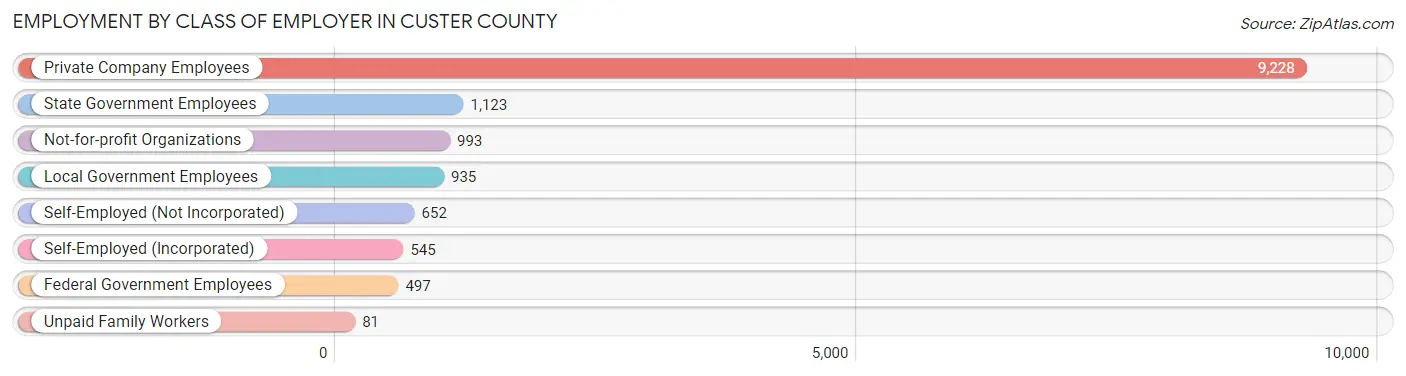
| Employer Class | # Employees | % Employees |
| Private Company Employees | 9,228 | 65.7% |
| Self-Employed (Incorporated) | 545 | 3.9% |
| Self-Employed (Not Incorporated) | 652 | 4.6% |
| Not-for-profit Organizations | 993 | 7.1% |
| Local Government Employees | 935 | 6.7% |
| State Government Employees | 1,123 | 8.0% |
| Federal Government Employees | 497 | 3.5% |
| Unpaid Family Workers | 81 | 0.6% |
| Total | 14,054 | 100.0% |
Employment Status by Age in Custer County
According to the labor force statistics for Custer County, out of the total population over 16 years of age (22,053), 66.6% or 14,687 individuals are in the labor force, with 2.9% or 426 of them unemployed. The age group with the highest labor force participation rate is 20 to 24 years, with 87.7% or 2,925 individuals in the labor force. Within the labor force, the 20 to 24 years age range has the highest percentage of unemployed individuals, with 7.7% or 225 of them being unemployed.
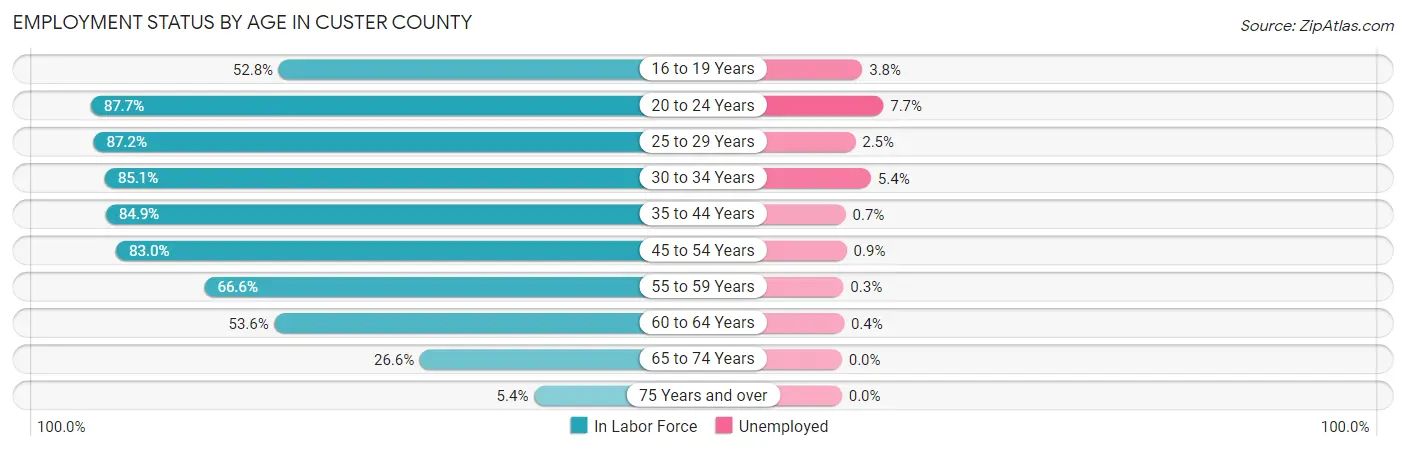
| Age Bracket | In Labor Force | Unemployed |
| 16 to 19 Years | 1,087 (52.8%) | 41 (3.8%) |
| 20 to 24 Years | 2,925 (87.7%) | 225 (7.7%) |
| 25 to 29 Years | 1,514 (87.2%) | 38 (2.5%) |
| 30 to 34 Years | 1,306 (85.1%) | 71 (5.4%) |
| 35 to 44 Years | 3,118 (84.9%) | 22 (0.7%) |
| 45 to 54 Years | 2,094 (83.0%) | 19 (0.9%) |
| 55 to 59 Years | 1,048 (66.6%) | 3 (0.3%) |
| 60 to 64 Years | 909 (53.6%) | 4 (0.4%) |
| 65 to 74 Years | 597 (26.6%) | 0 (0.0%) |
| 75 Years and over | 91 (5.4%) | 0 (0.0%) |
| Total | 14,687 (66.6%) | 426 (2.9%) |
Employment Status by Educational Attainment in Custer County
According to labor force statistics for Custer County, 78.4% of individuals (9,984) out of the total population between 25 and 64 years of age (12,735) are in the labor force, with 1.6% or 160 of them being unemployed. The group with the highest labor force participation rate are those with the educational attainment of bachelor's degree or higher, with 91.1% or 3,310 individuals in the labor force. Within the labor force, individuals with high school diploma education have the highest percentage of unemployment, with 2.7% or 70 of them being unemployed.
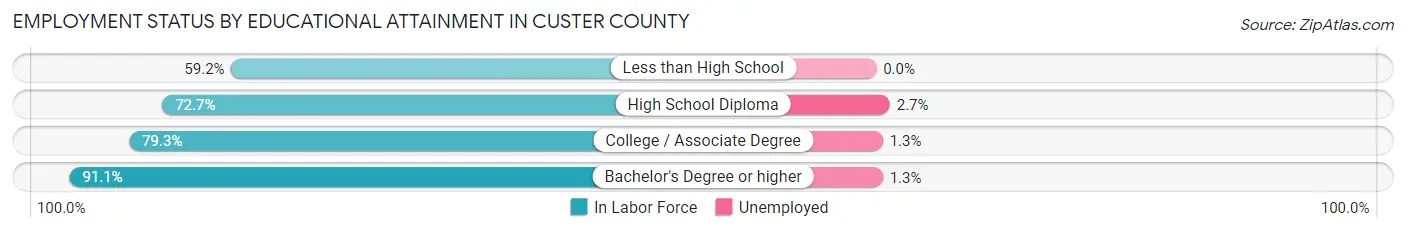
| Educational Attainment | In Labor Force | Unemployed |
| Less than High School | 899 (59.2%) | 0 (0.0%) |
| High School Diploma | 2,593 (72.7%) | 96 (2.7%) |
| College / Associate Degree | 3,185 (79.3%) | 52 (1.3%) |
| Bachelor's Degree or higher | 3,310 (91.1%) | 47 (1.3%) |
| Total | 9,984 (78.4%) | 204 (1.6%) |
Employment Occupations by Sex in Custer County
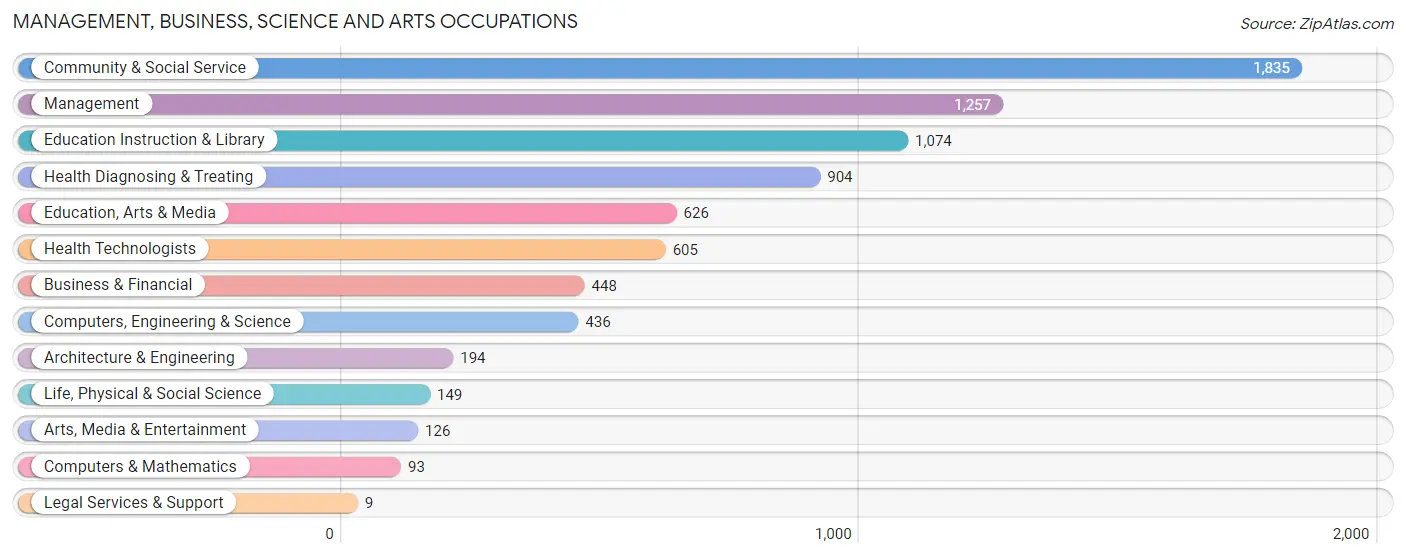
Management, Business, Science and Arts Occupations
The most common Management, Business, Science and Arts occupations in Custer County are Community & Social Service (1,835 | 12.9%), Management (1,257 | 8.8%), Education Instruction & Library (1,074 | 7.5%), Health Diagnosing & Treating (904 | 6.4%), and Education, Arts & Media (626 | 4.4%).
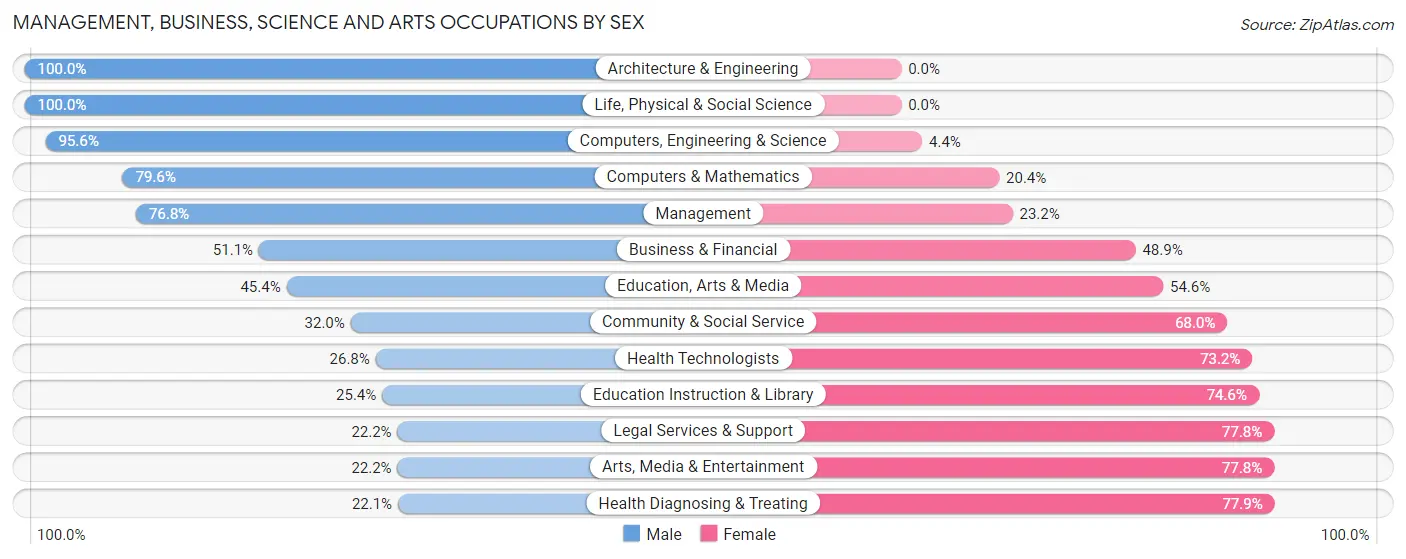
Management, Business, Science and Arts Occupations by Sex
Within the Management, Business, Science and Arts occupations in Custer County, the most male-oriented occupations are Architecture & Engineering (100.0%), Life, Physical & Social Science (100.0%), and Computers, Engineering & Science (95.6%), while the most female-oriented occupations are Health Diagnosing & Treating (77.9%), Legal Services & Support (77.8%), and Arts, Media & Entertainment (77.8%).
| Occupation | Male | Female |
| Management | 965 (76.8%) | 292 (23.2%) |
| Business & Financial | 229 (51.1%) | 219 (48.9%) |
| Computers, Engineering & Science | 417 (95.6%) | 19 (4.4%) |
| Computers & Mathematics | 74 (79.6%) | 19 (20.4%) |
| Architecture & Engineering | 194 (100.0%) | 0 (0.0%) |
| Life, Physical & Social Science | 149 (100.0%) | 0 (0.0%) |
| Community & Social Service | 587 (32.0%) | 1,248 (68.0%) |
| Education, Arts & Media | 284 (45.4%) | 342 (54.6%) |
| Legal Services & Support | 2 (22.2%) | 7 (77.8%) |
| Education Instruction & Library | 273 (25.4%) | 801 (74.6%) |
| Arts, Media & Entertainment | 28 (22.2%) | 98 (77.8%) |
| Health Diagnosing & Treating | 200 (22.1%) | 704 (77.9%) |
| Health Technologists | 162 (26.8%) | 443 (73.2%) |
| Total (Category) | 2,398 (49.1%) | 2,482 (50.9%) |
| Total (Overall) | 7,689 (54.0%) | 6,558 (46.0%) |
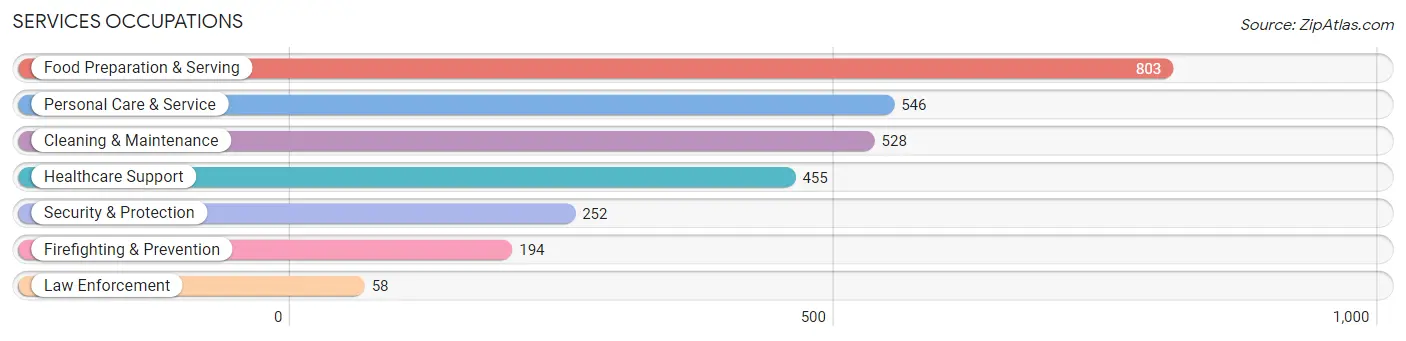
Services Occupations
The most common Services occupations in Custer County are Food Preparation & Serving (803 | 5.6%), Personal Care & Service (546 | 3.8%), Cleaning & Maintenance (528 | 3.7%), Healthcare Support (455 | 3.2%), and Security & Protection (252 | 1.8%).
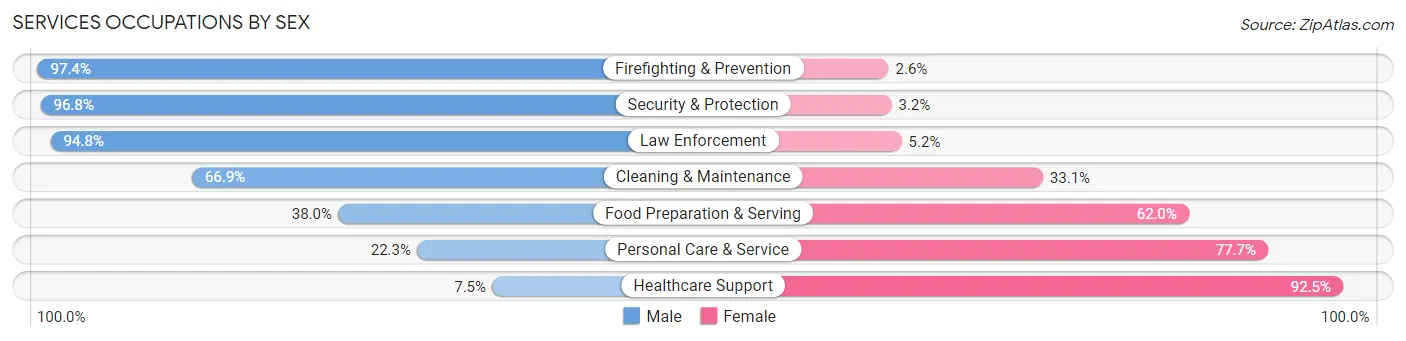
Services Occupations by Sex
Within the Services occupations in Custer County, the most male-oriented occupations are Firefighting & Prevention (97.4%), Security & Protection (96.8%), and Law Enforcement (94.8%), while the most female-oriented occupations are Healthcare Support (92.5%), Personal Care & Service (77.7%), and Food Preparation & Serving (62.0%).
| Occupation | Male | Female |
| Healthcare Support | 34 (7.5%) | 421 (92.5%) |
| Security & Protection | 244 (96.8%) | 8 (3.2%) |
| Firefighting & Prevention | 189 (97.4%) | 5 (2.6%) |
| Law Enforcement | 55 (94.8%) | 3 (5.2%) |
| Food Preparation & Serving | 305 (38.0%) | 498 (62.0%) |
| Cleaning & Maintenance | 353 (66.9%) | 175 (33.1%) |
| Personal Care & Service | 122 (22.3%) | 424 (77.7%) |
| Total (Category) | 1,058 (40.9%) | 1,526 (59.1%) |
| Total (Overall) | 7,689 (54.0%) | 6,558 (46.0%) |
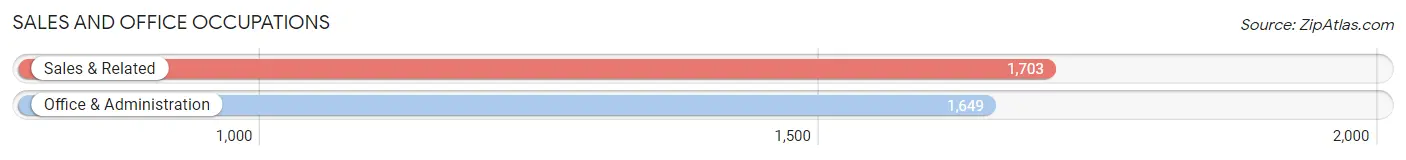
Sales and Office Occupations
The most common Sales and Office occupations in Custer County are Sales & Related (1,703 | 11.9%), and Office & Administration (1,649 | 11.6%).
Sales and Office Occupations by Sex

| Occupation | Male | Female |
| Sales & Related | 684 (40.2%) | 1,019 (59.8%) |
| Office & Administration | 465 (28.2%) | 1,184 (71.8%) |
| Total (Category) | 1,149 (34.3%) | 2,203 (65.7%) |
| Total (Overall) | 7,689 (54.0%) | 6,558 (46.0%) |
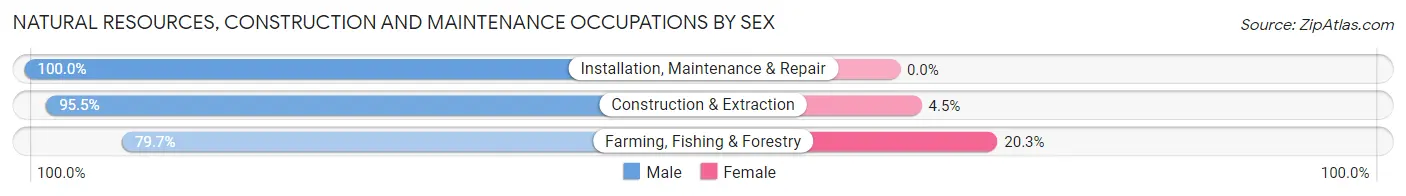
Natural Resources, Construction and Maintenance Occupations
The most common Natural Resources, Construction and Maintenance occupations in Custer County are Construction & Extraction (909 | 6.4%), Installation, Maintenance & Repair (476 | 3.3%), and Farming, Fishing & Forestry (222 | 1.6%).

Natural Resources, Construction and Maintenance Occupations by Sex
| Occupation | Male | Female |
| Farming, Fishing & Forestry | 177 (79.7%) | 45 (20.3%) |
| Construction & Extraction | 868 (95.5%) | 41 (4.5%) |
| Installation, Maintenance & Repair | 476 (100.0%) | 0 (0.0%) |
| Total (Category) | 1,521 (94.7%) | 86 (5.3%) |
| Total (Overall) | 7,689 (54.0%) | 6,558 (46.0%) |
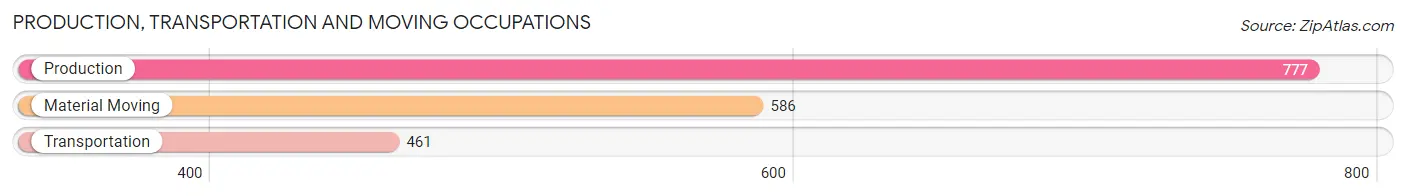
Production, Transportation and Moving Occupations
The most common Production, Transportation and Moving occupations in Custer County are Production (777 | 5.4%), Material Moving (586 | 4.1%), and Transportation (461 | 3.2%).
Production, Transportation and Moving Occupations by Sex

| Occupation | Male | Female |
| Production | 591 (76.1%) | 186 (23.9%) |
| Transportation | 458 (99.4%) | 3 (0.6%) |
| Material Moving | 514 (87.7%) | 72 (12.3%) |
| Total (Category) | 1,563 (85.7%) | 261 (14.3%) |
| Total (Overall) | 7,689 (54.0%) | 6,558 (46.0%) |
Employment Industries by Sex in Custer County
Employment Industries in Custer County
The major employment industries in Custer County include Retail Trade (2,065 | 14.5%), Health Care & Social Assistance (1,934 | 13.6%), Educational Services (1,623 | 11.4%), Accommodation & Food Services (1,054 | 7.4%), and Manufacturing (1,052 | 7.4%).

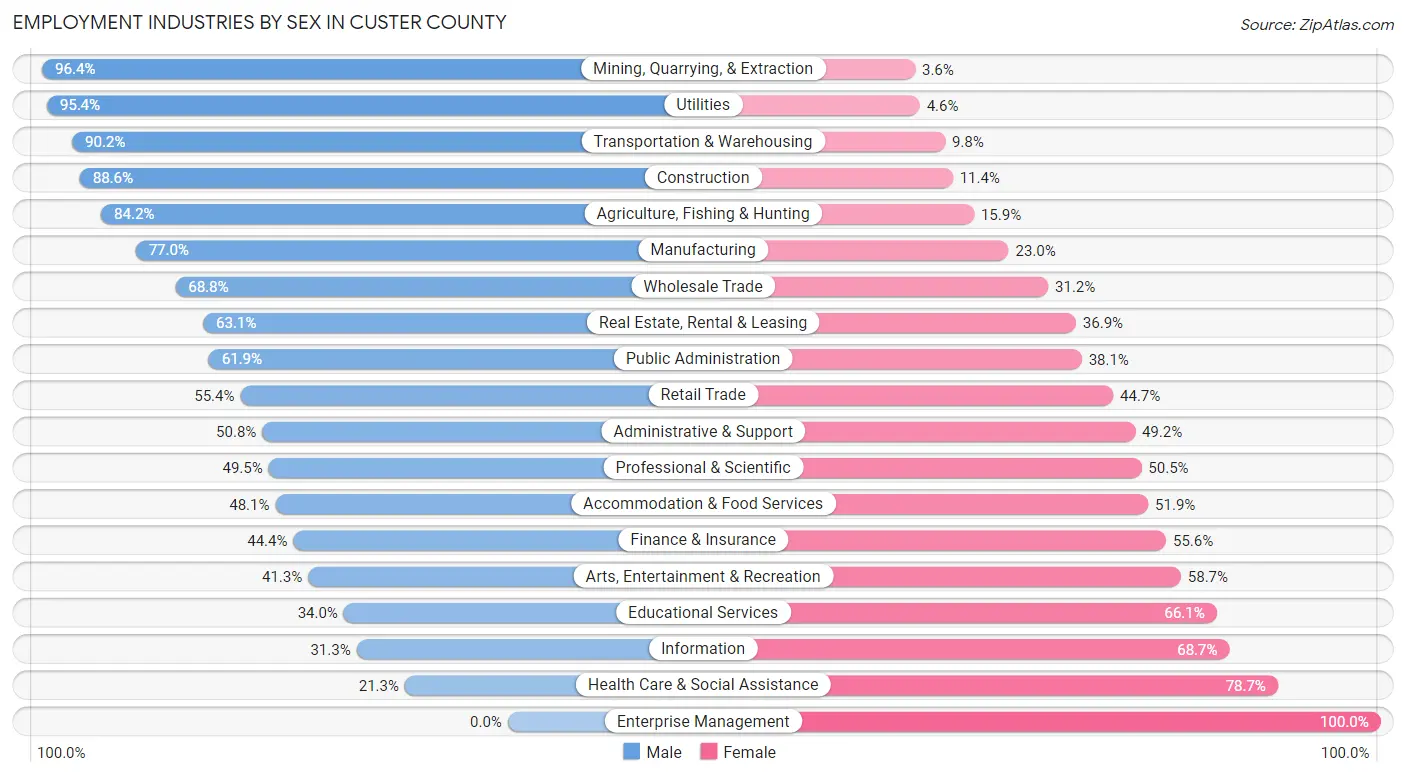
Employment Industries by Sex in Custer County
The Custer County industries that see more men than women are Mining, Quarrying, & Extraction (96.4%), Utilities (95.4%), and Transportation & Warehousing (90.2%), whereas the industries that tend to have a higher number of women are Enterprise Management (100.0%), Health Care & Social Assistance (78.7%), and Information (68.7%).
| Industry | Male | Female |
| Agriculture, Fishing & Hunting | 483 (84.2%) | 91 (15.9%) |
| Mining, Quarrying, & Extraction | 795 (96.4%) | 30 (3.6%) |
| Construction | 635 (88.6%) | 82 (11.4%) |
| Manufacturing | 810 (77.0%) | 242 (23.0%) |
| Wholesale Trade | 150 (68.8%) | 68 (31.2%) |
| Retail Trade | 1,143 (55.3%) | 922 (44.7%) |
| Transportation & Warehousing | 339 (90.2%) | 37 (9.8%) |
| Utilities | 186 (95.4%) | 9 (4.6%) |
| Information | 67 (31.3%) | 147 (68.7%) |
| Finance & Insurance | 285 (44.4%) | 357 (55.6%) |
| Real Estate, Rental & Leasing | 70 (63.1%) | 41 (36.9%) |
| Professional & Scientific | 246 (49.5%) | 251 (50.5%) |
| Enterprise Management | 0 (0.0%) | 43 (100.0%) |
| Administrative & Support | 184 (50.8%) | 178 (49.2%) |
| Educational Services | 551 (34.0%) | 1,072 (66.0%) |
| Health Care & Social Assistance | 412 (21.3%) | 1,522 (78.7%) |
| Arts, Entertainment & Recreation | 174 (41.3%) | 247 (58.7%) |
| Accommodation & Food Services | 507 (48.1%) | 547 (51.9%) |
| Public Administration | 352 (61.9%) | 217 (38.1%) |
| Total | 7,689 (54.0%) | 6,558 (46.0%) |
Education in Custer County
School Enrollment in Custer County
The most common levels of schooling among the 9,016 students in Custer County are college / undergraduate (3,338 | 37.0%), elementary school (1,710 | 19.0%), and middle school (1,462 | 16.2%).
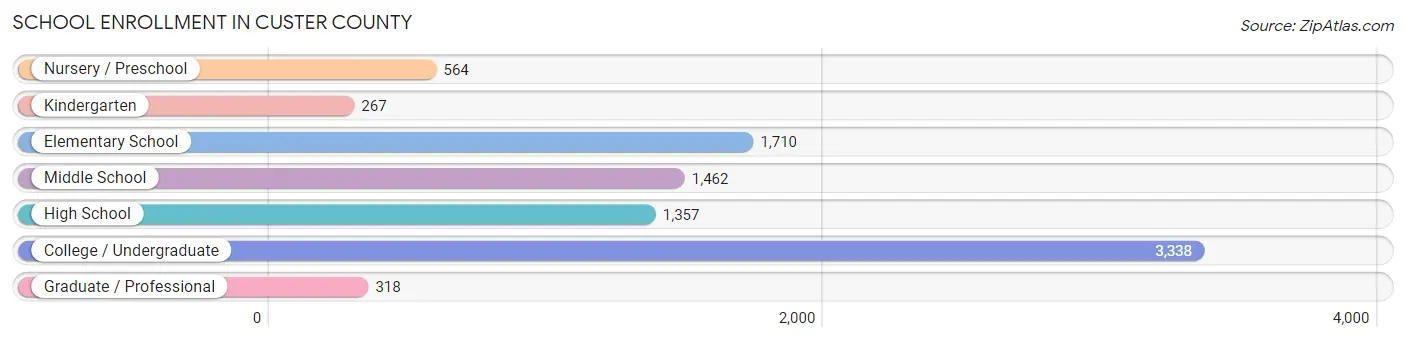
| School Level | # Students | % Students |
| Nursery / Preschool | 564 | 6.3% |
| Kindergarten | 267 | 3.0% |
| Elementary School | 1,710 | 19.0% |
| Middle School | 1,462 | 16.2% |
| High School | 1,357 | 15.0% |
| College / Undergraduate | 3,338 | 37.0% |
| Graduate / Professional | 318 | 3.5% |
| Total | 9,016 | 100.0% |
School Enrollment by Age by Funding Source in Custer County
Out of a total of 9,016 students who are enrolled in schools in Custer County, 406 (4.5%) attend a private institution, while the remaining 8,610 (95.5%) are enrolled in public schools. The age group of 35 years and over has the highest likelihood of being enrolled in private schools, with 24 (12.7% in the age bracket) enrolled. Conversely, the age group of 20 to 24 year olds has the lowest likelihood of being enrolled in a private school, with 2,061 (100.0% in the age bracket) attending a public institution.
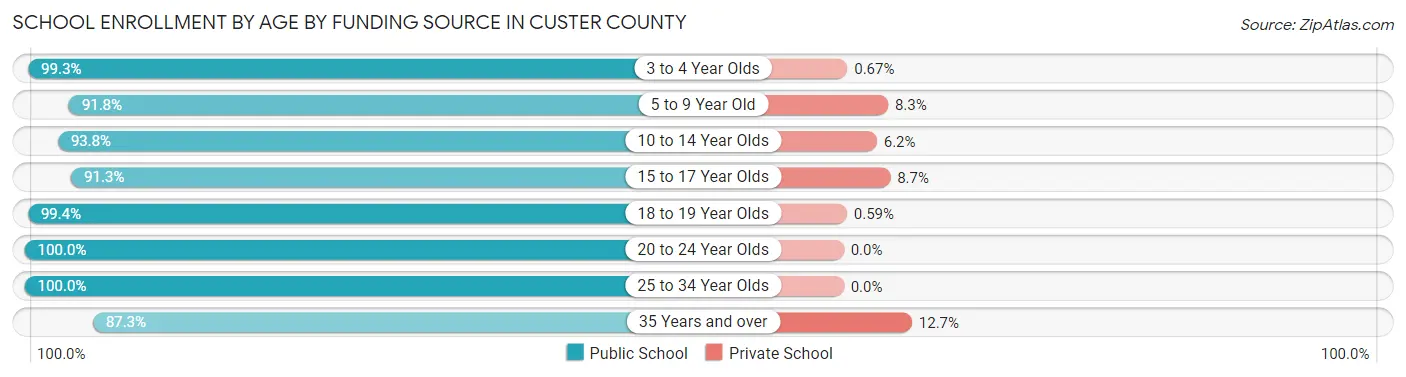
| Age Bracket | Public School | Private School |
| 3 to 4 Year Olds | 296 (99.3%) | 2 (0.7%) |
| 5 to 9 Year Old | 1,723 (91.7%) | 155 (8.3%) |
| 10 to 14 Year Olds | 1,839 (93.8%) | 121 (6.2%) |
| 15 to 17 Year Olds | 1,032 (91.3%) | 98 (8.7%) |
| 18 to 19 Year Olds | 1,184 (99.4%) | 7 (0.6%) |
| 20 to 24 Year Olds | 2,061 (100.0%) | 0 (0.0%) |
| 25 to 34 Year Olds | 309 (100.0%) | 0 (0.0%) |
| 35 Years and over | 165 (87.3%) | 24 (12.7%) |
| Total | 8,610 (95.5%) | 406 (4.5%) |
Educational Attainment by Field of Study in Custer County
Business (1,328 | 24.5%), education (1,203 | 22.2%), science & technology (865 | 16.0%), bio, nature & agricultural (396 | 7.3%), and arts & humanities (341 | 6.3%) are the most common fields of study among 5,409 individuals in Custer County who have obtained a bachelor's degree or higher.
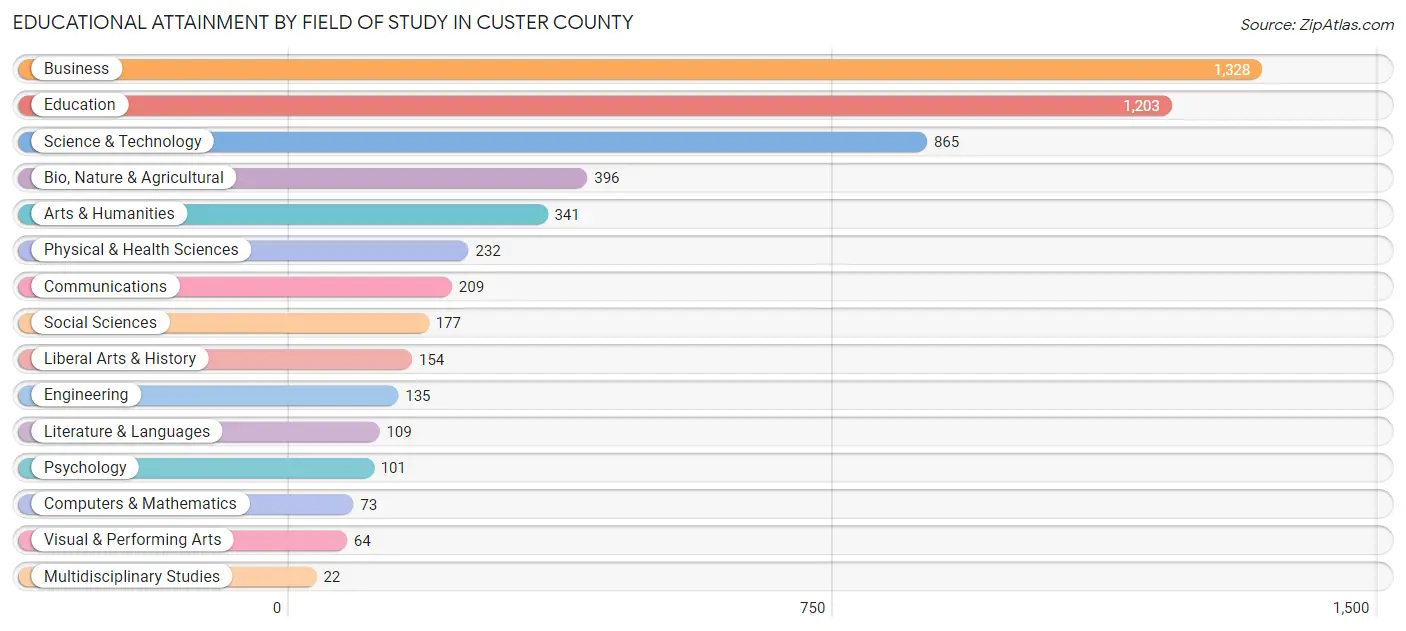
| Field of Study | # Graduates | % Graduates |
| Computers & Mathematics | 73 | 1.3% |
| Bio, Nature & Agricultural | 396 | 7.3% |
| Physical & Health Sciences | 232 | 4.3% |
| Psychology | 101 | 1.9% |
| Social Sciences | 177 | 3.3% |
| Engineering | 135 | 2.5% |
| Multidisciplinary Studies | 22 | 0.4% |
| Science & Technology | 865 | 16.0% |
| Business | 1,328 | 24.5% |
| Education | 1,203 | 22.2% |
| Literature & Languages | 109 | 2.0% |
| Liberal Arts & History | 154 | 2.9% |
| Visual & Performing Arts | 64 | 1.2% |
| Communications | 209 | 3.9% |
| Arts & Humanities | 341 | 6.3% |
| Total | 5,409 | 100.0% |
Transportation & Commute in Custer County
Vehicle Availability by Sex in Custer County
The most prevalent vehicle ownership categories in Custer County are males with 2 vehicles (2,965, accounting for 39.8%) and females with 2 vehicles (2,146, making up 47.9%).

| Vehicles Available | Male | Female |
| No Vehicle | 111 (1.5%) | 140 (2.3%) |
| 1 Vehicle | 1,409 (18.9%) | 1,152 (18.6%) |
| 2 Vehicles | 2,965 (39.8%) | 2,146 (34.7%) |
| 3 Vehicles | 1,985 (26.6%) | 1,582 (25.6%) |
| 4 Vehicles | 864 (11.6%) | 1,049 (16.9%) |
| 5 or more Vehicles | 125 (1.7%) | 122 (2.0%) |
| Total | 7,459 (100.0%) | 6,191 (100.0%) |
Commute Time in Custer County
The most frequently occuring commute durations in Custer County are 5 to 9 minutes (4,092 commuters, 30.0%), 10 to 14 minutes (2,429 commuters, 17.8%), and less than 5 minutes (1,728 commuters, 12.7%).
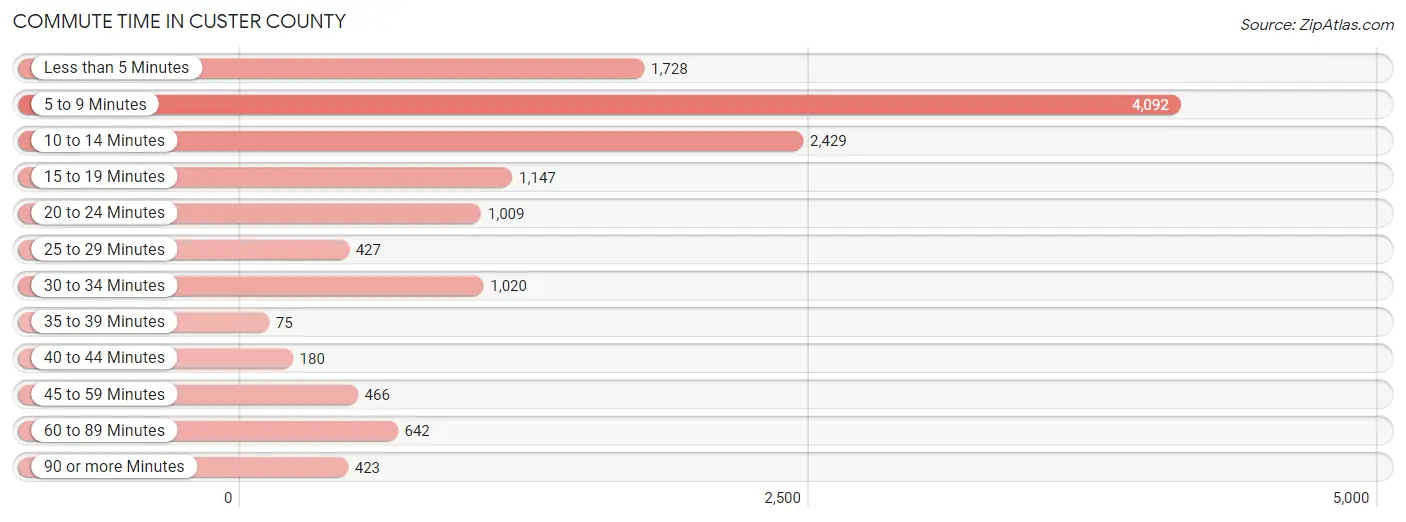
| Commute Time | # Commuters | % Commuters |
| Less than 5 Minutes | 1,728 | 12.7% |
| 5 to 9 Minutes | 4,092 | 30.0% |
| 10 to 14 Minutes | 2,429 | 17.8% |
| 15 to 19 Minutes | 1,147 | 8.4% |
| 20 to 24 Minutes | 1,009 | 7.4% |
| 25 to 29 Minutes | 427 | 3.1% |
| 30 to 34 Minutes | 1,020 | 7.5% |
| 35 to 39 Minutes | 75 | 0.5% |
| 40 to 44 Minutes | 180 | 1.3% |
| 45 to 59 Minutes | 466 | 3.4% |
| 60 to 89 Minutes | 642 | 4.7% |
| 90 or more Minutes | 423 | 3.1% |
Commute Time by Sex in Custer County
The most common commute times in Custer County are 5 to 9 minutes (1,695 commuters, 23.0%) for males and 5 to 9 minutes (2,397 commuters, 38.2%) for females.
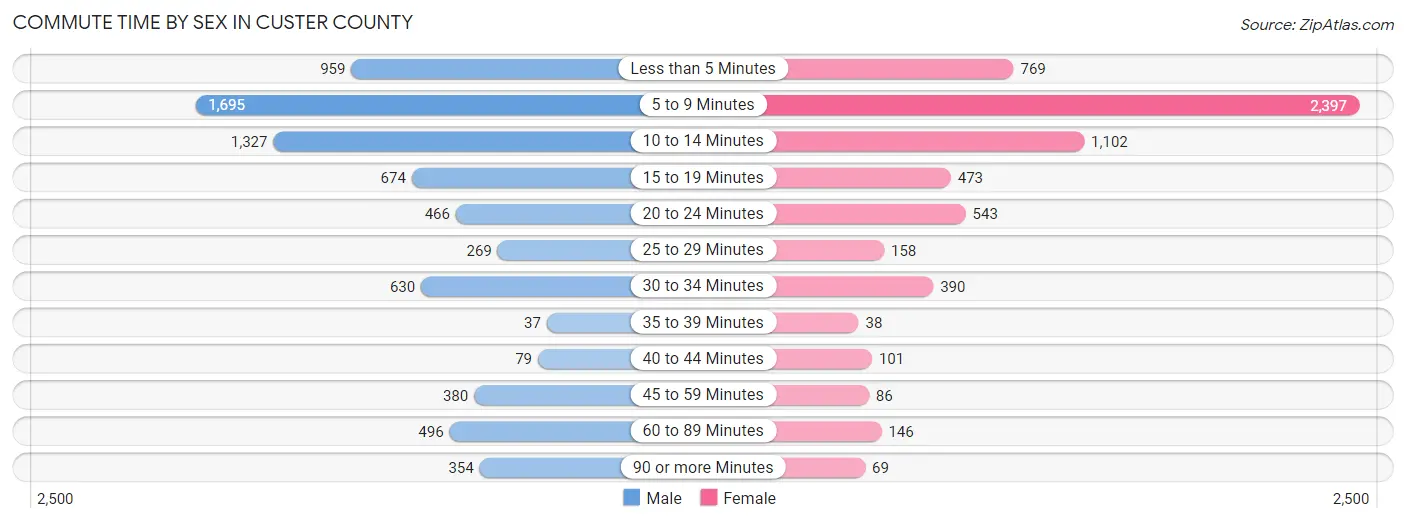
| Commute Time | Male | Female |
| Less than 5 Minutes | 959 (13.0%) | 769 (12.3%) |
| 5 to 9 Minutes | 1,695 (23.0%) | 2,397 (38.2%) |
| 10 to 14 Minutes | 1,327 (18.0%) | 1,102 (17.6%) |
| 15 to 19 Minutes | 674 (9.1%) | 473 (7.5%) |
| 20 to 24 Minutes | 466 (6.3%) | 543 (8.7%) |
| 25 to 29 Minutes | 269 (3.6%) | 158 (2.5%) |
| 30 to 34 Minutes | 630 (8.6%) | 390 (6.2%) |
| 35 to 39 Minutes | 37 (0.5%) | 38 (0.6%) |
| 40 to 44 Minutes | 79 (1.1%) | 101 (1.6%) |
| 45 to 59 Minutes | 380 (5.2%) | 86 (1.4%) |
| 60 to 89 Minutes | 496 (6.7%) | 146 (2.3%) |
| 90 or more Minutes | 354 (4.8%) | 69 (1.1%) |
Time of Departure to Work by Sex in Custer County
The most frequent times of departure to work in Custer County are 7:30 AM to 7:59 AM (1,371, 18.6%) for males and 7:30 AM to 7:59 AM (1,380, 22.0%) for females.
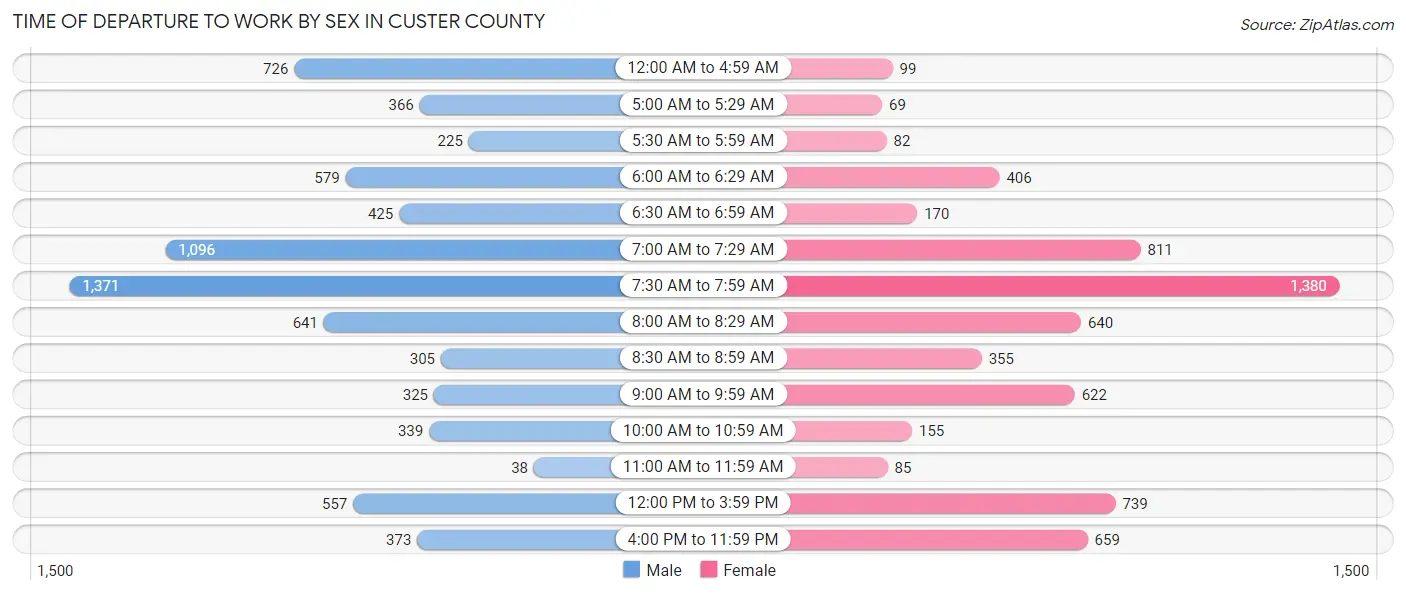
| Time of Departure | Male | Female |
| 12:00 AM to 4:59 AM | 726 (9.9%) | 99 (1.6%) |
| 5:00 AM to 5:29 AM | 366 (5.0%) | 69 (1.1%) |
| 5:30 AM to 5:59 AM | 225 (3.0%) | 82 (1.3%) |
| 6:00 AM to 6:29 AM | 579 (7.9%) | 406 (6.5%) |
| 6:30 AM to 6:59 AM | 425 (5.8%) | 170 (2.7%) |
| 7:00 AM to 7:29 AM | 1,096 (14.9%) | 811 (12.9%) |
| 7:30 AM to 7:59 AM | 1,371 (18.6%) | 1,380 (22.0%) |
| 8:00 AM to 8:29 AM | 641 (8.7%) | 640 (10.2%) |
| 8:30 AM to 8:59 AM | 305 (4.1%) | 355 (5.7%) |
| 9:00 AM to 9:59 AM | 325 (4.4%) | 622 (9.9%) |
| 10:00 AM to 10:59 AM | 339 (4.6%) | 155 (2.5%) |
| 11:00 AM to 11:59 AM | 38 (0.5%) | 85 (1.4%) |
| 12:00 PM to 3:59 PM | 557 (7.6%) | 739 (11.8%) |
| 4:00 PM to 11:59 PM | 373 (5.1%) | 659 (10.5%) |
| Total | 7,366 (100.0%) | 6,272 (100.0%) |
Housing Occupancy in Custer County
Occupancy by Ownership in Custer County
Of the total 10,700 dwellings in Custer County, owner-occupied units account for 6,939 (64.8%), while renter-occupied units make up 3,761 (35.1%).
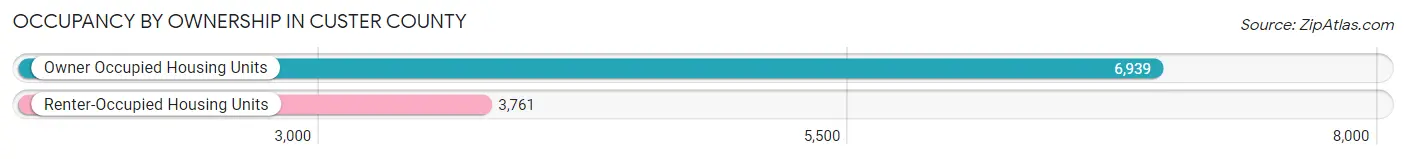
| Occupancy | # Housing Units | % Housing Units |
| Owner Occupied Housing Units | 6,939 | 64.8% |
| Renter-Occupied Housing Units | 3,761 | 35.1% |
| Total Occupied Housing Units | 10,700 | 100.0% |
Occupancy by Household Size in Custer County
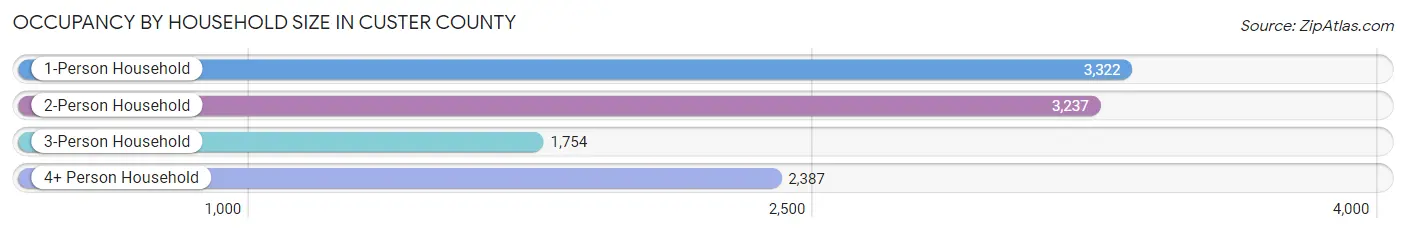
| Household Size | # Housing Units | % Housing Units |
| 1-Person Household | 3,322 | 31.0% |
| 2-Person Household | 3,237 | 30.2% |
| 3-Person Household | 1,754 | 16.4% |
| 4+ Person Household | 2,387 | 22.3% |
| Total Housing Units | 10,700 | 100.0% |
Occupancy by Ownership by Household Size in Custer County

| Household Size | Owner-occupied | Renter-occupied |
| 1-Person Household | 1,677 (50.5%) | 1,645 (49.5%) |
| 2-Person Household | 2,307 (71.3%) | 930 (28.7%) |
| 3-Person Household | 1,130 (64.4%) | 624 (35.6%) |
| 4+ Person Household | 1,825 (76.5%) | 562 (23.5%) |
| Total Housing Units | 6,939 (64.8%) | 3,761 (35.1%) |
Occupancy by Educational Attainment in Custer County
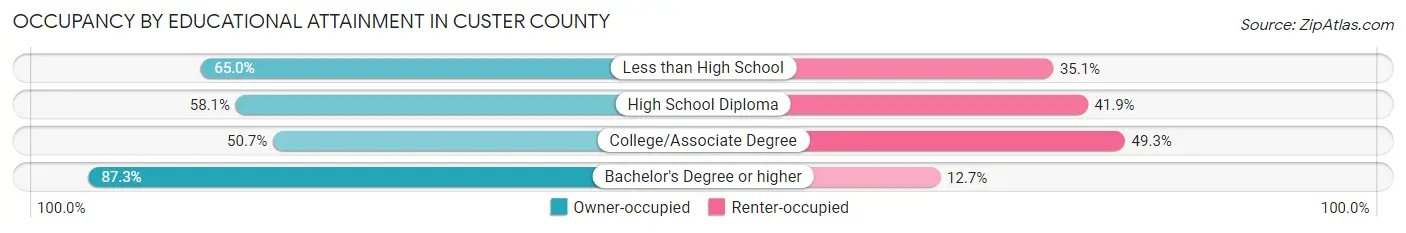
| Household Size | Owner-occupied | Renter-occupied |
| Less than High School | 617 (64.9%) | 333 (35.0%) |
| High School Diploma | 1,601 (58.1%) | 1,154 (41.9%) |
| College/Associate Degree | 1,923 (50.7%) | 1,868 (49.3%) |
| Bachelor's Degree or higher | 2,798 (87.3%) | 406 (12.7%) |
Occupancy by Age of Householder in Custer County
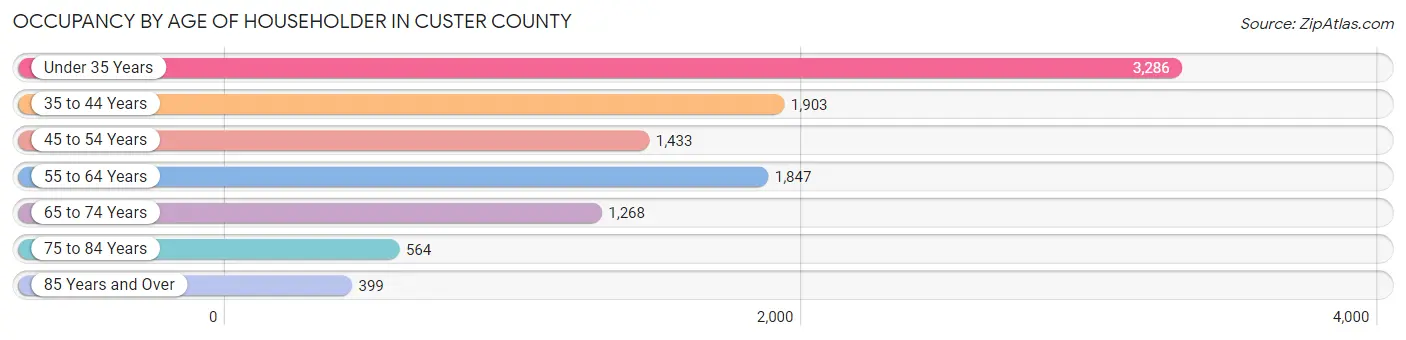
| Age Bracket | # Households | % Households |
| Under 35 Years | 3,286 | 30.7% |
| 35 to 44 Years | 1,903 | 17.8% |
| 45 to 54 Years | 1,433 | 13.4% |
| 55 to 64 Years | 1,847 | 17.3% |
| 65 to 74 Years | 1,268 | 11.8% |
| 75 to 84 Years | 564 | 5.3% |
| 85 Years and Over | 399 | 3.7% |
| Total | 10,700 | 100.0% |
Housing Finances in Custer County
Median Income by Occupancy in Custer County
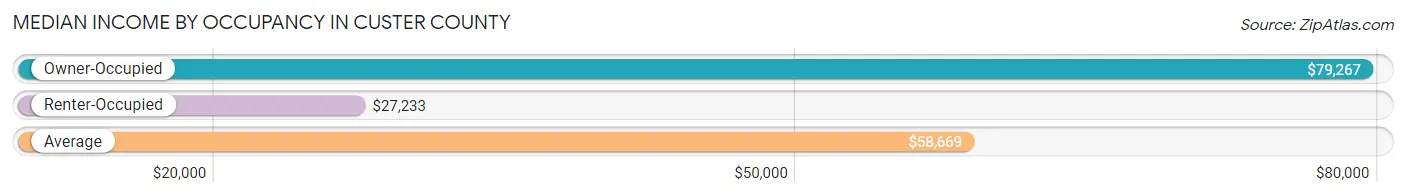
| Occupancy Type | # Households | Median Income |
| Owner-Occupied | 6,939 (64.8%) | $79,267 |
| Renter-Occupied | 3,761 (35.1%) | $27,233 |
| Average | 10,700 (100.0%) | $58,669 |
Occupancy by Householder Income Bracket in Custer County
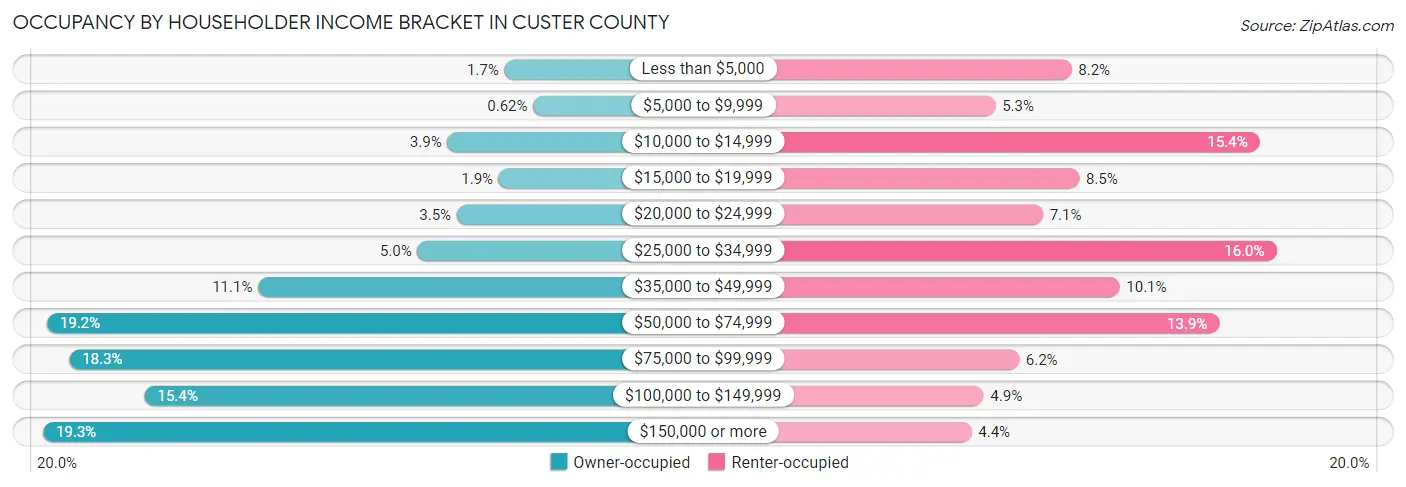
| Income Bracket | Owner-occupied | Renter-occupied |
| Less than $5,000 | 119 (1.7%) | 309 (8.2%) |
| $5,000 to $9,999 | 43 (0.6%) | 200 (5.3%) |
| $10,000 to $14,999 | 270 (3.9%) | 579 (15.4%) |
| $15,000 to $19,999 | 134 (1.9%) | 320 (8.5%) |
| $20,000 to $24,999 | 245 (3.5%) | 268 (7.1%) |
| $25,000 to $34,999 | 349 (5.0%) | 603 (16.0%) |
| $35,000 to $49,999 | 770 (11.1%) | 378 (10.1%) |
| $50,000 to $74,999 | 1,329 (19.2%) | 521 (13.9%) |
| $75,000 to $99,999 | 1,270 (18.3%) | 234 (6.2%) |
| $100,000 to $149,999 | 1,071 (15.4%) | 183 (4.9%) |
| $150,000 or more | 1,339 (19.3%) | 166 (4.4%) |
| Total | 6,939 (100.0%) | 3,761 (100.0%) |
Monthly Housing Cost Tiers in Custer County
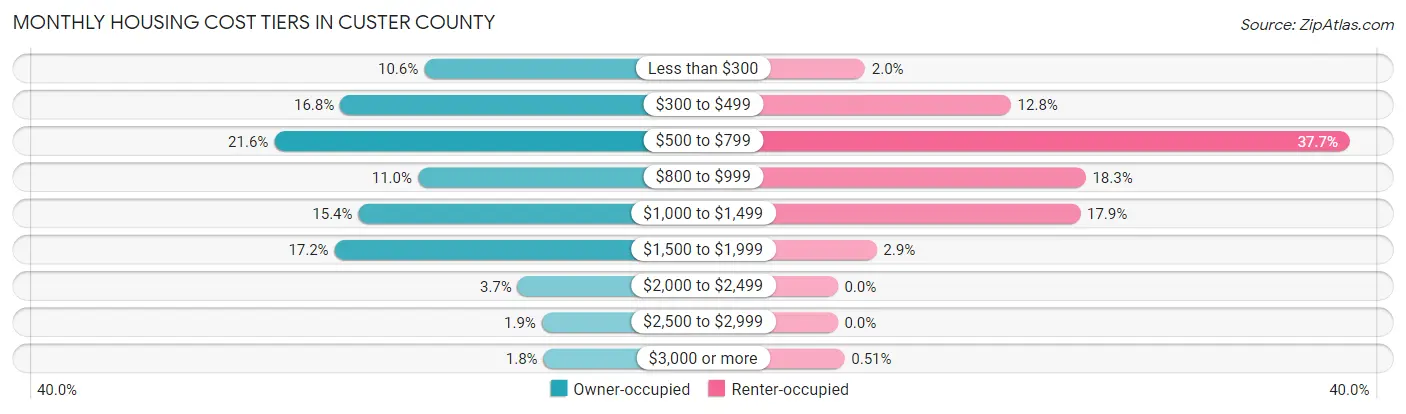
| Monthly Cost | Owner-occupied | Renter-occupied |
| Less than $300 | 734 (10.6%) | 76 (2.0%) |
| $300 to $499 | 1,164 (16.8%) | 480 (12.8%) |
| $500 to $799 | 1,500 (21.6%) | 1,419 (37.7%) |
| $800 to $999 | 766 (11.0%) | 687 (18.3%) |
| $1,000 to $1,499 | 1,070 (15.4%) | 672 (17.9%) |
| $1,500 to $1,999 | 1,192 (17.2%) | 108 (2.9%) |
| $2,000 to $2,499 | 256 (3.7%) | 0 (0.0%) |
| $2,500 to $2,999 | 133 (1.9%) | 0 (0.0%) |
| $3,000 or more | 124 (1.8%) | 19 (0.5%) |
| Total | 6,939 (100.0%) | 3,761 (100.0%) |
Physical Housing Characteristics in Custer County
Housing Structures in Custer County
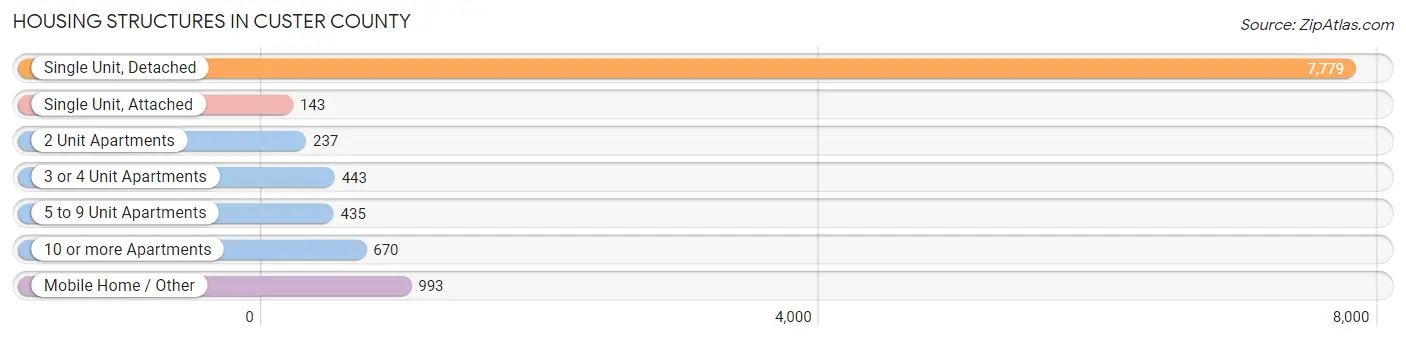
| Structure Type | # Housing Units | % Housing Units |
| Single Unit, Detached | 7,779 | 72.7% |
| Single Unit, Attached | 143 | 1.3% |
| 2 Unit Apartments | 237 | 2.2% |
| 3 or 4 Unit Apartments | 443 | 4.1% |
| 5 to 9 Unit Apartments | 435 | 4.1% |
| 10 or more Apartments | 670 | 6.3% |
| Mobile Home / Other | 993 | 9.3% |
| Total | 10,700 | 100.0% |
Housing Structures by Occupancy in Custer County
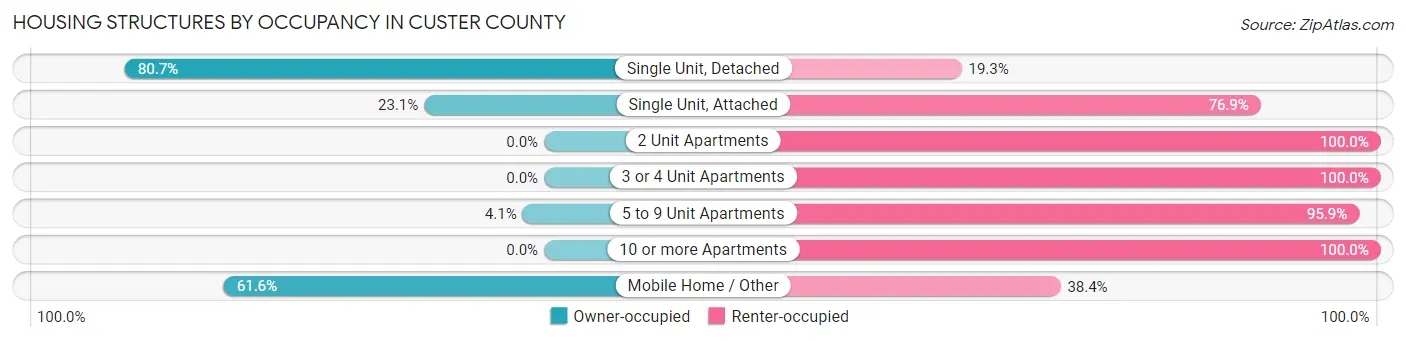
| Structure Type | Owner-occupied | Renter-occupied |
| Single Unit, Detached | 6,276 (80.7%) | 1,503 (19.3%) |
| Single Unit, Attached | 33 (23.1%) | 110 (76.9%) |
| 2 Unit Apartments | 0 (0.0%) | 237 (100.0%) |
| 3 or 4 Unit Apartments | 0 (0.0%) | 443 (100.0%) |
| 5 to 9 Unit Apartments | 18 (4.1%) | 417 (95.9%) |
| 10 or more Apartments | 0 (0.0%) | 670 (100.0%) |
| Mobile Home / Other | 612 (61.6%) | 381 (38.4%) |
| Total | 6,939 (64.8%) | 3,761 (35.1%) |
Housing Structures by Number of Rooms in Custer County
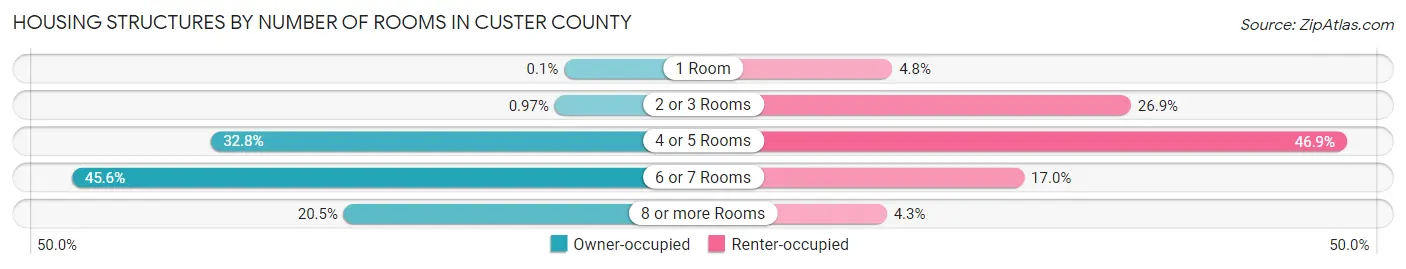
| Number of Rooms | Owner-occupied | Renter-occupied |
| 1 Room | 7 (0.1%) | 182 (4.8%) |
| 2 or 3 Rooms | 67 (1.0%) | 1,012 (26.9%) |
| 4 or 5 Rooms | 2,278 (32.8%) | 1,763 (46.9%) |
| 6 or 7 Rooms | 3,166 (45.6%) | 641 (17.0%) |
| 8 or more Rooms | 1,421 (20.5%) | 163 (4.3%) |
| Total | 6,939 (100.0%) | 3,761 (100.0%) |
Housing Structure by Heating Type in Custer County

| Heating Type | Owner-occupied | Renter-occupied |
| Utility Gas | 3,726 (53.7%) | 1,182 (31.4%) |
| Bottled, Tank, or LP Gas | 403 (5.8%) | 78 (2.1%) |
| Electricity | 2,732 (39.4%) | 2,432 (64.7%) |
| Fuel Oil or Kerosene | 0 (0.0%) | 0 (0.0%) |
| Coal or Coke | 0 (0.0%) | 0 (0.0%) |
| All other Fuels | 71 (1.0%) | 69 (1.8%) |
| No Fuel Used | 7 (0.1%) | 0 (0.0%) |
| Total | 6,939 (100.0%) | 3,761 (100.0%) |
Household Vehicle Usage in Custer County
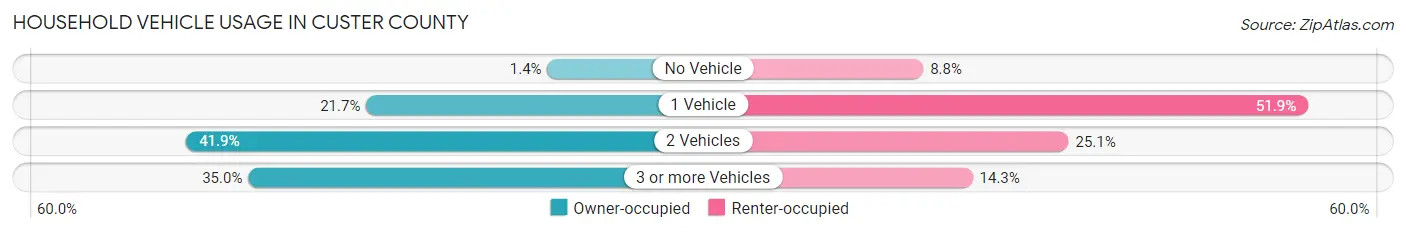
| Vehicles per Household | Owner-occupied | Renter-occupied |
| No Vehicle | 99 (1.4%) | 330 (8.8%) |
| 1 Vehicle | 1,508 (21.7%) | 1,951 (51.9%) |
| 2 Vehicles | 2,907 (41.9%) | 942 (25.1%) |
| 3 or more Vehicles | 2,425 (34.9%) | 538 (14.3%) |
| Total | 6,939 (100.0%) | 3,761 (100.0%) |
Real Estate & Mortgages in Custer County
Real Estate and Mortgage Overview in Custer County
| Characteristic | Without Mortgage | With Mortgage |
| Housing Units | 3,442 | 3,497 |
| Median Property Value | $145,800 | $184,800 |
| Median Household Income | $62,031 | $840 |
| Monthly Housing Costs | $463 | $124 |
| Real Estate Taxes | $913 | $61 |
Property Value by Mortgage Status in Custer County

| Property Value | Without Mortgage | With Mortgage |
| Less than $50,000 | 592 (17.2%) | 99 (2.8%) |
| $50,000 to $99,999 | 764 (22.2%) | 517 (14.8%) |
| $100,000 to $299,999 | 1,533 (44.5%) | 2,340 (66.9%) |
| $300,000 to $499,999 | 391 (11.4%) | 416 (11.9%) |
| $500,000 to $749,999 | 121 (3.5%) | 111 (3.2%) |
| $750,000 to $999,999 | 41 (1.2%) | 14 (0.4%) |
| $1,000,000 or more | 0 (0.0%) | 0 (0.0%) |
| Total | 3,442 (100.0%) | 3,497 (100.0%) |
Household Income by Mortgage Status in Custer County
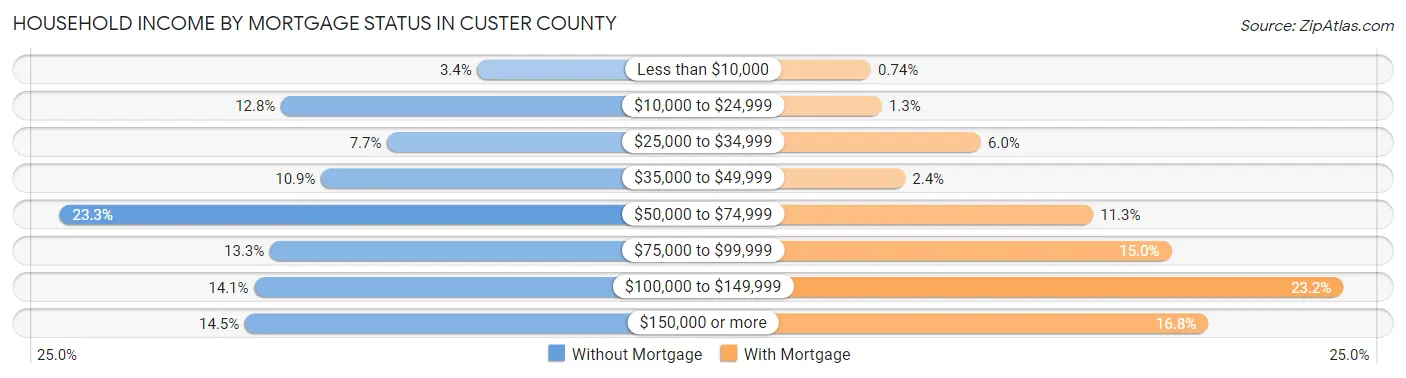
| Household Income | Without Mortgage | With Mortgage |
| Less than $10,000 | 118 (3.4%) | 26 (0.7%) |
| $10,000 to $24,999 | 440 (12.8%) | 44 (1.3%) |
| $25,000 to $34,999 | 266 (7.7%) | 209 (6.0%) |
| $35,000 to $49,999 | 374 (10.9%) | 83 (2.4%) |
| $50,000 to $74,999 | 803 (23.3%) | 396 (11.3%) |
| $75,000 to $99,999 | 458 (13.3%) | 526 (15.0%) |
| $100,000 to $149,999 | 484 (14.1%) | 812 (23.2%) |
| $150,000 or more | 499 (14.5%) | 587 (16.8%) |
| Total | 3,442 (100.0%) | 3,497 (100.0%) |
Property Value to Household Income Ratio in Custer County
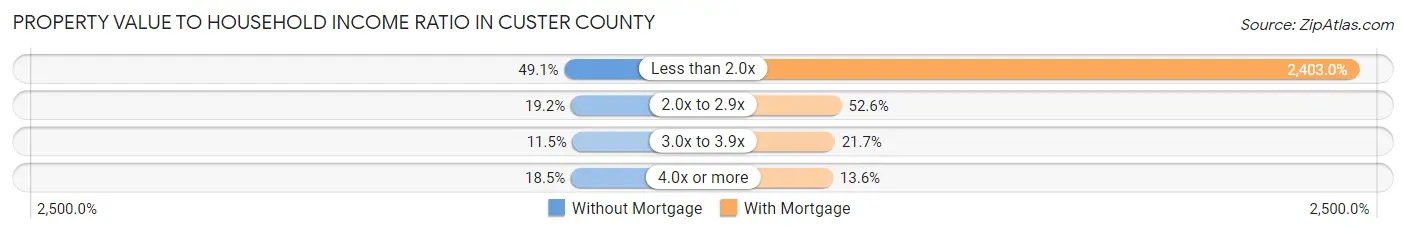
| Value-to-Income Ratio | Without Mortgage | With Mortgage |
| Less than 2.0x | 1,691 (49.1%) | 84,033 (2,403.0%) |
| 2.0x to 2.9x | 660 (19.2%) | 1,839 (52.6%) |
| 3.0x to 3.9x | 394 (11.5%) | 759 (21.7%) |
| 4.0x or more | 636 (18.5%) | 476 (13.6%) |
| Total | 3,442 (100.0%) | 3,497 (100.0%) |
Real Estate Taxes by Mortgage Status in Custer County
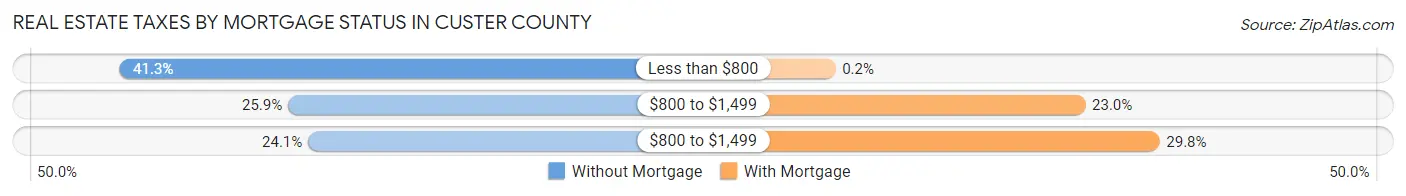
| Property Taxes | Without Mortgage | With Mortgage |
| Less than $800 | 1,421 (41.3%) | 7 (0.2%) |
| $800 to $1,499 | 893 (25.9%) | 805 (23.0%) |
| $800 to $1,499 | 830 (24.1%) | 1,042 (29.8%) |
| Total | 3,442 (100.0%) | 3,497 (100.0%) |
Health & Disability in Custer County
Health Insurance Coverage by Age in Custer County
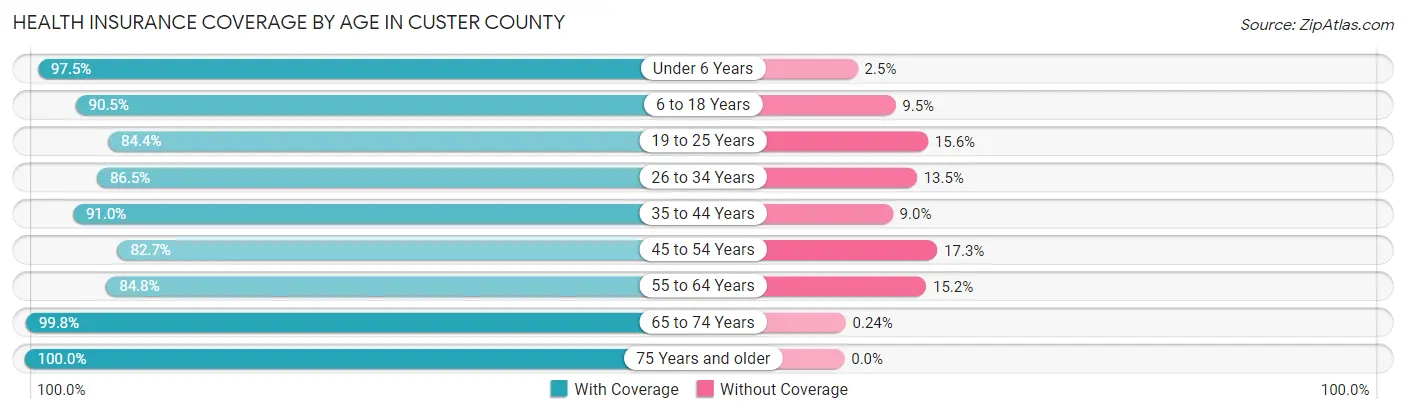
| Age Bracket | With Coverage | Without Coverage |
| Under 6 Years | 2,229 (97.5%) | 57 (2.5%) |
| 6 to 18 Years | 4,761 (90.5%) | 501 (9.5%) |
| 19 to 25 Years | 3,854 (84.4%) | 712 (15.6%) |
| 26 to 34 Years | 2,429 (86.5%) | 379 (13.5%) |
| 35 to 44 Years | 3,320 (91.0%) | 329 (9.0%) |
| 45 to 54 Years | 2,076 (82.7%) | 435 (17.3%) |
| 55 to 64 Years | 2,715 (84.8%) | 488 (15.2%) |
| 65 to 74 Years | 2,079 (99.8%) | 5 (0.2%) |
| 75 Years and older | 1,484 (100.0%) | 0 (0.0%) |
| Total | 24,947 (89.6%) | 2,906 (10.4%) |
Health Insurance Coverage by Citizenship Status in Custer County
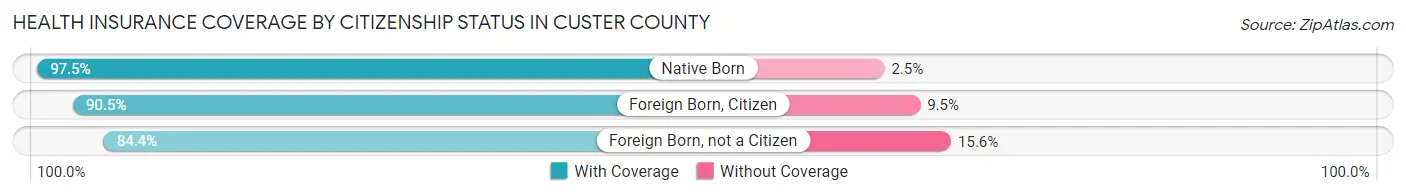
| Citizenship Status | With Coverage | Without Coverage |
| Native Born | 2,229 (97.5%) | 57 (2.5%) |
| Foreign Born, Citizen | 4,761 (90.5%) | 501 (9.5%) |
| Foreign Born, not a Citizen | 3,854 (84.4%) | 712 (15.6%) |
Health Insurance Coverage by Household Income in Custer County
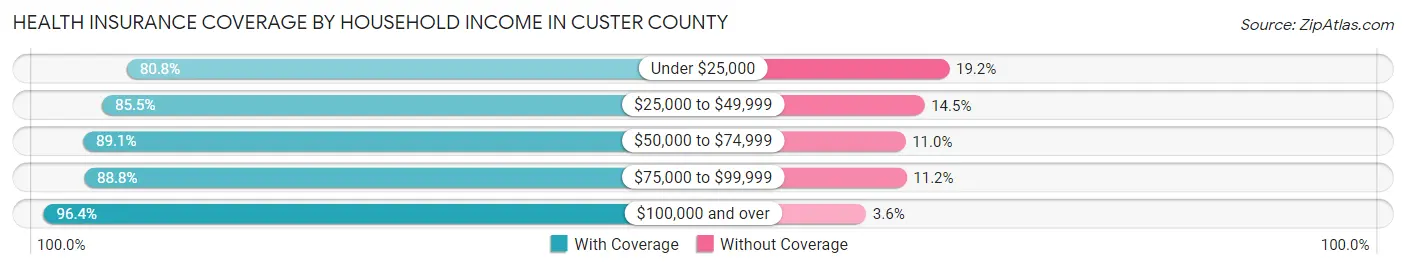
| Household Income | With Coverage | Without Coverage |
| Under $25,000 | 3,292 (80.8%) | 780 (19.2%) |
| $25,000 to $49,999 | 4,300 (85.5%) | 730 (14.5%) |
| $50,000 to $74,999 | 4,512 (89.0%) | 555 (11.0%) |
| $75,000 to $99,999 | 3,567 (88.8%) | 448 (11.2%) |
| $100,000 and over | 8,262 (96.4%) | 307 (3.6%) |
Public vs Private Health Insurance Coverage by Age in Custer County
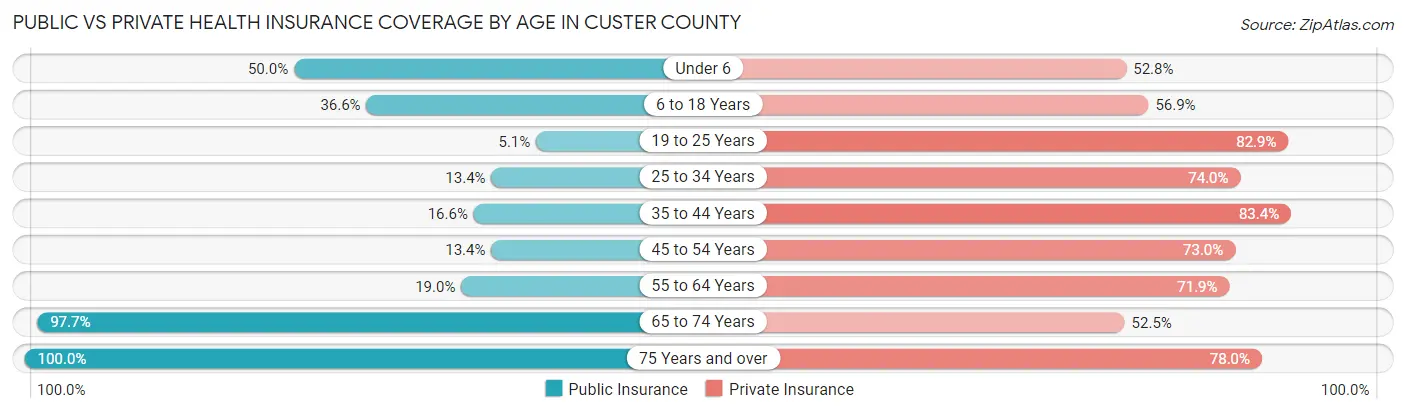
| Age Bracket | Public Insurance | Private Insurance |
| Under 6 | 1,143 (50.0%) | 1,207 (52.8%) |
| 6 to 18 Years | 1,923 (36.5%) | 2,995 (56.9%) |
| 19 to 25 Years | 231 (5.1%) | 3,784 (82.9%) |
| 25 to 34 Years | 375 (13.4%) | 2,077 (74.0%) |
| 35 to 44 Years | 607 (16.6%) | 3,042 (83.4%) |
| 45 to 54 Years | 336 (13.4%) | 1,833 (73.0%) |
| 55 to 64 Years | 607 (19.0%) | 2,304 (71.9%) |
| 65 to 74 Years | 2,035 (97.7%) | 1,094 (52.5%) |
| 75 Years and over | 1,484 (100.0%) | 1,157 (78.0%) |
| Total | 8,741 (31.4%) | 19,493 (70.0%) |
Disability Status by Sex by Age in Custer County
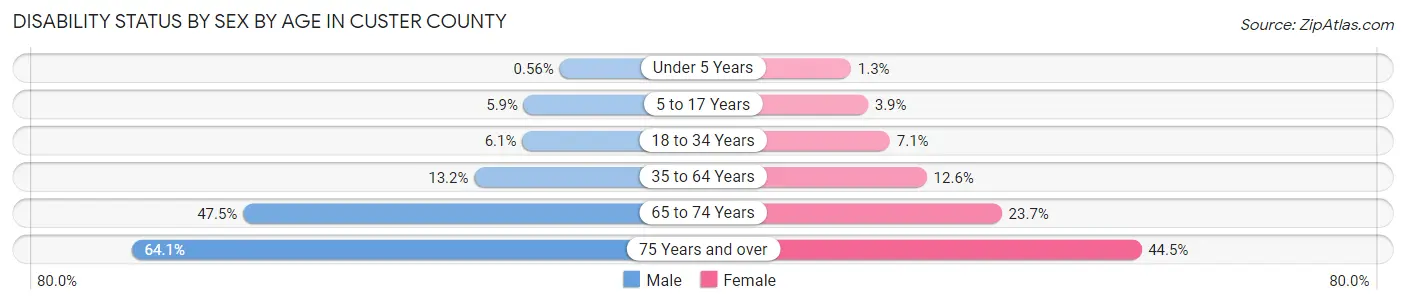
| Age Bracket | Male | Female |
| Under 5 Years | 5 (0.6%) | 13 (1.3%) |
| 5 to 17 Years | 147 (5.9%) | 103 (3.9%) |
| 18 to 34 Years | 239 (6.1%) | 283 (7.1%) |
| 35 to 64 Years | 619 (13.2%) | 590 (12.6%) |
| 65 to 74 Years | 464 (47.5%) | 263 (23.7%) |
| 75 Years and over | 350 (64.1%) | 417 (44.5%) |
Disability Class by Sex by Age in Custer County
Disability Class: Hearing Difficulty

| Age Bracket | Male | Female |
| Under 5 Years | 0 (0.0%) | 13 (1.3%) |
| 5 to 17 Years | 2 (0.1%) | 22 (0.8%) |
| 18 to 34 Years | 41 (1.1%) | 3 (0.1%) |
| 35 to 64 Years | 186 (4.0%) | 44 (0.9%) |
| 65 to 74 Years | 316 (32.4%) | 35 (3.2%) |
| 75 Years and over | 293 (53.7%) | 136 (14.5%) |
Disability Class: Vision Difficulty
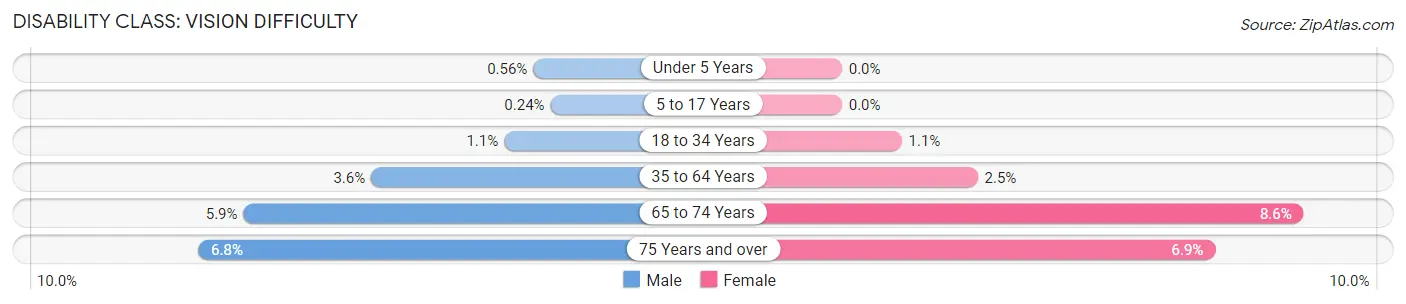
| Age Bracket | Male | Female |
| Under 5 Years | 5 (0.6%) | 0 (0.0%) |
| 5 to 17 Years | 6 (0.2%) | 0 (0.0%) |
| 18 to 34 Years | 43 (1.1%) | 44 (1.1%) |
| 35 to 64 Years | 167 (3.6%) | 118 (2.5%) |
| 65 to 74 Years | 58 (5.9%) | 95 (8.6%) |
| 75 Years and over | 37 (6.8%) | 65 (6.9%) |
Disability Class: Cognitive Difficulty
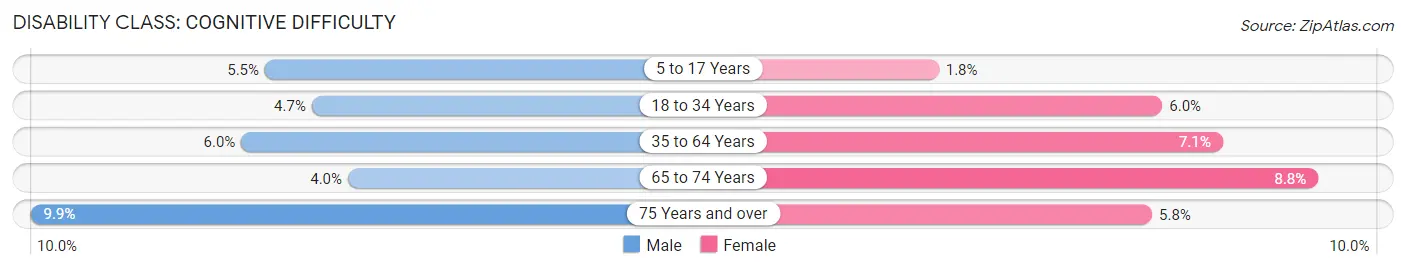
| Age Bracket | Male | Female |
| 5 to 17 Years | 139 (5.5%) | 48 (1.8%) |
| 18 to 34 Years | 183 (4.7%) | 236 (5.9%) |
| 35 to 64 Years | 280 (6.0%) | 331 (7.1%) |
| 65 to 74 Years | 39 (4.0%) | 98 (8.8%) |
| 75 Years and over | 54 (9.9%) | 54 (5.8%) |
Disability Class: Ambulatory Difficulty
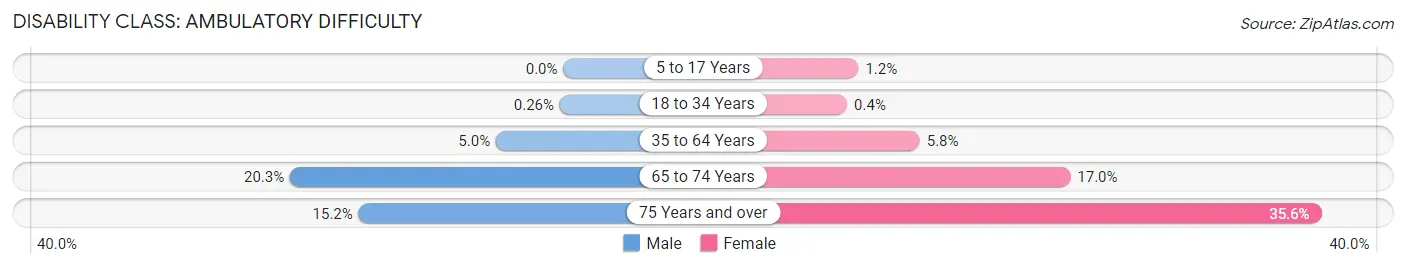
| Age Bracket | Male | Female |
| 5 to 17 Years | 0 (0.0%) | 33 (1.2%) |
| 18 to 34 Years | 10 (0.3%) | 16 (0.4%) |
| 35 to 64 Years | 234 (5.0%) | 271 (5.8%) |
| 65 to 74 Years | 198 (20.3%) | 188 (17.0%) |
| 75 Years and over | 83 (15.2%) | 334 (35.6%) |
Disability Class: Self-Care Difficulty
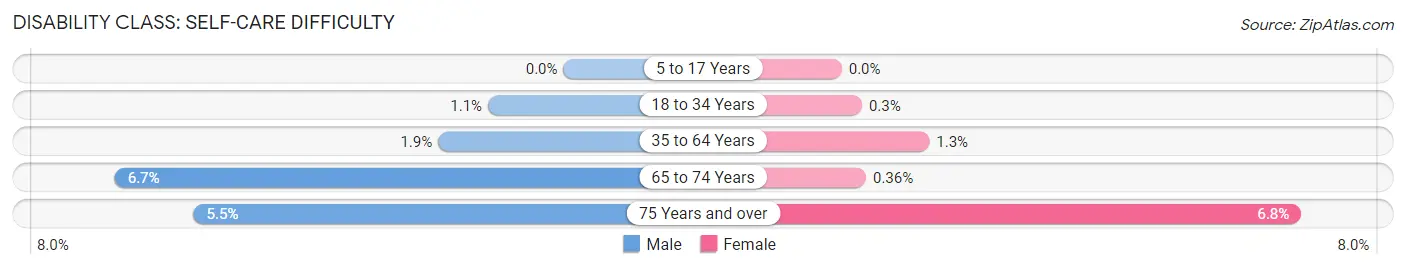
| Age Bracket | Male | Female |
| 5 to 17 Years | 0 (0.0%) | 0 (0.0%) |
| 18 to 34 Years | 44 (1.1%) | 12 (0.3%) |
| 35 to 64 Years | 87 (1.9%) | 61 (1.3%) |
| 65 to 74 Years | 65 (6.7%) | 4 (0.4%) |
| 75 Years and over | 30 (5.5%) | 64 (6.8%) |
Technology Access in Custer County
Computing Device Access in Custer County

| Device Type | # Households | % Households |
| Desktop or Laptop | 7,830 | 73.2% |
| Smartphone | 9,861 | 92.2% |
| Tablet | 6,692 | 62.5% |
| No Computing Device | 525 | 4.9% |
| Total | 10,700 | 100.0% |
Internet Access in Custer County
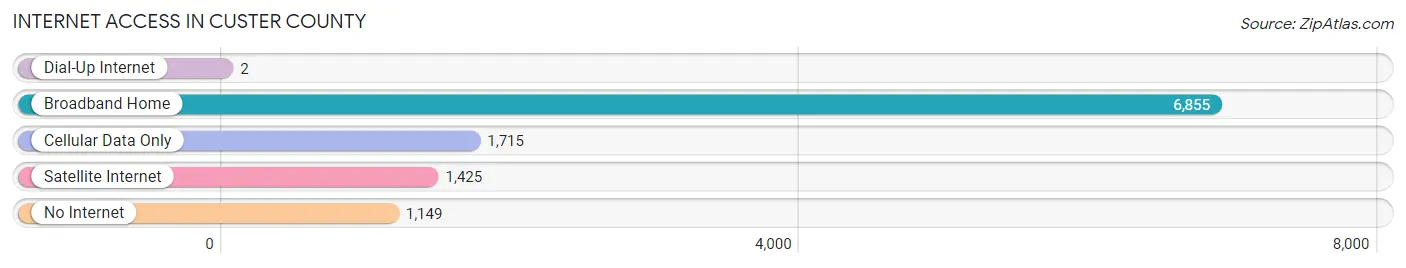
| Internet Type | # Households | % Households |
| Dial-Up Internet | 2 | 0.0% |
| Broadband Home | 6,855 | 64.1% |
| Cellular Data Only | 1,715 | 16.0% |
| Satellite Internet | 1,425 | 13.3% |
| No Internet | 1,149 | 10.7% |
| Total | 10,700 | 100.0% |
Custer County Summary
Custer County is located in the western part of the state of Oklahoma. It is bordered by Washita County to the north, Blaine County to the east, Canadian County to the south, and Beckham County to the west. The county seat is Arapaho, and the largest city is Weatherford. The county was named for General George Armstrong Custer, who was killed at the Battle of Little Bighorn in 1876.
Geography
Custer County covers an area of 1,072 square miles, making it the fourth-largest county in Oklahoma. The terrain is mostly flat, with some rolling hills in the western part of the county. The county is drained by the Washita River, which flows through the county from north to south. The county is part of the Gypsum Hills, an area of red-colored hills and valleys that is part of the larger Red Bed Plains region.
The climate of Custer County is semi-arid, with hot summers and cold winters. The average annual temperature is 61°F, and the average annual precipitation is 28 inches.
Demographics
As of the 2010 census, the population of Custer County was 27,469, making it the twenty-fourth most populous county in Oklahoma. The population density was 25.5 people per square mile. The racial makeup of the county was 91.2% White, 2.2% Native American, 0.7% Black or African American, 0.4% Asian, 0.1% Pacific Islander, 3.2% from other races, and 2.2% from two or more races. Hispanic or Latino of any race were 6.3% of the population.
The median income for a household in the county was $41,945, and the median income for a family was $50,945. The per capita income for the county was $20,945. About 11.2% of families and 14.7% of the population were below the poverty line, including 19.2% of those under age 18 and 9.2% of those age 65 or over.
Economy
The economy of Custer County is largely based on agriculture and oil and gas production. The county is home to several large cattle ranches, and the county is also a major producer of wheat, sorghum, and hay. Oil and gas production is also an important part of the economy, and the county is home to several large oil and gas fields.
The county is also home to several manufacturing companies, including a large poultry processing plant and a large furniture manufacturing plant. The county is also home to several retail stores, including a Walmart Supercenter and several other large retail stores.
The county is served by two airports, the Weatherford Municipal Airport and the Arapaho Municipal Airport. The county is also served by several major highways, including Interstate 40, US Highway 183, and US Highway 281.
Conclusion
Custer County is a large county in western Oklahoma with a population of over 27,000. The county is largely rural, with a strong agricultural and oil and gas economy. The county is home to several large ranches, and is a major producer of wheat, sorghum, and hay. The county is also home to several manufacturing companies, retail stores, and two airports.
Common Questions
What is the Total Population of Custer County?
Total Population of Custer County is 28,391.
What is the Total Male Population of Custer County?
Total Male Population of Custer County is 13,842.
What is the Total Female Population of Custer County?
Total Female Population of Custer County is 14,549.
What is the Ratio of Males per 100 Females in Custer County?
There are 95.14 Males per 100 Females in Custer County.
What is the Ratio of Females per 100 Males in Custer County?
There are 105.11 Females per 100 Males in Custer County.
What is the Median Population Age in Custer County?
Median Population Age in Custer County is 32.4 Years.
What is the Average Family Size in Custer County
Average Family Size in Custer County is 3.2 People.
What is the Average Household Size in Custer County
Average Household Size in Custer County is 2.5 People.
What is Per Capita Income in Custer County?
Per Capita income in Custer County is $30,880.
What is the Median Family Income in Custer County?
Median Family Income in Custer County is $78,768.
What is the Median Household income in Custer County?
Median Household Income in Custer County is $58,669.
What is Income or Wage Gap in Custer County?
Income or Wage Gap in Custer County is 40.1%.
Women in Custer County earn 59.9 cents for every dollar earned by a man.
What is Family Income Deficit in Custer County?
Family Income Deficit in Custer County is $10,075.
Families that are below poverty line in Custer County earn $10,075 less on average than the poverty threshold level.
What is Inequality or Gini Index in Custer County?
Inequality or Gini Index in Custer County is 0.48.
How Large is the Labor Force in Custer County?
There are 14,687 People in the Labor Forcein in Custer County.
What is the Percentage of People in the Labor Force in Custer County?
66.6% of People are in the Labor Force in Custer County.
What is the Unemployment Rate in Custer County?
Unemployment Rate in Custer County is 2.9%.