Creek County, OK
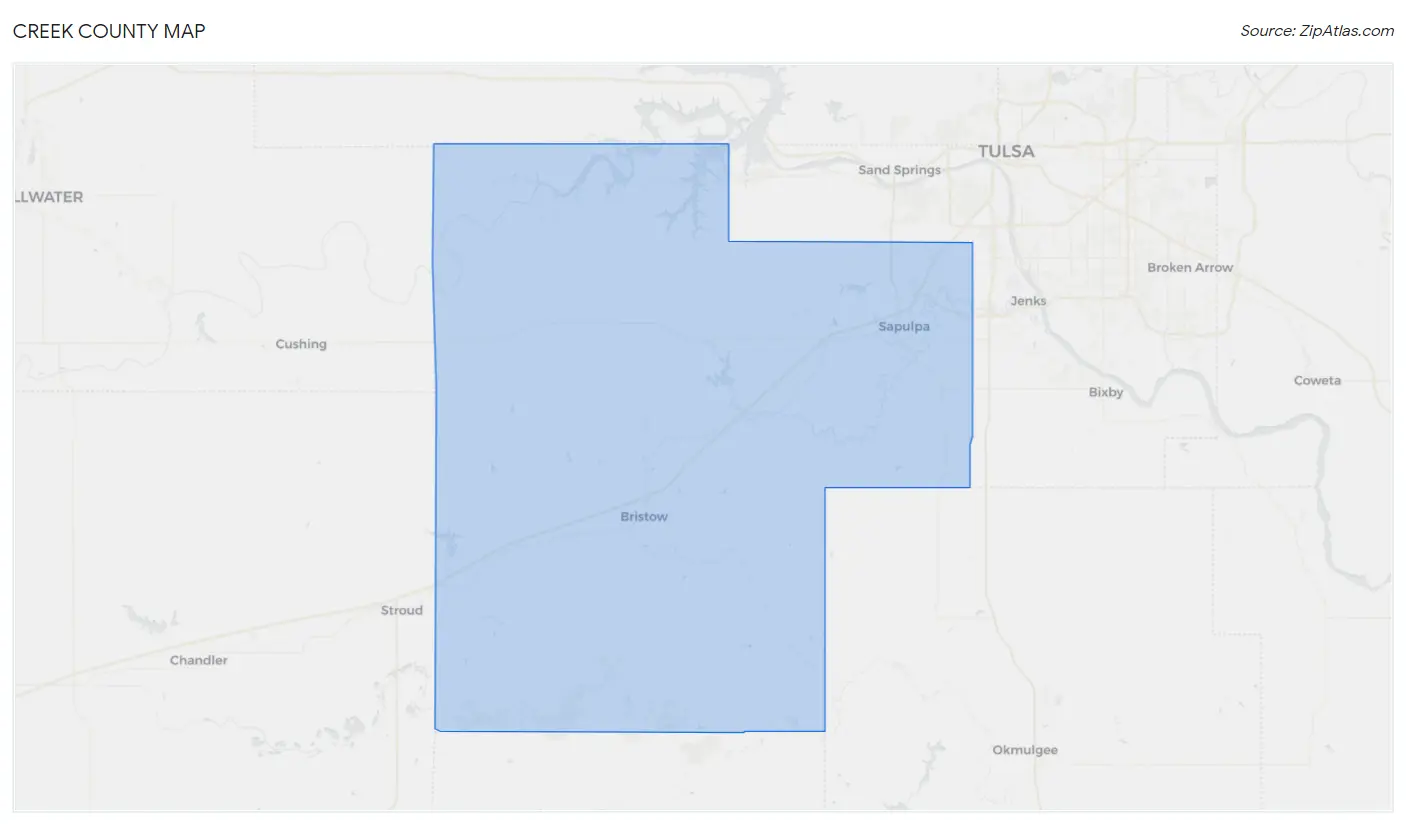
Creek County Map
Creek County Overview
72,076
TOTAL POPULATION
35,821
MALE POPULATION
36,255
FEMALE POPULATION
98.80
MALES / 100 FEMALES
101.21
FEMALES / 100 MALES
40.4
MEDIAN AGE
3.1
AVG FAMILY SIZE
2.6
AVG HOUSEHOLD SIZE
$31,222
PER CAPITA INCOME
$77,035
AVG FAMILY INCOME
$61,657
AVG HOUSEHOLD INCOME
35.0%
WAGE / INCOME GAP [ % ]
65.0¢/ $1
WAGE / INCOME GAP [ $ ]
$11,298
FAMILY INCOME DEFICIT
0.44
INEQUALITY / GINI INDEX
32,444
LABOR FORCE [ PEOPLE ]
56.7%
PERCENT IN LABOR FORCE
3.7%
UNEMPLOYMENT RATE
Creek County Area Codes
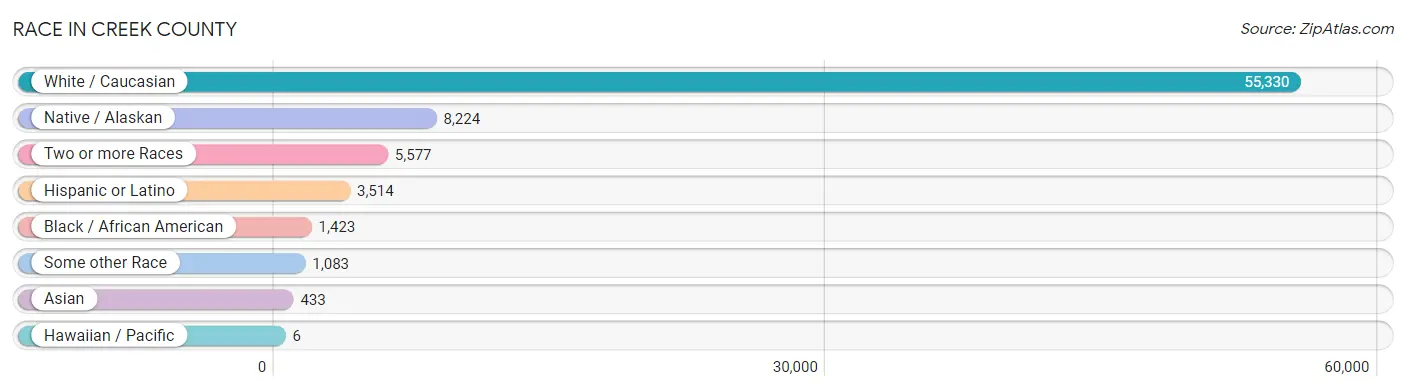
Race in Creek County
The most populous races in Creek County are White / Caucasian (55,330 | 76.8%), Native / Alaskan (8,224 | 11.4%), and Two or more Races (5,577 | 7.7%).
| Race | # Population | % Population |
| Asian | 433 | 0.6% |
| Black / African American | 1,423 | 2.0% |
| Hawaiian / Pacific | 6 | 0.0% |
| Hispanic or Latino | 3,514 | 4.9% |
| Native / Alaskan | 8,224 | 11.4% |
| White / Caucasian | 55,330 | 76.8% |
| Two or more Races | 5,577 | 7.7% |
| Some other Race | 1,083 | 1.5% |
| Total | 72,076 | 100.0% |
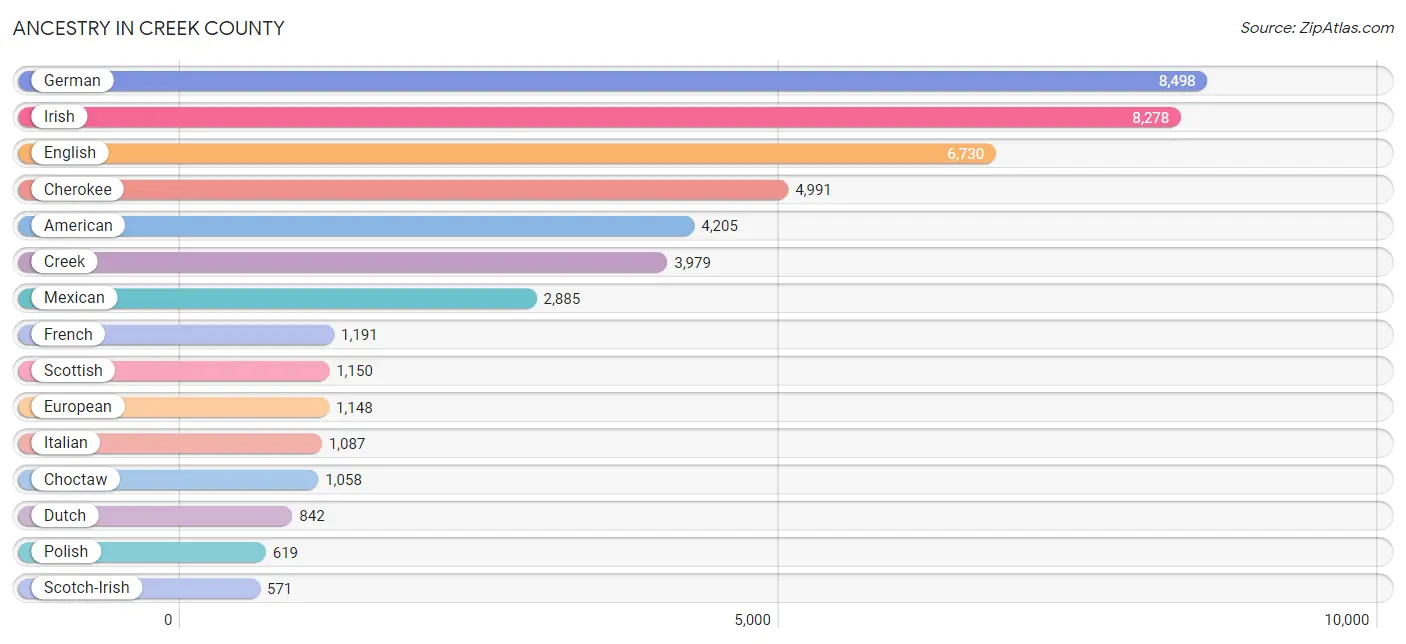
Ancestry in Creek County
The most populous ancestries reported in Creek County are German (8,498 | 11.8%), Irish (8,278 | 11.5%), English (6,730 | 9.3%), Cherokee (4,991 | 6.9%), and American (4,205 | 5.8%), together accounting for 45.4% of all Creek County residents.
| Ancestry | # Population | % Population |
| African | 231 | 0.3% |
| American | 4,205 | 5.8% |
| Apache | 68 | 0.1% |
| Arab | 86 | 0.1% |
| Armenian | 31 | 0.0% |
| Austrian | 97 | 0.1% |
| Basque | 27 | 0.0% |
| Belgian | 3 | 0.0% |
| Bhutanese | 44 | 0.1% |
| Blackfeet | 67 | 0.1% |
| British | 375 | 0.5% |
| Bulgarian | 14 | 0.0% |
| Burmese | 20 | 0.0% |
| Cajun | 13 | 0.0% |
| Canadian | 63 | 0.1% |
| Central American | 188 | 0.3% |
| Central American Indian | 9 | 0.0% |
| Cherokee | 4,991 | 6.9% |
| Chickasaw | 338 | 0.5% |
| Choctaw | 1,058 | 1.5% |
| Comanche | 19 | 0.0% |
| Costa Rican | 22 | 0.0% |
| Creek | 3,979 | 5.5% |
| Croatian | 85 | 0.1% |
| Cuban | 24 | 0.0% |
| Czech | 173 | 0.2% |
| Czechoslovakian | 28 | 0.0% |
| Danish | 94 | 0.1% |
| Delaware | 18 | 0.0% |
| Dominican | 19 | 0.0% |
| Dutch | 842 | 1.2% |
| Dutch West Indian | 321 | 0.4% |
| Eastern European | 57 | 0.1% |
| Egyptian | 19 | 0.0% |
| English | 6,730 | 9.3% |
| European | 1,148 | 1.6% |
| Finnish | 108 | 0.2% |
| French | 1,191 | 1.7% |
| French American Indian | 4 | 0.0% |
| French Canadian | 43 | 0.1% |
| German | 8,498 | 11.8% |
| Greek | 67 | 0.1% |
| Guamanian / Chamorro | 8 | 0.0% |
| Guatemalan | 69 | 0.1% |
| Honduran | 56 | 0.1% |
| Hungarian | 39 | 0.1% |
| Icelander | 7 | 0.0% |
| Indian (Asian) | 3 | 0.0% |
| Indonesian | 82 | 0.1% |
| Inupiat | 10 | 0.0% |
| Iranian | 24 | 0.0% |
| Irish | 8,278 | 11.5% |
| Iroquois | 21 | 0.0% |
| Italian | 1,087 | 1.5% |
| Kiowa | 33 | 0.1% |
| Korean | 181 | 0.3% |
| Lebanese | 61 | 0.1% |
| Lithuanian | 14 | 0.0% |
| Malaysian | 2 | 0.0% |
| Menominee | 3 | 0.0% |
| Mexican | 2,885 | 4.0% |
| Mexican American Indian | 30 | 0.0% |
| Native Hawaiian | 11 | 0.0% |
| Navajo | 17 | 0.0% |
| Nigerian | 18 | 0.0% |
| Northern European | 49 | 0.1% |
| Norwegian | 363 | 0.5% |
| Osage | 222 | 0.3% |
| Pakistani | 135 | 0.2% |
| Palestinian | 6 | 0.0% |
| Panamanian | 19 | 0.0% |
| Pennsylvania German | 16 | 0.0% |
| Peruvian | 25 | 0.0% |
| Polish | 619 | 0.9% |
| Portuguese | 23 | 0.0% |
| Potawatomi | 146 | 0.2% |
| Pueblo | 35 | 0.1% |
| Puerto Rican | 99 | 0.1% |
| Romanian | 21 | 0.0% |
| Russian | 60 | 0.1% |
| Salvadoran | 22 | 0.0% |
| Scandinavian | 151 | 0.2% |
| Scotch-Irish | 571 | 0.8% |
| Scottish | 1,150 | 1.6% |
| Seminole | 165 | 0.2% |
| Sioux | 46 | 0.1% |
| Slovak | 12 | 0.0% |
| South African | 10 | 0.0% |
| South American | 40 | 0.1% |
| South American Indian | 14 | 0.0% |
| Spaniard | 132 | 0.2% |
| Spanish | 77 | 0.1% |
| Sri Lankan | 203 | 0.3% |
| Subsaharan African | 259 | 0.4% |
| Swedish | 425 | 0.6% |
| Swiss | 61 | 0.1% |
| Thai | 93 | 0.1% |
| Tlingit-Haida | 50 | 0.1% |
| Ukrainian | 52 | 0.1% |
| Ute | 11 | 0.0% |
| Venezuelan | 15 | 0.0% |
| Welsh | 341 | 0.5% |
| West Indian | 7 | 0.0% |
| Yugoslavian | 7 | 0.0% | View All 104 Rows |
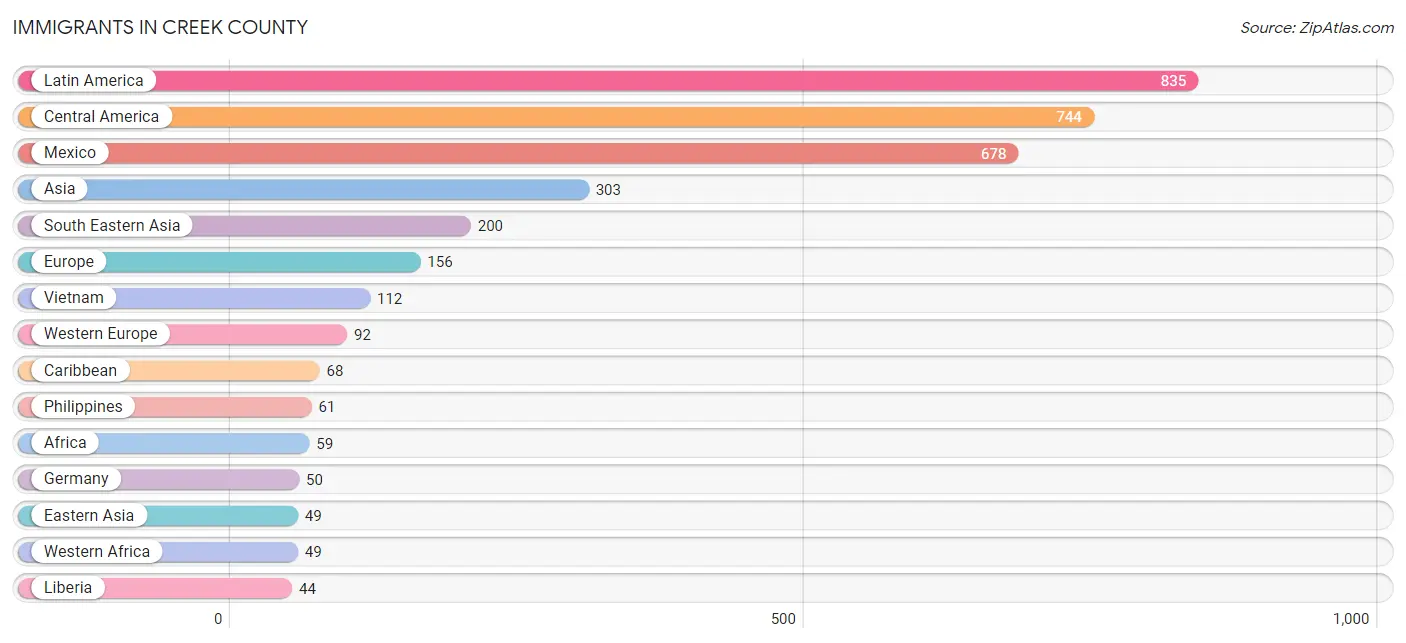
Immigrants in Creek County
The most numerous immigrant groups reported in Creek County came from Latin America (835 | 1.2%), Central America (744 | 1.0%), Mexico (678 | 0.9%), Asia (303 | 0.4%), and South Eastern Asia (200 | 0.3%), together accounting for 3.8% of all Creek County residents.
| Immigration Origin | # Population | % Population |
| Africa | 59 | 0.1% |
| Asia | 303 | 0.4% |
| Austria | 37 | 0.1% |
| Belize | 11 | 0.0% |
| Canada | 18 | 0.0% |
| Caribbean | 68 | 0.1% |
| Central America | 744 | 1.0% |
| Costa Rica | 17 | 0.0% |
| Cuba | 9 | 0.0% |
| Dominican Republic | 19 | 0.0% |
| Eastern Asia | 49 | 0.1% |
| Eastern Europe | 30 | 0.0% |
| El Salvador | 14 | 0.0% |
| England | 10 | 0.0% |
| Europe | 156 | 0.2% |
| Germany | 50 | 0.1% |
| Guatemala | 5 | 0.0% |
| India | 23 | 0.0% |
| Iran | 16 | 0.0% |
| Japan | 6 | 0.0% |
| Korea | 43 | 0.1% |
| Latin America | 835 | 1.2% |
| Latvia | 9 | 0.0% |
| Liberia | 44 | 0.1% |
| Mexico | 678 | 0.9% |
| Northern Europe | 15 | 0.0% |
| Panama | 19 | 0.0% |
| Peru | 19 | 0.0% |
| Philippines | 61 | 0.1% |
| Russia | 5 | 0.0% |
| South Africa | 3 | 0.0% |
| South America | 23 | 0.0% |
| South Central Asia | 39 | 0.1% |
| South Eastern Asia | 200 | 0.3% |
| Southern Europe | 19 | 0.0% |
| Spain | 19 | 0.0% |
| Switzerland | 5 | 0.0% |
| Thailand | 11 | 0.0% |
| Trinidad and Tobago | 40 | 0.1% |
| Ukraine | 6 | 0.0% |
| Venezuela | 4 | 0.0% |
| Vietnam | 112 | 0.2% |
| Western Africa | 49 | 0.1% |
| Western Europe | 92 | 0.1% | View All 44 Rows |
Sex and Age in Creek County
Sex and Age in Creek County
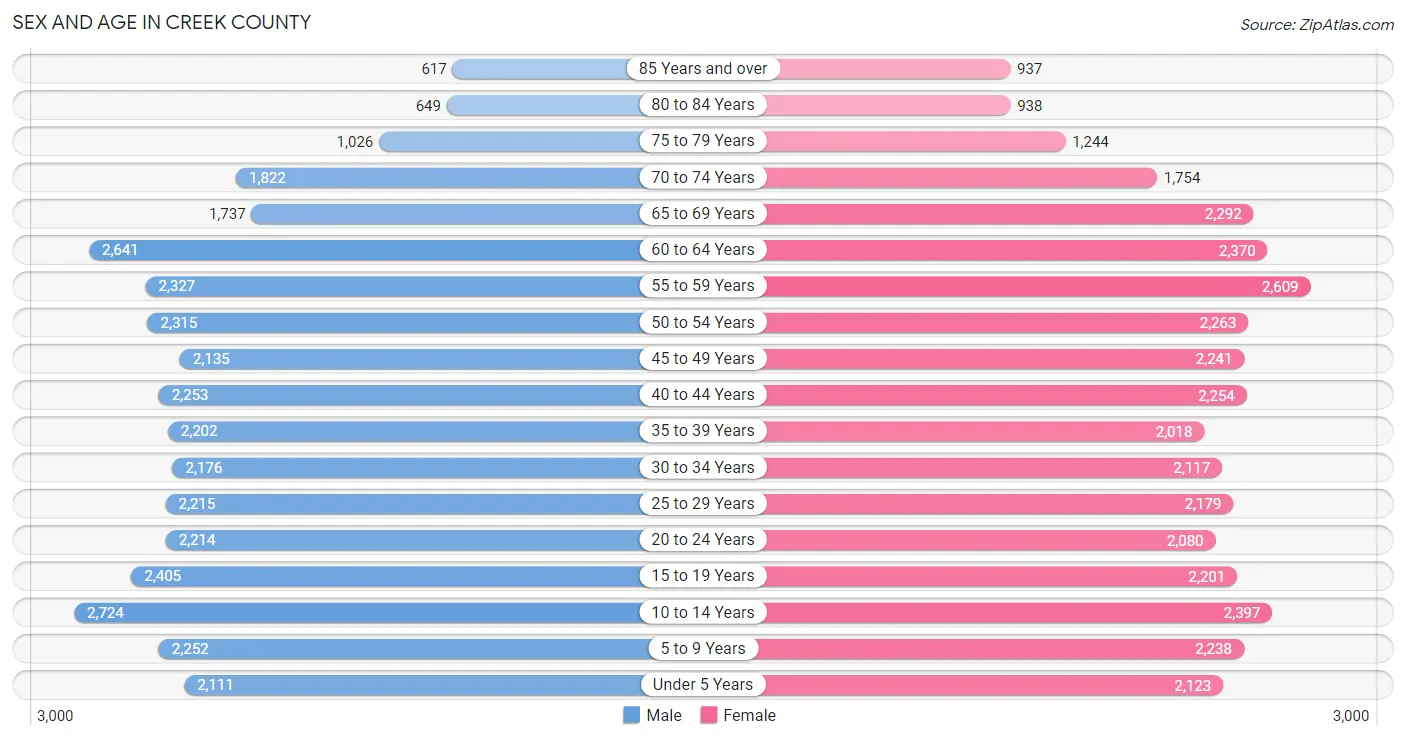
The most populous age groups in Creek County are 10 to 14 Years (2,724 | 7.6%) for men and 55 to 59 Years (2,609 | 7.2%) for women.
| Age Bracket | Male | Female |
| Under 5 Years | 2,111 (5.9%) | 2,123 (5.9%) |
| 5 to 9 Years | 2,252 (6.3%) | 2,238 (6.2%) |
| 10 to 14 Years | 2,724 (7.6%) | 2,397 (6.6%) |
| 15 to 19 Years | 2,405 (6.7%) | 2,201 (6.1%) |
| 20 to 24 Years | 2,214 (6.2%) | 2,080 (5.7%) |
| 25 to 29 Years | 2,215 (6.2%) | 2,179 (6.0%) |
| 30 to 34 Years | 2,176 (6.1%) | 2,117 (5.8%) |
| 35 to 39 Years | 2,202 (6.1%) | 2,018 (5.6%) |
| 40 to 44 Years | 2,253 (6.3%) | 2,254 (6.2%) |
| 45 to 49 Years | 2,135 (6.0%) | 2,241 (6.2%) |
| 50 to 54 Years | 2,315 (6.5%) | 2,263 (6.2%) |
| 55 to 59 Years | 2,327 (6.5%) | 2,609 (7.2%) |
| 60 to 64 Years | 2,641 (7.4%) | 2,370 (6.5%) |
| 65 to 69 Years | 1,737 (4.9%) | 2,292 (6.3%) |
| 70 to 74 Years | 1,822 (5.1%) | 1,754 (4.8%) |
| 75 to 79 Years | 1,026 (2.9%) | 1,244 (3.4%) |
| 80 to 84 Years | 649 (1.8%) | 938 (2.6%) |
| 85 Years and over | 617 (1.7%) | 937 (2.6%) |
| Total | 35,821 (100.0%) | 36,255 (100.0%) |
Families and Households in Creek County
Median Family Size in Creek County
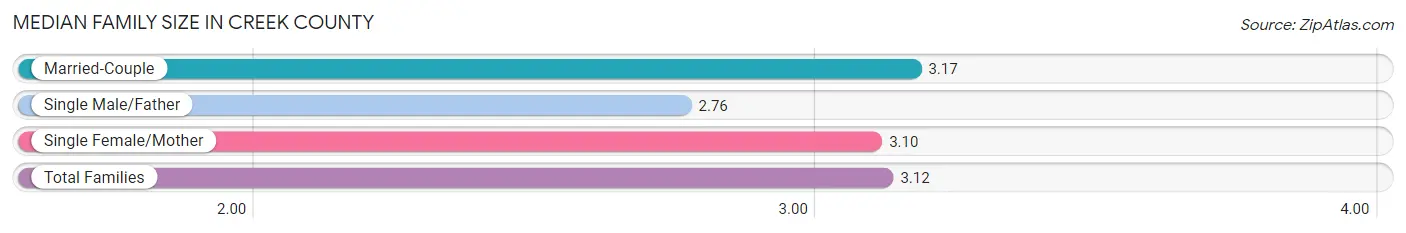
The median family size in Creek County is 3.12 persons per family, with married-couple families (14,625 | 76.4%) accounting for the largest median family size of 3.17 persons per family. On the other hand, single male/father families (1,531 | 8.0%) represent the smallest median family size with 2.76 persons per family.
| Family Type | # Families | Family Size |
| Married-Couple | 14,625 (76.4%) | 3.17 |
| Single Male/Father | 1,531 (8.0%) | 2.76 |
| Single Female/Mother | 2,985 (15.6%) | 3.10 |
| Total Families | 19,141 (100.0%) | 3.12 |
Median Household Size in Creek County
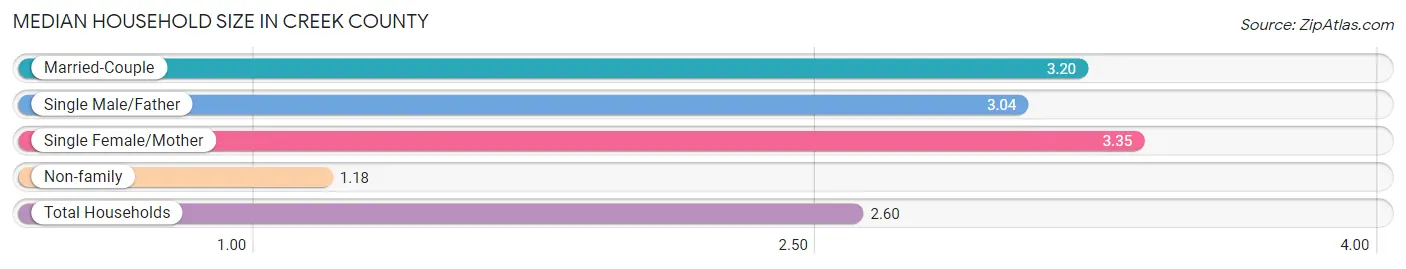
The median household size in Creek County is 2.60 persons per household, with single female/mother households (2,985 | 10.9%) accounting for the largest median household size of 3.35 persons per household. non-family households (8,233 | 30.1%) represent the smallest median household size with 1.18 persons per household.
| Household Type | # Households | Household Size |
| Married-Couple | 14,625 (53.4%) | 3.20 |
| Single Male/Father | 1,531 (5.6%) | 3.04 |
| Single Female/Mother | 2,985 (10.9%) | 3.35 |
| Non-family | 8,233 (30.1%) | 1.18 |
| Total Households | 27,374 (100.0%) | 2.60 |
Household Size by Marriage Status in Creek County
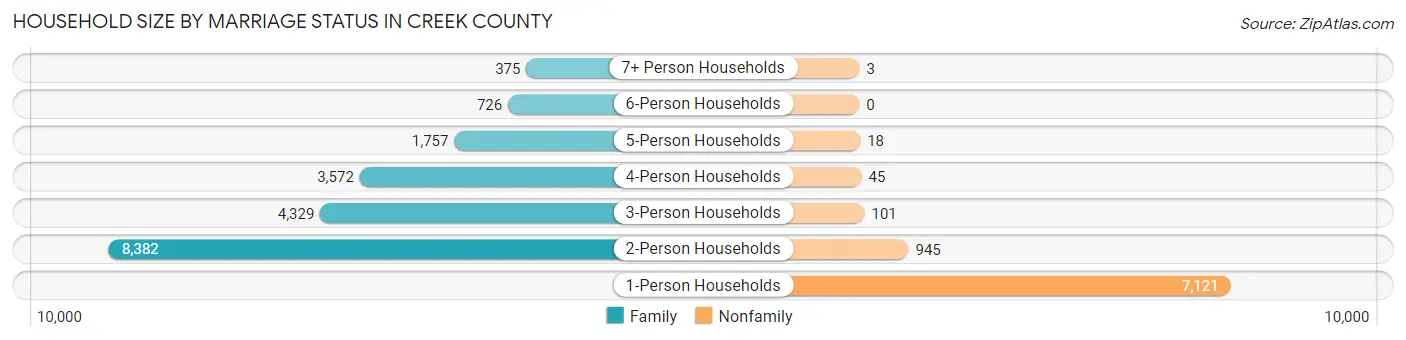
Out of a total of 27,374 households in Creek County, 19,141 (69.9%) are family households, while 8,233 (30.1%) are nonfamily households. The most numerous type of family households are 2-person households, comprising 8,382, and the most common type of nonfamily households are 1-person households, comprising 7,121.
| Household Size | Family Households | Nonfamily Households |
| 1-Person Households | - | 7,121 (26.0%) |
| 2-Person Households | 8,382 (30.6%) | 945 (3.5%) |
| 3-Person Households | 4,329 (15.8%) | 101 (0.4%) |
| 4-Person Households | 3,572 (13.1%) | 45 (0.2%) |
| 5-Person Households | 1,757 (6.4%) | 18 (0.1%) |
| 6-Person Households | 726 (2.6%) | 0 (0.0%) |
| 7+ Person Households | 375 (1.4%) | 3 (0.0%) |
| Total | 19,141 (69.9%) | 8,233 (30.1%) |
Female Fertility in Creek County
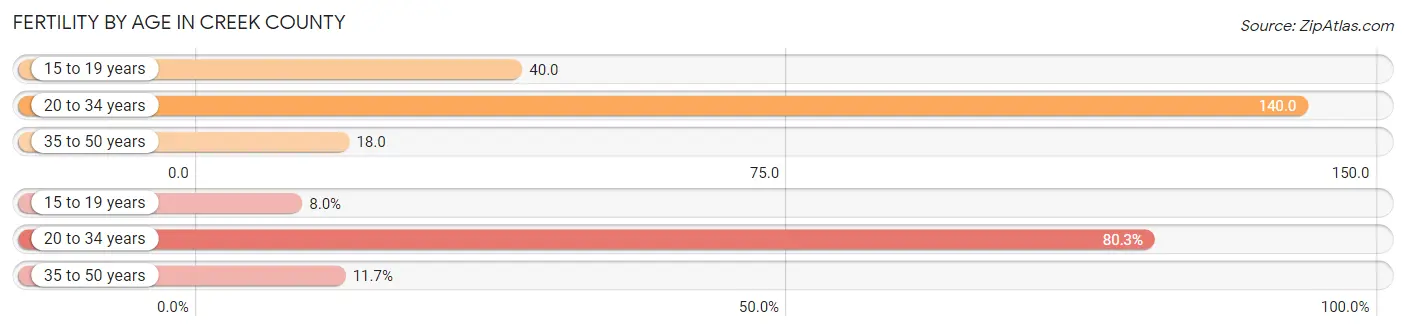
Fertility by Age in Creek County
Average fertility rate in Creek County is 71.0 births per 1,000 women. Women in the age bracket of 20 to 34 years have the highest fertility rate with 140.0 births per 1,000 women. Women in the age bracket of 20 to 34 years acount for 80.3% of all women with births.
| Age Bracket | Women with Births | Births / 1,000 Women |
| 15 to 19 years | 89 (8.0%) | 40.0 |
| 20 to 34 years | 894 (80.3%) | 140.0 |
| 35 to 50 years | 130 (11.7%) | 18.0 |
| Total | 1,113 (100.0%) | 71.0 |
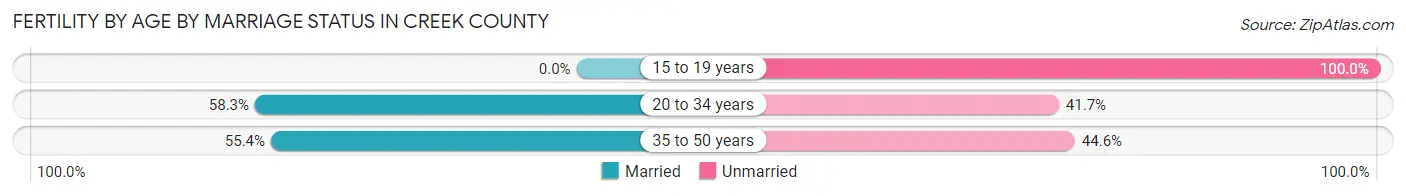
Fertility by Age by Marriage Status in Creek County
53.3% of women with births (1,113) in Creek County are married. The highest percentage of unmarried women with births falls into 15 to 19 years age bracket with 100.0% of them unmarried at the time of birth, while the lowest percentage of unmarried women with births belong to 20 to 34 years age bracket with 41.7% of them unmarried.
| Age Bracket | Married | Unmarried |
| 15 to 19 years | 0 (0.0%) | 89 (100.0%) |
| 20 to 34 years | 521 (58.3%) | 373 (41.7%) |
| 35 to 50 years | 72 (55.4%) | 58 (44.6%) |
| Total | 593 (53.3%) | 520 (46.7%) |
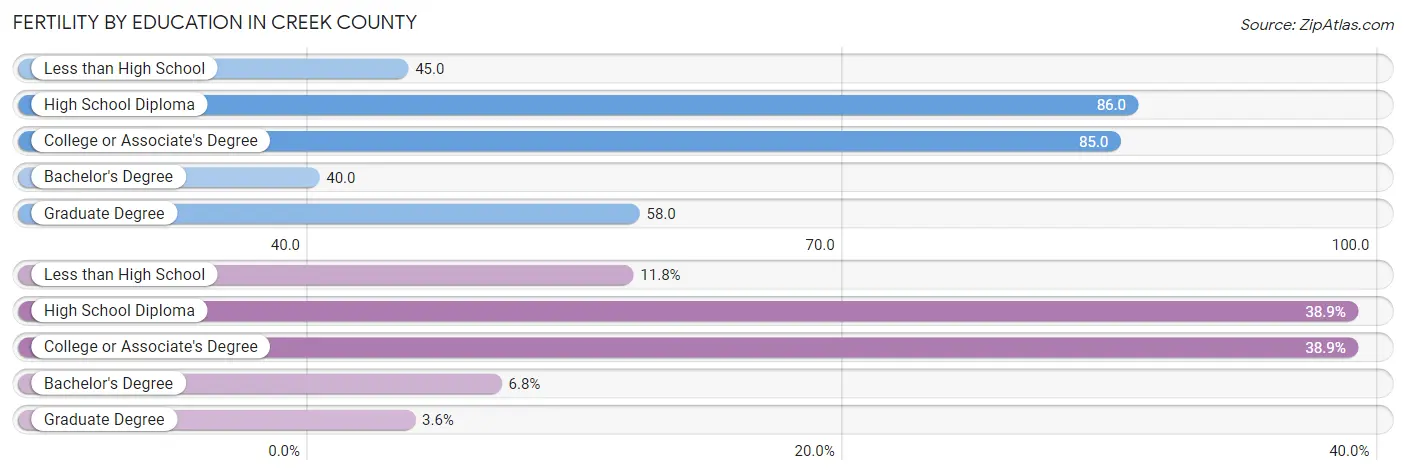
Fertility by Education in Creek County
Average fertility rate in Creek County is 71.0 births per 1,000 women. Women with the education attainment of high school diploma have the highest fertility rate of 86.0 births per 1,000 women, while women with the education attainment of bachelor's degree have the lowest fertility at 40.0 births per 1,000 women. Women with the education attainment of high school diploma represent 38.9% of all women with births.
| Educational Attainment | Women with Births | Births / 1,000 Women |
| Less than High School | 131 (11.8%) | 45.0 |
| High School Diploma | 433 (38.9%) | 86.0 |
| College or Associate's Degree | 433 (38.9%) | 85.0 |
| Bachelor's Degree | 76 (6.8%) | 40.0 |
| Graduate Degree | 40 (3.6%) | 58.0 |
| Total | 1,113 (100.0%) | 71.0 |
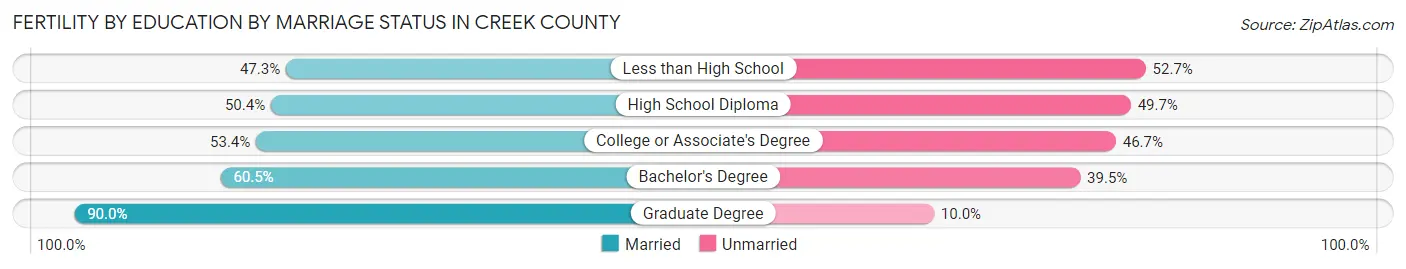
Fertility by Education by Marriage Status in Creek County
46.7% of women with births in Creek County are unmarried. Women with the educational attainment of graduate degree are most likely to be married with 90.0% of them married at childbirth, while women with the educational attainment of less than high school are least likely to be married with 52.7% of them unmarried at childbirth.
| Educational Attainment | Married | Unmarried |
| Less than High School | 62 (47.3%) | 69 (52.7%) |
| High School Diploma | 218 (50.3%) | 215 (49.6%) |
| College or Associate's Degree | 231 (53.3%) | 202 (46.7%) |
| Bachelor's Degree | 46 (60.5%) | 30 (39.5%) |
| Graduate Degree | 36 (90.0%) | 4 (10.0%) |
| Total | 593 (53.3%) | 520 (46.7%) |
Income in Creek County
Income Overview in Creek County
Per Capita Income in Creek County is $31,222, while median incomes of families and households are $77,035 and $61,657 respectively.
| Characteristic | Number | Measure |
| Per Capita Income | 72,076 | $31,222 |
| Median Family Income | 19,141 | $77,035 |
| Mean Family Income | 19,141 | $93,462 |
| Median Household Income | 27,374 | $61,657 |
| Mean Household Income | 27,374 | $79,257 |
| Income Deficit | 19,141 | $11,298 |
| Wage / Income Gap (%) | 72,076 | 35.01% |
| Wage / Income Gap ($) | 72,076 | 64.99¢ per $1 |
| Gini / Inequality Index | 72,076 | 0.44 |
Earnings by Sex in Creek County
Average Earnings in Creek County are $41,127, $49,838 for men and $32,389 for women, a difference of 35.0%.
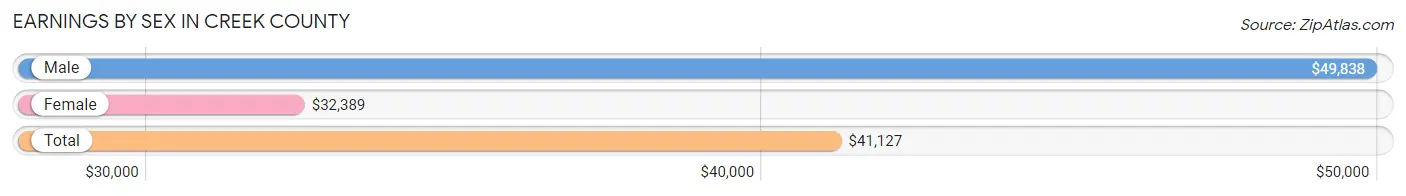
| Sex | Number | Average Earnings |
| Male | 18,514 (54.9%) | $49,838 |
| Female | 15,208 (45.1%) | $32,389 |
| Total | 33,722 (100.0%) | $41,127 |
Earnings by Sex by Income Bracket in Creek County
The most common earnings brackets in Creek County are $75,000 to $99,999 for men (2,459 | 13.3%) and $25,000 to $29,999 for women (1,210 | 8.0%).
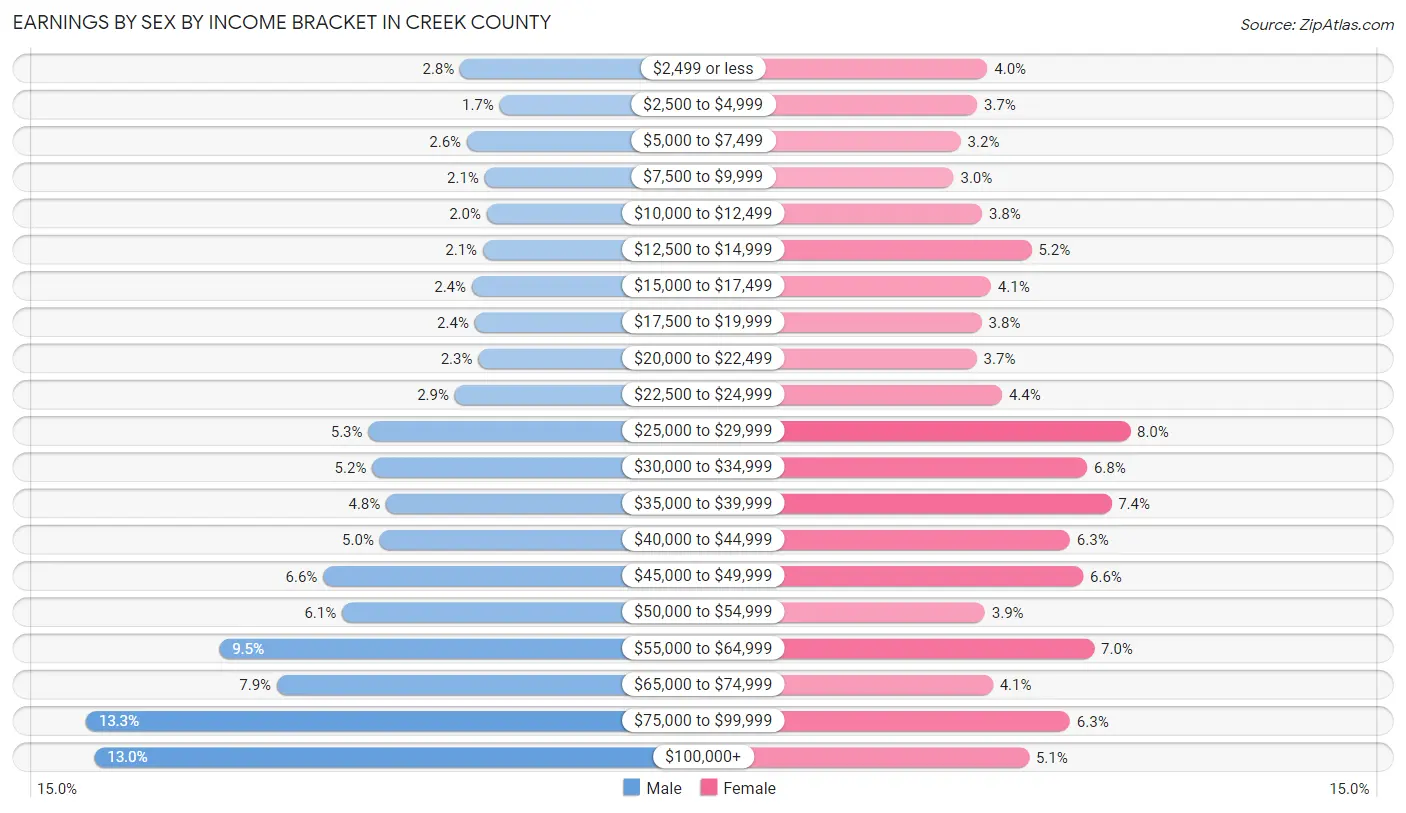
| Income | Male | Female |
| $2,499 or less | 511 (2.8%) | 601 (4.0%) |
| $2,500 to $4,999 | 306 (1.7%) | 557 (3.7%) |
| $5,000 to $7,499 | 475 (2.6%) | 486 (3.2%) |
| $7,500 to $9,999 | 383 (2.1%) | 457 (3.0%) |
| $10,000 to $12,499 | 373 (2.0%) | 578 (3.8%) |
| $12,500 to $14,999 | 392 (2.1%) | 789 (5.2%) |
| $15,000 to $17,499 | 450 (2.4%) | 616 (4.1%) |
| $17,500 to $19,999 | 435 (2.4%) | 576 (3.8%) |
| $20,000 to $22,499 | 416 (2.2%) | 555 (3.6%) |
| $22,500 to $24,999 | 538 (2.9%) | 663 (4.4%) |
| $25,000 to $29,999 | 989 (5.3%) | 1,210 (8.0%) |
| $30,000 to $34,999 | 969 (5.2%) | 1,026 (6.8%) |
| $35,000 to $39,999 | 896 (4.8%) | 1,130 (7.4%) |
| $40,000 to $44,999 | 929 (5.0%) | 953 (6.3%) |
| $45,000 to $49,999 | 1,224 (6.6%) | 1,010 (6.6%) |
| $50,000 to $54,999 | 1,126 (6.1%) | 590 (3.9%) |
| $55,000 to $64,999 | 1,765 (9.5%) | 1,057 (7.0%) |
| $65,000 to $74,999 | 1,464 (7.9%) | 623 (4.1%) |
| $75,000 to $99,999 | 2,459 (13.3%) | 953 (6.3%) |
| $100,000+ | 2,414 (13.0%) | 778 (5.1%) |
| Total | 18,514 (100.0%) | 15,208 (100.0%) |
Earnings by Sex by Educational Attainment in Creek County
Average earnings in Creek County are $54,772 for men and $36,036 for women, a difference of 34.2%. Men with an educational attainment of graduate degree enjoy the highest average annual earnings of $82,321, while those with less than high school education earn the least with $44,142. Women with an educational attainment of graduate degree earn the most with the average annual earnings of $57,259, while those with less than high school education have the smallest earnings of $20,547.
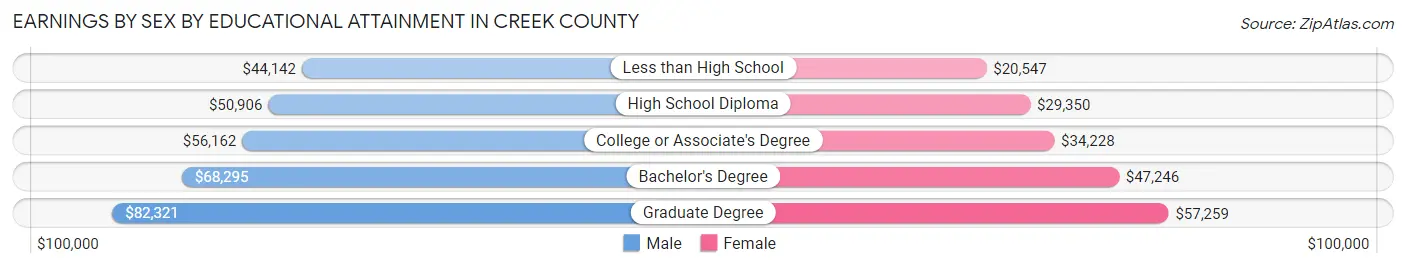
| Educational Attainment | Male Income | Female Income |
| Less than High School | $44,142 | $20,547 |
| High School Diploma | $50,906 | $29,350 |
| College or Associate's Degree | $56,162 | $34,228 |
| Bachelor's Degree | $68,295 | $47,246 |
| Graduate Degree | $82,321 | $57,259 |
| Total | $54,772 | $36,036 |
Family Income in Creek County
Family Income Brackets in Creek County
According to the Creek County family income data, there are 4,020 families falling into the $100,000 to $149,999 income range, which is the most common income bracket and makes up 21.0% of all families. Conversely, the $10,000 to $14,999 income bracket is the least frequent group with only 459 families (2.4%) belonging to this category.
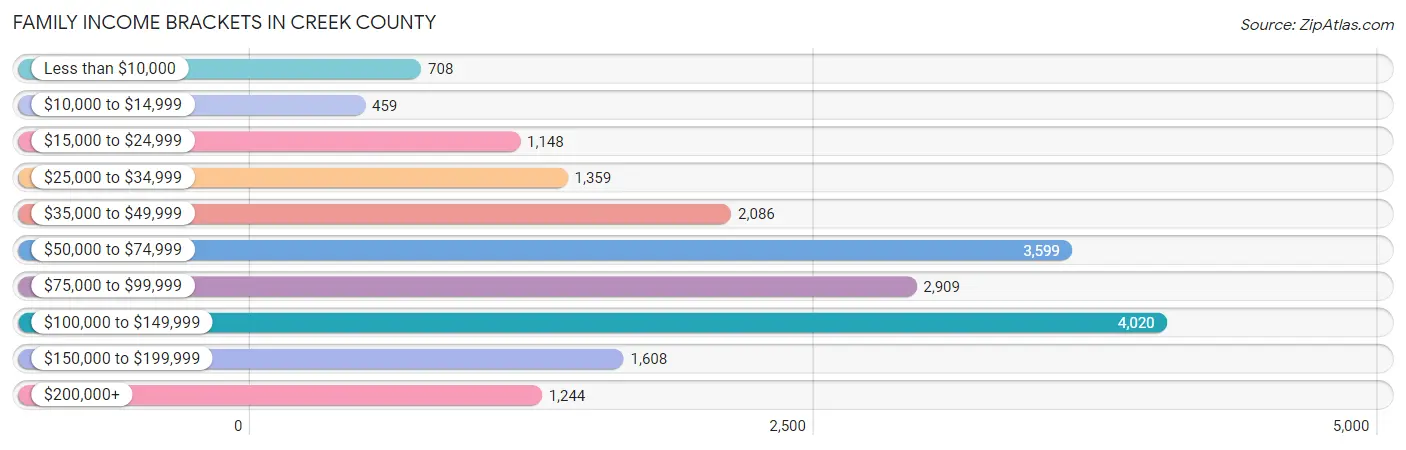
| Income Bracket | # Families | % Families |
| Less than $10,000 | 708 | 3.7% |
| $10,000 to $14,999 | 459 | 2.4% |
| $15,000 to $24,999 | 1,148 | 6.0% |
| $25,000 to $34,999 | 1,359 | 7.1% |
| $35,000 to $49,999 | 2,086 | 10.9% |
| $50,000 to $74,999 | 3,599 | 18.8% |
| $75,000 to $99,999 | 2,909 | 15.2% |
| $100,000 to $149,999 | 4,020 | 21.0% |
| $150,000 to $199,999 | 1,608 | 8.4% |
| $200,000+ | 1,244 | 6.5% |
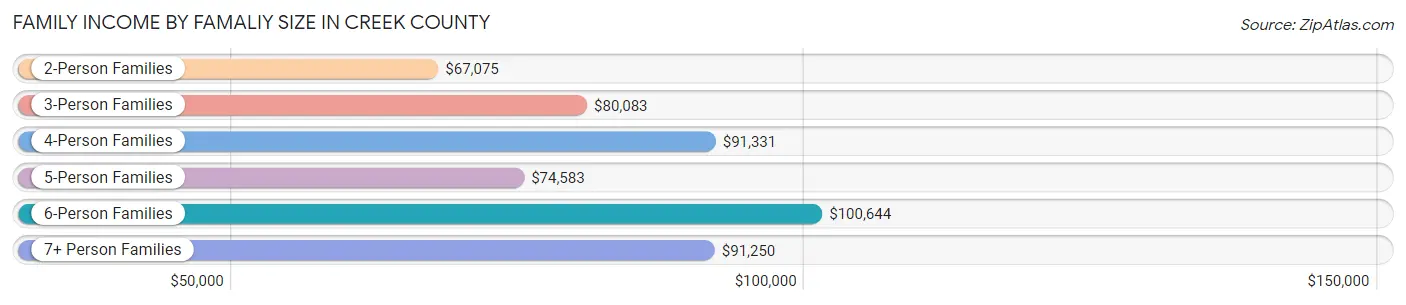
Family Income by Famaliy Size in Creek County
6-person families (673 | 3.5%) account for the highest median family income in Creek County with $100,644 per family, while 2-person families (8,816 | 46.1%) have the highest median income of $33,538 per family member.
| Income Bracket | # Families | Median Income |
| 2-Person Families | 8,816 (46.1%) | $67,075 |
| 3-Person Families | 4,380 (22.9%) | $80,083 |
| 4-Person Families | 3,363 (17.6%) | $91,331 |
| 5-Person Families | 1,619 (8.5%) | $74,583 |
| 6-Person Families | 673 (3.5%) | $100,644 |
| 7+ Person Families | 290 (1.5%) | $91,250 |
| Total | 19,141 (100.0%) | $77,035 |
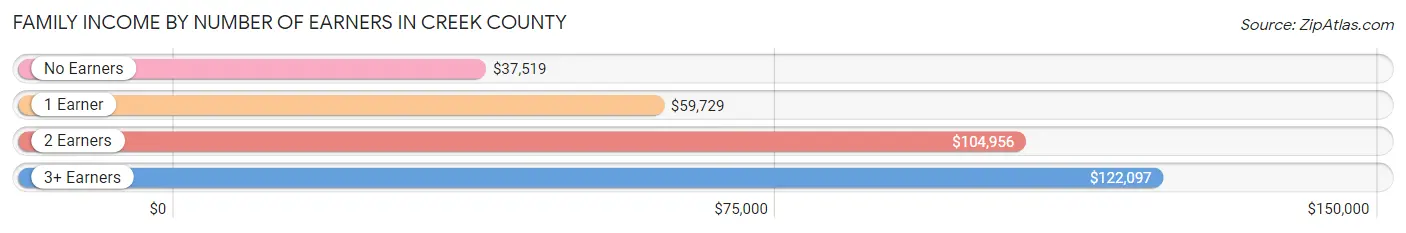
Family Income by Number of Earners in Creek County
The median family income in Creek County is $77,035, with families comprising 3+ earners (1,732) having the highest median family income of $122,097, while families with no earners (3,964) have the lowest median family income of $37,519, accounting for 9.0% and 20.7% of families, respectively.
| Number of Earners | # Families | Median Income |
| No Earners | 3,964 (20.7%) | $37,519 |
| 1 Earner | 6,349 (33.2%) | $59,729 |
| 2 Earners | 7,096 (37.1%) | $104,956 |
| 3+ Earners | 1,732 (9.0%) | $122,097 |
| Total | 19,141 (100.0%) | $77,035 |
Household Income in Creek County
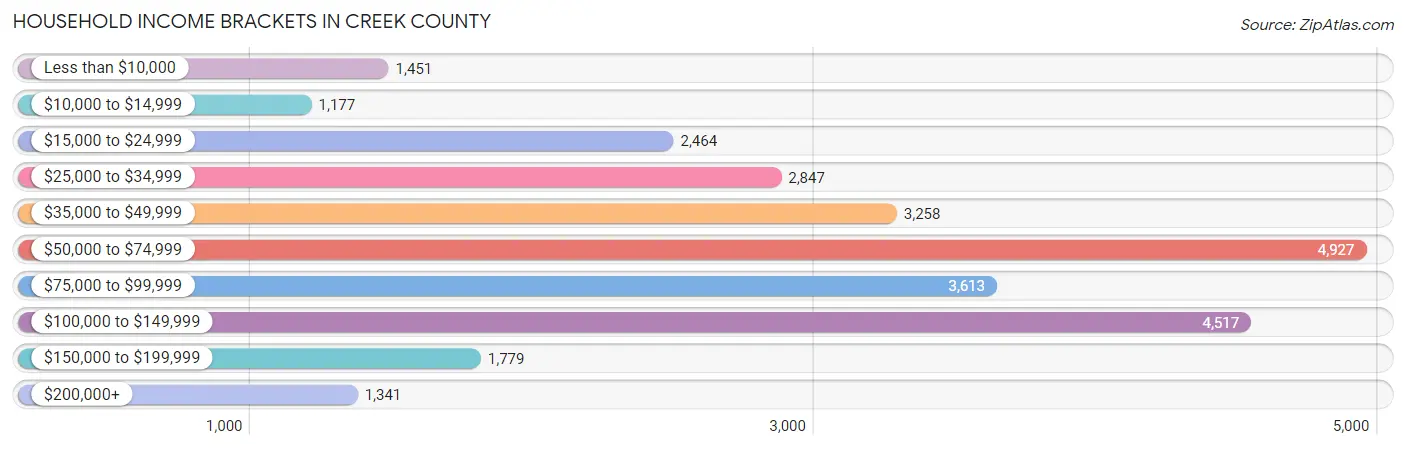
Household Income Brackets in Creek County
With 4,927 households falling in the category, the $50,000 to $74,999 income range is the most frequent in Creek County, accounting for 18.0% of all households. In contrast, only 1,177 households (4.3%) fall into the $10,000 to $14,999 income bracket, making it the least populous group.
| Income Bracket | # Households | % Households |
| Less than $10,000 | 1,451 | 5.3% |
| $10,000 to $14,999 | 1,177 | 4.3% |
| $15,000 to $24,999 | 2,464 | 9.0% |
| $25,000 to $34,999 | 2,847 | 10.4% |
| $35,000 to $49,999 | 3,258 | 11.9% |
| $50,000 to $74,999 | 4,927 | 18.0% |
| $75,000 to $99,999 | 3,613 | 13.2% |
| $100,000 to $149,999 | 4,517 | 16.5% |
| $150,000 to $199,999 | 1,779 | 6.5% |
| $200,000+ | 1,341 | 4.9% |
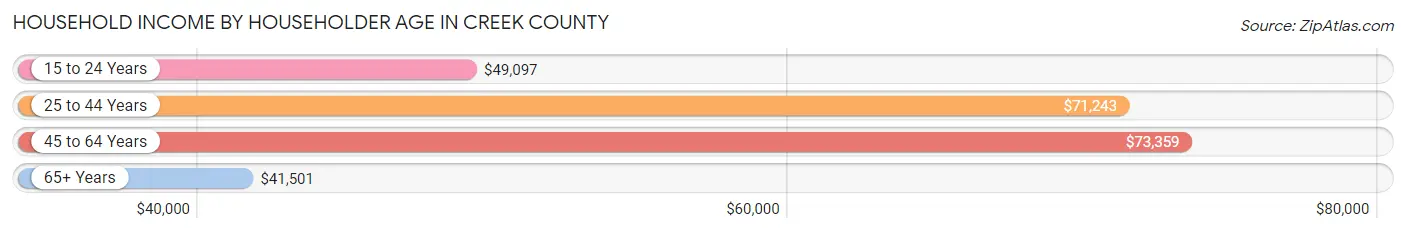
Household Income by Householder Age in Creek County
The median household income in Creek County is $61,657, with the highest median household income of $73,359 found in the 45 to 64 years age bracket for the primary householder. A total of 10,655 households (38.9%) fall into this category. Meanwhile, the 65+ years age bracket for the primary householder has the lowest median household income of $41,501, with 8,027 households (29.3%) in this group.
| Income Bracket | # Households | Median Income |
| 15 to 24 Years | 925 (3.4%) | $49,097 |
| 25 to 44 Years | 7,767 (28.4%) | $71,243 |
| 45 to 64 Years | 10,655 (38.9%) | $73,359 |
| 65+ Years | 8,027 (29.3%) | $41,501 |
| Total | 27,374 (100.0%) | $61,657 |
Poverty in Creek County
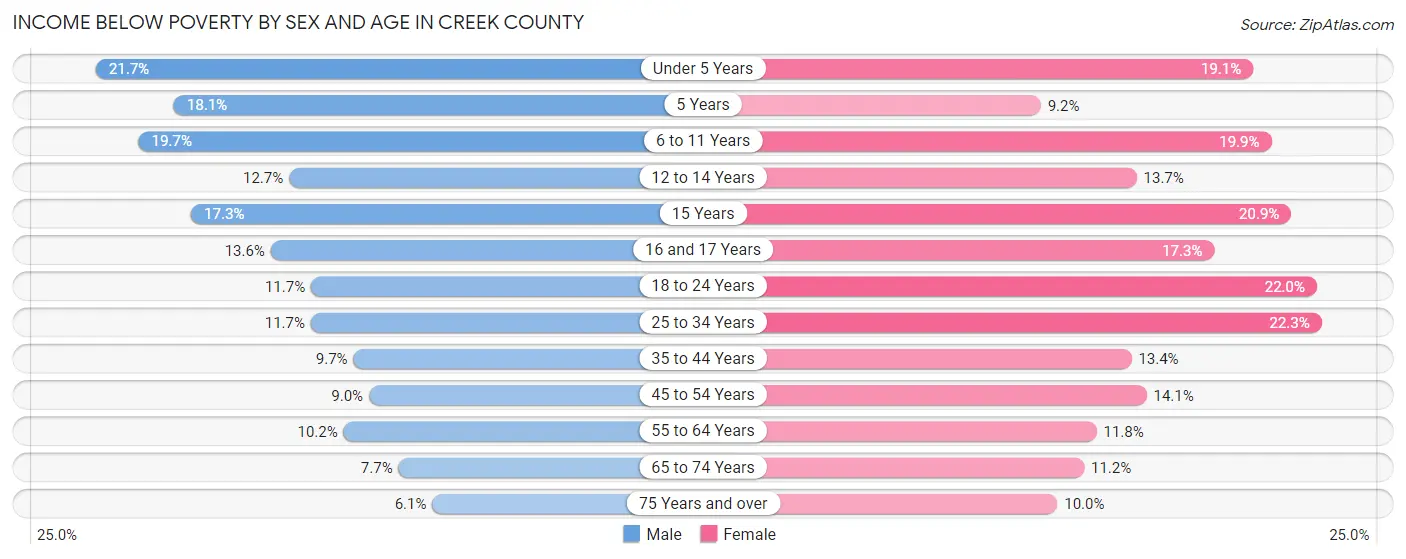
Income Below Poverty by Sex and Age in Creek County
With 11.6% poverty level for males and 15.4% for females among the residents of Creek County, under 5 year old males and 25 to 34 year old females are the most vulnerable to poverty, with 452 males (21.7%) and 947 females (22.3%) in their respective age groups living below the poverty level.
| Age Bracket | Male | Female |
| Under 5 Years | 452 (21.7%) | 391 (19.1%) |
| 5 Years | 71 (18.1%) | 55 (9.2%) |
| 6 to 11 Years | 564 (19.7%) | 501 (19.9%) |
| 12 to 14 Years | 196 (12.7%) | 176 (13.7%) |
| 15 Years | 81 (17.3%) | 113 (20.8%) |
| 16 and 17 Years | 145 (13.6%) | 160 (17.3%) |
| 18 to 24 Years | 357 (11.7%) | 617 (22.0%) |
| 25 to 34 Years | 500 (11.7%) | 947 (22.3%) |
| 35 to 44 Years | 432 (9.7%) | 572 (13.4%) |
| 45 to 54 Years | 400 (9.0%) | 637 (14.1%) |
| 55 to 64 Years | 504 (10.2%) | 579 (11.8%) |
| 65 to 74 Years | 266 (7.6%) | 449 (11.2%) |
| 75 Years and over | 137 (6.1%) | 288 (10.0%) |
| Total | 4,105 (11.6%) | 5,485 (15.4%) |
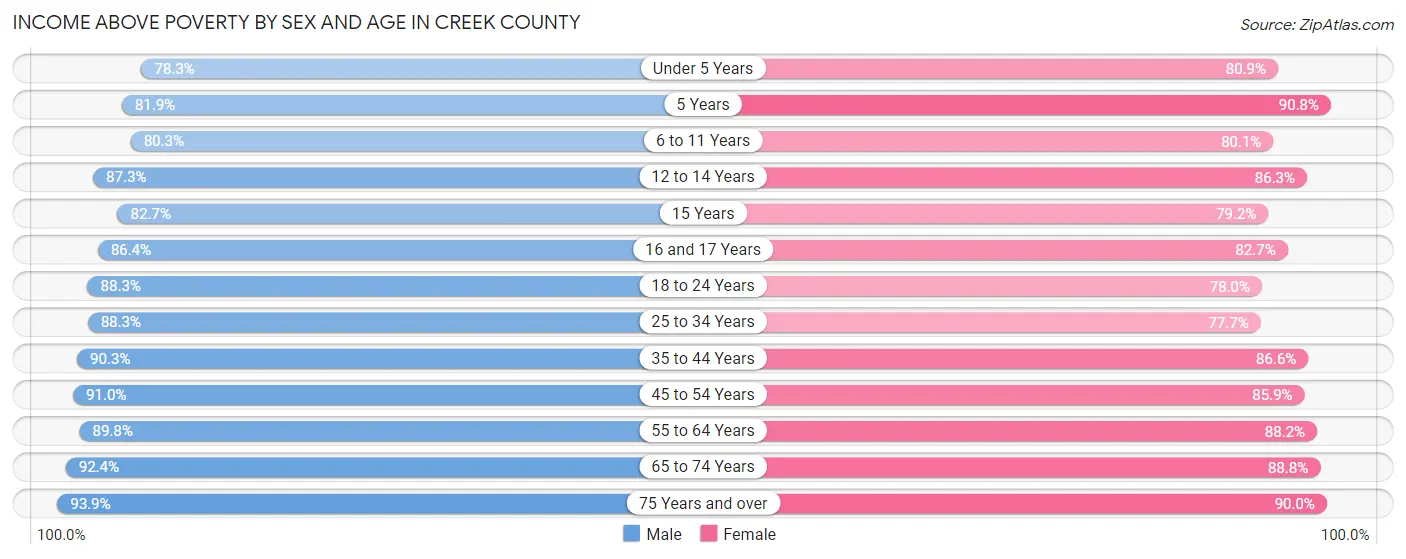
Income Above Poverty by Sex and Age in Creek County
According to the poverty statistics in Creek County, males aged 75 years and over and females aged 5 years are the age groups that are most secure financially, with 93.9% of males and 90.8% of females in these age groups living above the poverty line.
| Age Bracket | Male | Female |
| Under 5 Years | 1,632 (78.3%) | 1,658 (80.9%) |
| 5 Years | 322 (81.9%) | 541 (90.8%) |
| 6 to 11 Years | 2,298 (80.3%) | 2,013 (80.1%) |
| 12 to 14 Years | 1,344 (87.3%) | 1,111 (86.3%) |
| 15 Years | 388 (82.7%) | 429 (79.1%) |
| 16 and 17 Years | 923 (86.4%) | 766 (82.7%) |
| 18 to 24 Years | 2,692 (88.3%) | 2,182 (78.0%) |
| 25 to 34 Years | 3,765 (88.3%) | 3,307 (77.7%) |
| 35 to 44 Years | 4,003 (90.3%) | 3,685 (86.6%) |
| 45 to 54 Years | 4,034 (91.0%) | 3,867 (85.9%) |
| 55 to 64 Years | 4,439 (89.8%) | 4,320 (88.2%) |
| 65 to 74 Years | 3,209 (92.3%) | 3,545 (88.8%) |
| 75 Years and over | 2,115 (93.9%) | 2,591 (90.0%) |
| Total | 31,164 (88.4%) | 30,015 (84.6%) |
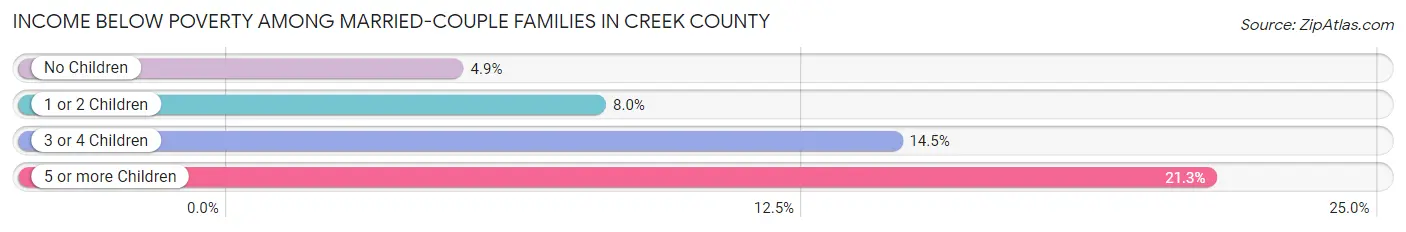
Income Below Poverty Among Married-Couple Families in Creek County
The poverty statistics for married-couple families in Creek County show that 6.9% or 1,006 of the total 14,625 families live below the poverty line. Families with 5 or more children have the highest poverty rate of 21.3%, comprising of 26 families. On the other hand, families with no children have the lowest poverty rate of 4.9%, which includes 420 families.
| Children | Above Poverty | Below Poverty |
| No Children | 8,134 (95.1%) | 420 (4.9%) |
| 1 or 2 Children | 4,283 (92.0%) | 373 (8.0%) |
| 3 or 4 Children | 1,106 (85.5%) | 187 (14.5%) |
| 5 or more Children | 96 (78.7%) | 26 (21.3%) |
| Total | 13,619 (93.1%) | 1,006 (6.9%) |
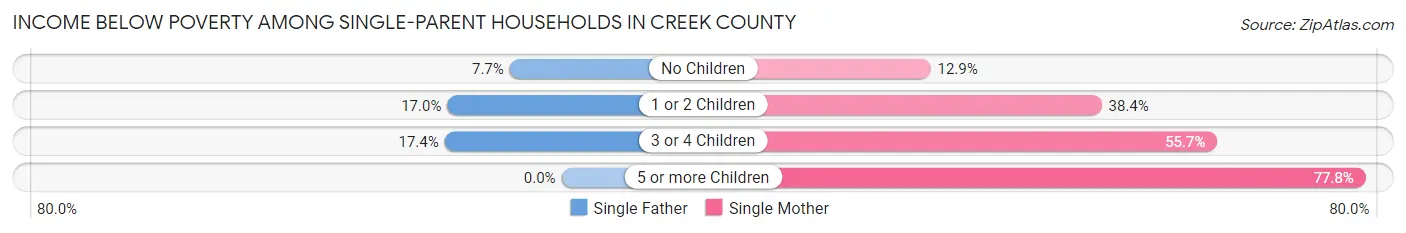
Income Below Poverty Among Single-Parent Households in Creek County
According to the poverty data in Creek County, 13.6% or 208 single-father households and 31.3% or 934 single-mother households are living below the poverty line. Among single-father households, those with 3 or 4 children have the highest poverty rate, with 19 households (17.4%) experiencing poverty. Likewise, among single-mother households, those with 5 or more children have the highest poverty rate, with 28 households (77.8%) falling below the poverty line.
| Children | Single Father | Single Mother |
| No Children | 43 (7.7%) | 144 (12.9%) |
| 1 or 2 Children | 146 (17.0%) | 580 (38.4%) |
| 3 or 4 Children | 19 (17.4%) | 182 (55.7%) |
| 5 or more Children | 0 (0.0%) | 28 (77.8%) |
| Total | 208 (13.6%) | 934 (31.3%) |
Income Below Poverty Among Married-Couple vs Single-Parent Households in Creek County
The poverty data for Creek County shows that 1,006 of the married-couple family households (6.9%) and 1,142 of the single-parent households (25.3%) are living below the poverty level. Within the married-couple family households, those with 5 or more children have the highest poverty rate, with 26 households (21.3%) falling below the poverty line. Among the single-parent households, those with 5 or more children have the highest poverty rate, with 28 household (63.6%) living below poverty.
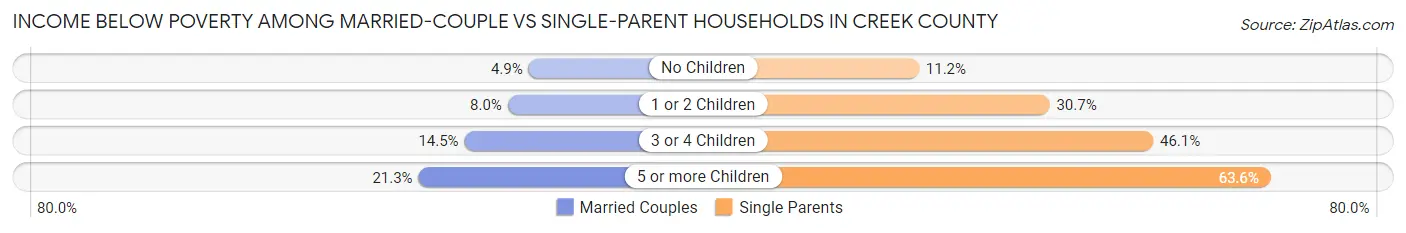
| Children | Married-Couple Families | Single-Parent Households |
| No Children | 420 (4.9%) | 187 (11.2%) |
| 1 or 2 Children | 373 (8.0%) | 726 (30.7%) |
| 3 or 4 Children | 187 (14.5%) | 201 (46.1%) |
| 5 or more Children | 26 (21.3%) | 28 (63.6%) |
| Total | 1,006 (6.9%) | 1,142 (25.3%) |
Employment Characteristics in Creek County
Employment by Class of Employer in Creek County
Among the 30,846 employed individuals in Creek County, private company employees (22,512 | 73.0%), local government employees (1,924 | 6.2%), and self-employed (not incorporated) (1,741 | 5.6%) make up the most common classes of employment.
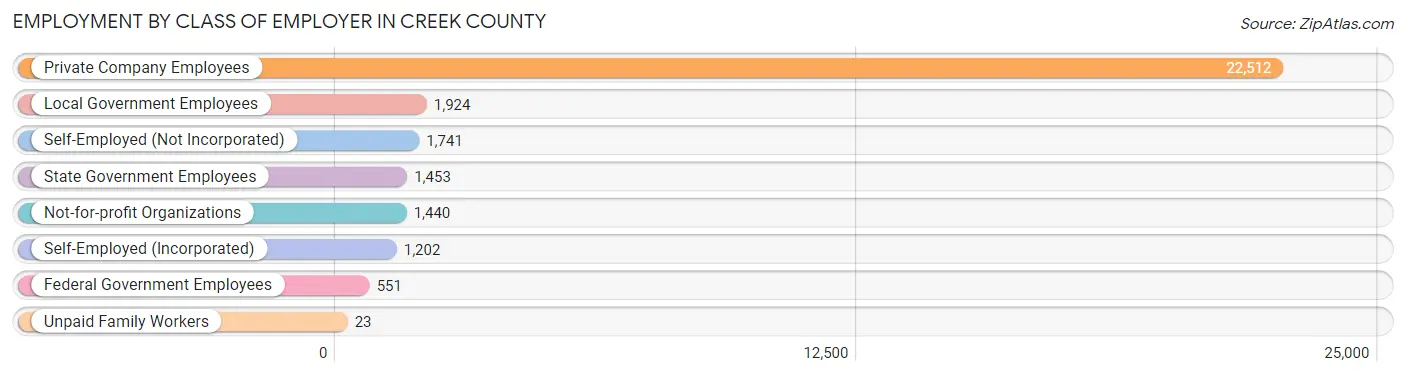
| Employer Class | # Employees | % Employees |
| Private Company Employees | 22,512 | 73.0% |
| Self-Employed (Incorporated) | 1,202 | 3.9% |
| Self-Employed (Not Incorporated) | 1,741 | 5.6% |
| Not-for-profit Organizations | 1,440 | 4.7% |
| Local Government Employees | 1,924 | 6.2% |
| State Government Employees | 1,453 | 4.7% |
| Federal Government Employees | 551 | 1.8% |
| Unpaid Family Workers | 23 | 0.1% |
| Total | 30,846 | 100.0% |
Employment Status by Age in Creek County
According to the labor force statistics for Creek County, out of the total population over 16 years of age (57,220), 56.7% or 32,444 individuals are in the labor force, with 3.7% or 1,200 of them unemployed. The age group with the highest labor force participation rate is 35 to 44 years, with 78.9% or 6,886 individuals in the labor force. Within the labor force, the 16 to 19 years age range has the highest percentage of unemployed individuals, with 9.9% or 105 of them being unemployed.
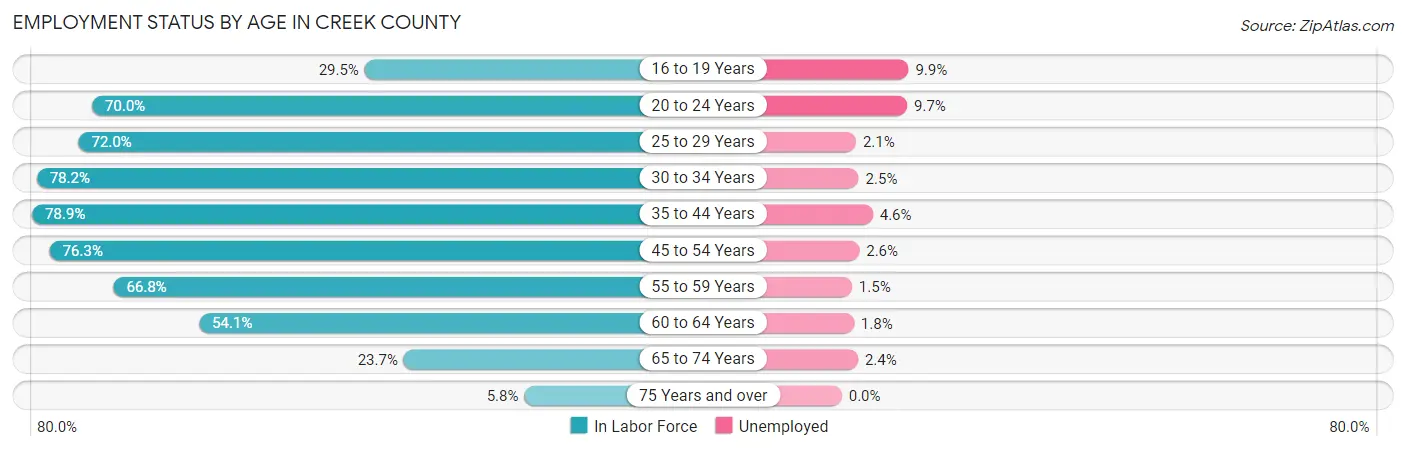
| Age Bracket | In Labor Force | Unemployed |
| 16 to 19 Years | 1,061 (29.5%) | 105 (9.9%) |
| 20 to 24 Years | 3,006 (70.0%) | 292 (9.7%) |
| 25 to 29 Years | 3,164 (72.0%) | 66 (2.1%) |
| 30 to 34 Years | 3,357 (78.2%) | 84 (2.5%) |
| 35 to 44 Years | 6,886 (78.9%) | 317 (4.6%) |
| 45 to 54 Years | 6,832 (76.3%) | 178 (2.6%) |
| 55 to 59 Years | 3,297 (66.8%) | 49 (1.5%) |
| 60 to 64 Years | 2,711 (54.1%) | 49 (1.8%) |
| 65 to 74 Years | 1,802 (23.7%) | 43 (2.4%) |
| 75 Years and over | 314 (5.8%) | 0 (0.0%) |
| Total | 32,444 (56.7%) | 1,200 (3.7%) |
Employment Status by Educational Attainment in Creek County
According to labor force statistics for Creek County, 72.3% of individuals (26,256) out of the total population between 25 and 64 years of age (36,315) are in the labor force, with 2.8% or 735 of them being unemployed. The group with the highest labor force participation rate are those with the educational attainment of bachelor's degree or higher, with 85.5% or 5,781 individuals in the labor force. Within the labor force, individuals with less than high school education have the highest percentage of unemployment, with 7.3% or 134 of them being unemployed.
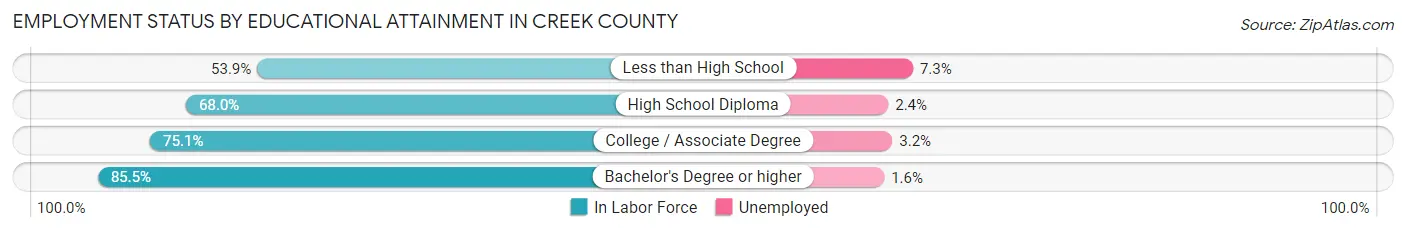
| Educational Attainment | In Labor Force | Unemployed |
| Less than High School | 1,830 (53.9%) | 248 (7.3%) |
| High School Diploma | 9,663 (68.0%) | 341 (2.4%) |
| College / Associate Degree | 8,974 (75.1%) | 382 (3.2%) |
| Bachelor's Degree or higher | 5,781 (85.5%) | 108 (1.6%) |
| Total | 26,256 (72.3%) | 1,017 (2.8%) |
Employment Occupations by Sex in Creek County
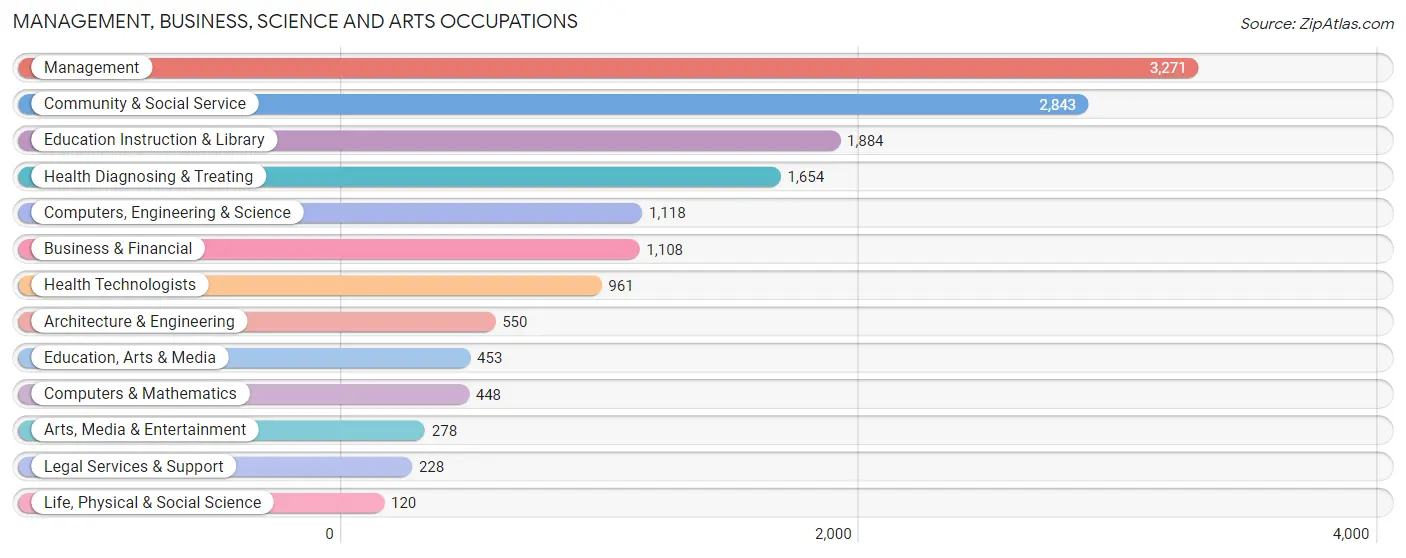
Management, Business, Science and Arts Occupations
The most common Management, Business, Science and Arts occupations in Creek County are Management (3,271 | 10.5%), Community & Social Service (2,843 | 9.1%), Education Instruction & Library (1,884 | 6.0%), Health Diagnosing & Treating (1,654 | 5.3%), and Computers, Engineering & Science (1,118 | 3.6%).
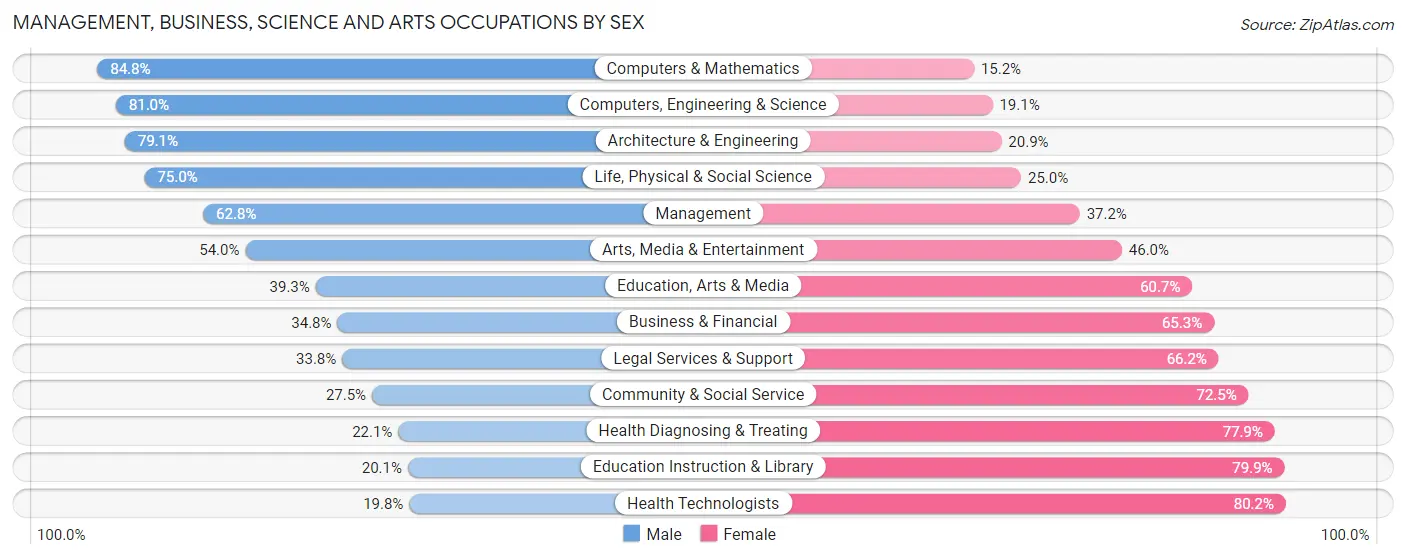
Management, Business, Science and Arts Occupations by Sex
Within the Management, Business, Science and Arts occupations in Creek County, the most male-oriented occupations are Computers & Mathematics (84.8%), Computers, Engineering & Science (80.9%), and Architecture & Engineering (79.1%), while the most female-oriented occupations are Health Technologists (80.2%), Education Instruction & Library (79.9%), and Health Diagnosing & Treating (77.9%).
| Occupation | Male | Female |
| Management | 2,053 (62.8%) | 1,218 (37.2%) |
| Business & Financial | 385 (34.7%) | 723 (65.2%) |
| Computers, Engineering & Science | 905 (80.9%) | 213 (19.1%) |
| Computers & Mathematics | 380 (84.8%) | 68 (15.2%) |
| Architecture & Engineering | 435 (79.1%) | 115 (20.9%) |
| Life, Physical & Social Science | 90 (75.0%) | 30 (25.0%) |
| Community & Social Service | 783 (27.5%) | 2,060 (72.5%) |
| Education, Arts & Media | 178 (39.3%) | 275 (60.7%) |
| Legal Services & Support | 77 (33.8%) | 151 (66.2%) |
| Education Instruction & Library | 378 (20.1%) | 1,506 (79.9%) |
| Arts, Media & Entertainment | 150 (54.0%) | 128 (46.0%) |
| Health Diagnosing & Treating | 365 (22.1%) | 1,289 (77.9%) |
| Health Technologists | 190 (19.8%) | 771 (80.2%) |
| Total (Category) | 4,491 (44.9%) | 5,503 (55.1%) |
| Total (Overall) | 17,314 (55.5%) | 13,888 (44.5%) |
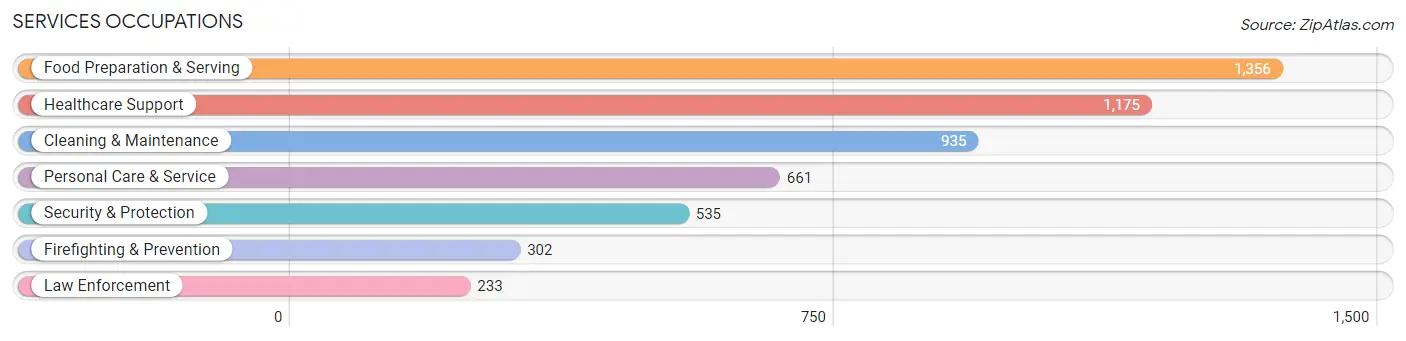
Services Occupations
The most common Services occupations in Creek County are Food Preparation & Serving (1,356 | 4.3%), Healthcare Support (1,175 | 3.8%), Cleaning & Maintenance (935 | 3.0%), Personal Care & Service (661 | 2.1%), and Security & Protection (535 | 1.7%).
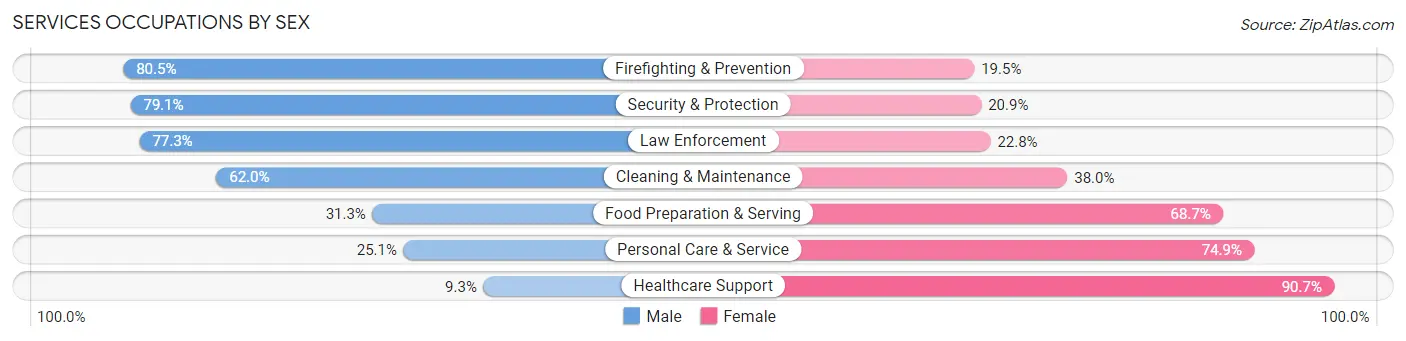
Services Occupations by Sex
Within the Services occupations in Creek County, the most male-oriented occupations are Firefighting & Prevention (80.5%), Security & Protection (79.1%), and Law Enforcement (77.2%), while the most female-oriented occupations are Healthcare Support (90.7%), Personal Care & Service (74.9%), and Food Preparation & Serving (68.7%).
| Occupation | Male | Female |
| Healthcare Support | 109 (9.3%) | 1,066 (90.7%) |
| Security & Protection | 423 (79.1%) | 112 (20.9%) |
| Firefighting & Prevention | 243 (80.5%) | 59 (19.5%) |
| Law Enforcement | 180 (77.2%) | 53 (22.8%) |
| Food Preparation & Serving | 424 (31.3%) | 932 (68.7%) |
| Cleaning & Maintenance | 580 (62.0%) | 355 (38.0%) |
| Personal Care & Service | 166 (25.1%) | 495 (74.9%) |
| Total (Category) | 1,702 (36.5%) | 2,960 (63.5%) |
| Total (Overall) | 17,314 (55.5%) | 13,888 (44.5%) |
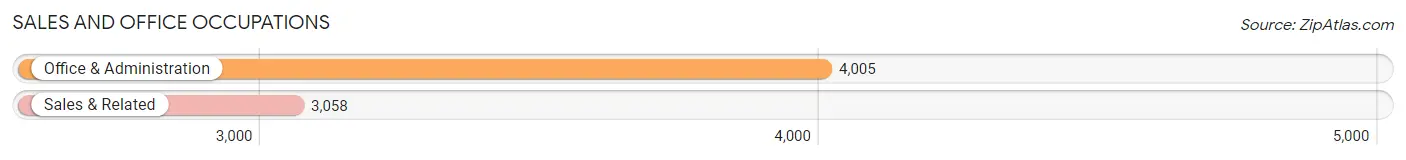
Sales and Office Occupations
The most common Sales and Office occupations in Creek County are Office & Administration (4,005 | 12.8%), and Sales & Related (3,058 | 9.8%).
Sales and Office Occupations by Sex
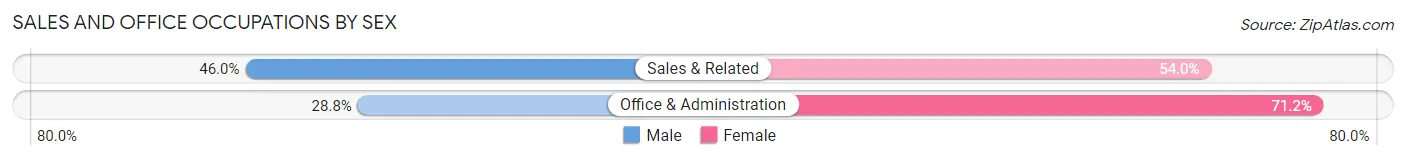
| Occupation | Male | Female |
| Sales & Related | 1,408 (46.0%) | 1,650 (54.0%) |
| Office & Administration | 1,152 (28.8%) | 2,853 (71.2%) |
| Total (Category) | 2,560 (36.2%) | 4,503 (63.7%) |
| Total (Overall) | 17,314 (55.5%) | 13,888 (44.5%) |
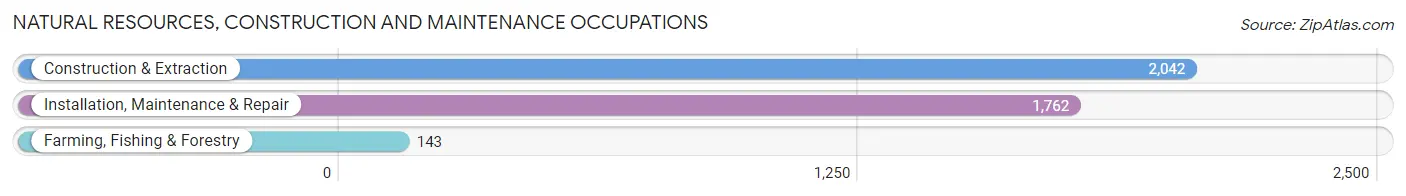
Natural Resources, Construction and Maintenance Occupations
The most common Natural Resources, Construction and Maintenance occupations in Creek County are Construction & Extraction (2,042 | 6.5%), Installation, Maintenance & Repair (1,762 | 5.7%), and Farming, Fishing & Forestry (143 | 0.5%).
Natural Resources, Construction and Maintenance Occupations by Sex
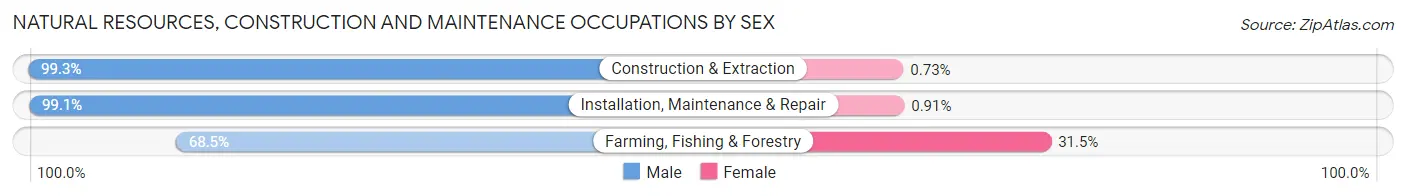
| Occupation | Male | Female |
| Farming, Fishing & Forestry | 98 (68.5%) | 45 (31.5%) |
| Construction & Extraction | 2,027 (99.3%) | 15 (0.7%) |
| Installation, Maintenance & Repair | 1,746 (99.1%) | 16 (0.9%) |
| Total (Category) | 3,871 (98.1%) | 76 (1.9%) |
| Total (Overall) | 17,314 (55.5%) | 13,888 (44.5%) |
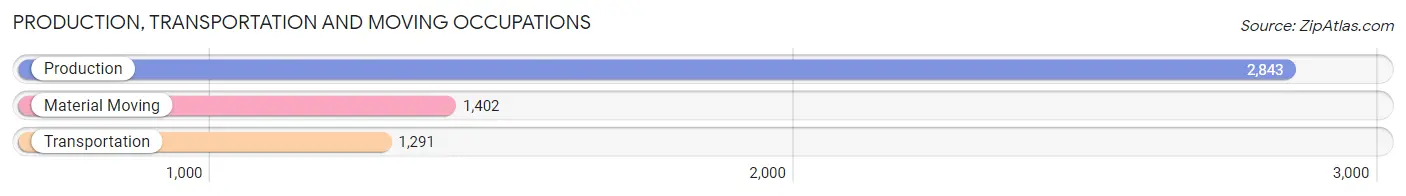
Production, Transportation and Moving Occupations
The most common Production, Transportation and Moving occupations in Creek County are Production (2,843 | 9.1%), Material Moving (1,402 | 4.5%), and Transportation (1,291 | 4.1%).
Production, Transportation and Moving Occupations by Sex
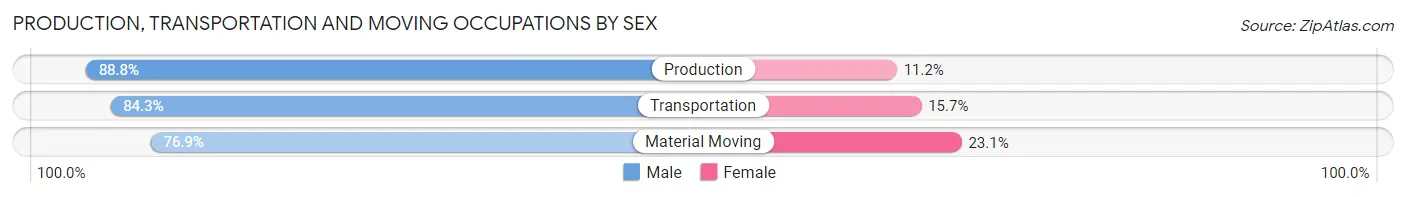
| Occupation | Male | Female |
| Production | 2,524 (88.8%) | 319 (11.2%) |
| Transportation | 1,088 (84.3%) | 203 (15.7%) |
| Material Moving | 1,078 (76.9%) | 324 (23.1%) |
| Total (Category) | 4,690 (84.7%) | 846 (15.3%) |
| Total (Overall) | 17,314 (55.5%) | 13,888 (44.5%) |
Employment Industries by Sex in Creek County
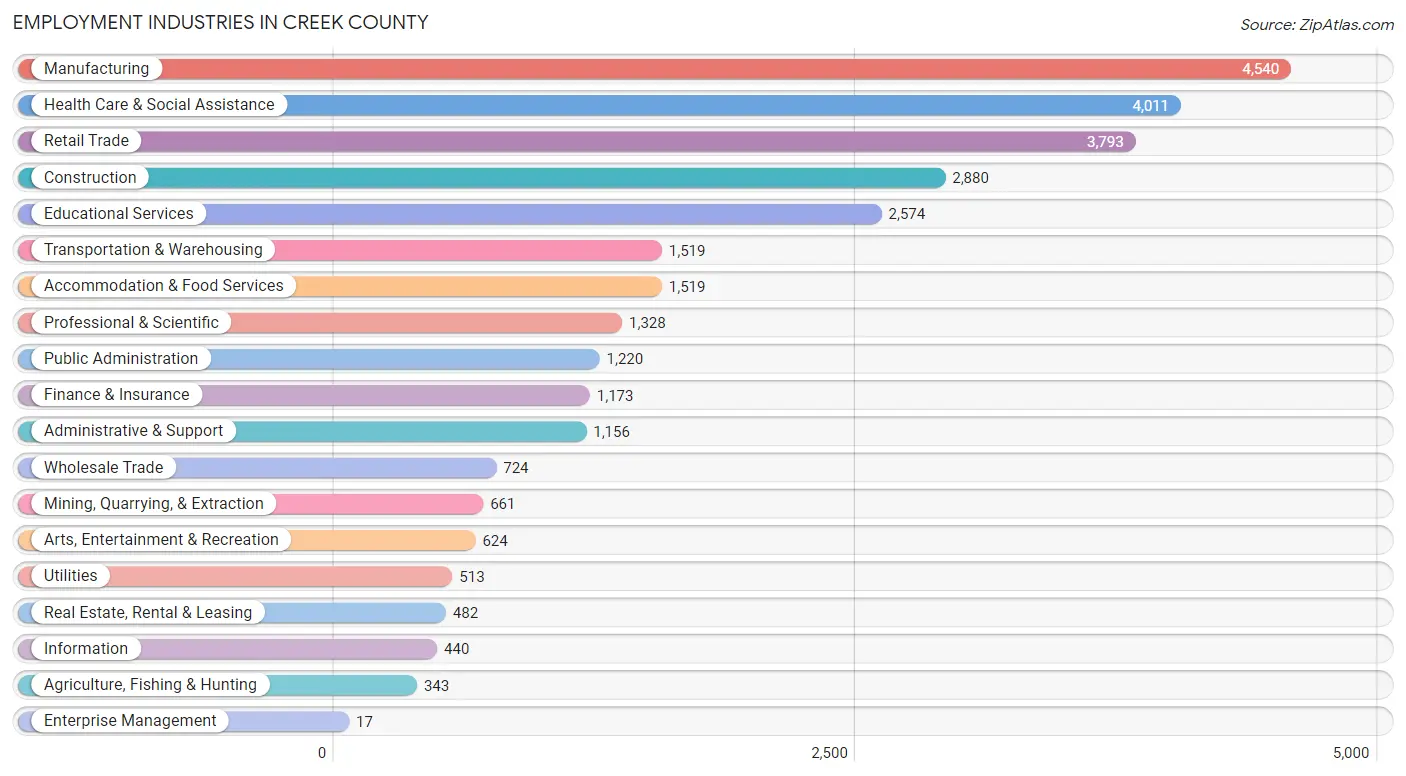
Employment Industries in Creek County
The major employment industries in Creek County include Manufacturing (4,540 | 14.5%), Health Care & Social Assistance (4,011 | 12.9%), Retail Trade (3,793 | 12.2%), Construction (2,880 | 9.2%), and Educational Services (2,574 | 8.3%).
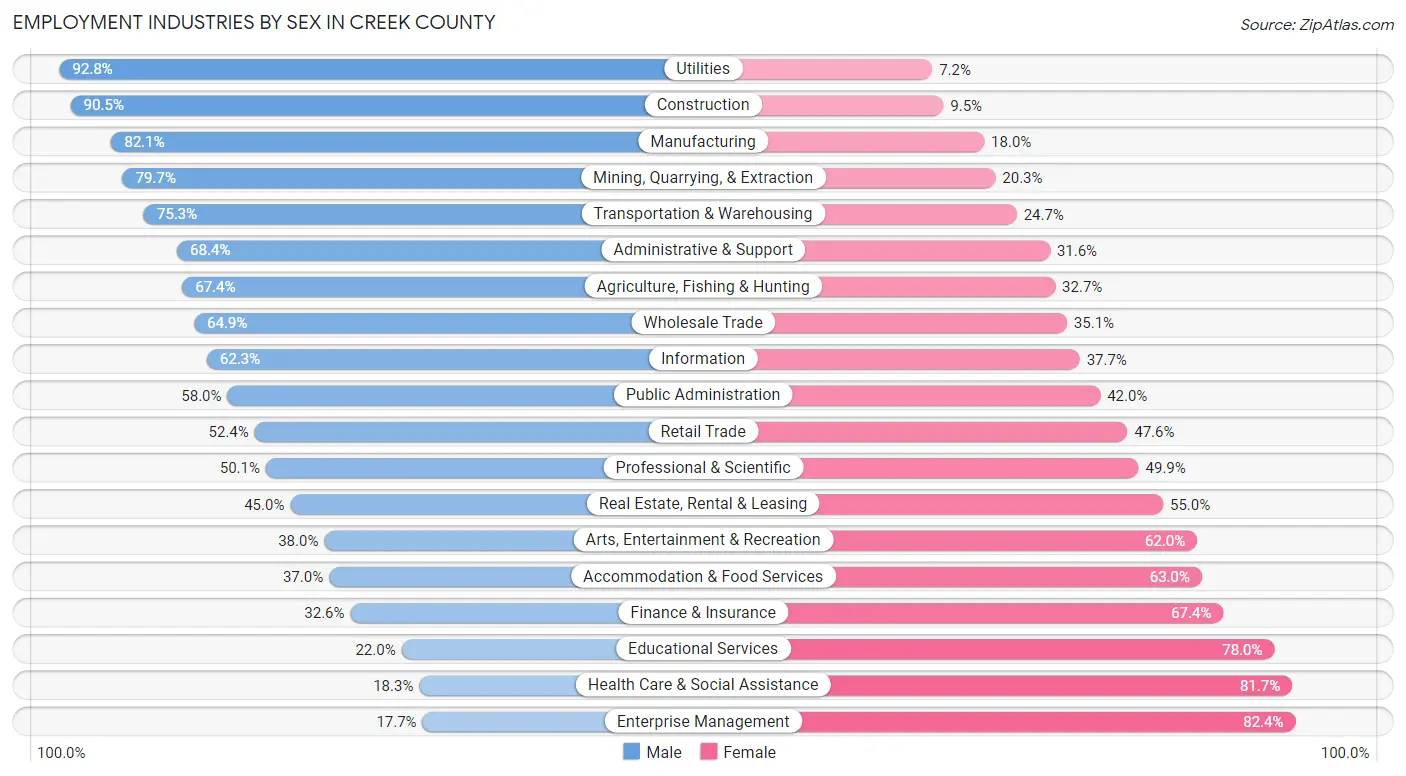
Employment Industries by Sex in Creek County
The Creek County industries that see more men than women are Utilities (92.8%), Construction (90.5%), and Manufacturing (82.1%), whereas the industries that tend to have a higher number of women are Enterprise Management (82.4%), Health Care & Social Assistance (81.7%), and Educational Services (78.0%).
| Industry | Male | Female |
| Agriculture, Fishing & Hunting | 231 (67.3%) | 112 (32.7%) |
| Mining, Quarrying, & Extraction | 527 (79.7%) | 134 (20.3%) |
| Construction | 2,606 (90.5%) | 274 (9.5%) |
| Manufacturing | 3,725 (82.1%) | 815 (17.9%) |
| Wholesale Trade | 470 (64.9%) | 254 (35.1%) |
| Retail Trade | 1,988 (52.4%) | 1,805 (47.6%) |
| Transportation & Warehousing | 1,144 (75.3%) | 375 (24.7%) |
| Utilities | 476 (92.8%) | 37 (7.2%) |
| Information | 274 (62.3%) | 166 (37.7%) |
| Finance & Insurance | 382 (32.6%) | 791 (67.4%) |
| Real Estate, Rental & Leasing | 217 (45.0%) | 265 (55.0%) |
| Professional & Scientific | 665 (50.1%) | 663 (49.9%) |
| Enterprise Management | 3 (17.6%) | 14 (82.4%) |
| Administrative & Support | 791 (68.4%) | 365 (31.6%) |
| Educational Services | 566 (22.0%) | 2,008 (78.0%) |
| Health Care & Social Assistance | 735 (18.3%) | 3,276 (81.7%) |
| Arts, Entertainment & Recreation | 237 (38.0%) | 387 (62.0%) |
| Accommodation & Food Services | 562 (37.0%) | 957 (63.0%) |
| Public Administration | 708 (58.0%) | 512 (42.0%) |
| Total | 17,314 (55.5%) | 13,888 (44.5%) |
Education in Creek County
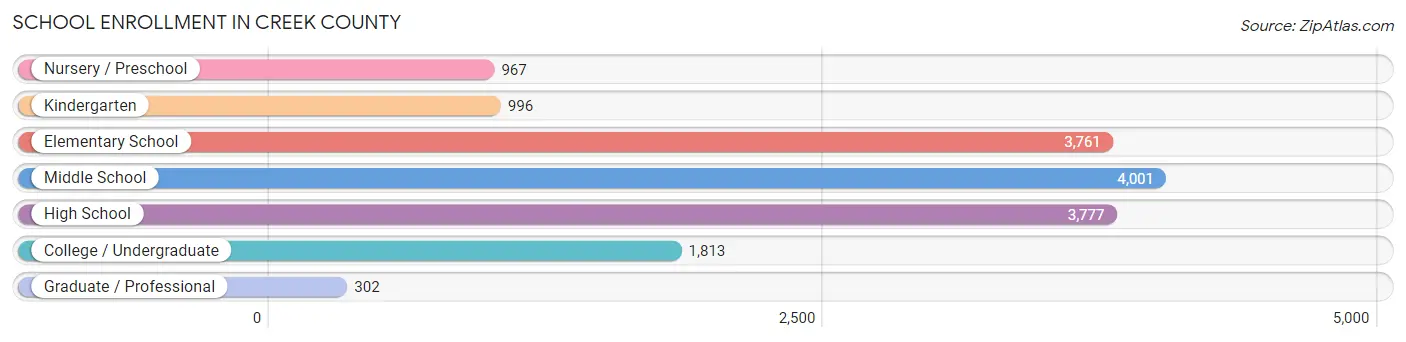
School Enrollment in Creek County
The most common levels of schooling among the 15,617 students in Creek County are middle school (4,001 | 25.6%), high school (3,777 | 24.2%), and elementary school (3,761 | 24.1%).
| School Level | # Students | % Students |
| Nursery / Preschool | 967 | 6.2% |
| Kindergarten | 996 | 6.4% |
| Elementary School | 3,761 | 24.1% |
| Middle School | 4,001 | 25.6% |
| High School | 3,777 | 24.2% |
| College / Undergraduate | 1,813 | 11.6% |
| Graduate / Professional | 302 | 1.9% |
| Total | 15,617 | 100.0% |
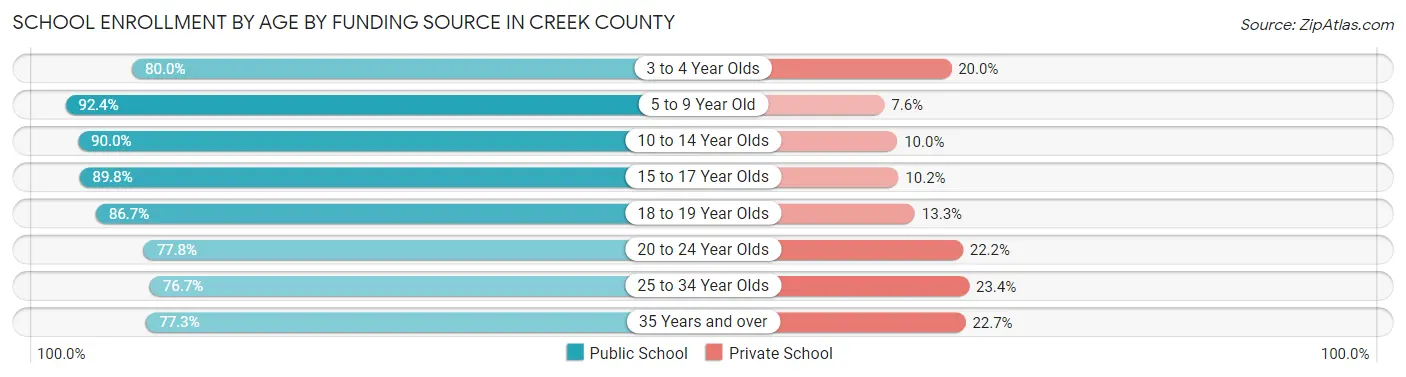
School Enrollment by Age by Funding Source in Creek County
Out of a total of 15,617 students who are enrolled in schools in Creek County, 1,780 (11.4%) attend a private institution, while the remaining 13,837 (88.6%) are enrolled in public schools. The age group of 25 to 34 year olds has the highest likelihood of being enrolled in private schools, with 113 (23.4% in the age bracket) enrolled. Conversely, the age group of 5 to 9 year old has the lowest likelihood of being enrolled in a private school, with 4,022 (92.4% in the age bracket) attending a public institution.
| Age Bracket | Public School | Private School |
| 3 to 4 Year Olds | 575 (80.0%) | 144 (20.0%) |
| 5 to 9 Year Old | 4,022 (92.4%) | 330 (7.6%) |
| 10 to 14 Year Olds | 4,464 (90.0%) | 495 (10.0%) |
| 15 to 17 Year Olds | 2,563 (89.8%) | 291 (10.2%) |
| 18 to 19 Year Olds | 882 (86.7%) | 135 (13.3%) |
| 20 to 24 Year Olds | 547 (77.8%) | 156 (22.2%) |
| 25 to 34 Year Olds | 371 (76.6%) | 113 (23.4%) |
| 35 Years and over | 409 (77.3%) | 120 (22.7%) |
| Total | 13,837 (88.6%) | 1,780 (11.4%) |
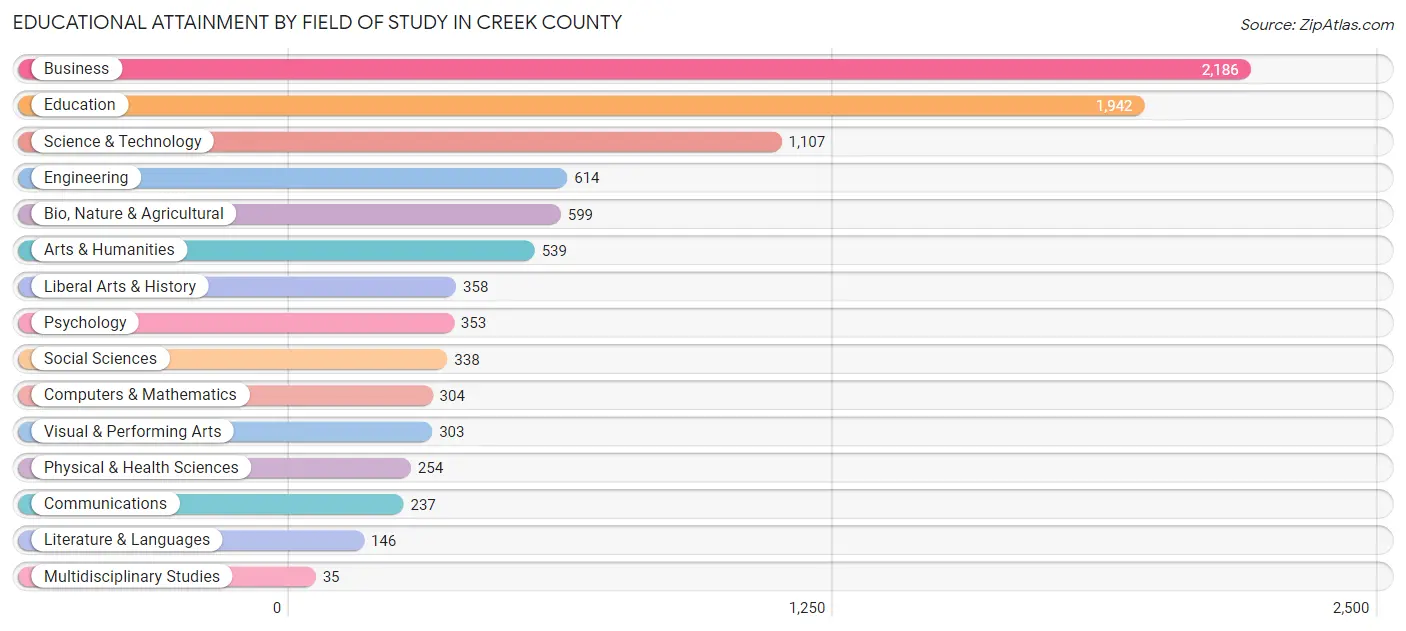
Educational Attainment by Field of Study in Creek County
Business (2,186 | 23.5%), education (1,942 | 20.8%), science & technology (1,107 | 11.9%), engineering (614 | 6.6%), and bio, nature & agricultural (599 | 6.4%) are the most common fields of study among 9,315 individuals in Creek County who have obtained a bachelor's degree or higher.
| Field of Study | # Graduates | % Graduates |
| Computers & Mathematics | 304 | 3.3% |
| Bio, Nature & Agricultural | 599 | 6.4% |
| Physical & Health Sciences | 254 | 2.7% |
| Psychology | 353 | 3.8% |
| Social Sciences | 338 | 3.6% |
| Engineering | 614 | 6.6% |
| Multidisciplinary Studies | 35 | 0.4% |
| Science & Technology | 1,107 | 11.9% |
| Business | 2,186 | 23.5% |
| Education | 1,942 | 20.8% |
| Literature & Languages | 146 | 1.6% |
| Liberal Arts & History | 358 | 3.8% |
| Visual & Performing Arts | 303 | 3.3% |
| Communications | 237 | 2.5% |
| Arts & Humanities | 539 | 5.8% |
| Total | 9,315 | 100.0% |
Transportation & Commute in Creek County
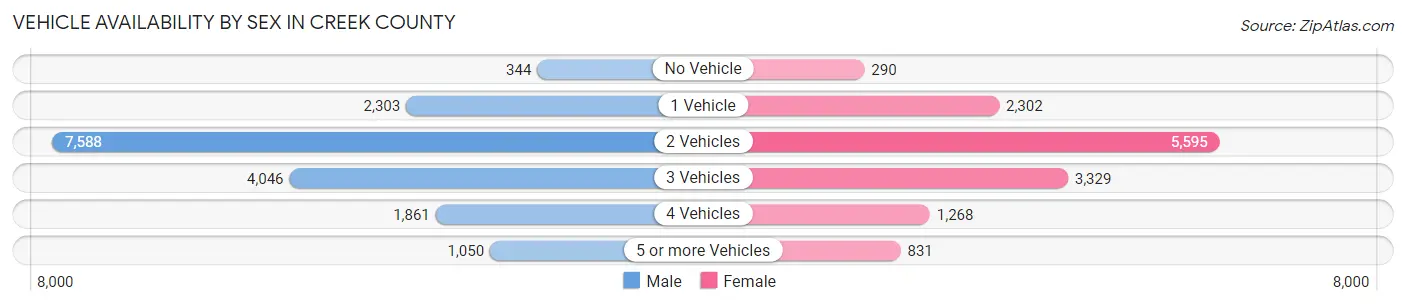
Vehicle Availability by Sex in Creek County
The most prevalent vehicle ownership categories in Creek County are males with 2 vehicles (7,588, accounting for 44.1%) and females with 2 vehicles (5,595, making up 55.7%).
| Vehicles Available | Male | Female |
| No Vehicle | 344 (2.0%) | 290 (2.1%) |
| 1 Vehicle | 2,303 (13.4%) | 2,302 (16.9%) |
| 2 Vehicles | 7,588 (44.1%) | 5,595 (41.1%) |
| 3 Vehicles | 4,046 (23.5%) | 3,329 (24.4%) |
| 4 Vehicles | 1,861 (10.8%) | 1,268 (9.3%) |
| 5 or more Vehicles | 1,050 (6.1%) | 831 (6.1%) |
| Total | 17,192 (100.0%) | 13,615 (100.0%) |
Commute Time in Creek County
The most frequently occuring commute durations in Creek County are 30 to 34 minutes (6,252 commuters, 22.0%), 20 to 24 minutes (4,308 commuters, 15.1%), and 10 to 14 minutes (3,240 commuters, 11.4%).
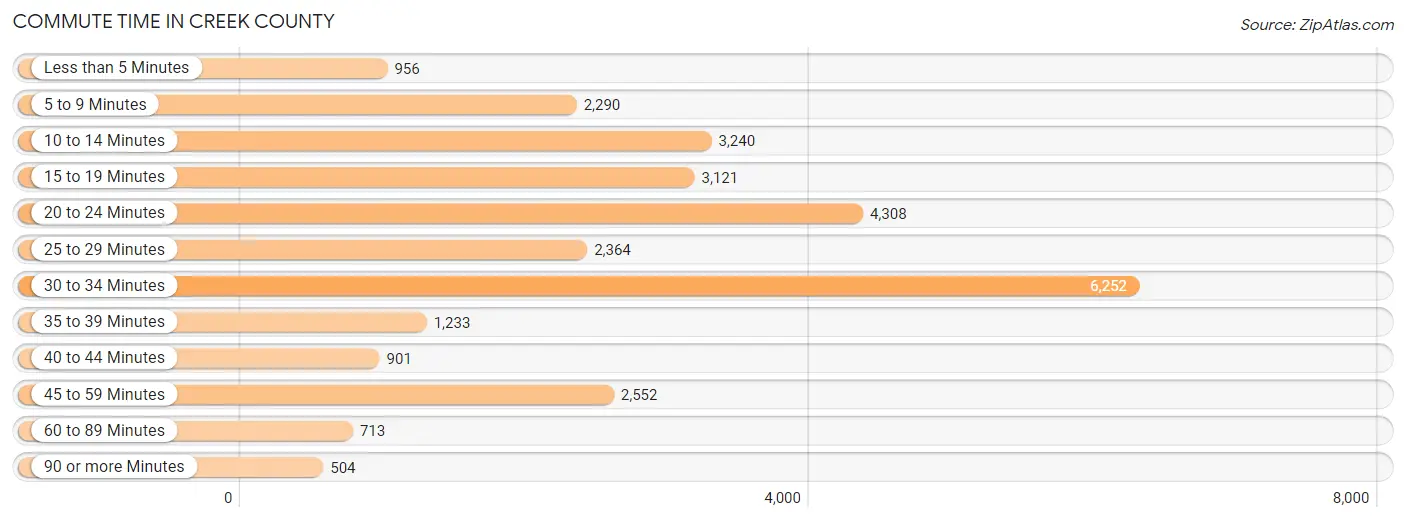
| Commute Time | # Commuters | % Commuters |
| Less than 5 Minutes | 956 | 3.4% |
| 5 to 9 Minutes | 2,290 | 8.1% |
| 10 to 14 Minutes | 3,240 | 11.4% |
| 15 to 19 Minutes | 3,121 | 11.0% |
| 20 to 24 Minutes | 4,308 | 15.1% |
| 25 to 29 Minutes | 2,364 | 8.3% |
| 30 to 34 Minutes | 6,252 | 22.0% |
| 35 to 39 Minutes | 1,233 | 4.3% |
| 40 to 44 Minutes | 901 | 3.2% |
| 45 to 59 Minutes | 2,552 | 9.0% |
| 60 to 89 Minutes | 713 | 2.5% |
| 90 or more Minutes | 504 | 1.8% |
Commute Time by Sex in Creek County
The most common commute times in Creek County are 30 to 34 minutes (3,581 commuters, 22.4%) for males and 30 to 34 minutes (2,671 commuters, 21.4%) for females.
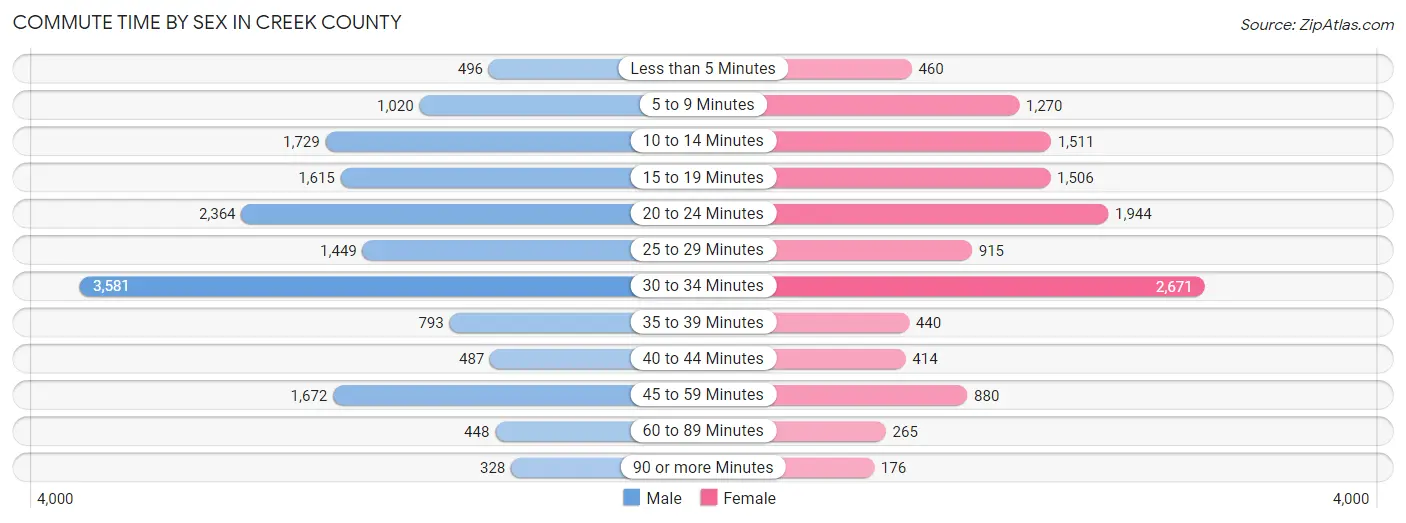
| Commute Time | Male | Female |
| Less than 5 Minutes | 496 (3.1%) | 460 (3.7%) |
| 5 to 9 Minutes | 1,020 (6.4%) | 1,270 (10.2%) |
| 10 to 14 Minutes | 1,729 (10.8%) | 1,511 (12.1%) |
| 15 to 19 Minutes | 1,615 (10.1%) | 1,506 (12.1%) |
| 20 to 24 Minutes | 2,364 (14.8%) | 1,944 (15.6%) |
| 25 to 29 Minutes | 1,449 (9.1%) | 915 (7.3%) |
| 30 to 34 Minutes | 3,581 (22.4%) | 2,671 (21.4%) |
| 35 to 39 Minutes | 793 (5.0%) | 440 (3.5%) |
| 40 to 44 Minutes | 487 (3.0%) | 414 (3.3%) |
| 45 to 59 Minutes | 1,672 (10.5%) | 880 (7.1%) |
| 60 to 89 Minutes | 448 (2.8%) | 265 (2.1%) |
| 90 or more Minutes | 328 (2.1%) | 176 (1.4%) |
Time of Departure to Work by Sex in Creek County
The most frequent times of departure to work in Creek County are 7:00 AM to 7:29 AM (2,260, 14.1%) for males and 7:00 AM to 7:29 AM (2,274, 18.3%) for females.
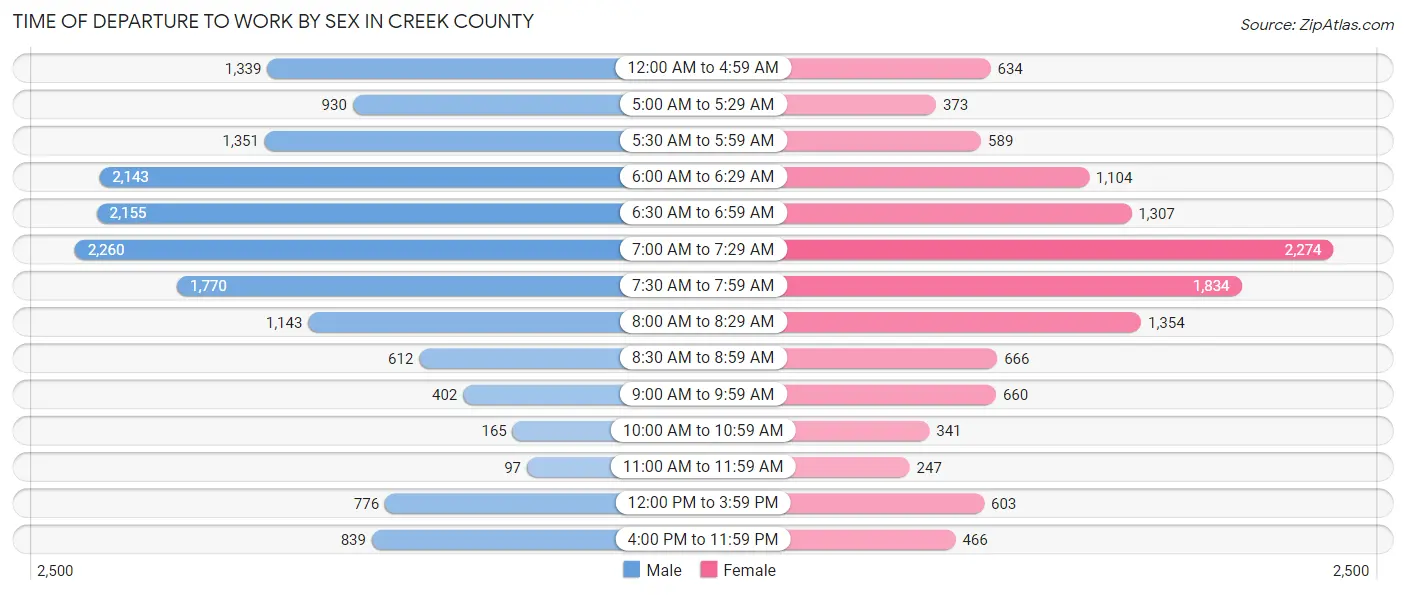
| Time of Departure | Male | Female |
| 12:00 AM to 4:59 AM | 1,339 (8.4%) | 634 (5.1%) |
| 5:00 AM to 5:29 AM | 930 (5.8%) | 373 (3.0%) |
| 5:30 AM to 5:59 AM | 1,351 (8.5%) | 589 (4.7%) |
| 6:00 AM to 6:29 AM | 2,143 (13.4%) | 1,104 (8.9%) |
| 6:30 AM to 6:59 AM | 2,155 (13.5%) | 1,307 (10.5%) |
| 7:00 AM to 7:29 AM | 2,260 (14.1%) | 2,274 (18.3%) |
| 7:30 AM to 7:59 AM | 1,770 (11.1%) | 1,834 (14.7%) |
| 8:00 AM to 8:29 AM | 1,143 (7.1%) | 1,354 (10.9%) |
| 8:30 AM to 8:59 AM | 612 (3.8%) | 666 (5.3%) |
| 9:00 AM to 9:59 AM | 402 (2.5%) | 660 (5.3%) |
| 10:00 AM to 10:59 AM | 165 (1.0%) | 341 (2.7%) |
| 11:00 AM to 11:59 AM | 97 (0.6%) | 247 (2.0%) |
| 12:00 PM to 3:59 PM | 776 (4.9%) | 603 (4.8%) |
| 4:00 PM to 11:59 PM | 839 (5.2%) | 466 (3.7%) |
| Total | 15,982 (100.0%) | 12,452 (100.0%) |
Housing Occupancy in Creek County
Occupancy by Ownership in Creek County
Of the total 27,374 dwellings in Creek County, owner-occupied units account for 20,580 (75.2%), while renter-occupied units make up 6,794 (24.8%).
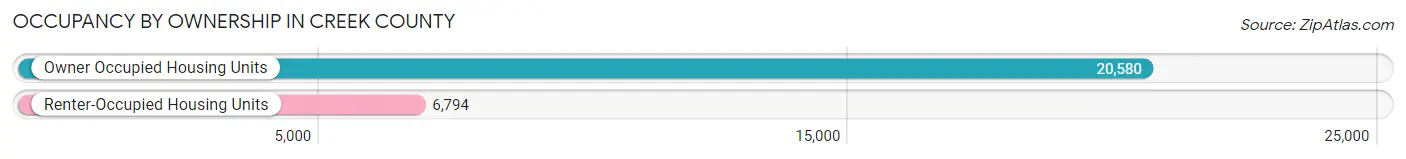
| Occupancy | # Housing Units | % Housing Units |
| Owner Occupied Housing Units | 20,580 | 75.2% |
| Renter-Occupied Housing Units | 6,794 | 24.8% |
| Total Occupied Housing Units | 27,374 | 100.0% |
Occupancy by Household Size in Creek County
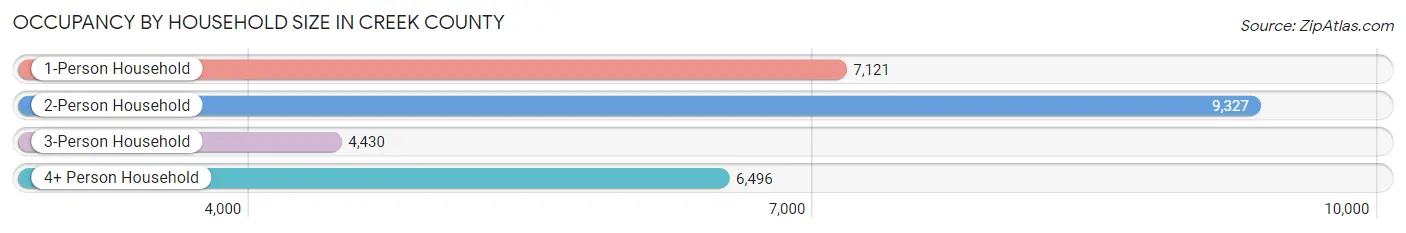
| Household Size | # Housing Units | % Housing Units |
| 1-Person Household | 7,121 | 26.0% |
| 2-Person Household | 9,327 | 34.1% |
| 3-Person Household | 4,430 | 16.2% |
| 4+ Person Household | 6,496 | 23.7% |
| Total Housing Units | 27,374 | 100.0% |
Occupancy by Ownership by Household Size in Creek County
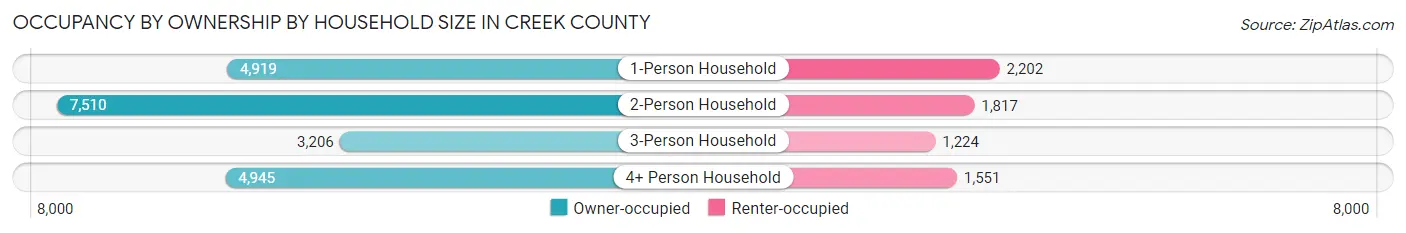
| Household Size | Owner-occupied | Renter-occupied |
| 1-Person Household | 4,919 (69.1%) | 2,202 (30.9%) |
| 2-Person Household | 7,510 (80.5%) | 1,817 (19.5%) |
| 3-Person Household | 3,206 (72.4%) | 1,224 (27.6%) |
| 4+ Person Household | 4,945 (76.1%) | 1,551 (23.9%) |
| Total Housing Units | 20,580 (75.2%) | 6,794 (24.8%) |
Occupancy by Educational Attainment in Creek County
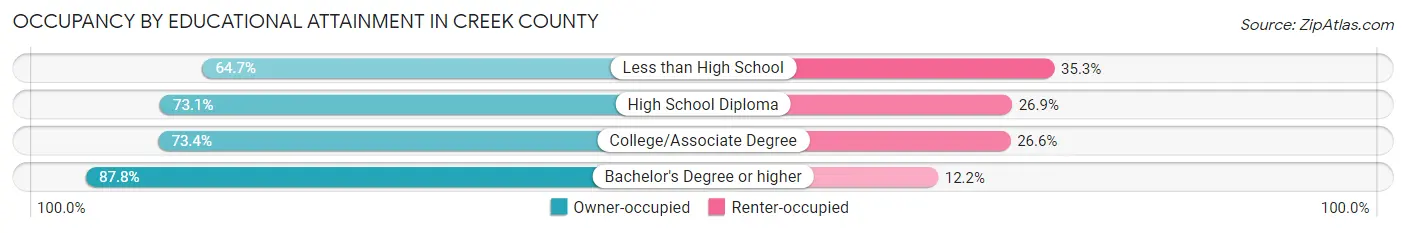
| Household Size | Owner-occupied | Renter-occupied |
| Less than High School | 1,631 (64.7%) | 889 (35.3%) |
| High School Diploma | 7,835 (73.1%) | 2,880 (26.9%) |
| College/Associate Degree | 6,641 (73.4%) | 2,403 (26.6%) |
| Bachelor's Degree or higher | 4,473 (87.8%) | 622 (12.2%) |
Occupancy by Age of Householder in Creek County
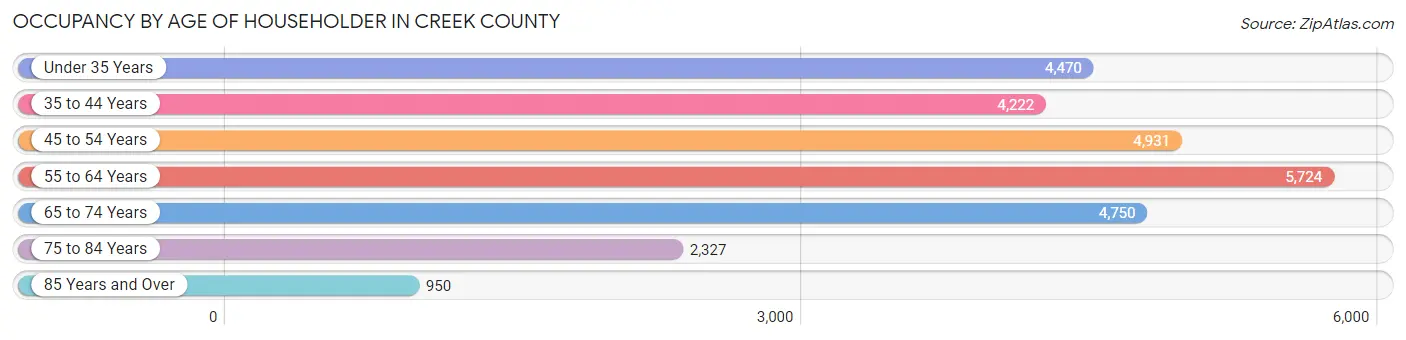
| Age Bracket | # Households | % Households |
| Under 35 Years | 4,470 | 16.3% |
| 35 to 44 Years | 4,222 | 15.4% |
| 45 to 54 Years | 4,931 | 18.0% |
| 55 to 64 Years | 5,724 | 20.9% |
| 65 to 74 Years | 4,750 | 17.3% |
| 75 to 84 Years | 2,327 | 8.5% |
| 85 Years and Over | 950 | 3.5% |
| Total | 27,374 | 100.0% |
Housing Finances in Creek County
Median Income by Occupancy in Creek County
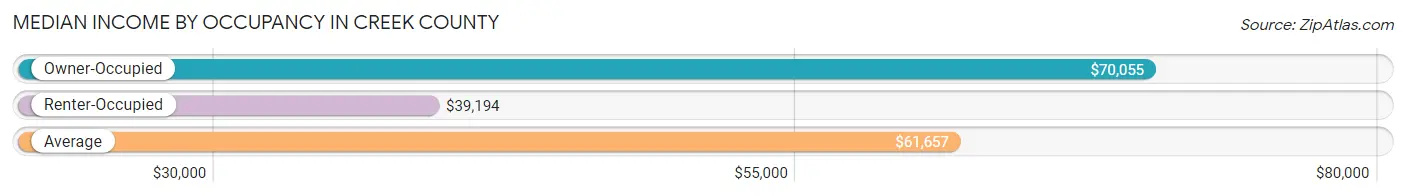
| Occupancy Type | # Households | Median Income |
| Owner-Occupied | 20,580 (75.2%) | $70,055 |
| Renter-Occupied | 6,794 (24.8%) | $39,194 |
| Average | 27,374 (100.0%) | $61,657 |
Occupancy by Householder Income Bracket in Creek County
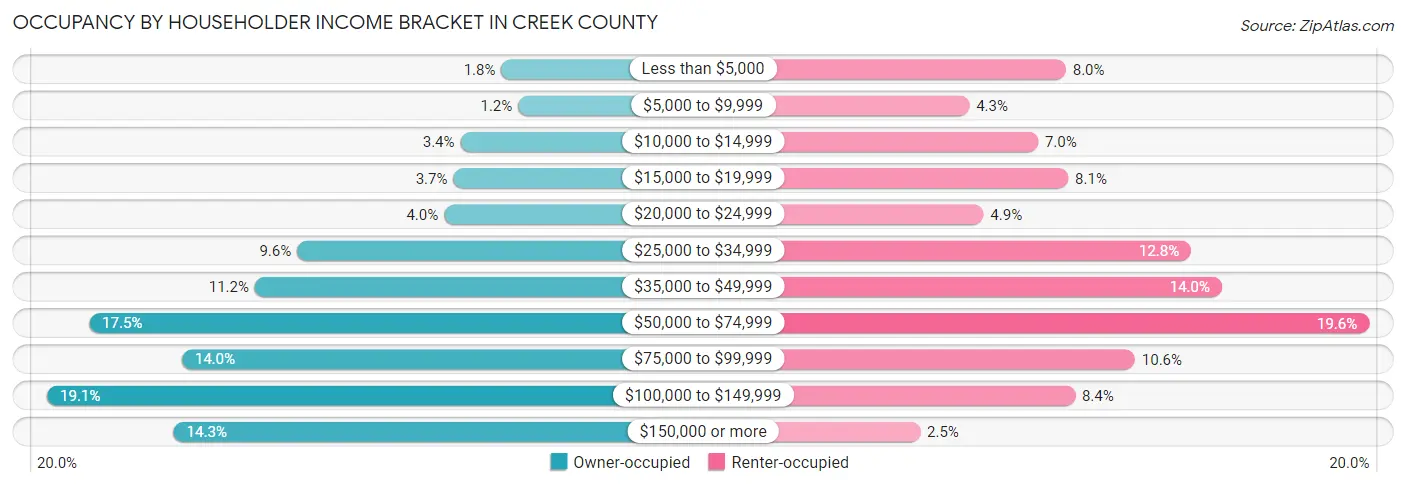
| Income Bracket | Owner-occupied | Renter-occupied |
| Less than $5,000 | 379 (1.8%) | 544 (8.0%) |
| $5,000 to $9,999 | 247 (1.2%) | 294 (4.3%) |
| $10,000 to $14,999 | 700 (3.4%) | 472 (7.0%) |
| $15,000 to $19,999 | 756 (3.7%) | 550 (8.1%) |
| $20,000 to $24,999 | 828 (4.0%) | 331 (4.9%) |
| $25,000 to $34,999 | 1,979 (9.6%) | 868 (12.8%) |
| $35,000 to $49,999 | 2,312 (11.2%) | 948 (14.0%) |
| $50,000 to $74,999 | 3,609 (17.5%) | 1,329 (19.6%) |
| $75,000 to $99,999 | 2,884 (14.0%) | 723 (10.6%) |
| $100,000 to $149,999 | 3,938 (19.1%) | 568 (8.4%) |
| $150,000 or more | 2,948 (14.3%) | 167 (2.5%) |
| Total | 20,580 (100.0%) | 6,794 (100.0%) |
Monthly Housing Cost Tiers in Creek County
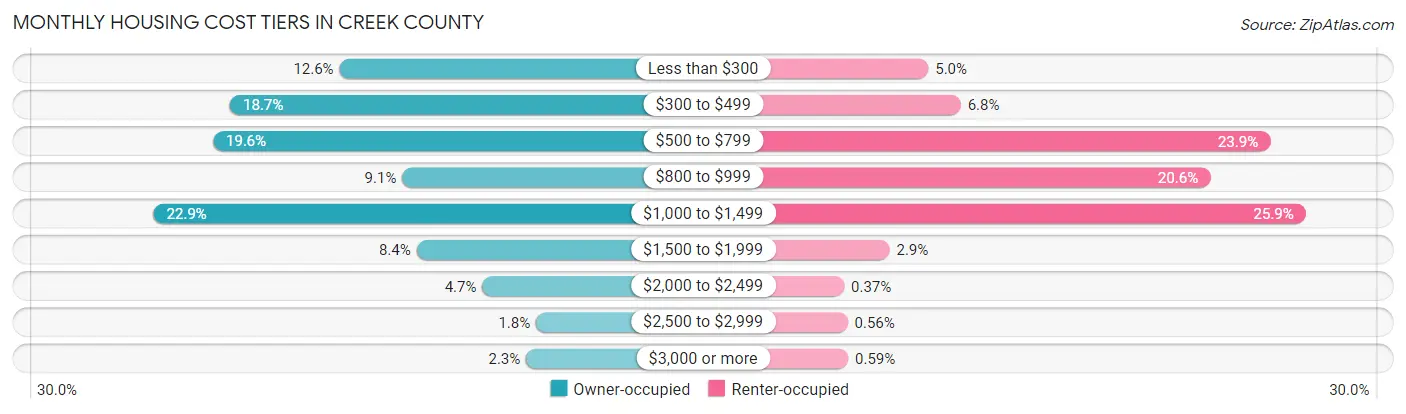
| Monthly Cost | Owner-occupied | Renter-occupied |
| Less than $300 | 2,596 (12.6%) | 341 (5.0%) |
| $300 to $499 | 3,838 (18.6%) | 463 (6.8%) |
| $500 to $799 | 4,033 (19.6%) | 1,623 (23.9%) |
| $800 to $999 | 1,880 (9.1%) | 1,398 (20.6%) |
| $1,000 to $1,499 | 4,709 (22.9%) | 1,757 (25.9%) |
| $1,500 to $1,999 | 1,718 (8.4%) | 196 (2.9%) |
| $2,000 to $2,499 | 972 (4.7%) | 25 (0.4%) |
| $2,500 to $2,999 | 361 (1.8%) | 38 (0.6%) |
| $3,000 or more | 473 (2.3%) | 40 (0.6%) |
| Total | 20,580 (100.0%) | 6,794 (100.0%) |
Physical Housing Characteristics in Creek County
Housing Structures in Creek County
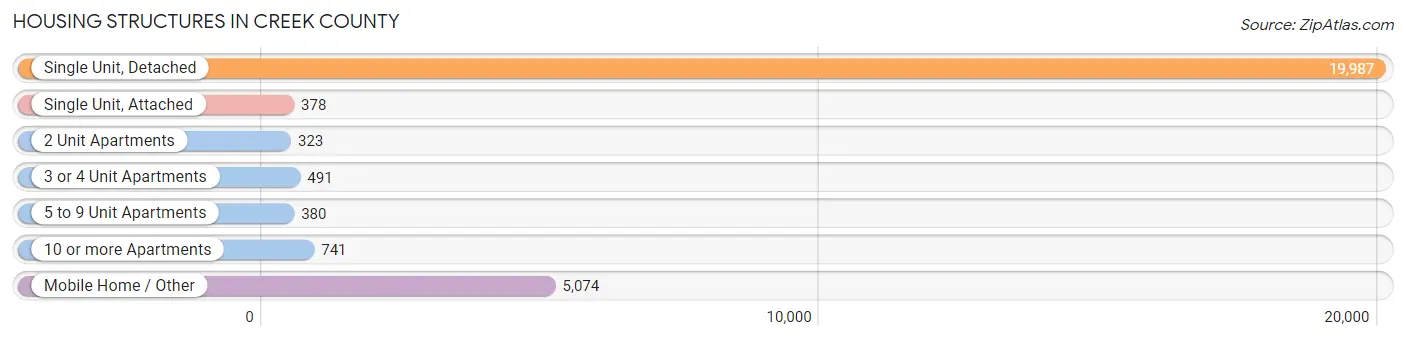
| Structure Type | # Housing Units | % Housing Units |
| Single Unit, Detached | 19,987 | 73.0% |
| Single Unit, Attached | 378 | 1.4% |
| 2 Unit Apartments | 323 | 1.2% |
| 3 or 4 Unit Apartments | 491 | 1.8% |
| 5 to 9 Unit Apartments | 380 | 1.4% |
| 10 or more Apartments | 741 | 2.7% |
| Mobile Home / Other | 5,074 | 18.5% |
| Total | 27,374 | 100.0% |
Housing Structures by Occupancy in Creek County
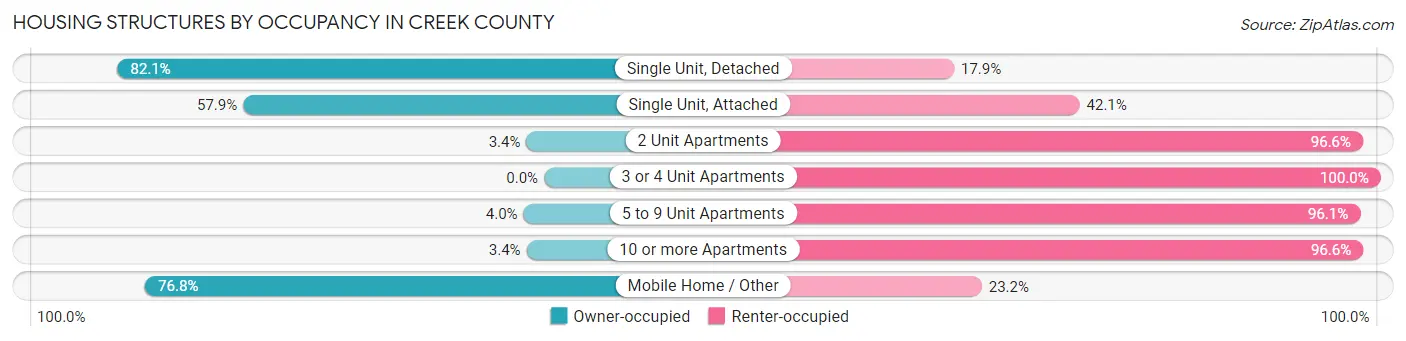
| Structure Type | Owner-occupied | Renter-occupied |
| Single Unit, Detached | 16,414 (82.1%) | 3,573 (17.9%) |
| Single Unit, Attached | 219 (57.9%) | 159 (42.1%) |
| 2 Unit Apartments | 11 (3.4%) | 312 (96.6%) |
| 3 or 4 Unit Apartments | 0 (0.0%) | 491 (100.0%) |
| 5 to 9 Unit Apartments | 15 (4.0%) | 365 (96.1%) |
| 10 or more Apartments | 25 (3.4%) | 716 (96.6%) |
| Mobile Home / Other | 3,896 (76.8%) | 1,178 (23.2%) |
| Total | 20,580 (75.2%) | 6,794 (24.8%) |
Housing Structures by Number of Rooms in Creek County
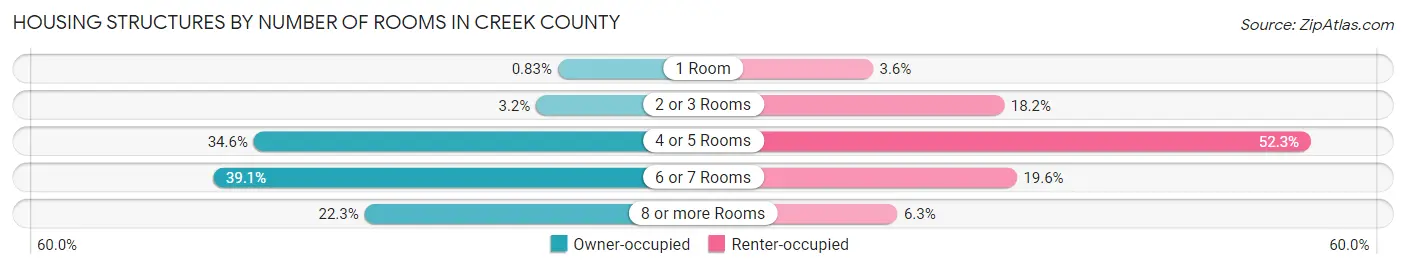
| Number of Rooms | Owner-occupied | Renter-occupied |
| 1 Room | 171 (0.8%) | 246 (3.6%) |
| 2 or 3 Rooms | 665 (3.2%) | 1,236 (18.2%) |
| 4 or 5 Rooms | 7,115 (34.6%) | 3,551 (52.3%) |
| 6 or 7 Rooms | 8,046 (39.1%) | 1,331 (19.6%) |
| 8 or more Rooms | 4,583 (22.3%) | 430 (6.3%) |
| Total | 20,580 (100.0%) | 6,794 (100.0%) |
Housing Structure by Heating Type in Creek County
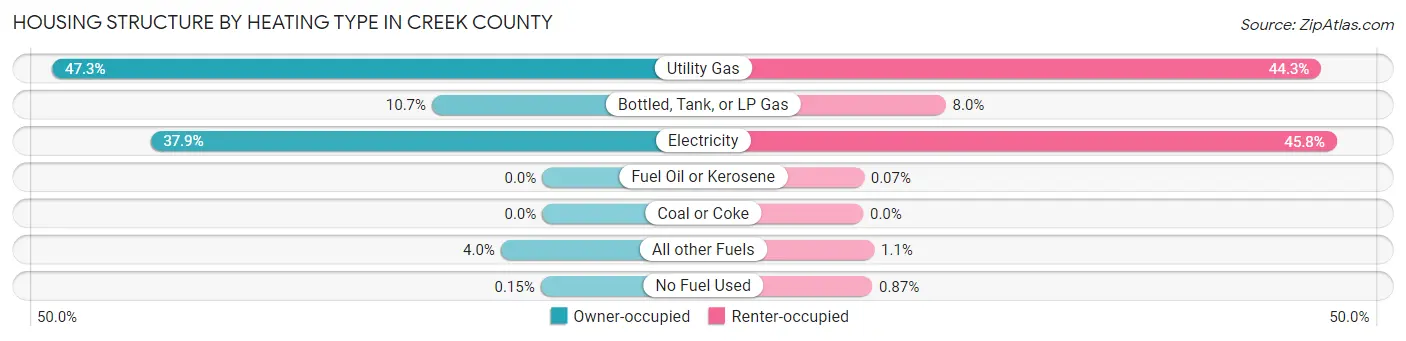
| Heating Type | Owner-occupied | Renter-occupied |
| Utility Gas | 9,742 (47.3%) | 3,007 (44.3%) |
| Bottled, Tank, or LP Gas | 2,192 (10.6%) | 542 (8.0%) |
| Electricity | 7,792 (37.9%) | 3,108 (45.8%) |
| Fuel Oil or Kerosene | 0 (0.0%) | 5 (0.1%) |
| Coal or Coke | 0 (0.0%) | 0 (0.0%) |
| All other Fuels | 823 (4.0%) | 73 (1.1%) |
| No Fuel Used | 31 (0.2%) | 59 (0.9%) |
| Total | 20,580 (100.0%) | 6,794 (100.0%) |
Household Vehicle Usage in Creek County
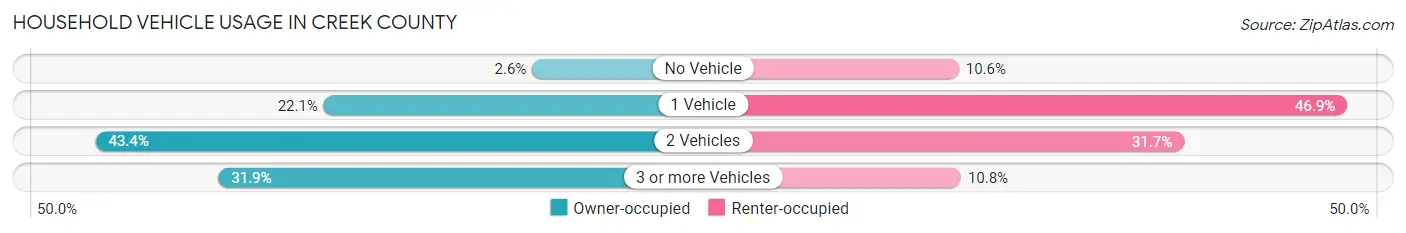
| Vehicles per Household | Owner-occupied | Renter-occupied |
| No Vehicle | 540 (2.6%) | 722 (10.6%) |
| 1 Vehicle | 4,544 (22.1%) | 3,185 (46.9%) |
| 2 Vehicles | 8,928 (43.4%) | 2,151 (31.7%) |
| 3 or more Vehicles | 6,568 (31.9%) | 736 (10.8%) |
| Total | 20,580 (100.0%) | 6,794 (100.0%) |
Real Estate & Mortgages in Creek County
Real Estate and Mortgage Overview in Creek County
| Characteristic | Without Mortgage | With Mortgage |
| Housing Units | 10,010 | 10,570 |
| Median Property Value | $131,200 | $173,900 |
| Median Household Income | $51,610 | $2,097 |
| Monthly Housing Costs | $430 | $473 |
| Real Estate Taxes | $825 | $521 |
Property Value by Mortgage Status in Creek County
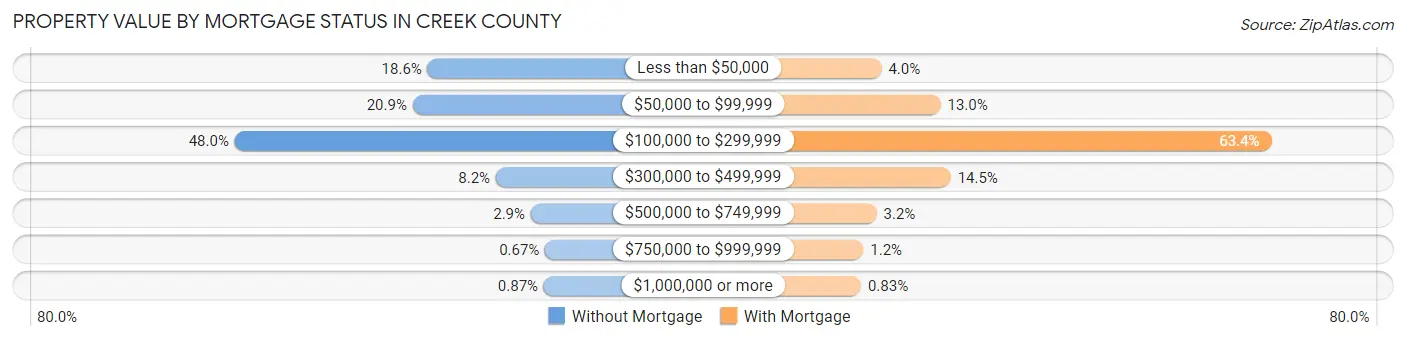
| Property Value | Without Mortgage | With Mortgage |
| Less than $50,000 | 1,860 (18.6%) | 417 (4.0%) |
| $50,000 to $99,999 | 2,088 (20.9%) | 1,369 (13.0%) |
| $100,000 to $299,999 | 4,803 (48.0%) | 6,698 (63.4%) |
| $300,000 to $499,999 | 819 (8.2%) | 1,533 (14.5%) |
| $500,000 to $749,999 | 286 (2.9%) | 339 (3.2%) |
| $750,000 to $999,999 | 67 (0.7%) | 126 (1.2%) |
| $1,000,000 or more | 87 (0.9%) | 88 (0.8%) |
| Total | 10,010 (100.0%) | 10,570 (100.0%) |
Household Income by Mortgage Status in Creek County
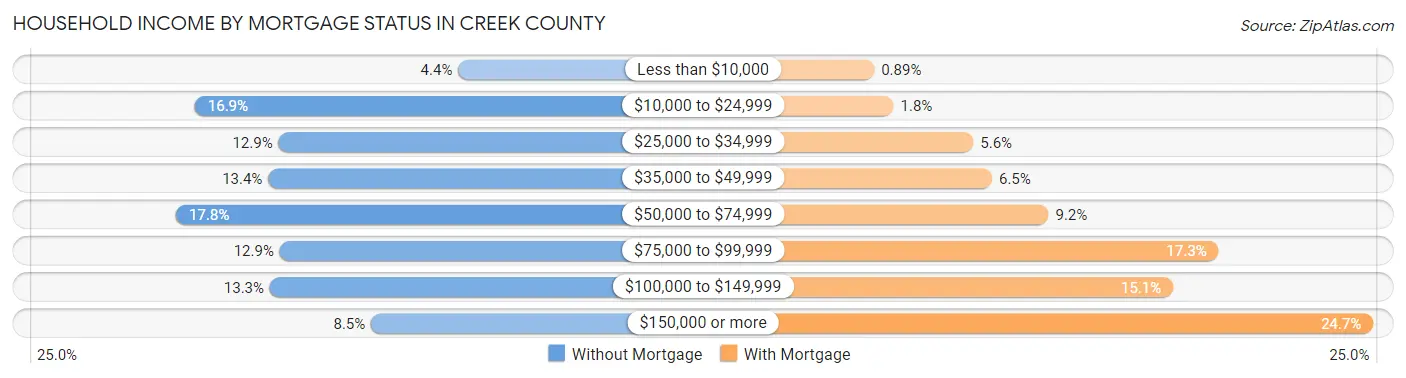
| Household Income | Without Mortgage | With Mortgage |
| Less than $10,000 | 435 (4.3%) | 94 (0.9%) |
| $10,000 to $24,999 | 1,691 (16.9%) | 191 (1.8%) |
| $25,000 to $34,999 | 1,292 (12.9%) | 593 (5.6%) |
| $35,000 to $49,999 | 1,341 (13.4%) | 687 (6.5%) |
| $50,000 to $74,999 | 1,781 (17.8%) | 971 (9.2%) |
| $75,000 to $99,999 | 1,286 (12.9%) | 1,828 (17.3%) |
| $100,000 to $149,999 | 1,333 (13.3%) | 1,598 (15.1%) |
| $150,000 or more | 851 (8.5%) | 2,605 (24.6%) |
| Total | 10,010 (100.0%) | 10,570 (100.0%) |
Property Value to Household Income Ratio in Creek County
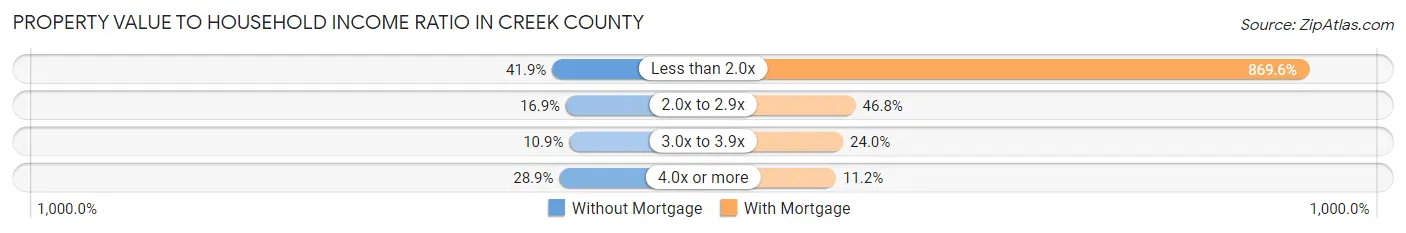
| Value-to-Income Ratio | Without Mortgage | With Mortgage |
| Less than 2.0x | 4,194 (41.9%) | 91,921 (869.6%) |
| 2.0x to 2.9x | 1,690 (16.9%) | 4,945 (46.8%) |
| 3.0x to 3.9x | 1,088 (10.9%) | 2,533 (24.0%) |
| 4.0x or more | 2,897 (28.9%) | 1,181 (11.2%) |
| Total | 10,010 (100.0%) | 10,570 (100.0%) |
Real Estate Taxes by Mortgage Status in Creek County
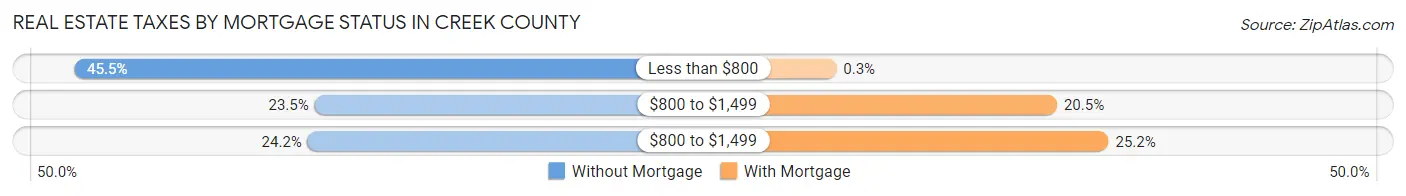
| Property Taxes | Without Mortgage | With Mortgage |
| Less than $800 | 4,553 (45.5%) | 32 (0.3%) |
| $800 to $1,499 | 2,354 (23.5%) | 2,162 (20.4%) |
| $800 to $1,499 | 2,417 (24.1%) | 2,659 (25.2%) |
| Total | 10,010 (100.0%) | 10,570 (100.0%) |
Health & Disability in Creek County
Health Insurance Coverage by Age in Creek County
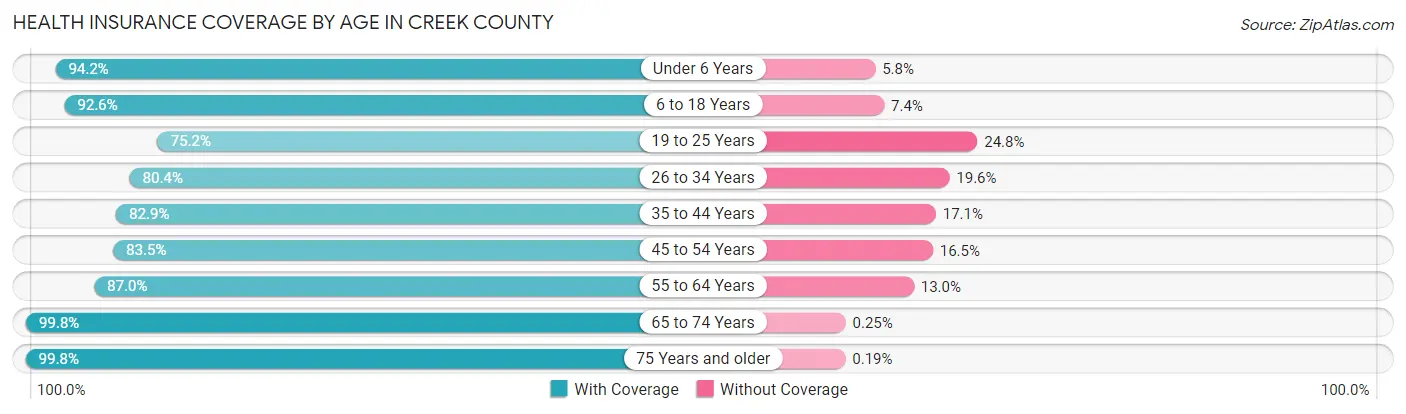
| Age Bracket | With Coverage | Without Coverage |
| Under 6 Years | 4,922 (94.2%) | 301 (5.8%) |
| 6 to 18 Years | 11,503 (92.6%) | 922 (7.4%) |
| 19 to 25 Years | 4,383 (75.2%) | 1,446 (24.8%) |
| 26 to 34 Years | 6,199 (80.4%) | 1,510 (19.6%) |
| 35 to 44 Years | 7,209 (82.9%) | 1,483 (17.1%) |
| 45 to 54 Years | 7,463 (83.5%) | 1,475 (16.5%) |
| 55 to 64 Years | 8,553 (87.0%) | 1,274 (13.0%) |
| 65 to 74 Years | 7,450 (99.8%) | 19 (0.3%) |
| 75 Years and older | 5,121 (99.8%) | 10 (0.2%) |
| Total | 62,803 (88.1%) | 8,440 (11.8%) |
Health Insurance Coverage by Citizenship Status in Creek County
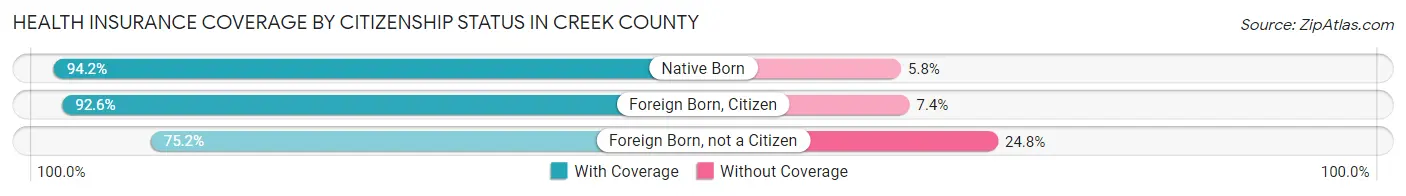
| Citizenship Status | With Coverage | Without Coverage |
| Native Born | 4,922 (94.2%) | 301 (5.8%) |
| Foreign Born, Citizen | 11,503 (92.6%) | 922 (7.4%) |
| Foreign Born, not a Citizen | 4,383 (75.2%) | 1,446 (24.8%) |
Health Insurance Coverage by Household Income in Creek County
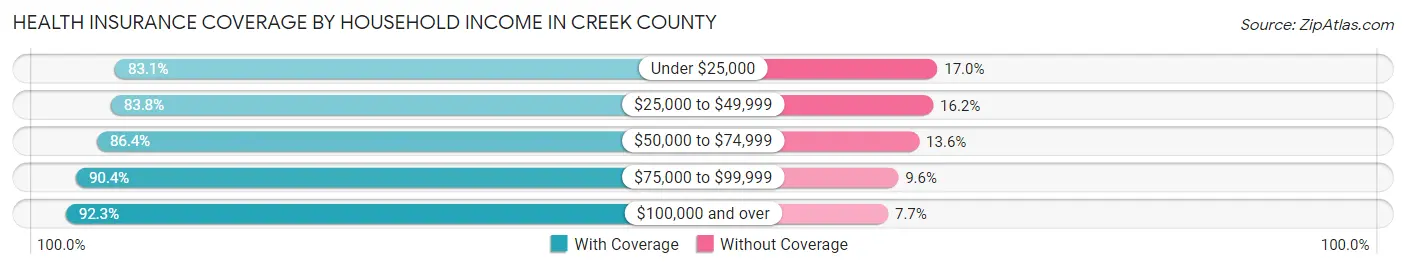
| Household Income | With Coverage | Without Coverage |
| Under $25,000 | 7,571 (83.1%) | 1,545 (17.0%) |
| $25,000 to $49,999 | 11,141 (83.8%) | 2,149 (16.2%) |
| $50,000 to $74,999 | 11,320 (86.4%) | 1,776 (13.6%) |
| $75,000 to $99,999 | 9,707 (90.4%) | 1,034 (9.6%) |
| $100,000 and over | 22,992 (92.3%) | 1,926 (7.7%) |
Public vs Private Health Insurance Coverage by Age in Creek County
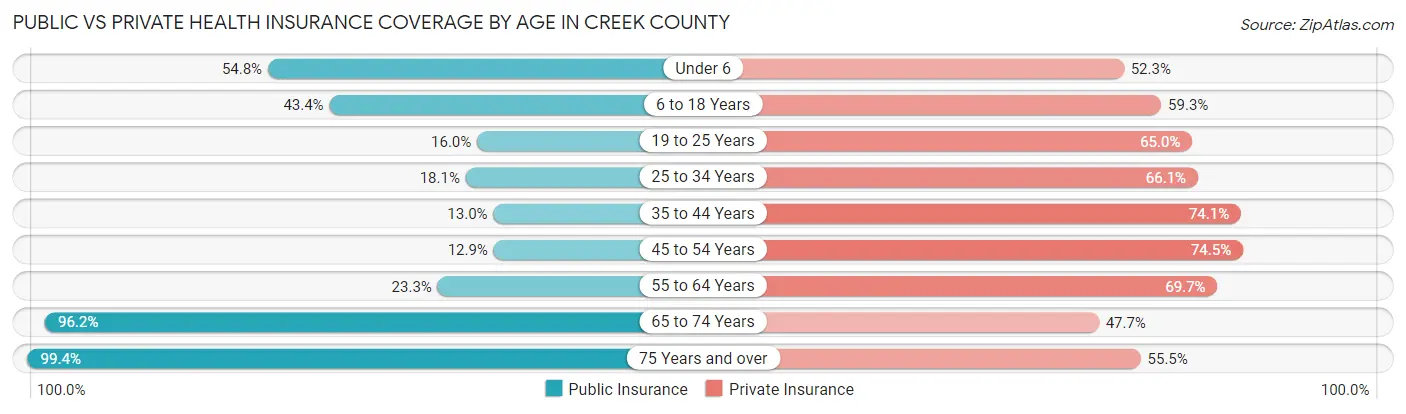
| Age Bracket | Public Insurance | Private Insurance |
| Under 6 | 2,864 (54.8%) | 2,733 (52.3%) |
| 6 to 18 Years | 5,395 (43.4%) | 7,365 (59.3%) |
| 19 to 25 Years | 933 (16.0%) | 3,791 (65.0%) |
| 25 to 34 Years | 1,397 (18.1%) | 5,095 (66.1%) |
| 35 to 44 Years | 1,128 (13.0%) | 6,440 (74.1%) |
| 45 to 54 Years | 1,156 (12.9%) | 6,655 (74.5%) |
| 55 to 64 Years | 2,293 (23.3%) | 6,851 (69.7%) |
| 65 to 74 Years | 7,185 (96.2%) | 3,561 (47.7%) |
| 75 Years and over | 5,102 (99.4%) | 2,846 (55.5%) |
| Total | 27,453 (38.5%) | 45,337 (63.6%) |
Disability Status by Sex by Age in Creek County
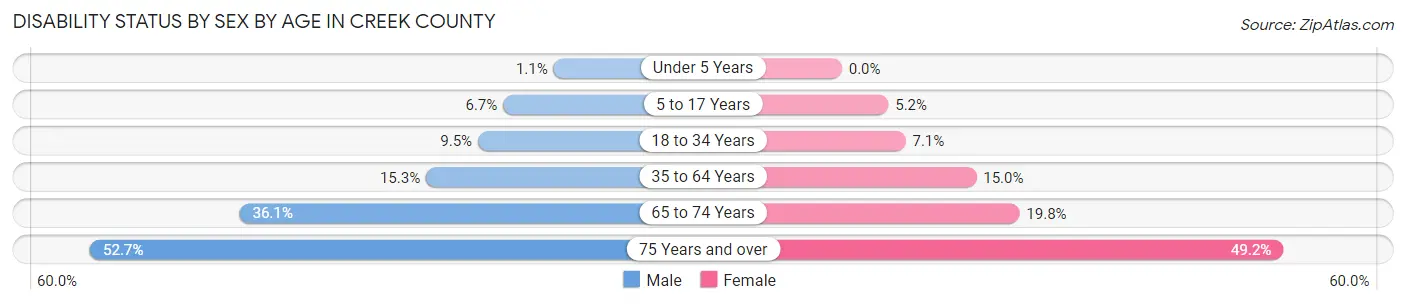
| Age Bracket | Male | Female |
| Under 5 Years | 23 (1.1%) | 0 (0.0%) |
| 5 to 17 Years | 437 (6.7%) | 316 (5.2%) |
| 18 to 34 Years | 694 (9.5%) | 500 (7.1%) |
| 35 to 64 Years | 2,111 (15.3%) | 2,046 (15.0%) |
| 65 to 74 Years | 1,253 (36.1%) | 790 (19.8%) |
| 75 Years and over | 1,187 (52.7%) | 1,415 (49.1%) |
Disability Class by Sex by Age in Creek County
Disability Class: Hearing Difficulty
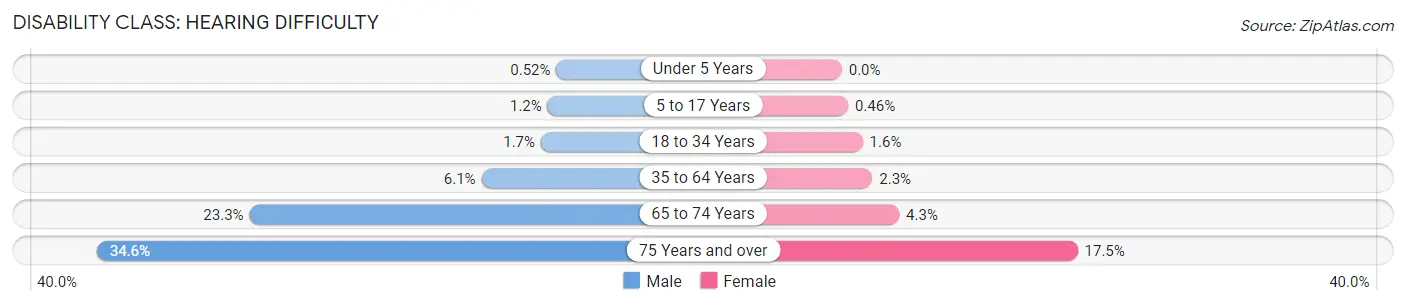
| Age Bracket | Male | Female |
| Under 5 Years | 11 (0.5%) | 0 (0.0%) |
| 5 to 17 Years | 76 (1.2%) | 28 (0.5%) |
| 18 to 34 Years | 122 (1.7%) | 109 (1.5%) |
| 35 to 64 Years | 839 (6.1%) | 310 (2.3%) |
| 65 to 74 Years | 810 (23.3%) | 170 (4.3%) |
| 75 Years and over | 780 (34.6%) | 504 (17.5%) |
Disability Class: Vision Difficulty
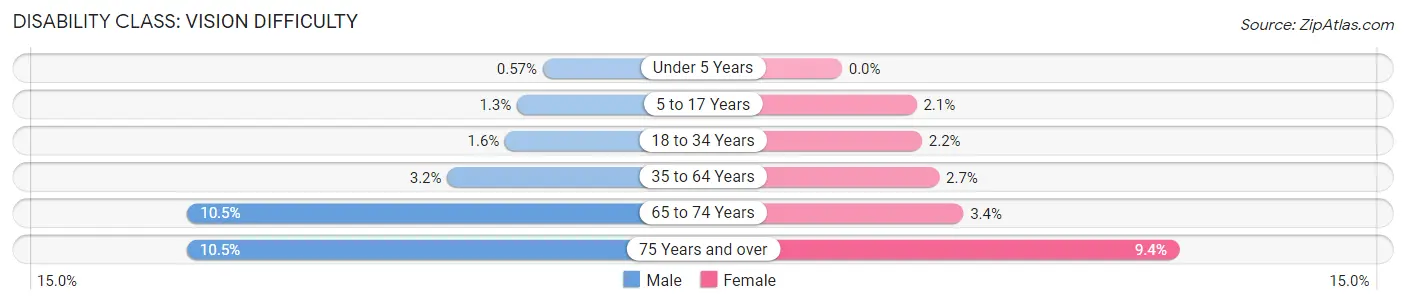
| Age Bracket | Male | Female |
| Under 5 Years | 12 (0.6%) | 0 (0.0%) |
| 5 to 17 Years | 84 (1.3%) | 127 (2.1%) |
| 18 to 34 Years | 118 (1.6%) | 157 (2.2%) |
| 35 to 64 Years | 446 (3.2%) | 370 (2.7%) |
| 65 to 74 Years | 364 (10.5%) | 135 (3.4%) |
| 75 Years and over | 236 (10.5%) | 270 (9.4%) |
Disability Class: Cognitive Difficulty
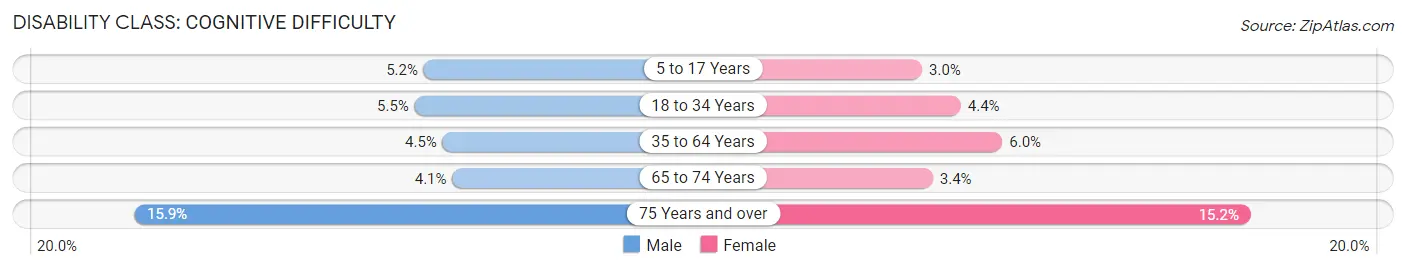
| Age Bracket | Male | Female |
| 5 to 17 Years | 337 (5.2%) | 182 (3.0%) |
| 18 to 34 Years | 403 (5.5%) | 311 (4.4%) |
| 35 to 64 Years | 618 (4.5%) | 814 (6.0%) |
| 65 to 74 Years | 143 (4.1%) | 135 (3.4%) |
| 75 Years and over | 359 (15.9%) | 437 (15.2%) |
Disability Class: Ambulatory Difficulty
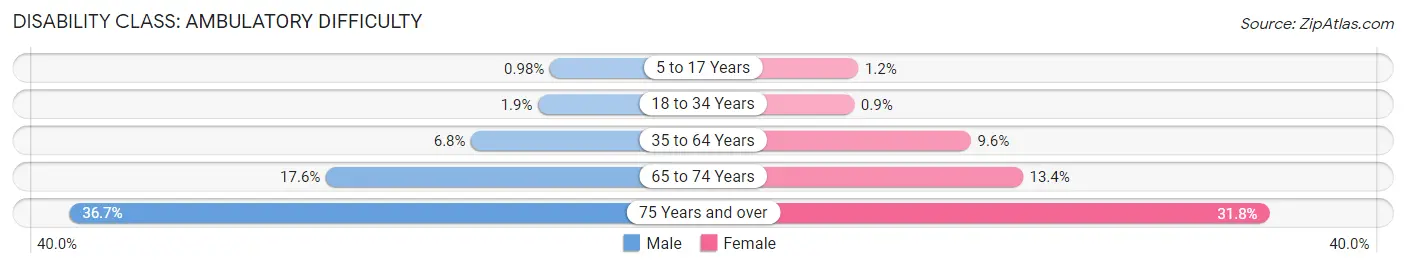
| Age Bracket | Male | Female |
| 5 to 17 Years | 64 (1.0%) | 73 (1.2%) |
| 18 to 34 Years | 136 (1.9%) | 63 (0.9%) |
| 35 to 64 Years | 943 (6.8%) | 1,306 (9.6%) |
| 65 to 74 Years | 612 (17.6%) | 536 (13.4%) |
| 75 Years and over | 826 (36.7%) | 914 (31.8%) |
Disability Class: Self-Care Difficulty
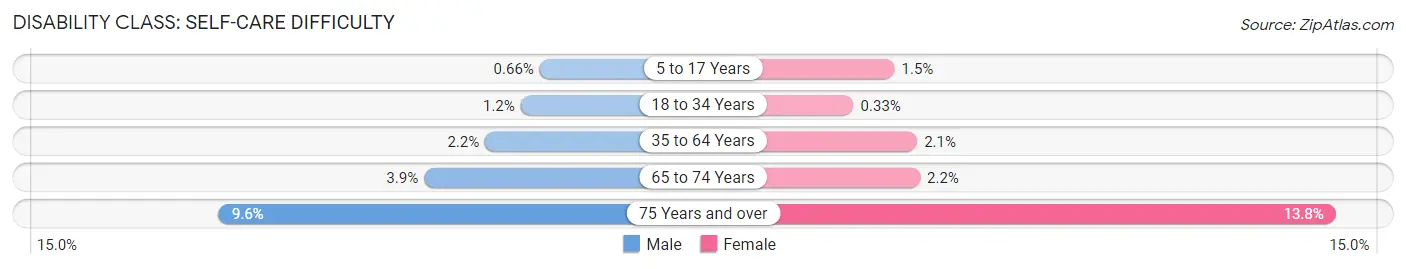
| Age Bracket | Male | Female |
| 5 to 17 Years | 43 (0.7%) | 90 (1.5%) |
| 18 to 34 Years | 87 (1.2%) | 23 (0.3%) |
| 35 to 64 Years | 301 (2.2%) | 287 (2.1%) |
| 65 to 74 Years | 135 (3.9%) | 87 (2.2%) |
| 75 Years and over | 216 (9.6%) | 396 (13.8%) |
Technology Access in Creek County
Computing Device Access in Creek County
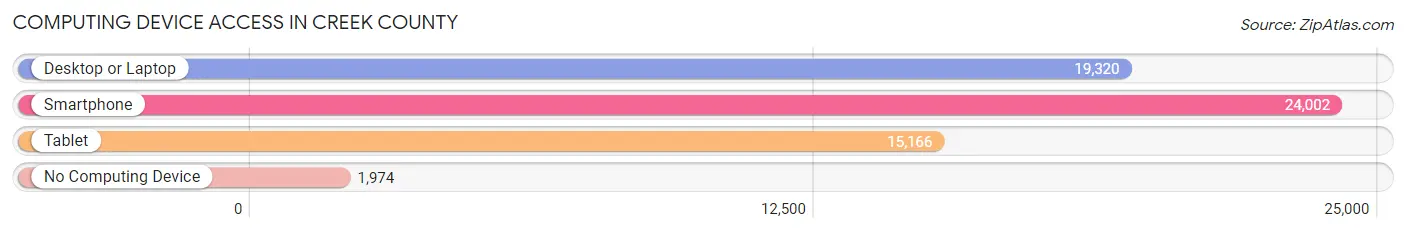
| Device Type | # Households | % Households |
| Desktop or Laptop | 19,320 | 70.6% |
| Smartphone | 24,002 | 87.7% |
| Tablet | 15,166 | 55.4% |
| No Computing Device | 1,974 | 7.2% |
| Total | 27,374 | 100.0% |
Internet Access in Creek County
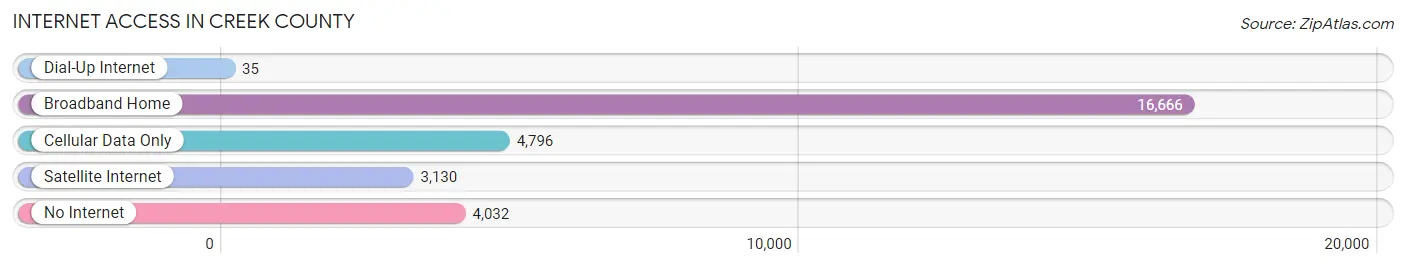
| Internet Type | # Households | % Households |
| Dial-Up Internet | 35 | 0.1% |
| Broadband Home | 16,666 | 60.9% |
| Cellular Data Only | 4,796 | 17.5% |
| Satellite Internet | 3,130 | 11.4% |
| No Internet | 4,032 | 14.7% |
| Total | 27,374 | 100.0% |
Creek County Summary
Creek County is located in the central part of Oklahoma, and is bordered by Tulsa, Okmulgee, Okfuskee, Okmulgee, and Pawnee counties. The county seat is Sapulpa, and the county was named after the Muscogee Creek Nation, which was relocated to the area in the late 19th century. The county has a total area of 590 square miles, and a population of 70,967 as of the 2010 census.
Geography
Creek County is located in the central part of Oklahoma, and is bordered by Tulsa, Okmulgee, Okfuskee, Okmulgee, and Pawnee counties. The county is mostly flat, with some rolling hills in the northern and eastern parts. The Arkansas River runs through the county, and there are several small lakes and ponds scattered throughout. The climate is generally mild, with hot summers and cold winters.
Economy
Creek County’s economy is largely based on agriculture, with the main crops being cotton, corn, soybeans, and wheat. The county also has a strong manufacturing sector, with companies such as Tulsa-based Williams Companies, Inc. and Sapulpa-based Creek County Manufacturing. The county also has a growing tourism industry, with attractions such as the Creek County Speedway and the Creek County Fair.
Demographics
As of the 2010 census, Creek County had a population of 70,967. The racial makeup of the county was 79.2% White, 8.2% African American, 5.3% Native American, 0.7% Asian, 0.1% Pacific Islander, 3.2% from other races, and 3.3% from two or more races. Hispanic or Latino of any race were 6.7% of the population.
The median income for a household in the county was $41,945, and the median income for a family was $50,945. The per capita income for the county was $20,945. About 11.2% of families and 14.3% of the population were below the poverty line, including 19.2% of those under age 18 and 8.7% of those age 65 or over.
Conclusion
Creek County is located in the central part of Oklahoma, and is bordered by Tulsa, Okmulgee, Okfuskee, Okmulgee, and Pawnee counties. The county has a total area of 590 square miles, and a population of 70,967 as of the 2010 census. The economy is largely based on agriculture, with the main crops being cotton, corn, soybeans, and wheat. The county also has a strong manufacturing sector, and a growing tourism industry. The racial makeup of the county is 79.2% White, 8.2% African American, 5.3% Native American, 0.7% Asian, 0.1% Pacific Islander, 3.2% from other races, and 3.3% from two or more races. The median income for a household in the county was $41,945, and the median income for a family was $50,945. About 11.2% of families and 14.3% of the population were below the poverty line.
Common Questions
What is the Total Population of Creek County?
Total Population of Creek County is 72,076.
What is the Total Male Population of Creek County?
Total Male Population of Creek County is 35,821.
What is the Total Female Population of Creek County?
Total Female Population of Creek County is 36,255.
What is the Ratio of Males per 100 Females in Creek County?
There are 98.80 Males per 100 Females in Creek County.
What is the Ratio of Females per 100 Males in Creek County?
There are 101.21 Females per 100 Males in Creek County.
What is the Median Population Age in Creek County?
Median Population Age in Creek County is 40.4 Years.
What is the Average Family Size in Creek County
Average Family Size in Creek County is 3.1 People.
What is the Average Household Size in Creek County
Average Household Size in Creek County is 2.6 People.
What is Per Capita Income in Creek County?
Per Capita income in Creek County is $31,222.
What is the Median Family Income in Creek County?
Median Family Income in Creek County is $77,035.
What is the Median Household income in Creek County?
Median Household Income in Creek County is $61,657.
What is Income or Wage Gap in Creek County?
Income or Wage Gap in Creek County is 35.0%.
Women in Creek County earn 65.0 cents for every dollar earned by a man.
What is Family Income Deficit in Creek County?
Family Income Deficit in Creek County is $11,298.
Families that are below poverty line in Creek County earn $11,298 less on average than the poverty threshold level.
What is Inequality or Gini Index in Creek County?
Inequality or Gini Index in Creek County is 0.44.
How Large is the Labor Force in Creek County?
There are 32,444 People in the Labor Forcein in Creek County.
What is the Percentage of People in the Labor Force in Creek County?
56.7% of People are in the Labor Force in Creek County.
What is the Unemployment Rate in Creek County?
Unemployment Rate in Creek County is 3.7%.