Comanche County, OK
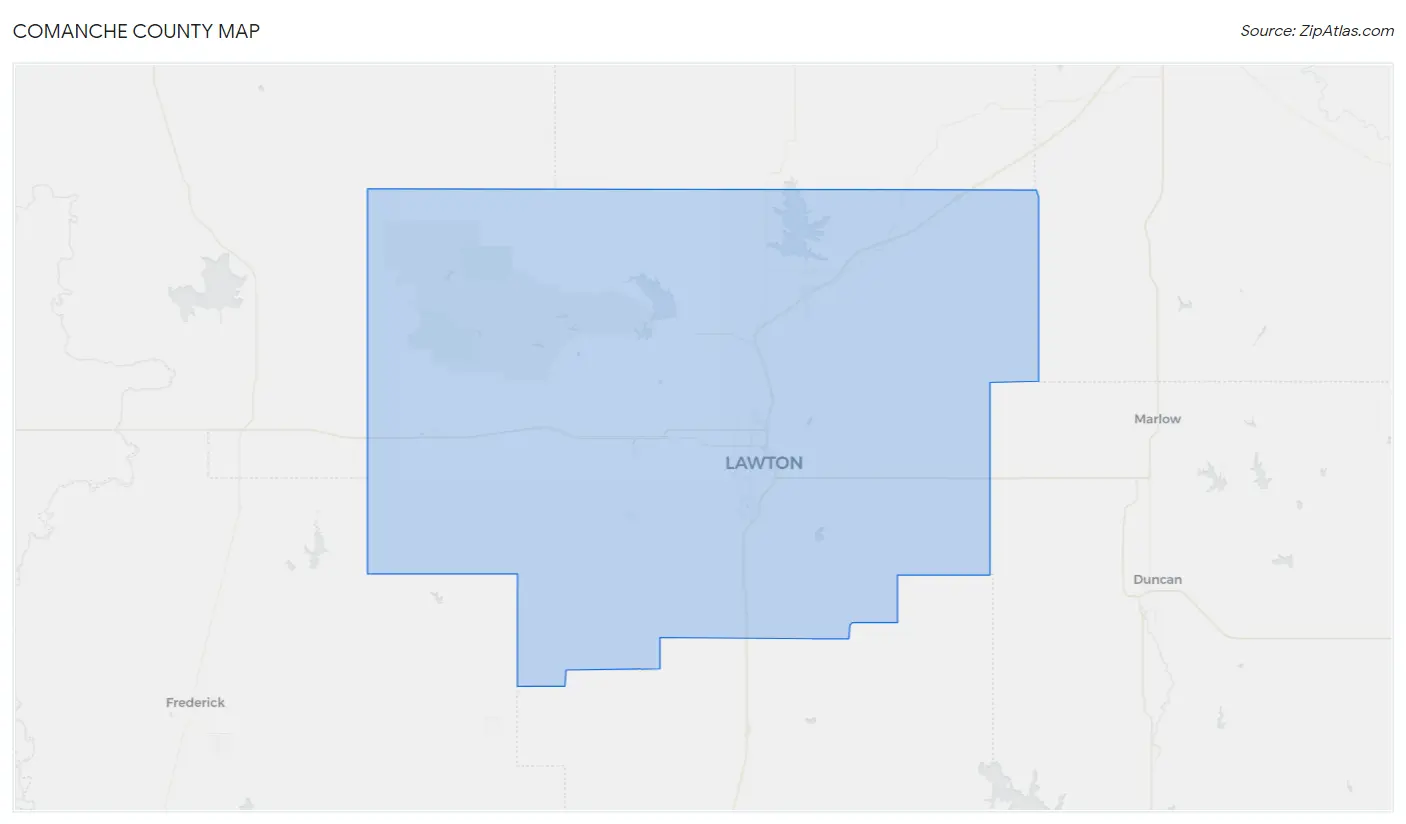
Comanche County Map
Comanche County Overview
121,777
TOTAL POPULATION
63,246
MALE POPULATION
58,531
FEMALE POPULATION
108.06
MALES / 100 FEMALES
92.54
FEMALES / 100 MALES
33.5
MEDIAN AGE
3.2
AVG FAMILY SIZE
2.5
AVG HOUSEHOLD SIZE
$29,980
PER CAPITA INCOME
$70,878
AVG FAMILY INCOME
$57,150
AVG HOUSEHOLD INCOME
22.3%
WAGE / INCOME GAP [ % ]
77.7¢/ $1
WAGE / INCOME GAP [ $ ]
$11,092
FAMILY INCOME DEFICIT
0.45
INEQUALITY / GINI INDEX
58,427
LABOR FORCE [ PEOPLE ]
60.9%
PERCENT IN LABOR FORCE
6.6%
UNEMPLOYMENT RATE
Comanche County Area Codes
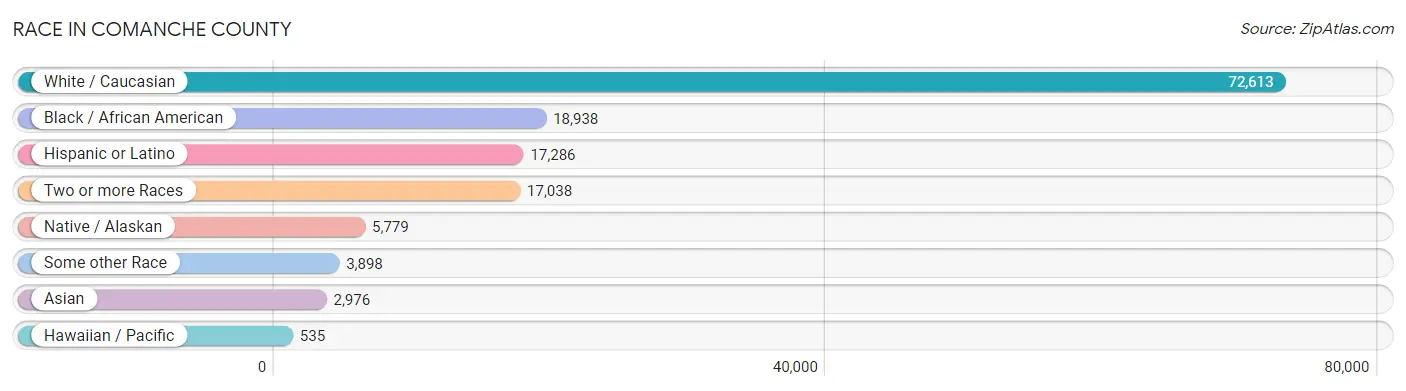
Race in Comanche County
The most populous races in Comanche County are White / Caucasian (72,613 | 59.6%), Black / African American (18,938 | 15.5%), and Hispanic or Latino (17,286 | 14.2%).
| Race | # Population | % Population |
| Asian | 2,976 | 2.4% |
| Black / African American | 18,938 | 15.5% |
| Hawaiian / Pacific | 535 | 0.4% |
| Hispanic or Latino | 17,286 | 14.2% |
| Native / Alaskan | 5,779 | 4.8% |
| White / Caucasian | 72,613 | 59.6% |
| Two or more Races | 17,038 | 14.0% |
| Some other Race | 3,898 | 3.2% |
| Total | 121,777 | 100.0% |
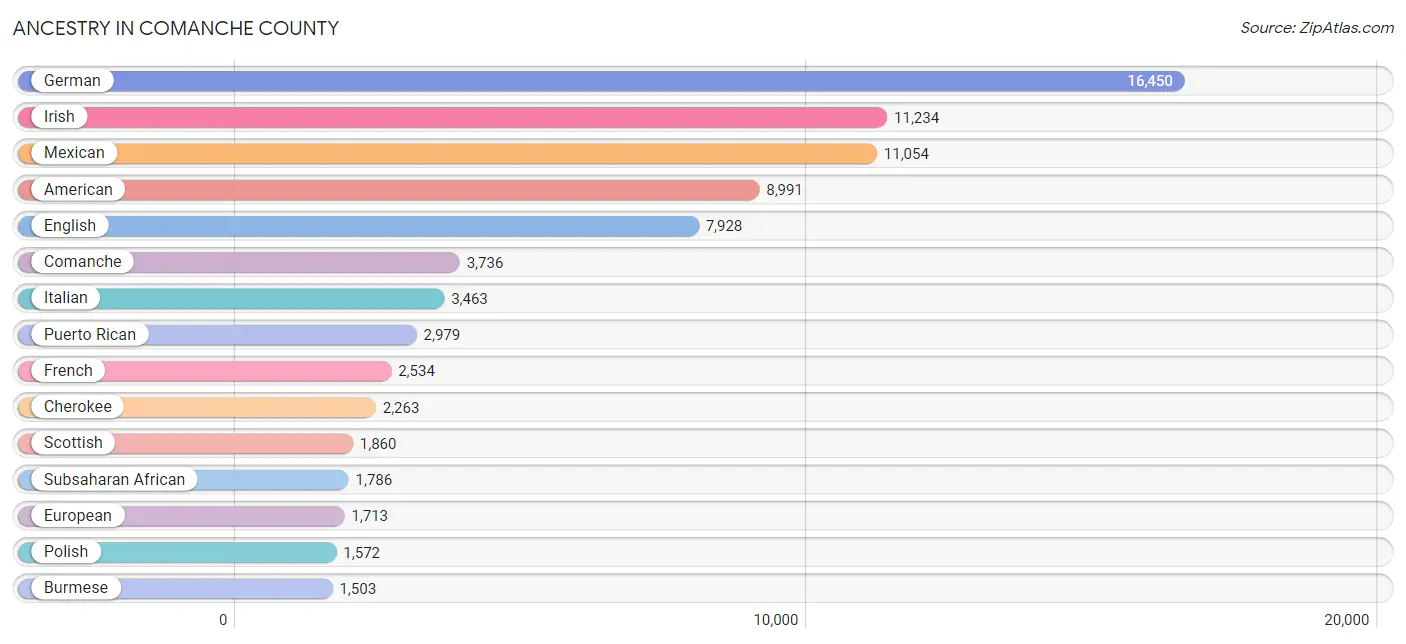
Ancestry in Comanche County
The most populous ancestries reported in Comanche County are German (16,450 | 13.5%), Irish (11,234 | 9.2%), Mexican (11,054 | 9.1%), American (8,991 | 7.4%), and English (7,928 | 6.5%), together accounting for 45.7% of all Comanche County residents.
| Ancestry | # Population | % Population |
| African | 929 | 0.8% |
| Alaska Native | 32 | 0.0% |
| Albanian | 9 | 0.0% |
| Aleut | 2 | 0.0% |
| American | 8,991 | 7.4% |
| Apache | 529 | 0.4% |
| Arab | 276 | 0.2% |
| Arapaho | 143 | 0.1% |
| Argentinean | 20 | 0.0% |
| Armenian | 12 | 0.0% |
| Australian | 170 | 0.1% |
| Austrian | 179 | 0.2% |
| Bahamian | 10 | 0.0% |
| Bangladeshi | 12 | 0.0% |
| Belgian | 56 | 0.1% |
| Belizean | 4 | 0.0% |
| Bhutanese | 541 | 0.4% |
| Blackfeet | 168 | 0.1% |
| Bolivian | 29 | 0.0% |
| Brazilian | 12 | 0.0% |
| British | 549 | 0.4% |
| British West Indian | 35 | 0.0% |
| Burmese | 1,503 | 1.2% |
| Cajun | 86 | 0.1% |
| Canadian | 137 | 0.1% |
| Cape Verdean | 134 | 0.1% |
| Celtic | 45 | 0.0% |
| Central American | 1,242 | 1.0% |
| Central American Indian | 200 | 0.2% |
| Cherokee | 2,263 | 1.9% |
| Cheyenne | 96 | 0.1% |
| Chickasaw | 702 | 0.6% |
| Chilean | 56 | 0.1% |
| Chippewa | 43 | 0.0% |
| Choctaw | 1,167 | 1.0% |
| Colombian | 101 | 0.1% |
| Comanche | 3,736 | 3.1% |
| Cree | 26 | 0.0% |
| Creek | 518 | 0.4% |
| Croatian | 26 | 0.0% |
| Crow | 14 | 0.0% |
| Cuban | 82 | 0.1% |
| Czech | 313 | 0.3% |
| Czechoslovakian | 174 | 0.1% |
| Danish | 133 | 0.1% |
| Delaware | 111 | 0.1% |
| Dominican | 264 | 0.2% |
| Dutch | 1,111 | 0.9% |
| Dutch West Indian | 115 | 0.1% |
| Eastern European | 260 | 0.2% |
| Ecuadorian | 3 | 0.0% |
| Egyptian | 90 | 0.1% |
| English | 7,928 | 6.5% |
| Ethiopian | 26 | 0.0% |
| European | 1,713 | 1.4% |
| Filipino | 15 | 0.0% |
| Finnish | 60 | 0.1% |
| French | 2,534 | 2.1% |
| French American Indian | 12 | 0.0% |
| French Canadian | 521 | 0.4% |
| German | 16,450 | 13.5% |
| German Russian | 11 | 0.0% |
| Ghanaian | 54 | 0.0% |
| Greek | 131 | 0.1% |
| Guamanian / Chamorro | 138 | 0.1% |
| Guatemalan | 190 | 0.2% |
| Haitian | 77 | 0.1% |
| Honduran | 96 | 0.1% |
| Houma | 119 | 0.1% |
| Hungarian | 106 | 0.1% |
| Indian (Asian) | 507 | 0.4% |
| Indonesian | 3 | 0.0% |
| Inupiat | 8 | 0.0% |
| Iranian | 8 | 0.0% |
| Irish | 11,234 | 9.2% |
| Iroquois | 131 | 0.1% |
| Italian | 3,463 | 2.8% |
| Jamaican | 1,047 | 0.9% |
| Japanese | 20 | 0.0% |
| Jordanian | 63 | 0.1% |
| Kenyan | 169 | 0.1% |
| Kiowa | 1,190 | 1.0% |
| Korean | 1,480 | 1.2% |
| Lebanese | 44 | 0.0% |
| Lithuanian | 43 | 0.0% |
| Mexican | 11,054 | 9.1% |
| Mexican American Indian | 111 | 0.1% |
| Mongolian | 5 | 0.0% |
| Native Hawaiian | 580 | 0.5% |
| Navajo | 103 | 0.1% |
| Nicaraguan | 59 | 0.1% |
| Nigerian | 295 | 0.2% |
| Northern European | 147 | 0.1% |
| Norwegian | 866 | 0.7% |
| Osage | 10 | 0.0% |
| Ottawa | 28 | 0.0% |
| Pakistani | 121 | 0.1% |
| Panamanian | 595 | 0.5% |
| Pennsylvania German | 36 | 0.0% |
| Peruvian | 17 | 0.0% |
| Polish | 1,572 | 1.3% |
| Portuguese | 210 | 0.2% |
| Potawatomi | 55 | 0.1% |
| Pueblo | 24 | 0.0% |
| Puerto Rican | 2,979 | 2.5% |
| Romanian | 220 | 0.2% |
| Russian | 553 | 0.4% |
| Salvadoran | 253 | 0.2% |
| Samoan | 289 | 0.2% |
| Scandinavian | 315 | 0.3% |
| Scotch-Irish | 906 | 0.7% |
| Scottish | 1,860 | 1.5% |
| Seminole | 85 | 0.1% |
| Serbian | 18 | 0.0% |
| Shoshone | 12 | 0.0% |
| Sioux | 225 | 0.2% |
| Slavic | 37 | 0.0% |
| Slovak | 11 | 0.0% |
| South African | 80 | 0.1% |
| South American | 304 | 0.3% |
| Spaniard | 436 | 0.4% |
| Spanish | 291 | 0.2% |
| Spanish American | 12 | 0.0% |
| Sri Lankan | 513 | 0.4% |
| Subsaharan African | 1,786 | 1.5% |
| Swedish | 402 | 0.3% |
| Swiss | 102 | 0.1% |
| Syrian | 67 | 0.1% |
| Thai | 598 | 0.5% |
| Tlingit-Haida | 13 | 0.0% |
| Trinidadian and Tobagonian | 12 | 0.0% |
| Turkish | 54 | 0.0% |
| Ukrainian | 53 | 0.0% |
| Venezuelan | 78 | 0.1% |
| Welsh | 619 | 0.5% |
| West Indian | 24 | 0.0% |
| Yugoslavian | 21 | 0.0% |
| Zimbabwean | 18 | 0.0% | View All 138 Rows |
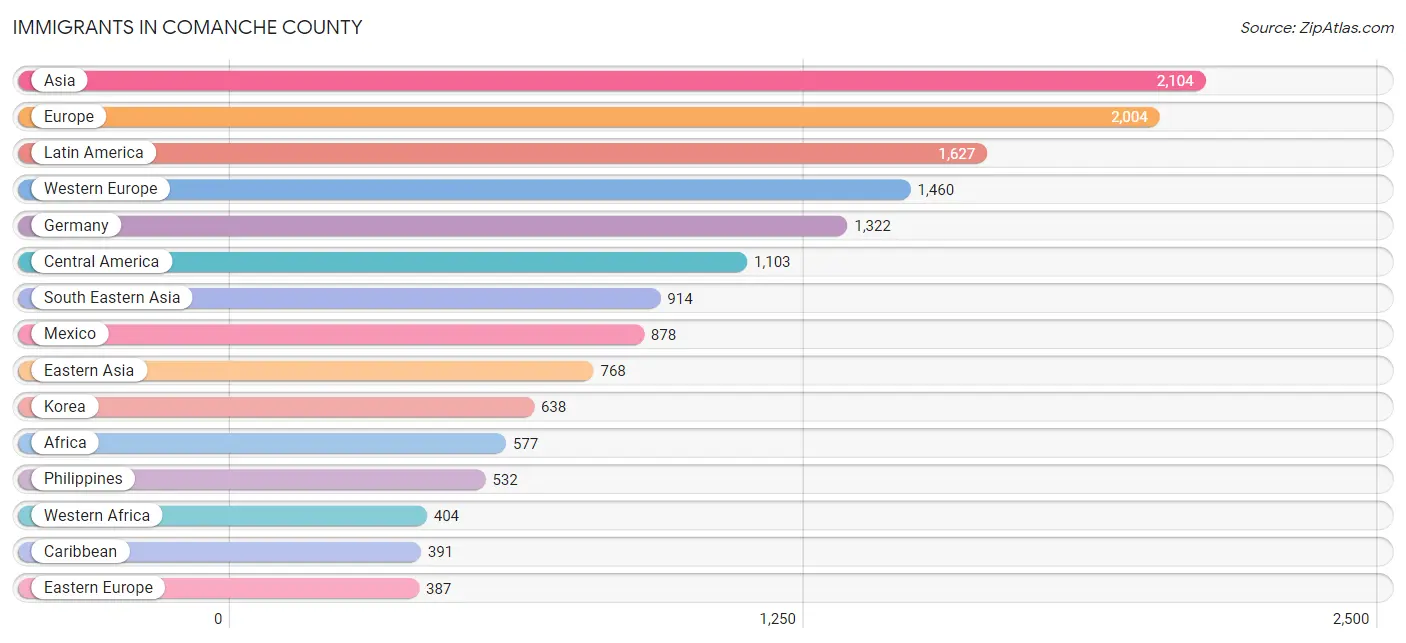
Immigrants in Comanche County
The most numerous immigrant groups reported in Comanche County came from Asia (2,104 | 1.7%), Europe (2,004 | 1.7%), Latin America (1,627 | 1.3%), Western Europe (1,460 | 1.2%), and Germany (1,322 | 1.1%), together accounting for 7.0% of all Comanche County residents.
| Immigration Origin | # Population | % Population |
| Afghanistan | 17 | 0.0% |
| Africa | 577 | 0.5% |
| Albania | 9 | 0.0% |
| Asia | 2,104 | 1.7% |
| Australia | 156 | 0.1% |
| Austria | 19 | 0.0% |
| Belarus | 7 | 0.0% |
| Cabo Verde | 129 | 0.1% |
| Canada | 100 | 0.1% |
| Caribbean | 391 | 0.3% |
| Central America | 1,103 | 0.9% |
| Chile | 26 | 0.0% |
| China | 62 | 0.1% |
| Colombia | 49 | 0.0% |
| Cuba | 24 | 0.0% |
| Dominica | 5 | 0.0% |
| Dominican Republic | 4 | 0.0% |
| Eastern Africa | 131 | 0.1% |
| Eastern Asia | 768 | 0.6% |
| Eastern Europe | 387 | 0.3% |
| Ecuador | 3 | 0.0% |
| Egypt | 23 | 0.0% |
| El Salvador | 9 | 0.0% |
| England | 19 | 0.0% |
| Ethiopia | 50 | 0.0% |
| Europe | 2,004 | 1.7% |
| France | 68 | 0.1% |
| Germany | 1,322 | 1.1% |
| Ghana | 59 | 0.1% |
| Greece | 20 | 0.0% |
| Grenada | 7 | 0.0% |
| Guatemala | 32 | 0.0% |
| Honduras | 8 | 0.0% |
| Hong Kong | 7 | 0.0% |
| Hungary | 41 | 0.0% |
| India | 229 | 0.2% |
| Italy | 77 | 0.1% |
| Jamaica | 316 | 0.3% |
| Japan | 68 | 0.1% |
| Jordan | 1 | 0.0% |
| Kenya | 57 | 0.1% |
| Korea | 638 | 0.5% |
| Latin America | 1,627 | 1.3% |
| Lebanon | 18 | 0.0% |
| Liberia | 11 | 0.0% |
| Mexico | 878 | 0.7% |
| Micronesia | 53 | 0.0% |
| Middle Africa | 15 | 0.0% |
| Moldova | 9 | 0.0% |
| Morocco | 3 | 0.0% |
| Nepal | 74 | 0.1% |
| Netherlands | 26 | 0.0% |
| Nigeria | 189 | 0.2% |
| Northern Africa | 26 | 0.0% |
| Northern Europe | 34 | 0.0% |
| Oceania | 266 | 0.2% |
| Pakistan | 56 | 0.1% |
| Panama | 176 | 0.1% |
| Philippines | 532 | 0.4% |
| Poland | 138 | 0.1% |
| Portugal | 3 | 0.0% |
| Romania | 88 | 0.1% |
| Russia | 78 | 0.1% |
| Saudi Arabia | 10 | 0.0% |
| South America | 133 | 0.1% |
| South Central Asia | 381 | 0.3% |
| South Eastern Asia | 914 | 0.7% |
| Southern Europe | 109 | 0.1% |
| Spain | 9 | 0.0% |
| Sri Lanka | 5 | 0.0% |
| Taiwan | 15 | 0.0% |
| Thailand | 25 | 0.0% |
| Trinidad and Tobago | 18 | 0.0% |
| Turkey | 12 | 0.0% |
| Ukraine | 8 | 0.0% |
| Venezuela | 43 | 0.0% |
| Vietnam | 357 | 0.3% |
| Western Africa | 404 | 0.3% |
| Western Asia | 41 | 0.0% |
| Western Europe | 1,460 | 1.2% |
| Zimbabwe | 18 | 0.0% | View All 81 Rows |
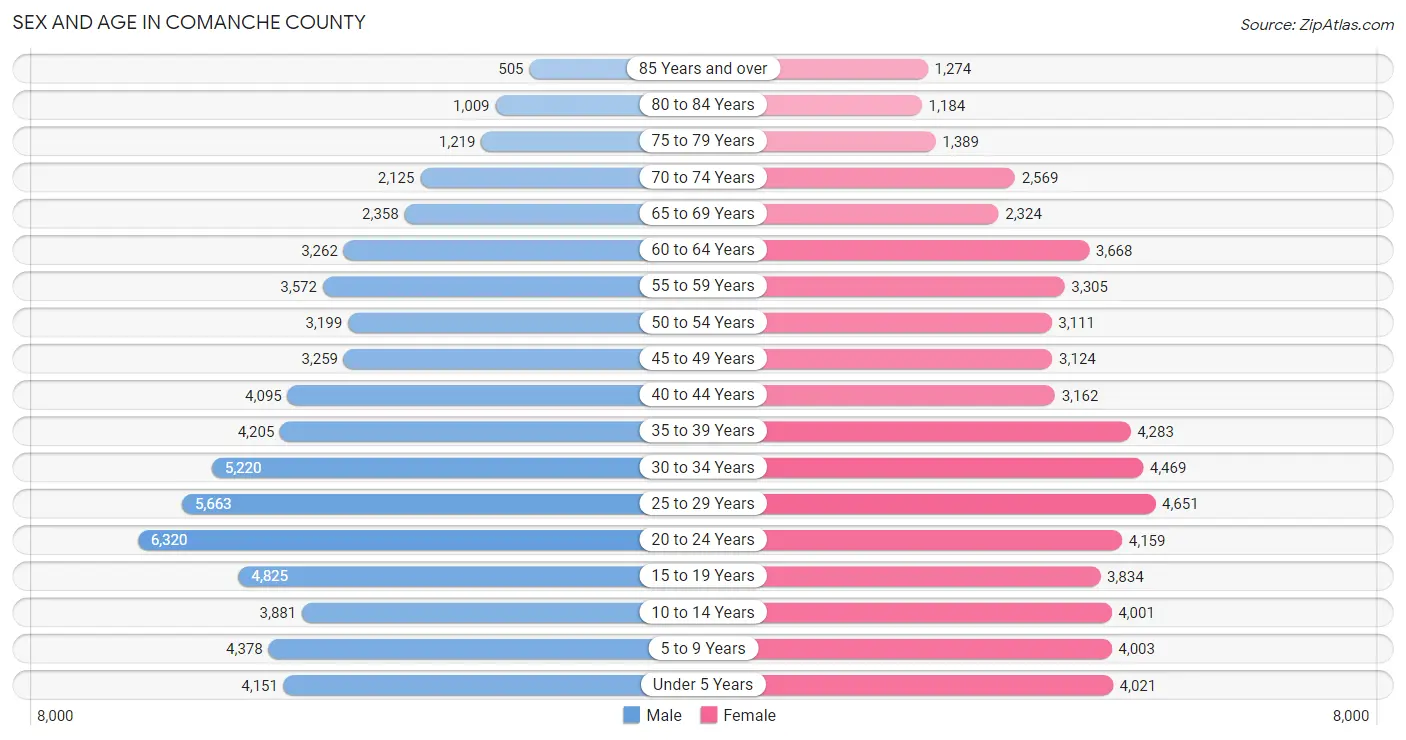
Sex and Age in Comanche County
Sex and Age in Comanche County
The most populous age groups in Comanche County are 20 to 24 Years (6,320 | 10.0%) for men and 25 to 29 Years (4,651 | 8.0%) for women.
| Age Bracket | Male | Female |
| Under 5 Years | 4,151 (6.6%) | 4,021 (6.9%) |
| 5 to 9 Years | 4,378 (6.9%) | 4,003 (6.8%) |
| 10 to 14 Years | 3,881 (6.1%) | 4,001 (6.8%) |
| 15 to 19 Years | 4,825 (7.6%) | 3,834 (6.6%) |
| 20 to 24 Years | 6,320 (10.0%) | 4,159 (7.1%) |
| 25 to 29 Years | 5,663 (8.9%) | 4,651 (8.0%) |
| 30 to 34 Years | 5,220 (8.3%) | 4,469 (7.6%) |
| 35 to 39 Years | 4,205 (6.7%) | 4,283 (7.3%) |
| 40 to 44 Years | 4,095 (6.5%) | 3,162 (5.4%) |
| 45 to 49 Years | 3,259 (5.1%) | 3,124 (5.3%) |
| 50 to 54 Years | 3,199 (5.1%) | 3,111 (5.3%) |
| 55 to 59 Years | 3,572 (5.7%) | 3,305 (5.7%) |
| 60 to 64 Years | 3,262 (5.2%) | 3,668 (6.3%) |
| 65 to 69 Years | 2,358 (3.7%) | 2,324 (4.0%) |
| 70 to 74 Years | 2,125 (3.4%) | 2,569 (4.4%) |
| 75 to 79 Years | 1,219 (1.9%) | 1,389 (2.4%) |
| 80 to 84 Years | 1,009 (1.6%) | 1,184 (2.0%) |
| 85 Years and over | 505 (0.8%) | 1,274 (2.2%) |
| Total | 63,246 (100.0%) | 58,531 (100.0%) |
Families and Households in Comanche County
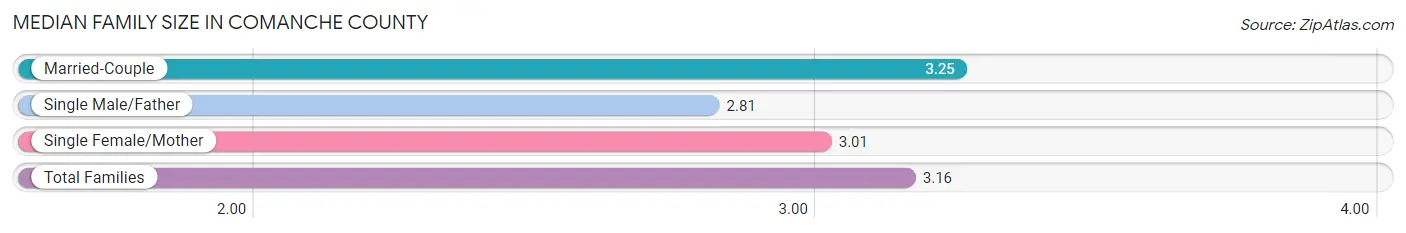
Median Family Size in Comanche County
The median family size in Comanche County is 3.16 persons per family, with married-couple families (19,221 | 68.2%) accounting for the largest median family size of 3.25 persons per family. On the other hand, single male/father families (2,281 | 8.1%) represent the smallest median family size with 2.81 persons per family.
| Family Type | # Families | Family Size |
| Married-Couple | 19,221 (68.2%) | 3.25 |
| Single Male/Father | 2,281 (8.1%) | 2.81 |
| Single Female/Mother | 6,662 (23.6%) | 3.01 |
| Total Families | 28,164 (100.0%) | 3.16 |
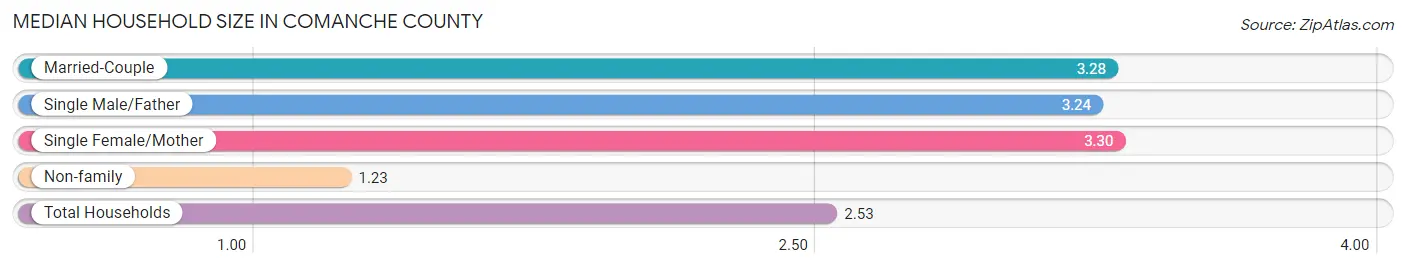
Median Household Size in Comanche County
The median household size in Comanche County is 2.53 persons per household, with single female/mother households (6,662 | 15.0%) accounting for the largest median household size of 3.3 persons per household. non-family households (16,265 | 36.6%) represent the smallest median household size with 1.23 persons per household.
| Household Type | # Households | Household Size |
| Married-Couple | 19,221 (43.3%) | 3.28 |
| Single Male/Father | 2,281 (5.1%) | 3.24 |
| Single Female/Mother | 6,662 (15.0%) | 3.30 |
| Non-family | 16,265 (36.6%) | 1.23 |
| Total Households | 44,429 (100.0%) | 2.53 |
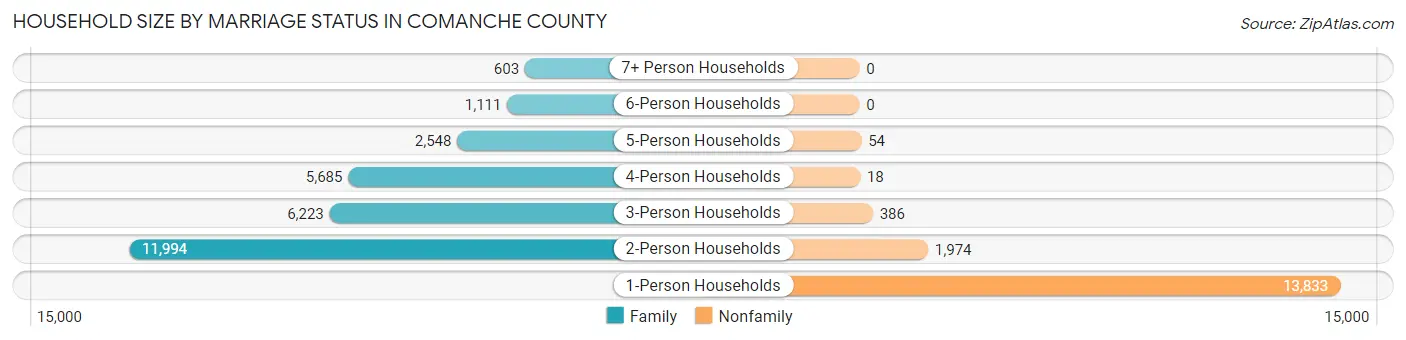
Household Size by Marriage Status in Comanche County
Out of a total of 44,429 households in Comanche County, 28,164 (63.4%) are family households, while 16,265 (36.6%) are nonfamily households. The most numerous type of family households are 2-person households, comprising 11,994, and the most common type of nonfamily households are 1-person households, comprising 13,833.
| Household Size | Family Households | Nonfamily Households |
| 1-Person Households | - | 13,833 (31.1%) |
| 2-Person Households | 11,994 (27.0%) | 1,974 (4.4%) |
| 3-Person Households | 6,223 (14.0%) | 386 (0.9%) |
| 4-Person Households | 5,685 (12.8%) | 18 (0.0%) |
| 5-Person Households | 2,548 (5.7%) | 54 (0.1%) |
| 6-Person Households | 1,111 (2.5%) | 0 (0.0%) |
| 7+ Person Households | 603 (1.4%) | 0 (0.0%) |
| Total | 28,164 (63.4%) | 16,265 (36.6%) |
Female Fertility in Comanche County
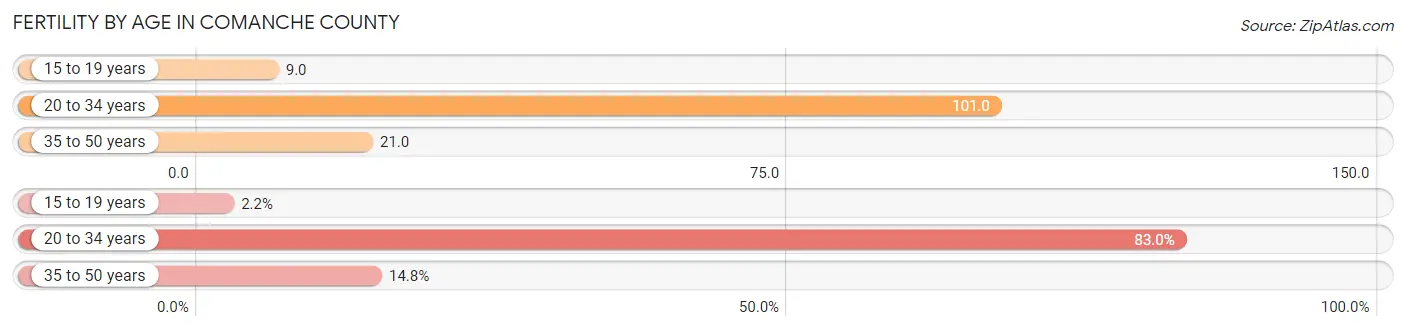
Fertility by Age in Comanche County
Average fertility rate in Comanche County is 57.0 births per 1,000 women. Women in the age bracket of 20 to 34 years have the highest fertility rate with 101.0 births per 1,000 women. Women in the age bracket of 20 to 34 years acount for 83.0% of all women with births.
| Age Bracket | Women with Births | Births / 1,000 Women |
| 15 to 19 years | 36 (2.2%) | 9.0 |
| 20 to 34 years | 1,344 (83.0%) | 101.0 |
| 35 to 50 years | 239 (14.8%) | 21.0 |
| Total | 1,619 (100.0%) | 57.0 |
Fertility by Age by Marriage Status in Comanche County
58.2% of women with births (1,619) in Comanche County are married. The highest percentage of unmarried women with births falls into 15 to 19 years age bracket with 83.3% of them unmarried at the time of birth, while the lowest percentage of unmarried women with births belong to 35 to 50 years age bracket with 19.3% of them unmarried.

| Age Bracket | Married | Unmarried |
| 15 to 19 years | 6 (16.7%) | 30 (83.3%) |
| 20 to 34 years | 745 (55.4%) | 599 (44.6%) |
| 35 to 50 years | 193 (80.7%) | 46 (19.3%) |
| Total | 942 (58.2%) | 677 (41.8%) |
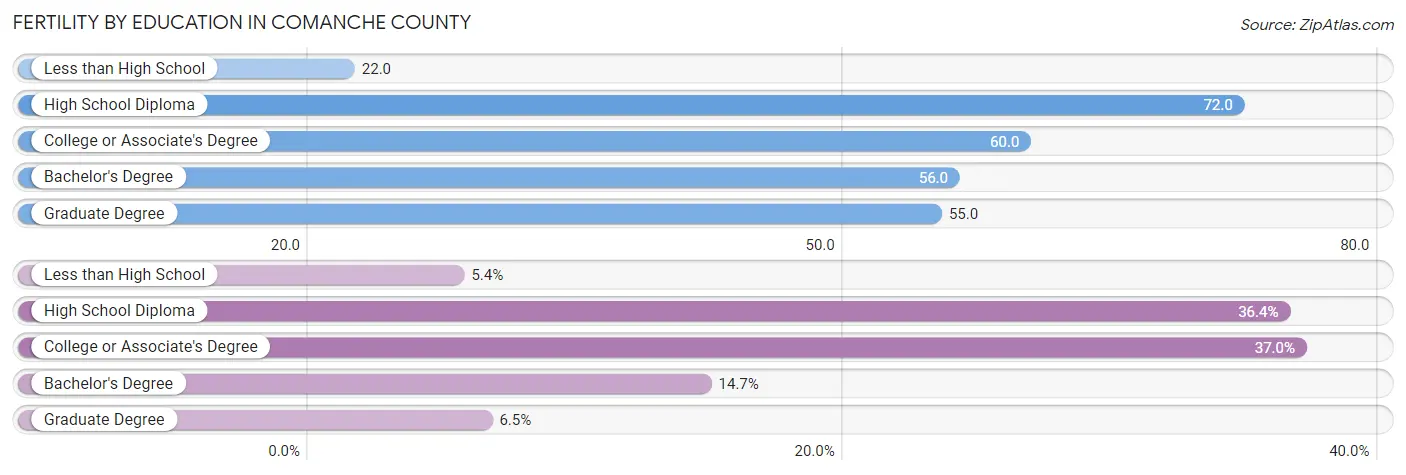
Fertility by Education in Comanche County
Average fertility rate in Comanche County is 57.0 births per 1,000 women. Women with the education attainment of high school diploma have the highest fertility rate of 72.0 births per 1,000 women, while women with the education attainment of less than high school have the lowest fertility at 22.0 births per 1,000 women. Women with the education attainment of college or associate's degree represent 37.0% of all women with births.
| Educational Attainment | Women with Births | Births / 1,000 Women |
| Less than High School | 88 (5.4%) | 22.0 |
| High School Diploma | 589 (36.4%) | 72.0 |
| College or Associate's Degree | 599 (37.0%) | 60.0 |
| Bachelor's Degree | 238 (14.7%) | 56.0 |
| Graduate Degree | 105 (6.5%) | 55.0 |
| Total | 1,619 (100.0%) | 57.0 |
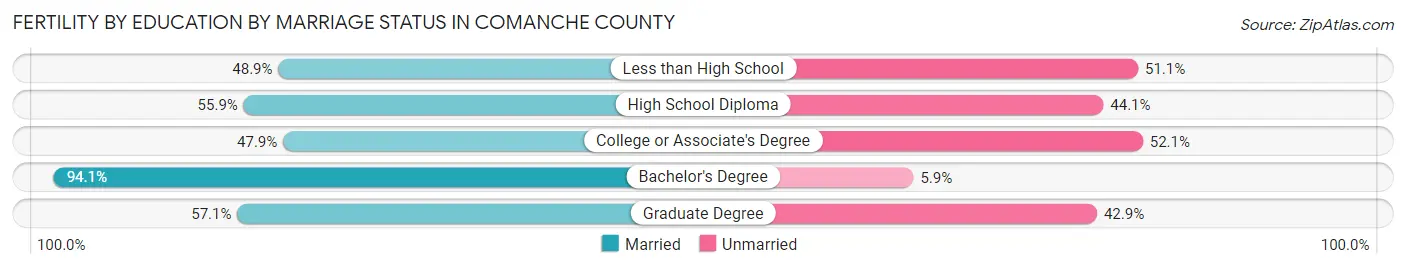
Fertility by Education by Marriage Status in Comanche County
41.8% of women with births in Comanche County are unmarried. Women with the educational attainment of bachelor's degree are most likely to be married with 94.1% of them married at childbirth, while women with the educational attainment of college or associate's degree are least likely to be married with 52.1% of them unmarried at childbirth.
| Educational Attainment | Married | Unmarried |
| Less than High School | 43 (48.9%) | 45 (51.1%) |
| High School Diploma | 329 (55.9%) | 260 (44.1%) |
| College or Associate's Degree | 287 (47.9%) | 312 (52.1%) |
| Bachelor's Degree | 224 (94.1%) | 14 (5.9%) |
| Graduate Degree | 60 (57.1%) | 45 (42.9%) |
| Total | 942 (58.2%) | 677 (41.8%) |
Income in Comanche County
Income Overview in Comanche County
Per Capita Income in Comanche County is $29,980, while median incomes of families and households are $70,878 and $57,150 respectively.
| Characteristic | Number | Measure |
| Per Capita Income | 121,777 | $29,980 |
| Median Family Income | 28,164 | $70,878 |
| Mean Family Income | 28,164 | $89,051 |
| Median Household Income | 44,429 | $57,150 |
| Mean Household Income | 44,429 | $75,979 |
| Income Deficit | 28,164 | $11,092 |
| Wage / Income Gap (%) | 121,777 | 22.33% |
| Wage / Income Gap ($) | 121,777 | 77.67¢ per $1 |
| Gini / Inequality Index | 121,777 | 0.45 |
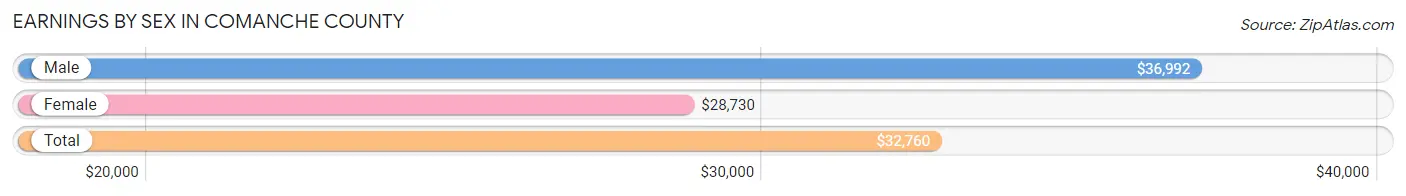
Earnings by Sex in Comanche County
Average Earnings in Comanche County are $32,760, $36,992 for men and $28,730 for women, a difference of 22.3%.
| Sex | Number | Average Earnings |
| Male | 33,115 (54.5%) | $36,992 |
| Female | 27,673 (45.5%) | $28,730 |
| Total | 60,788 (100.0%) | $32,760 |
Earnings by Sex by Income Bracket in Comanche County
The most common earnings brackets in Comanche County are $75,000 to $99,999 for men (3,176 | 9.6%) and $25,000 to $29,999 for women (2,497 | 9.0%).
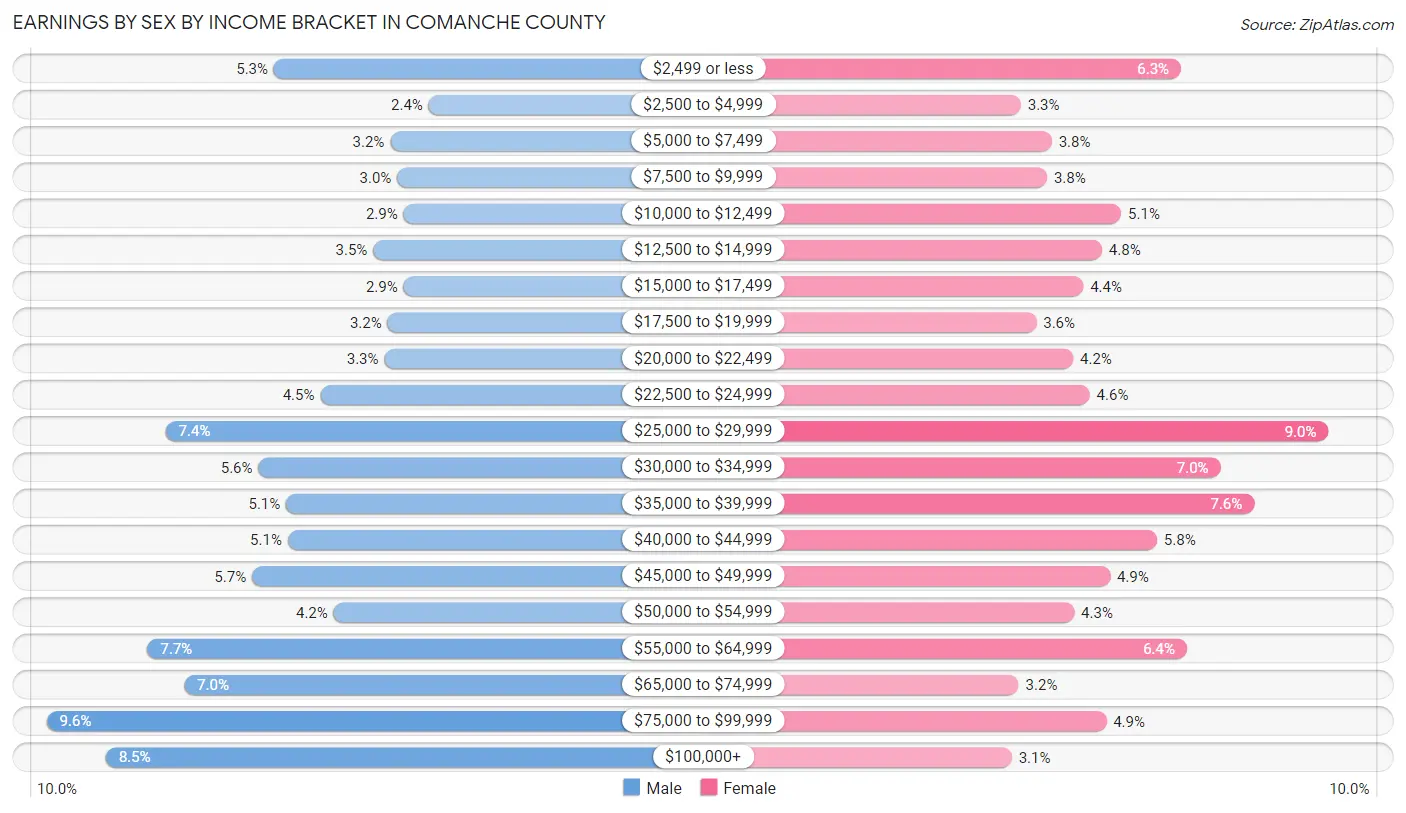
| Income | Male | Female |
| $2,499 or less | 1,765 (5.3%) | 1,733 (6.3%) |
| $2,500 to $4,999 | 804 (2.4%) | 902 (3.3%) |
| $5,000 to $7,499 | 1,044 (3.2%) | 1,063 (3.8%) |
| $7,500 to $9,999 | 999 (3.0%) | 1,038 (3.7%) |
| $10,000 to $12,499 | 960 (2.9%) | 1,422 (5.1%) |
| $12,500 to $14,999 | 1,148 (3.5%) | 1,324 (4.8%) |
| $15,000 to $17,499 | 960 (2.9%) | 1,227 (4.4%) |
| $17,500 to $19,999 | 1,060 (3.2%) | 983 (3.5%) |
| $20,000 to $22,499 | 1,080 (3.3%) | 1,172 (4.2%) |
| $22,500 to $24,999 | 1,478 (4.5%) | 1,259 (4.5%) |
| $25,000 to $29,999 | 2,437 (7.4%) | 2,497 (9.0%) |
| $30,000 to $34,999 | 1,860 (5.6%) | 1,936 (7.0%) |
| $35,000 to $39,999 | 1,690 (5.1%) | 2,111 (7.6%) |
| $40,000 to $44,999 | 1,679 (5.1%) | 1,609 (5.8%) |
| $45,000 to $49,999 | 1,901 (5.7%) | 1,364 (4.9%) |
| $50,000 to $54,999 | 1,394 (4.2%) | 1,180 (4.3%) |
| $55,000 to $64,999 | 2,550 (7.7%) | 1,764 (6.4%) |
| $65,000 to $74,999 | 2,322 (7.0%) | 890 (3.2%) |
| $75,000 to $99,999 | 3,176 (9.6%) | 1,344 (4.9%) |
| $100,000+ | 2,808 (8.5%) | 855 (3.1%) |
| Total | 33,115 (100.0%) | 27,673 (100.0%) |
Earnings by Sex by Educational Attainment in Comanche County
Average earnings in Comanche County are $47,046 for men and $33,088 for women, a difference of 29.7%. Men with an educational attainment of graduate degree enjoy the highest average annual earnings of $75,742, while those with less than high school education earn the least with $22,694. Women with an educational attainment of graduate degree earn the most with the average annual earnings of $47,398, while those with less than high school education have the smallest earnings of $17,914.
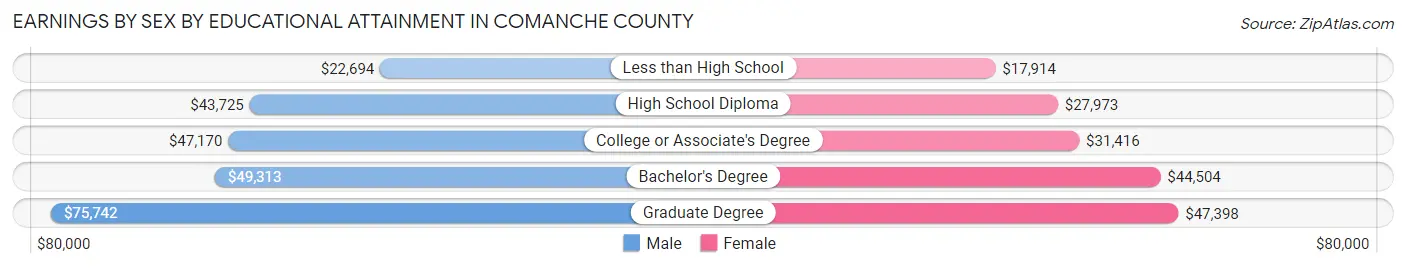
| Educational Attainment | Male Income | Female Income |
| Less than High School | $22,694 | $17,914 |
| High School Diploma | $43,725 | $27,973 |
| College or Associate's Degree | $47,170 | $31,416 |
| Bachelor's Degree | $49,313 | $44,504 |
| Graduate Degree | $75,742 | $47,398 |
| Total | $47,046 | $33,088 |
Family Income in Comanche County
Family Income Brackets in Comanche County
According to the Comanche County family income data, there are 5,689 families falling into the $100,000 to $149,999 income range, which is the most common income bracket and makes up 20.2% of all families. Conversely, the $10,000 to $14,999 income bracket is the least frequent group with only 732 families (2.6%) belonging to this category.
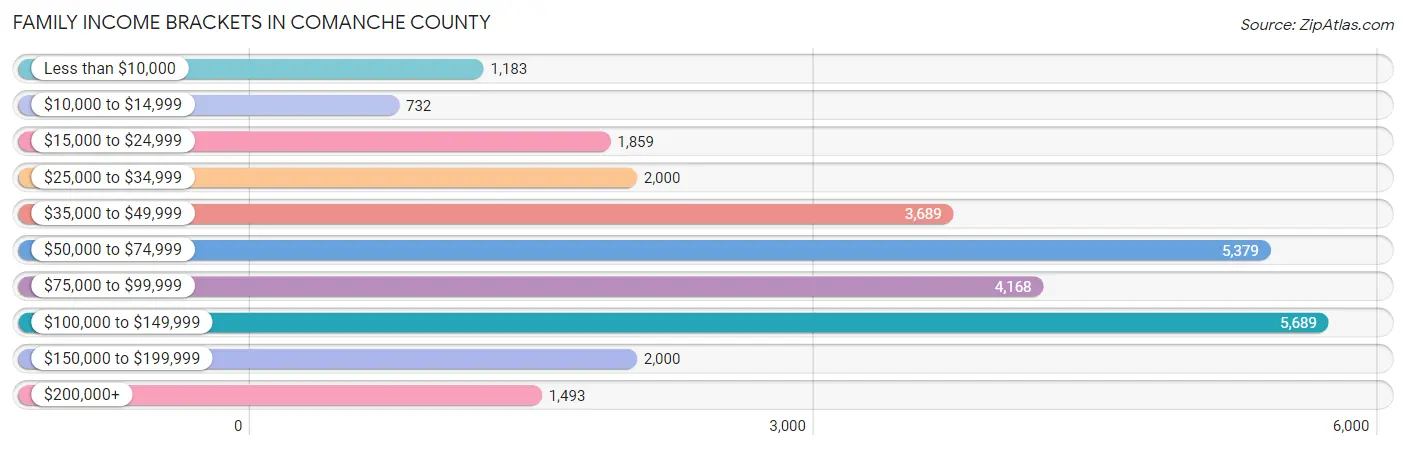
| Income Bracket | # Families | % Families |
| Less than $10,000 | 1,183 | 4.2% |
| $10,000 to $14,999 | 732 | 2.6% |
| $15,000 to $24,999 | 1,859 | 6.6% |
| $25,000 to $34,999 | 2,000 | 7.1% |
| $35,000 to $49,999 | 3,689 | 13.1% |
| $50,000 to $74,999 | 5,379 | 19.1% |
| $75,000 to $99,999 | 4,168 | 14.8% |
| $100,000 to $149,999 | 5,689 | 20.2% |
| $150,000 to $199,999 | 2,000 | 7.1% |
| $200,000+ | 1,493 | 5.3% |
Family Income by Famaliy Size in Comanche County
7+ person families (422 | 1.5%) account for the highest median family income in Comanche County with $97,500 per family, while 2-person families (13,162 | 46.7%) have the highest median income of $32,198 per family member.
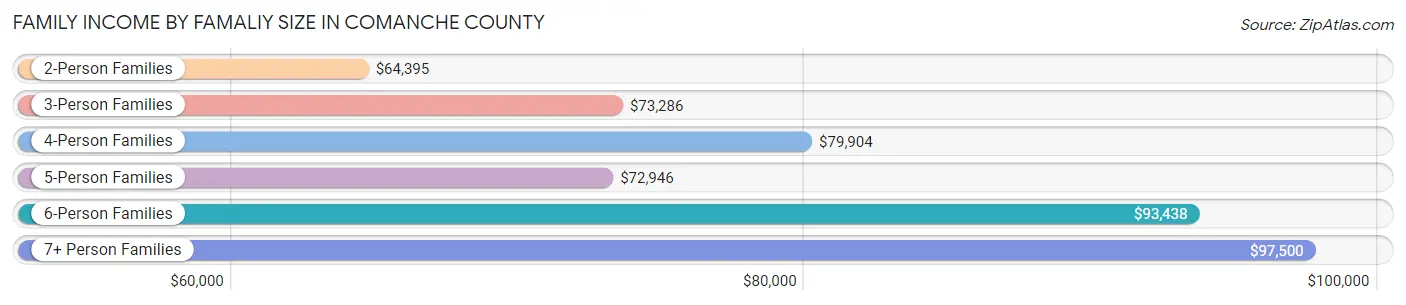
| Income Bracket | # Families | Median Income |
| 2-Person Families | 13,162 (46.7%) | $64,395 |
| 3-Person Families | 5,959 (21.2%) | $73,286 |
| 4-Person Families | 5,123 (18.2%) | $79,904 |
| 5-Person Families | 2,457 (8.7%) | $72,946 |
| 6-Person Families | 1,041 (3.7%) | $93,438 |
| 7+ Person Families | 422 (1.5%) | $97,500 |
| Total | 28,164 (100.0%) | $70,878 |
Family Income by Number of Earners in Comanche County
The median family income in Comanche County is $70,878, with families comprising 3+ earners (1,898) having the highest median family income of $125,188, while families with no earners (4,630) have the lowest median family income of $50,563, accounting for 6.7% and 16.4% of families, respectively.
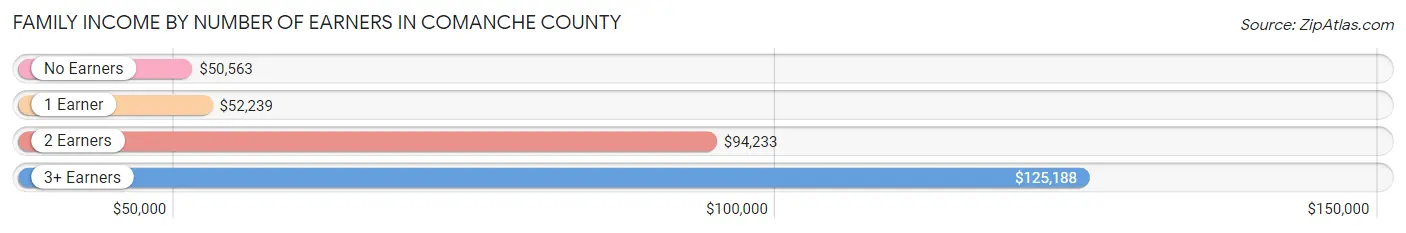
| Number of Earners | # Families | Median Income |
| No Earners | 4,630 (16.4%) | $50,563 |
| 1 Earner | 11,164 (39.6%) | $52,239 |
| 2 Earners | 10,472 (37.2%) | $94,233 |
| 3+ Earners | 1,898 (6.7%) | $125,188 |
| Total | 28,164 (100.0%) | $70,878 |
Household Income in Comanche County
Household Income Brackets in Comanche County
With 8,575 households falling in the category, the $50,000 to $74,999 income range is the most frequent in Comanche County, accounting for 19.3% of all households. In contrast, only 1,910 households (4.3%) fall into the $200,000+ income bracket, making it the least populous group.
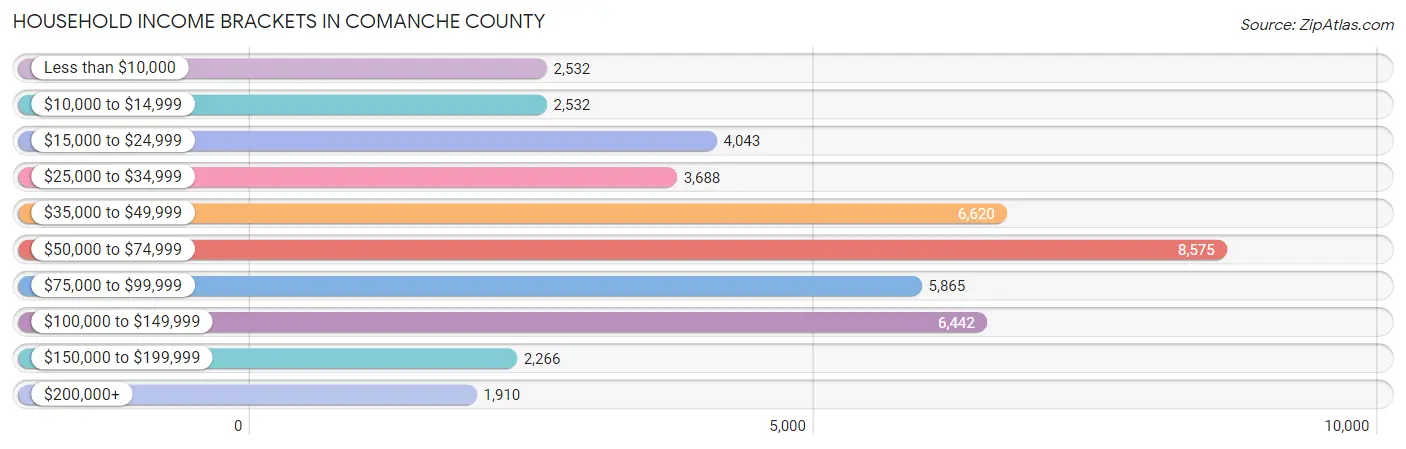
| Income Bracket | # Households | % Households |
| Less than $10,000 | 2,532 | 5.7% |
| $10,000 to $14,999 | 2,532 | 5.7% |
| $15,000 to $24,999 | 4,043 | 9.1% |
| $25,000 to $34,999 | 3,688 | 8.3% |
| $35,000 to $49,999 | 6,620 | 14.9% |
| $50,000 to $74,999 | 8,575 | 19.3% |
| $75,000 to $99,999 | 5,865 | 13.2% |
| $100,000 to $149,999 | 6,442 | 14.5% |
| $150,000 to $199,999 | 2,266 | 5.1% |
| $200,000+ | 1,910 | 4.3% |
Household Income by Householder Age in Comanche County
The median household income in Comanche County is $57,150, with the highest median household income of $69,341 found in the 45 to 64 years age bracket for the primary householder. A total of 15,046 households (33.9%) fall into this category. Meanwhile, the 15 to 24 years age bracket for the primary householder has the lowest median household income of $41,663, with 3,069 households (6.9%) in this group.
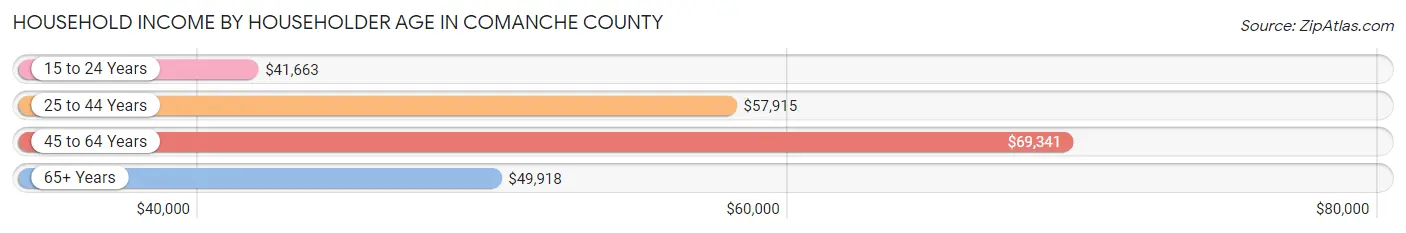
| Income Bracket | # Households | Median Income |
| 15 to 24 Years | 3,069 (6.9%) | $41,663 |
| 25 to 44 Years | 16,535 (37.2%) | $57,915 |
| 45 to 64 Years | 15,046 (33.9%) | $69,341 |
| 65+ Years | 9,779 (22.0%) | $49,918 |
| Total | 44,429 (100.0%) | $57,150 |
Poverty in Comanche County
Income Below Poverty by Sex and Age in Comanche County
With 16.1% poverty level for males and 17.1% for females among the residents of Comanche County, 5 year old males and 5 year old females are the most vulnerable to poverty, with 226 males (27.9%) and 308 females (32.8%) in their respective age groups living below the poverty level.
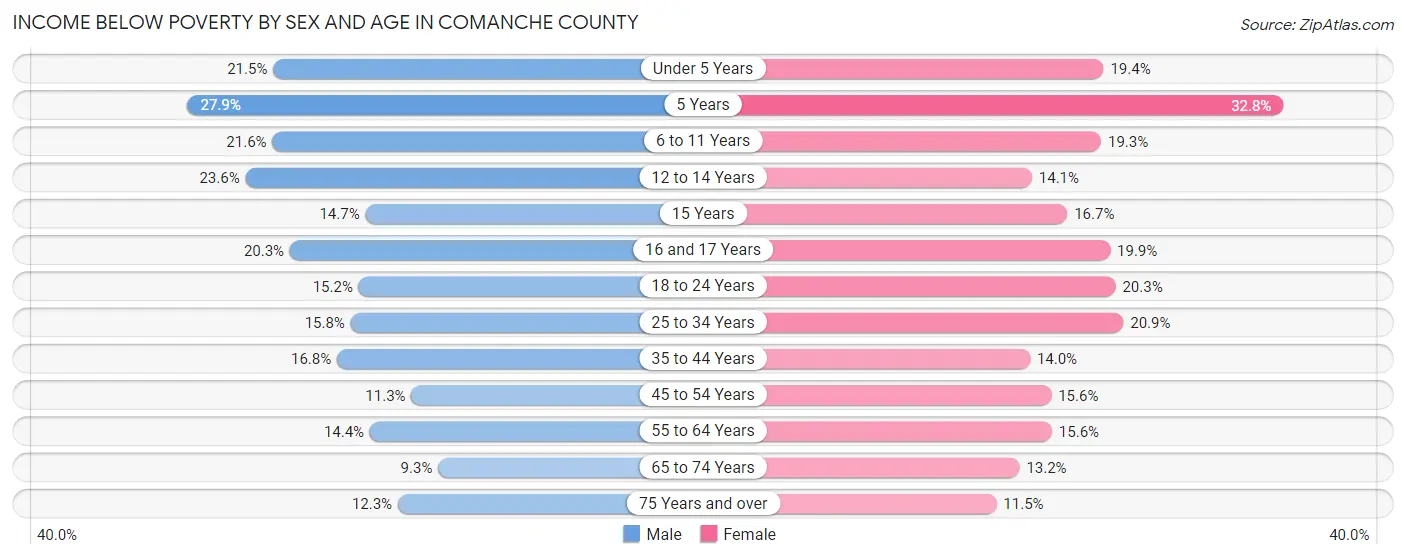
| Age Bracket | Male | Female |
| Under 5 Years | 869 (21.5%) | 772 (19.4%) |
| 5 Years | 226 (27.9%) | 308 (32.8%) |
| 6 to 11 Years | 1,036 (21.6%) | 846 (19.3%) |
| 12 to 14 Years | 577 (23.6%) | 346 (14.1%) |
| 15 Years | 98 (14.7%) | 121 (16.7%) |
| 16 and 17 Years | 287 (20.3%) | 282 (19.9%) |
| 18 to 24 Years | 866 (15.2%) | 984 (20.3%) |
| 25 to 34 Years | 1,374 (15.8%) | 1,863 (20.9%) |
| 35 to 44 Years | 1,244 (16.8%) | 1,033 (14.0%) |
| 45 to 54 Years | 688 (11.3%) | 969 (15.5%) |
| 55 to 64 Years | 953 (14.4%) | 1,088 (15.6%) |
| 65 to 74 Years | 399 (9.3%) | 637 (13.2%) |
| 75 Years and over | 292 (12.3%) | 403 (11.5%) |
| Total | 8,909 (16.1%) | 9,652 (17.1%) |
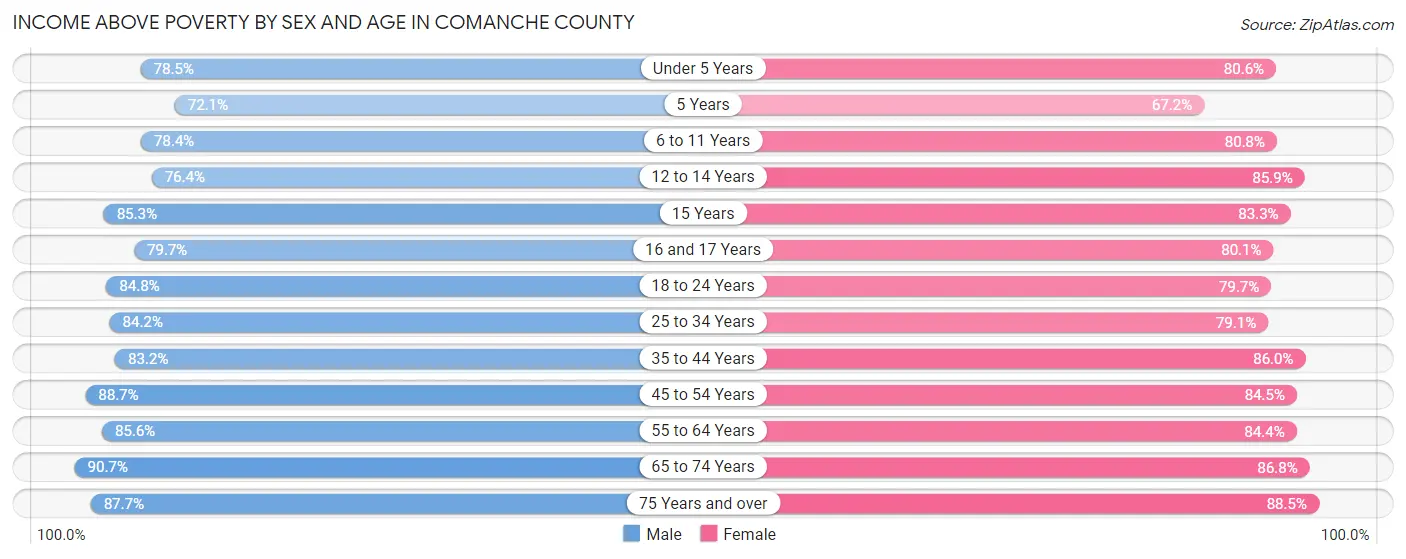
Income Above Poverty by Sex and Age in Comanche County
According to the poverty statistics in Comanche County, males aged 65 to 74 years and females aged 75 years and over are the age groups that are most secure financially, with 90.7% of males and 88.5% of females in these age groups living above the poverty line.
| Age Bracket | Male | Female |
| Under 5 Years | 3,166 (78.5%) | 3,202 (80.6%) |
| 5 Years | 584 (72.1%) | 632 (67.2%) |
| 6 to 11 Years | 3,761 (78.4%) | 3,548 (80.7%) |
| 12 to 14 Years | 1,868 (76.4%) | 2,107 (85.9%) |
| 15 Years | 569 (85.3%) | 602 (83.3%) |
| 16 and 17 Years | 1,127 (79.7%) | 1,134 (80.1%) |
| 18 to 24 Years | 4,835 (84.8%) | 3,858 (79.7%) |
| 25 to 34 Years | 7,328 (84.2%) | 7,052 (79.1%) |
| 35 to 44 Years | 6,161 (83.2%) | 6,361 (86.0%) |
| 45 to 54 Years | 5,410 (88.7%) | 5,264 (84.5%) |
| 55 to 64 Years | 5,682 (85.6%) | 5,885 (84.4%) |
| 65 to 74 Years | 3,895 (90.7%) | 4,192 (86.8%) |
| 75 Years and over | 2,086 (87.7%) | 3,106 (88.5%) |
| Total | 46,472 (83.9%) | 46,943 (83.0%) |
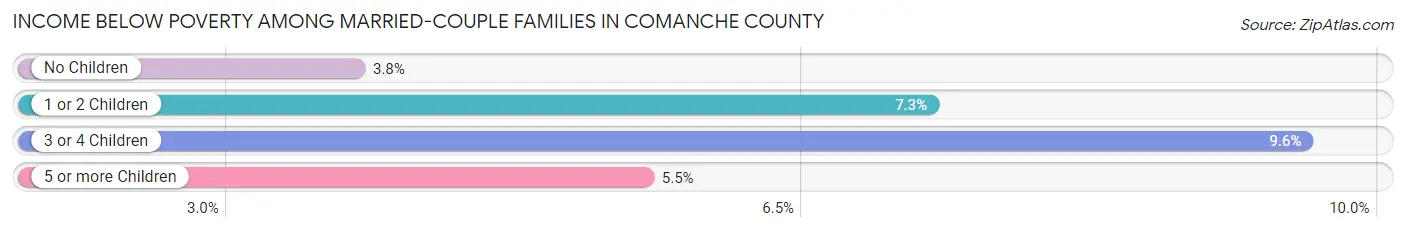
Income Below Poverty Among Married-Couple Families in Comanche County
The poverty statistics for married-couple families in Comanche County show that 5.6% or 1,078 of the total 19,221 families live below the poverty line. Families with 3 or 4 children have the highest poverty rate of 9.6%, comprising of 187 families. On the other hand, families with no children have the lowest poverty rate of 3.8%, which includes 388 families.
| Children | Above Poverty | Below Poverty |
| No Children | 9,883 (96.2%) | 388 (3.8%) |
| 1 or 2 Children | 6,198 (92.7%) | 486 (7.3%) |
| 3 or 4 Children | 1,772 (90.4%) | 187 (9.6%) |
| 5 or more Children | 290 (94.5%) | 17 (5.5%) |
| Total | 18,143 (94.4%) | 1,078 (5.6%) |
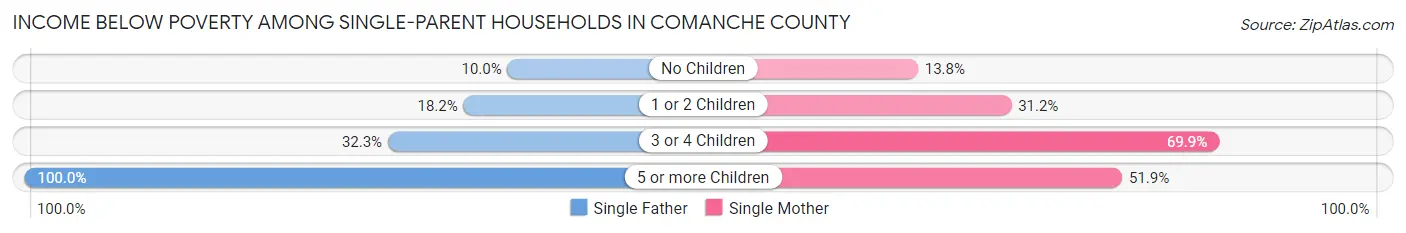
Income Below Poverty Among Single-Parent Households in Comanche County
According to the poverty data in Comanche County, 16.5% or 377 single-father households and 31.6% or 2,103 single-mother households are living below the poverty line. Among single-father households, those with 5 or more children have the highest poverty rate, with 4 households (100.0%) experiencing poverty. Likewise, among single-mother households, those with 3 or 4 children have the highest poverty rate, with 611 households (69.9%) falling below the poverty line.
| Children | Single Father | Single Mother |
| No Children | 80 (10.0%) | 258 (13.8%) |
| 1 or 2 Children | 240 (18.2%) | 1,206 (31.2%) |
| 3 or 4 Children | 53 (32.3%) | 611 (69.9%) |
| 5 or more Children | 4 (100.0%) | 28 (51.8%) |
| Total | 377 (16.5%) | 2,103 (31.6%) |
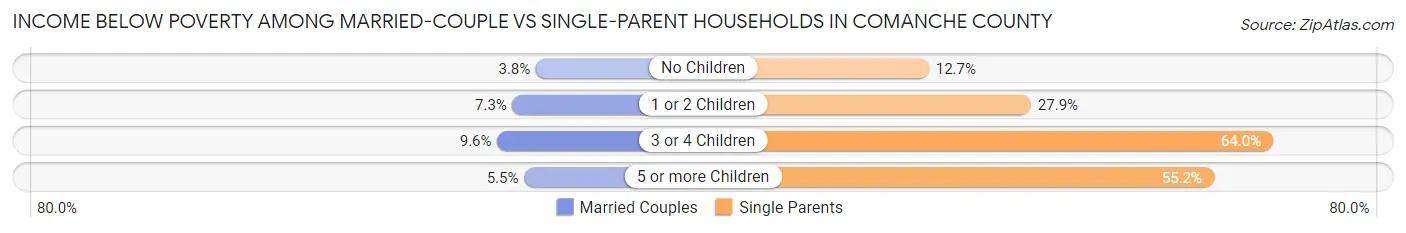
Income Below Poverty Among Married-Couple vs Single-Parent Households in Comanche County
The poverty data for Comanche County shows that 1,078 of the married-couple family households (5.6%) and 2,480 of the single-parent households (27.7%) are living below the poverty level. Within the married-couple family households, those with 3 or 4 children have the highest poverty rate, with 187 households (9.6%) falling below the poverty line. Among the single-parent households, those with 3 or 4 children have the highest poverty rate, with 664 household (64.0%) living below poverty.
| Children | Married-Couple Families | Single-Parent Households |
| No Children | 388 (3.8%) | 338 (12.7%) |
| 1 or 2 Children | 486 (7.3%) | 1,446 (27.9%) |
| 3 or 4 Children | 187 (9.6%) | 664 (64.0%) |
| 5 or more Children | 17 (5.5%) | 32 (55.2%) |
| Total | 1,078 (5.6%) | 2,480 (27.7%) |
Employment Characteristics in Comanche County
Employment by Class of Employer in Comanche County
Among the 53,915 employed individuals in Comanche County, private company employees (25,875 | 48.0%), federal government employees (14,748 | 27.4%), and local government employees (3,701 | 6.9%) make up the most common classes of employment.
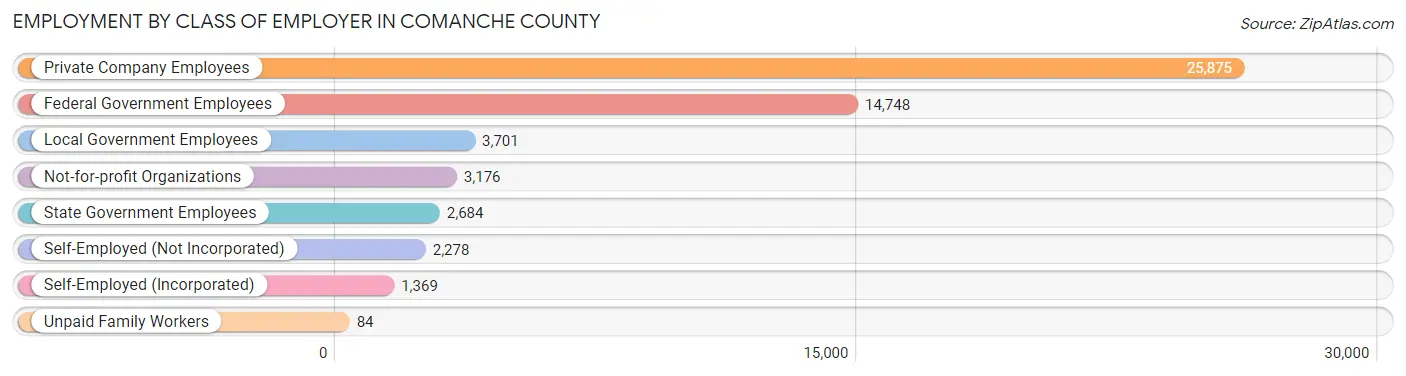
| Employer Class | # Employees | % Employees |
| Private Company Employees | 25,875 | 48.0% |
| Self-Employed (Incorporated) | 1,369 | 2.5% |
| Self-Employed (Not Incorporated) | 2,278 | 4.2% |
| Not-for-profit Organizations | 3,176 | 5.9% |
| Local Government Employees | 3,701 | 6.9% |
| State Government Employees | 2,684 | 5.0% |
| Federal Government Employees | 14,748 | 27.4% |
| Unpaid Family Workers | 84 | 0.2% |
| Total | 53,915 | 100.0% |
Employment Status by Age in Comanche County
According to the labor force statistics for Comanche County, out of the total population over 16 years of age (95,940), 60.9% or 58,427 individuals are in the labor force, with 6.6% or 3,856 of them unemployed. The age group with the highest labor force participation rate is 20 to 24 years, with 81.8% or 8,572 individuals in the labor force. Within the labor force, the 16 to 19 years age range has the highest percentage of unemployed individuals, with 24.7% or 857 of them being unemployed.
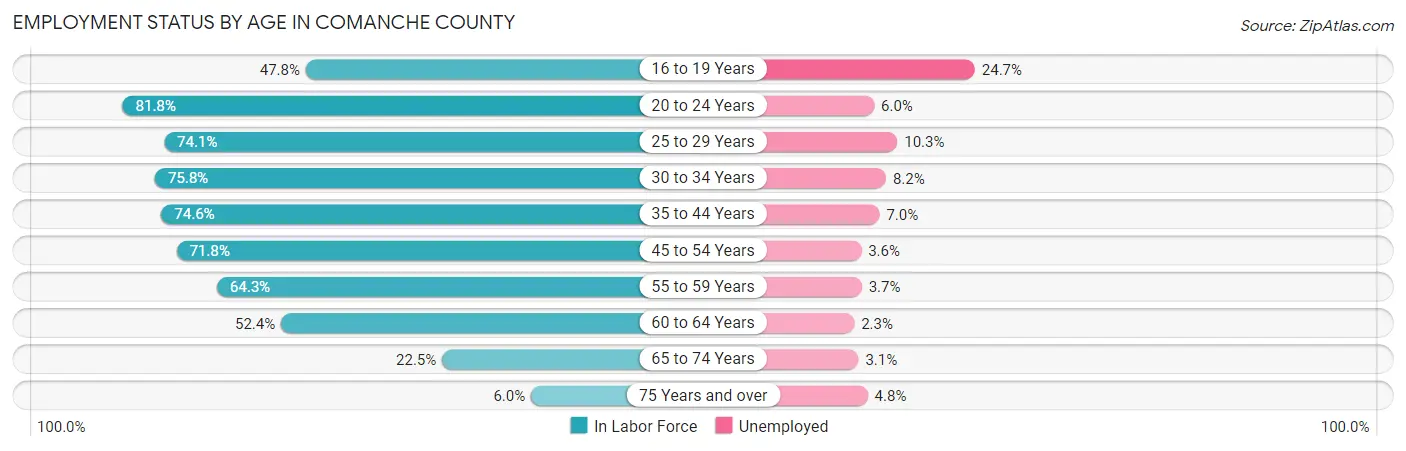
| Age Bracket | In Labor Force | Unemployed |
| 16 to 19 Years | 3,469 (47.8%) | 857 (24.7%) |
| 20 to 24 Years | 8,572 (81.8%) | 514 (6.0%) |
| 25 to 29 Years | 7,643 (74.1%) | 787 (10.3%) |
| 30 to 34 Years | 7,344 (75.8%) | 602 (8.2%) |
| 35 to 44 Years | 11,746 (74.6%) | 822 (7.0%) |
| 45 to 54 Years | 9,114 (71.8%) | 328 (3.6%) |
| 55 to 59 Years | 4,422 (64.3%) | 164 (3.7%) |
| 60 to 64 Years | 3,631 (52.4%) | 84 (2.3%) |
| 65 to 74 Years | 2,110 (22.5%) | 65 (3.1%) |
| 75 Years and over | 395 (6.0%) | 19 (4.8%) |
| Total | 58,427 (60.9%) | 3,856 (6.6%) |
Employment Status by Educational Attainment in Comanche County
According to labor force statistics for Comanche County, 70.5% of individuals (43,885) out of the total population between 25 and 64 years of age (62,248) are in the labor force, with 6.1% or 2,677 of them being unemployed. The group with the highest labor force participation rate are those with the educational attainment of bachelor's degree or higher, with 84.8% or 12,472 individuals in the labor force. Within the labor force, individuals with less than high school education have the highest percentage of unemployment, with 16.3% or 430 of them being unemployed.
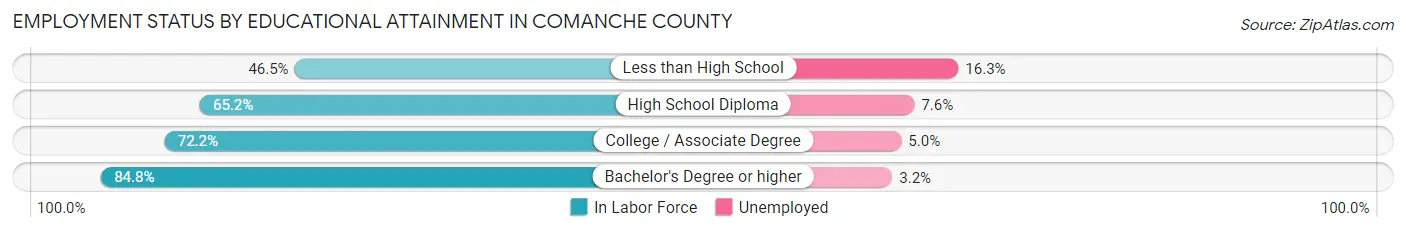
| Educational Attainment | In Labor Force | Unemployed |
| Less than High School | 2,640 (46.5%) | 925 (16.3%) |
| High School Diploma | 13,355 (65.2%) | 1,557 (7.6%) |
| College / Associate Degree | 15,436 (72.2%) | 1,069 (5.0%) |
| Bachelor's Degree or higher | 12,472 (84.8%) | 471 (3.2%) |
| Total | 43,885 (70.5%) | 3,797 (6.1%) |
Employment Occupations by Sex in Comanche County
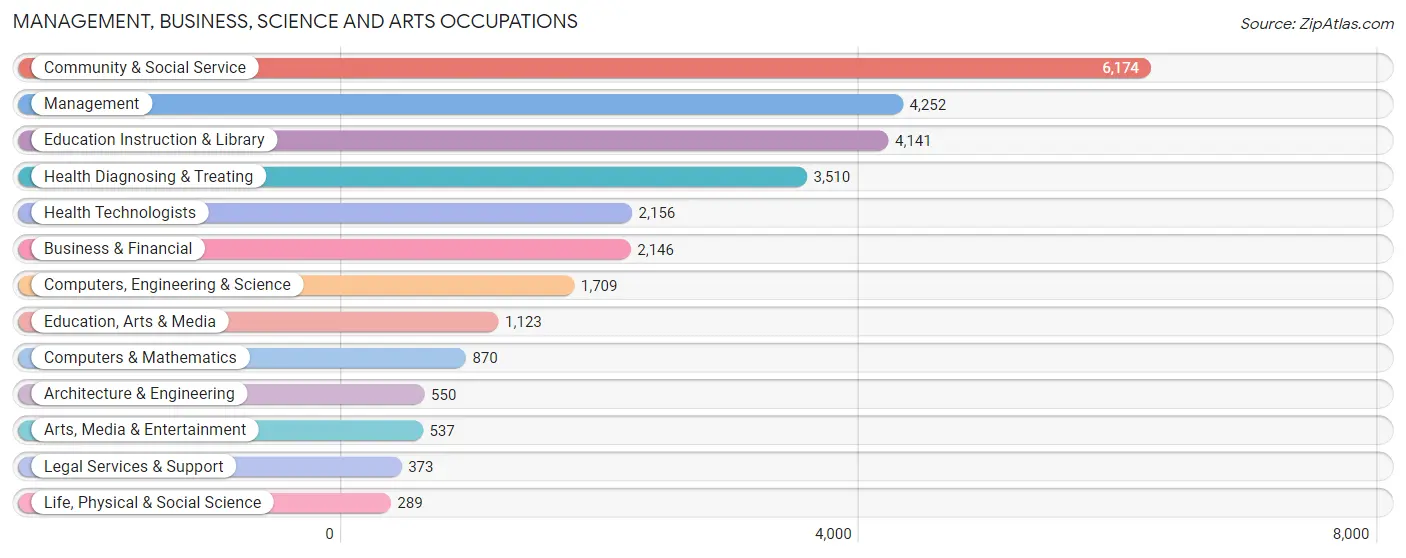
Management, Business, Science and Arts Occupations
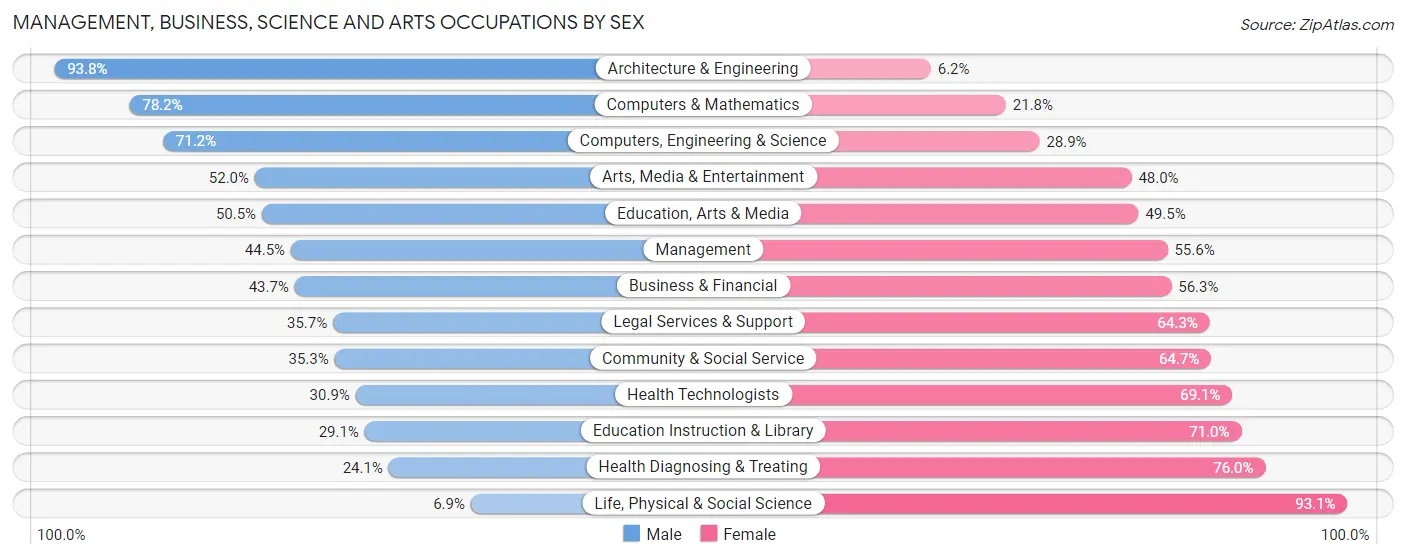
The most common Management, Business, Science and Arts occupations in Comanche County are Community & Social Service (6,174 | 13.5%), Management (4,252 | 9.3%), Education Instruction & Library (4,141 | 9.0%), Health Diagnosing & Treating (3,510 | 7.7%), and Health Technologists (2,156 | 4.7%).
Management, Business, Science and Arts Occupations by Sex
Within the Management, Business, Science and Arts occupations in Comanche County, the most male-oriented occupations are Architecture & Engineering (93.8%), Computers & Mathematics (78.2%), and Computers, Engineering & Science (71.2%), while the most female-oriented occupations are Life, Physical & Social Science (93.1%), Health Diagnosing & Treating (75.9%), and Education Instruction & Library (71.0%).
| Occupation | Male | Female |
| Management | 1,890 (44.5%) | 2,362 (55.5%) |
| Business & Financial | 937 (43.7%) | 1,209 (56.3%) |
| Computers, Engineering & Science | 1,216 (71.2%) | 493 (28.8%) |
| Computers & Mathematics | 680 (78.2%) | 190 (21.8%) |
| Architecture & Engineering | 516 (93.8%) | 34 (6.2%) |
| Life, Physical & Social Science | 20 (6.9%) | 269 (93.1%) |
| Community & Social Service | 2,182 (35.3%) | 3,992 (64.7%) |
| Education, Arts & Media | 567 (50.5%) | 556 (49.5%) |
| Legal Services & Support | 133 (35.7%) | 240 (64.3%) |
| Education Instruction & Library | 1,203 (29.0%) | 2,938 (71.0%) |
| Arts, Media & Entertainment | 279 (52.0%) | 258 (48.0%) |
| Health Diagnosing & Treating | 844 (24.0%) | 2,666 (75.9%) |
| Health Technologists | 667 (30.9%) | 1,489 (69.1%) |
| Total (Category) | 7,069 (39.7%) | 10,722 (60.3%) |
| Total (Overall) | 22,509 (49.2%) | 23,241 (50.8%) |
Services Occupations
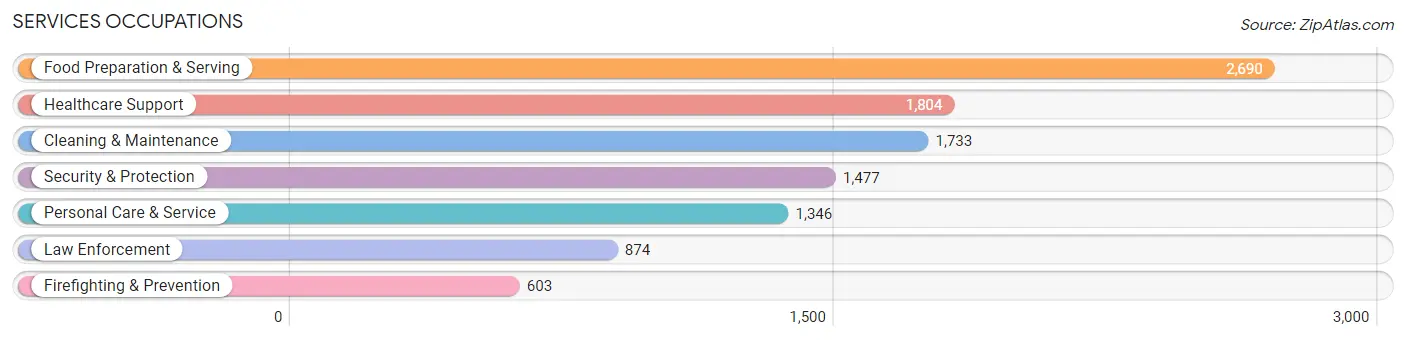
The most common Services occupations in Comanche County are Food Preparation & Serving (2,690 | 5.9%), Healthcare Support (1,804 | 3.9%), Cleaning & Maintenance (1,733 | 3.8%), Security & Protection (1,477 | 3.2%), and Personal Care & Service (1,346 | 2.9%).
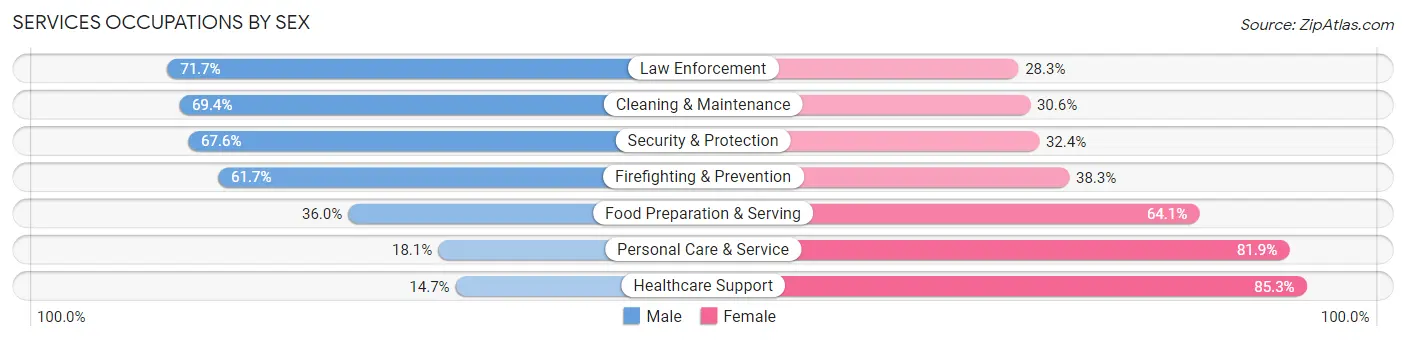
Services Occupations by Sex
Within the Services occupations in Comanche County, the most male-oriented occupations are Law Enforcement (71.7%), Cleaning & Maintenance (69.4%), and Security & Protection (67.6%), while the most female-oriented occupations are Healthcare Support (85.3%), Personal Care & Service (81.9%), and Food Preparation & Serving (64.0%).
| Occupation | Male | Female |
| Healthcare Support | 265 (14.7%) | 1,539 (85.3%) |
| Security & Protection | 999 (67.6%) | 478 (32.4%) |
| Firefighting & Prevention | 372 (61.7%) | 231 (38.3%) |
| Law Enforcement | 627 (71.7%) | 247 (28.3%) |
| Food Preparation & Serving | 967 (35.9%) | 1,723 (64.0%) |
| Cleaning & Maintenance | 1,203 (69.4%) | 530 (30.6%) |
| Personal Care & Service | 244 (18.1%) | 1,102 (81.9%) |
| Total (Category) | 3,678 (40.6%) | 5,372 (59.4%) |
| Total (Overall) | 22,509 (49.2%) | 23,241 (50.8%) |
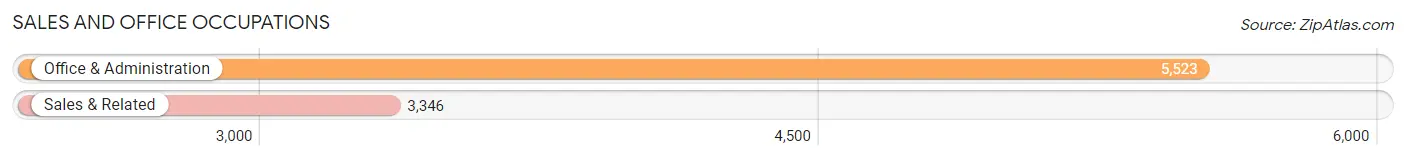
Sales and Office Occupations
The most common Sales and Office occupations in Comanche County are Office & Administration (5,523 | 12.1%), and Sales & Related (3,346 | 7.3%).
Sales and Office Occupations by Sex
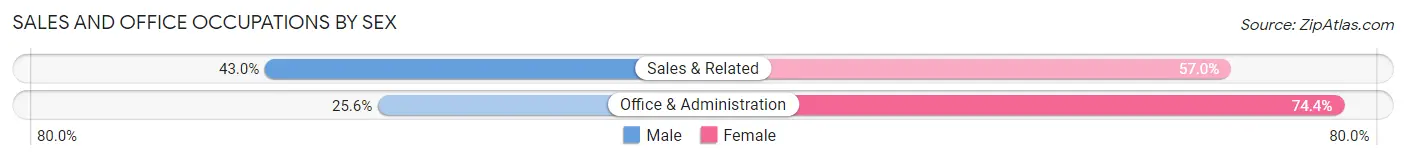
| Occupation | Male | Female |
| Sales & Related | 1,439 (43.0%) | 1,907 (57.0%) |
| Office & Administration | 1,415 (25.6%) | 4,108 (74.4%) |
| Total (Category) | 2,854 (32.2%) | 6,015 (67.8%) |
| Total (Overall) | 22,509 (49.2%) | 23,241 (50.8%) |
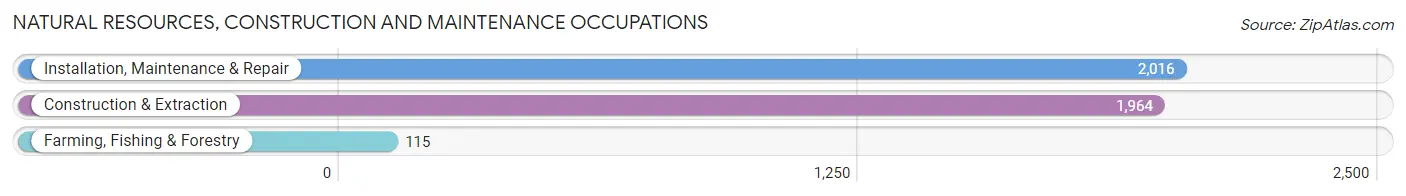
Natural Resources, Construction and Maintenance Occupations
The most common Natural Resources, Construction and Maintenance occupations in Comanche County are Installation, Maintenance & Repair (2,016 | 4.4%), Construction & Extraction (1,964 | 4.3%), and Farming, Fishing & Forestry (115 | 0.3%).
Natural Resources, Construction and Maintenance Occupations by Sex
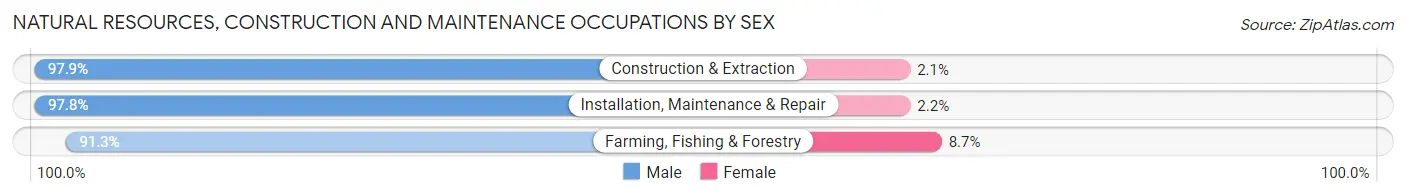
| Occupation | Male | Female |
| Farming, Fishing & Forestry | 105 (91.3%) | 10 (8.7%) |
| Construction & Extraction | 1,922 (97.9%) | 42 (2.1%) |
| Installation, Maintenance & Repair | 1,972 (97.8%) | 44 (2.2%) |
| Total (Category) | 3,999 (97.7%) | 96 (2.3%) |
| Total (Overall) | 22,509 (49.2%) | 23,241 (50.8%) |
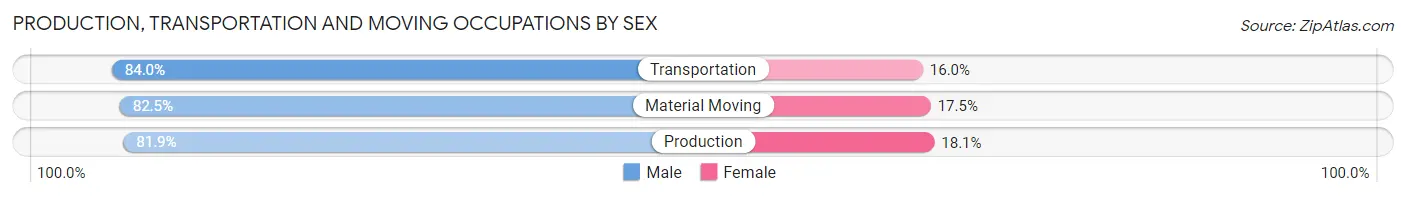
Production, Transportation and Moving Occupations
The most common Production, Transportation and Moving occupations in Comanche County are Production (2,862 | 6.3%), Material Moving (1,591 | 3.5%), and Transportation (1,492 | 3.3%).
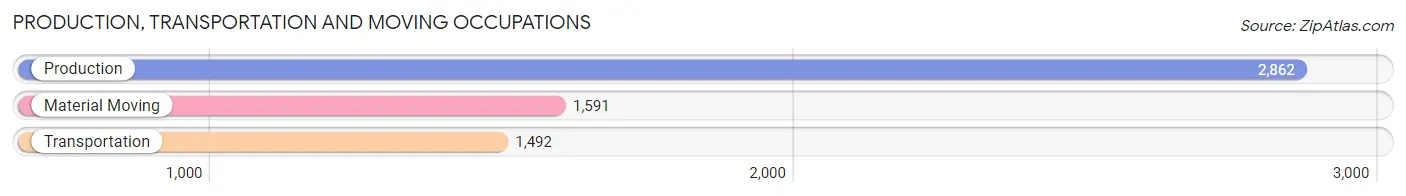
Production, Transportation and Moving Occupations by Sex
| Occupation | Male | Female |
| Production | 2,343 (81.9%) | 519 (18.1%) |
| Transportation | 1,253 (84.0%) | 239 (16.0%) |
| Material Moving | 1,313 (82.5%) | 278 (17.5%) |
| Total (Category) | 4,909 (82.6%) | 1,036 (17.4%) |
| Total (Overall) | 22,509 (49.2%) | 23,241 (50.8%) |
Employment Industries by Sex in Comanche County
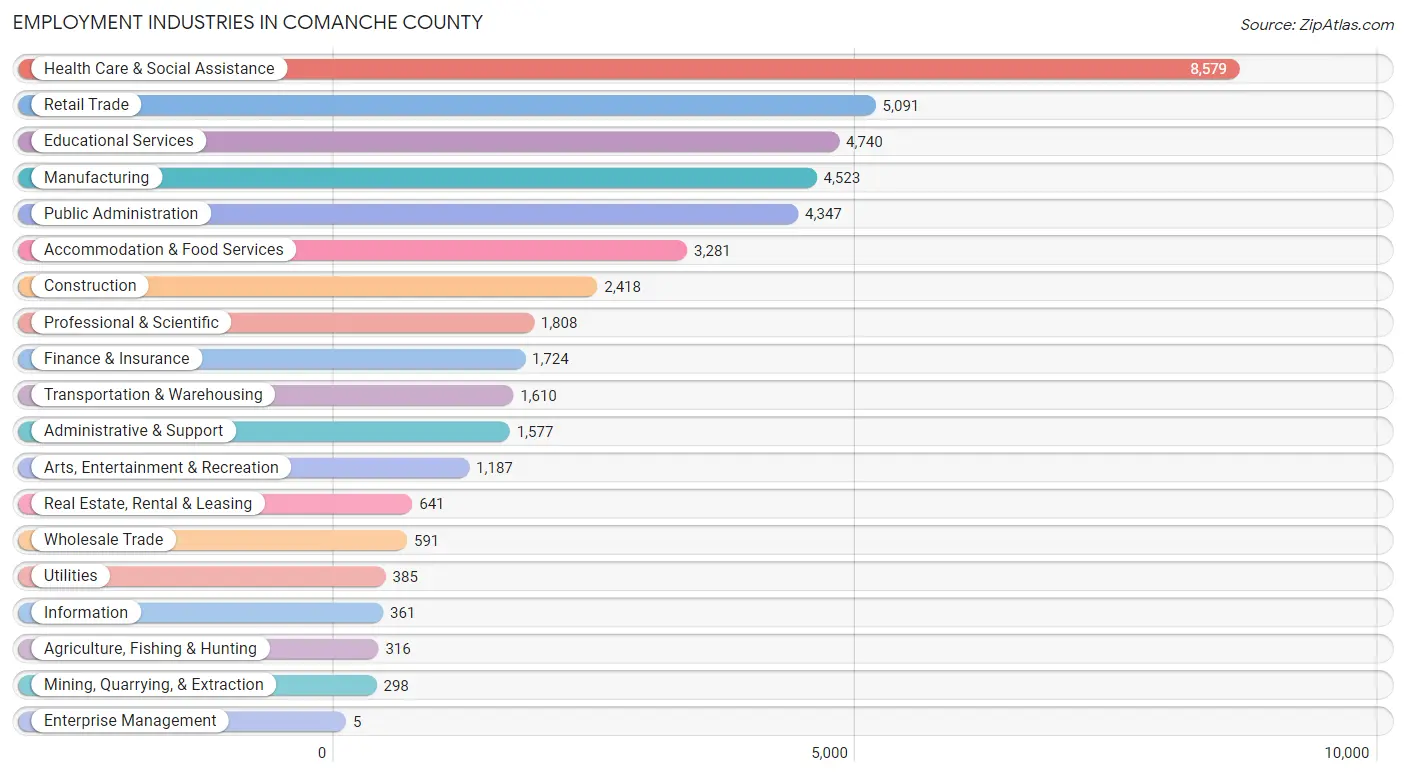
Employment Industries in Comanche County
The major employment industries in Comanche County include Health Care & Social Assistance (8,579 | 18.8%), Retail Trade (5,091 | 11.1%), Educational Services (4,740 | 10.4%), Manufacturing (4,523 | 9.9%), and Public Administration (4,347 | 9.5%).
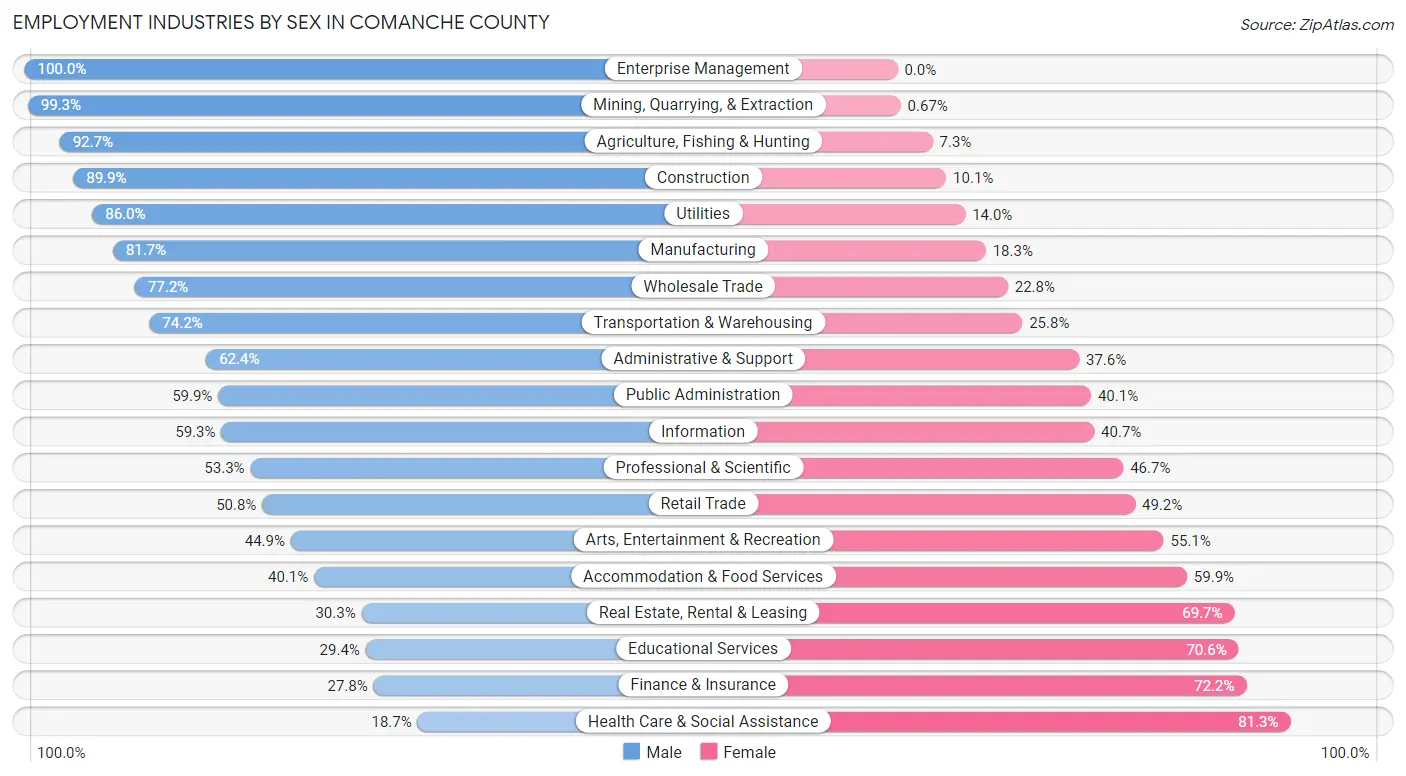
Employment Industries by Sex in Comanche County
The Comanche County industries that see more men than women are Enterprise Management (100.0%), Mining, Quarrying, & Extraction (99.3%), and Agriculture, Fishing & Hunting (92.7%), whereas the industries that tend to have a higher number of women are Health Care & Social Assistance (81.3%), Finance & Insurance (72.2%), and Educational Services (70.6%).
| Industry | Male | Female |
| Agriculture, Fishing & Hunting | 293 (92.7%) | 23 (7.3%) |
| Mining, Quarrying, & Extraction | 296 (99.3%) | 2 (0.7%) |
| Construction | 2,174 (89.9%) | 244 (10.1%) |
| Manufacturing | 3,696 (81.7%) | 827 (18.3%) |
| Wholesale Trade | 456 (77.2%) | 135 (22.8%) |
| Retail Trade | 2,587 (50.8%) | 2,504 (49.2%) |
| Transportation & Warehousing | 1,194 (74.2%) | 416 (25.8%) |
| Utilities | 331 (86.0%) | 54 (14.0%) |
| Information | 214 (59.3%) | 147 (40.7%) |
| Finance & Insurance | 479 (27.8%) | 1,245 (72.2%) |
| Real Estate, Rental & Leasing | 194 (30.3%) | 447 (69.7%) |
| Professional & Scientific | 963 (53.3%) | 845 (46.7%) |
| Enterprise Management | 5 (100.0%) | 0 (0.0%) |
| Administrative & Support | 984 (62.4%) | 593 (37.6%) |
| Educational Services | 1,394 (29.4%) | 3,346 (70.6%) |
| Health Care & Social Assistance | 1,602 (18.7%) | 6,977 (81.3%) |
| Arts, Entertainment & Recreation | 533 (44.9%) | 654 (55.1%) |
| Accommodation & Food Services | 1,315 (40.1%) | 1,966 (59.9%) |
| Public Administration | 2,605 (59.9%) | 1,742 (40.1%) |
| Total | 22,509 (49.2%) | 23,241 (50.8%) |
Education in Comanche County
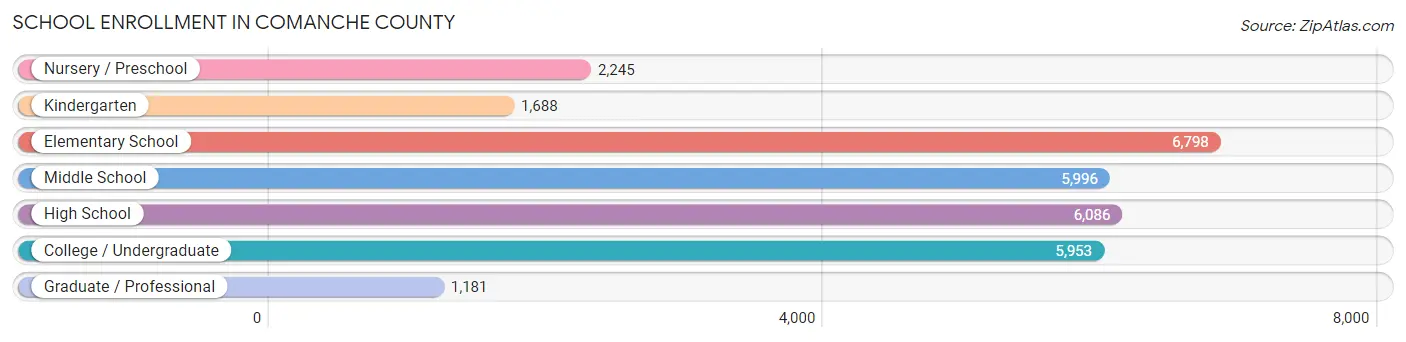
School Enrollment in Comanche County
The most common levels of schooling among the 29,947 students in Comanche County are elementary school (6,798 | 22.7%), high school (6,086 | 20.3%), and middle school (5,996 | 20.0%).
| School Level | # Students | % Students |
| Nursery / Preschool | 2,245 | 7.5% |
| Kindergarten | 1,688 | 5.6% |
| Elementary School | 6,798 | 22.7% |
| Middle School | 5,996 | 20.0% |
| High School | 6,086 | 20.3% |
| College / Undergraduate | 5,953 | 19.9% |
| Graduate / Professional | 1,181 | 3.9% |
| Total | 29,947 | 100.0% |
School Enrollment by Age by Funding Source in Comanche County
Out of a total of 29,947 students who are enrolled in schools in Comanche County, 3,324 (11.1%) attend a private institution, while the remaining 26,623 (88.9%) are enrolled in public schools. The age group of 3 to 4 year olds has the highest likelihood of being enrolled in private schools, with 343 (22.0% in the age bracket) enrolled. Conversely, the age group of 20 to 24 year olds has the lowest likelihood of being enrolled in a private school, with 2,330 (95.6% in the age bracket) attending a public institution.
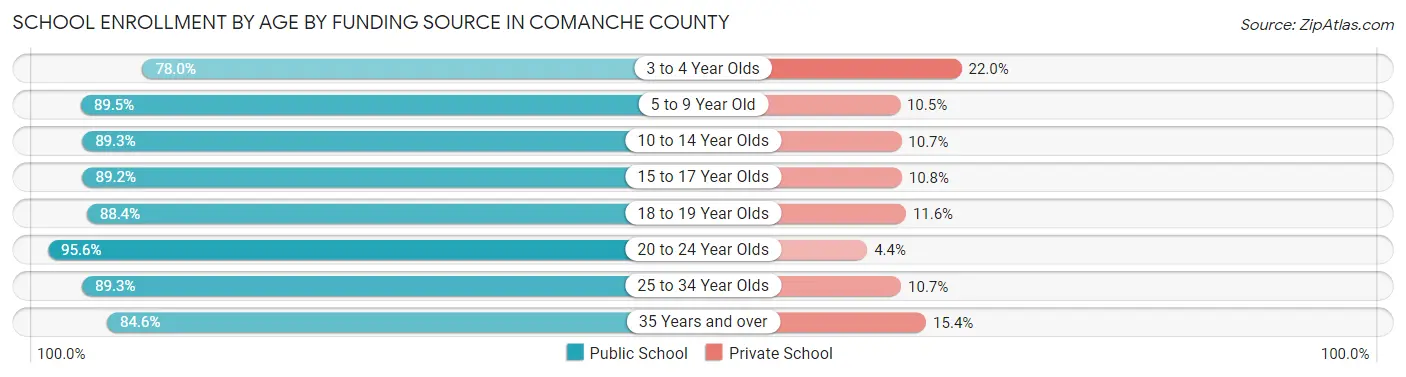
| Age Bracket | Public School | Private School |
| 3 to 4 Year Olds | 1,219 (78.0%) | 343 (22.0%) |
| 5 to 9 Year Old | 7,198 (89.5%) | 844 (10.5%) |
| 10 to 14 Year Olds | 6,814 (89.3%) | 820 (10.7%) |
| 15 to 17 Year Olds | 3,752 (89.2%) | 455 (10.8%) |
| 18 to 19 Year Olds | 1,463 (88.4%) | 192 (11.6%) |
| 20 to 24 Year Olds | 2,330 (95.6%) | 107 (4.4%) |
| 25 to 34 Year Olds | 2,095 (89.3%) | 251 (10.7%) |
| 35 Years and over | 1,747 (84.6%) | 317 (15.4%) |
| Total | 26,623 (88.9%) | 3,324 (11.1%) |
Educational Attainment by Field of Study in Comanche County
Business (3,554 | 17.4%), education (3,132 | 15.3%), arts & humanities (2,013 | 9.9%), science & technology (1,791 | 8.8%), and bio, nature & agricultural (1,438 | 7.0%) are the most common fields of study among 20,402 individuals in Comanche County who have obtained a bachelor's degree or higher.
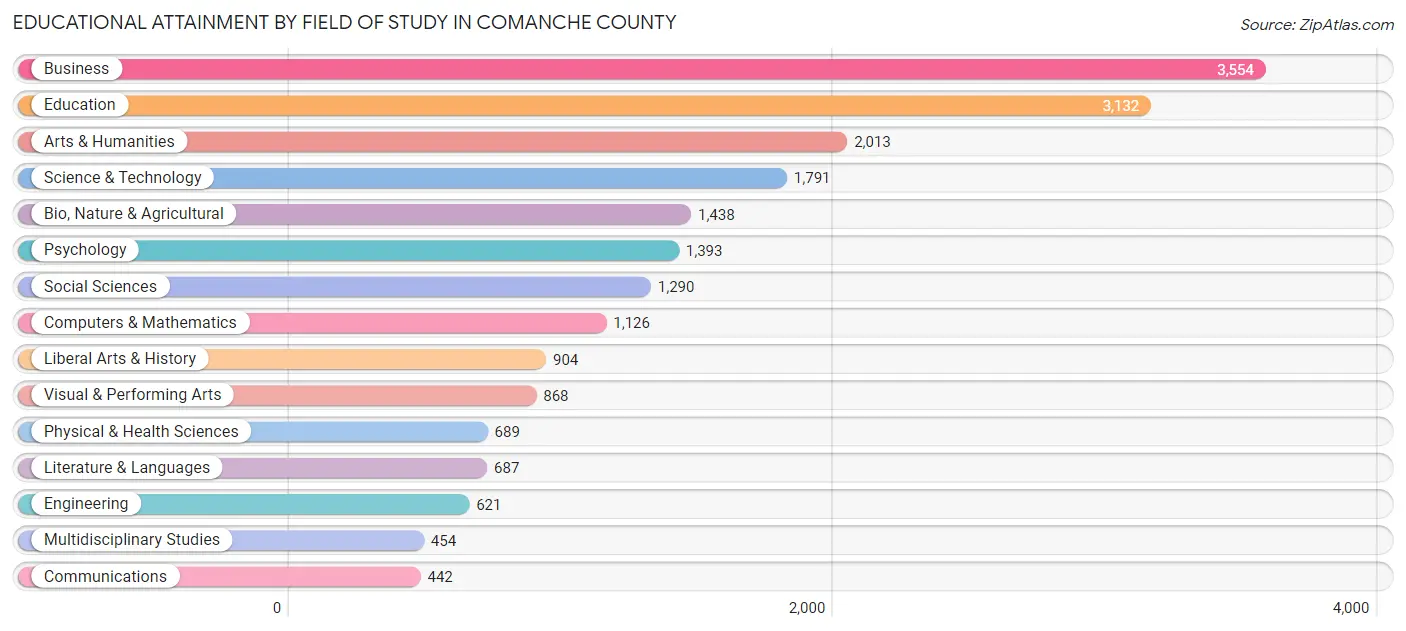
| Field of Study | # Graduates | % Graduates |
| Computers & Mathematics | 1,126 | 5.5% |
| Bio, Nature & Agricultural | 1,438 | 7.0% |
| Physical & Health Sciences | 689 | 3.4% |
| Psychology | 1,393 | 6.8% |
| Social Sciences | 1,290 | 6.3% |
| Engineering | 621 | 3.0% |
| Multidisciplinary Studies | 454 | 2.2% |
| Science & Technology | 1,791 | 8.8% |
| Business | 3,554 | 17.4% |
| Education | 3,132 | 15.3% |
| Literature & Languages | 687 | 3.4% |
| Liberal Arts & History | 904 | 4.4% |
| Visual & Performing Arts | 868 | 4.3% |
| Communications | 442 | 2.2% |
| Arts & Humanities | 2,013 | 9.9% |
| Total | 20,402 | 100.0% |
Transportation & Commute in Comanche County
Vehicle Availability by Sex in Comanche County
The most prevalent vehicle ownership categories in Comanche County are males with 2 vehicles (11,068, accounting for 42.2%) and females with 2 vehicles (9,661, making up 48.3%).
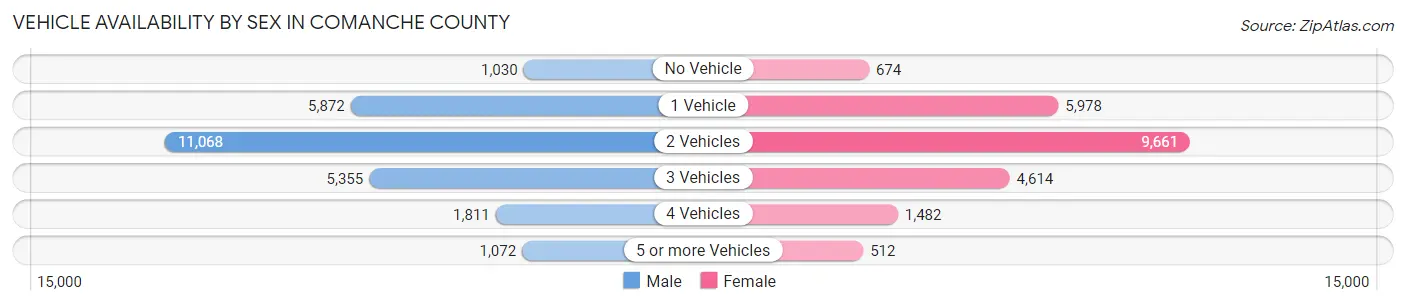
| Vehicles Available | Male | Female |
| No Vehicle | 1,030 (3.9%) | 674 (2.9%) |
| 1 Vehicle | 5,872 (22.4%) | 5,978 (26.1%) |
| 2 Vehicles | 11,068 (42.2%) | 9,661 (42.1%) |
| 3 Vehicles | 5,355 (20.4%) | 4,614 (20.1%) |
| 4 Vehicles | 1,811 (6.9%) | 1,482 (6.5%) |
| 5 or more Vehicles | 1,072 (4.1%) | 512 (2.2%) |
| Total | 26,208 (100.0%) | 22,921 (100.0%) |
Commute Time in Comanche County
The most frequently occuring commute durations in Comanche County are 15 to 19 minutes (11,745 commuters, 24.5%), 10 to 14 minutes (9,879 commuters, 20.6%), and 5 to 9 minutes (8,190 commuters, 17.1%).
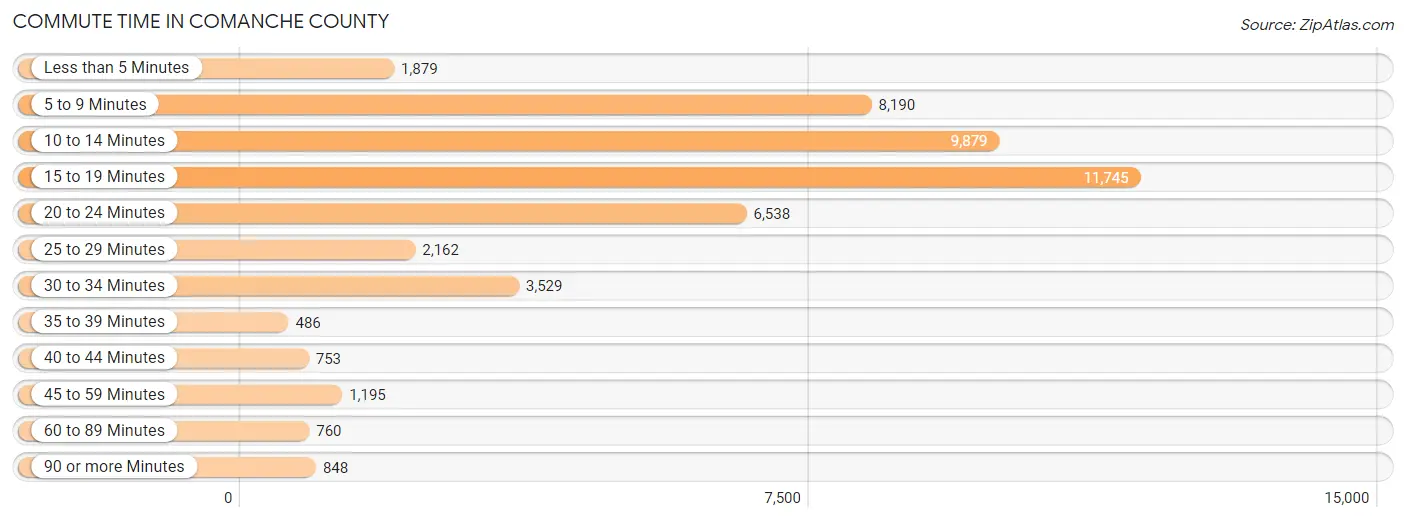
| Commute Time | # Commuters | % Commuters |
| Less than 5 Minutes | 1,879 | 3.9% |
| 5 to 9 Minutes | 8,190 | 17.1% |
| 10 to 14 Minutes | 9,879 | 20.6% |
| 15 to 19 Minutes | 11,745 | 24.5% |
| 20 to 24 Minutes | 6,538 | 13.6% |
| 25 to 29 Minutes | 2,162 | 4.5% |
| 30 to 34 Minutes | 3,529 | 7.4% |
| 35 to 39 Minutes | 486 | 1.0% |
| 40 to 44 Minutes | 753 | 1.6% |
| 45 to 59 Minutes | 1,195 | 2.5% |
| 60 to 89 Minutes | 760 | 1.6% |
| 90 or more Minutes | 848 | 1.8% |
Commute Time by Sex in Comanche County
The most common commute times in Comanche County are 15 to 19 minutes (6,570 commuters, 25.2%) for males and 15 to 19 minutes (5,175 commuters, 23.6%) for females.
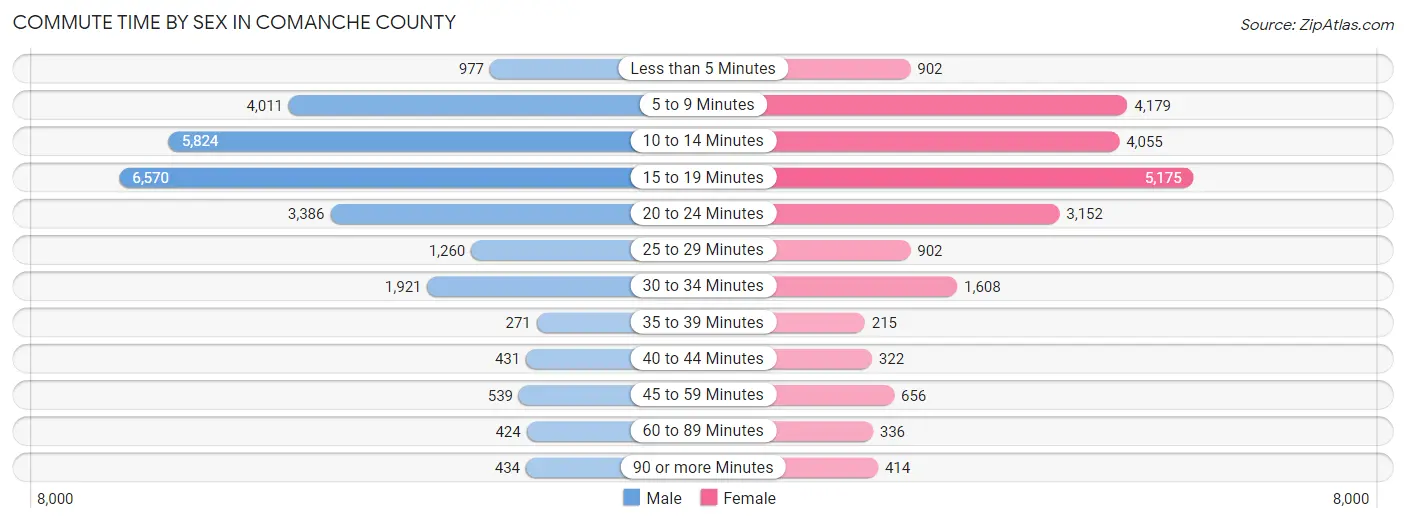
| Commute Time | Male | Female |
| Less than 5 Minutes | 977 (3.7%) | 902 (4.1%) |
| 5 to 9 Minutes | 4,011 (15.4%) | 4,179 (19.1%) |
| 10 to 14 Minutes | 5,824 (22.4%) | 4,055 (18.5%) |
| 15 to 19 Minutes | 6,570 (25.2%) | 5,175 (23.6%) |
| 20 to 24 Minutes | 3,386 (13.0%) | 3,152 (14.4%) |
| 25 to 29 Minutes | 1,260 (4.8%) | 902 (4.1%) |
| 30 to 34 Minutes | 1,921 (7.4%) | 1,608 (7.3%) |
| 35 to 39 Minutes | 271 (1.0%) | 215 (1.0%) |
| 40 to 44 Minutes | 431 (1.7%) | 322 (1.5%) |
| 45 to 59 Minutes | 539 (2.1%) | 656 (3.0%) |
| 60 to 89 Minutes | 424 (1.6%) | 336 (1.5%) |
| 90 or more Minutes | 434 (1.7%) | 414 (1.9%) |
Time of Departure to Work by Sex in Comanche County
The most frequent times of departure to work in Comanche County are 6:00 AM to 6:29 AM (3,836, 14.7%) for males and 7:30 AM to 7:59 AM (3,875, 17.7%) for females.
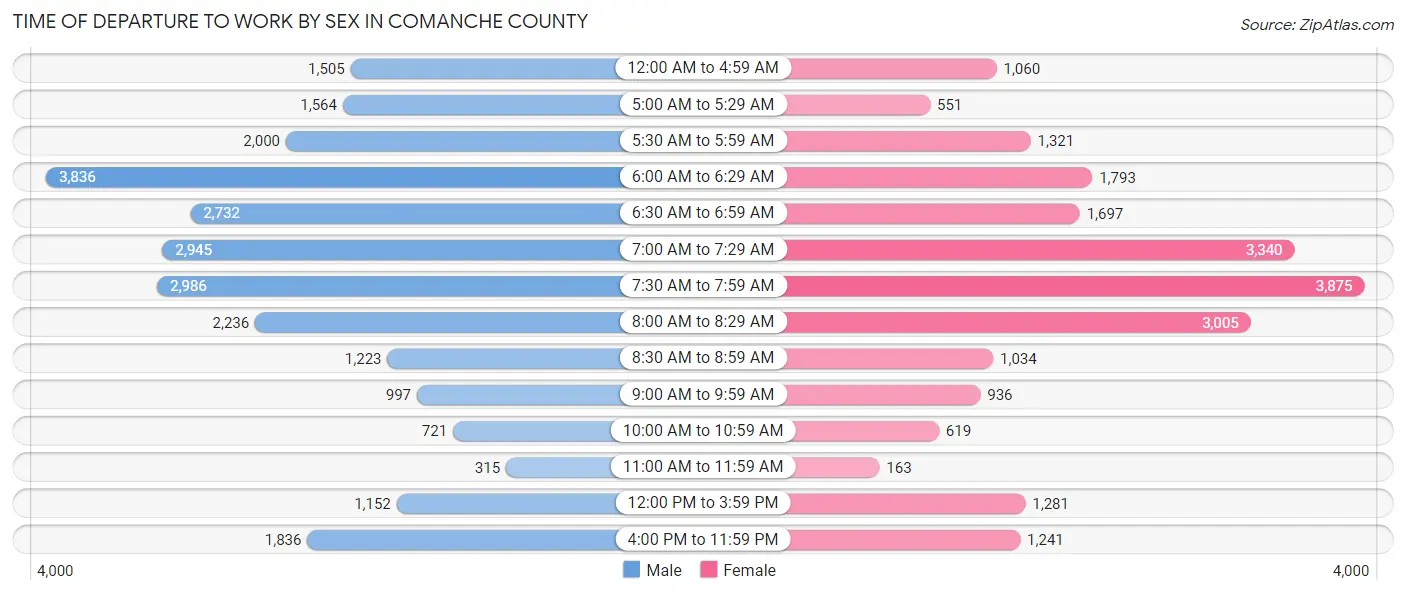
| Time of Departure | Male | Female |
| 12:00 AM to 4:59 AM | 1,505 (5.8%) | 1,060 (4.8%) |
| 5:00 AM to 5:29 AM | 1,564 (6.0%) | 551 (2.5%) |
| 5:30 AM to 5:59 AM | 2,000 (7.7%) | 1,321 (6.0%) |
| 6:00 AM to 6:29 AM | 3,836 (14.7%) | 1,793 (8.2%) |
| 6:30 AM to 6:59 AM | 2,732 (10.5%) | 1,697 (7.7%) |
| 7:00 AM to 7:29 AM | 2,945 (11.3%) | 3,340 (15.2%) |
| 7:30 AM to 7:59 AM | 2,986 (11.5%) | 3,875 (17.7%) |
| 8:00 AM to 8:29 AM | 2,236 (8.6%) | 3,005 (13.7%) |
| 8:30 AM to 8:59 AM | 1,223 (4.7%) | 1,034 (4.7%) |
| 9:00 AM to 9:59 AM | 997 (3.8%) | 936 (4.3%) |
| 10:00 AM to 10:59 AM | 721 (2.8%) | 619 (2.8%) |
| 11:00 AM to 11:59 AM | 315 (1.2%) | 163 (0.7%) |
| 12:00 PM to 3:59 PM | 1,152 (4.4%) | 1,281 (5.9%) |
| 4:00 PM to 11:59 PM | 1,836 (7.0%) | 1,241 (5.7%) |
| Total | 26,048 (100.0%) | 21,916 (100.0%) |
Housing Occupancy in Comanche County
Occupancy by Ownership in Comanche County
Of the total 44,429 dwellings in Comanche County, owner-occupied units account for 24,334 (54.8%), while renter-occupied units make up 20,095 (45.2%).
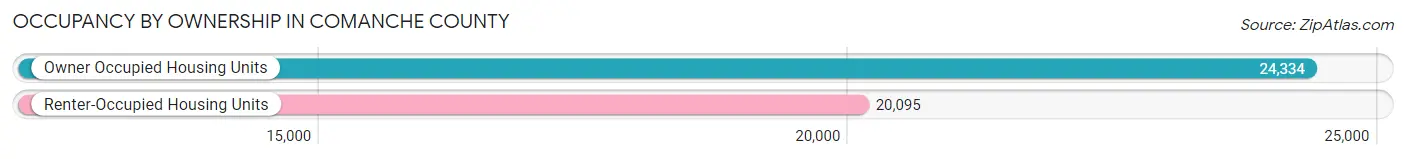
| Occupancy | # Housing Units | % Housing Units |
| Owner Occupied Housing Units | 24,334 | 54.8% |
| Renter-Occupied Housing Units | 20,095 | 45.2% |
| Total Occupied Housing Units | 44,429 | 100.0% |
Occupancy by Household Size in Comanche County
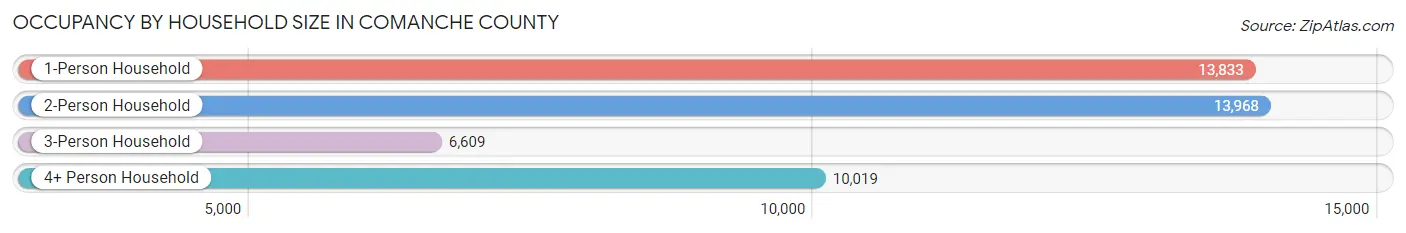
| Household Size | # Housing Units | % Housing Units |
| 1-Person Household | 13,833 | 31.1% |
| 2-Person Household | 13,968 | 31.4% |
| 3-Person Household | 6,609 | 14.9% |
| 4+ Person Household | 10,019 | 22.6% |
| Total Housing Units | 44,429 | 100.0% |
Occupancy by Ownership by Household Size in Comanche County
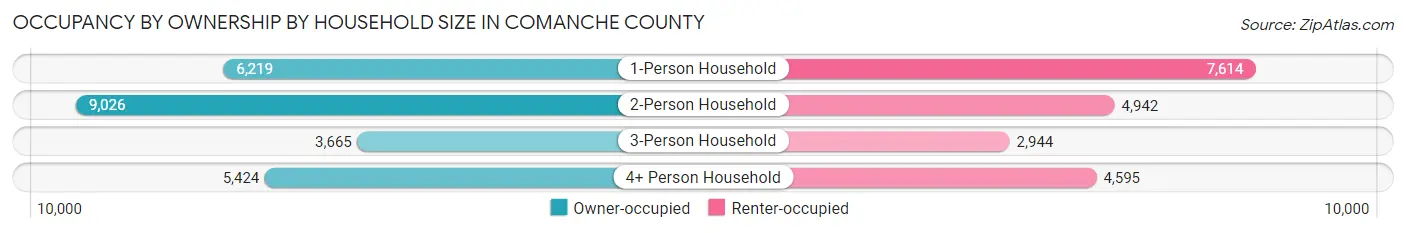
| Household Size | Owner-occupied | Renter-occupied |
| 1-Person Household | 6,219 (45.0%) | 7,614 (55.0%) |
| 2-Person Household | 9,026 (64.6%) | 4,942 (35.4%) |
| 3-Person Household | 3,665 (55.4%) | 2,944 (44.6%) |
| 4+ Person Household | 5,424 (54.1%) | 4,595 (45.9%) |
| Total Housing Units | 24,334 (54.8%) | 20,095 (45.2%) |
Occupancy by Educational Attainment in Comanche County
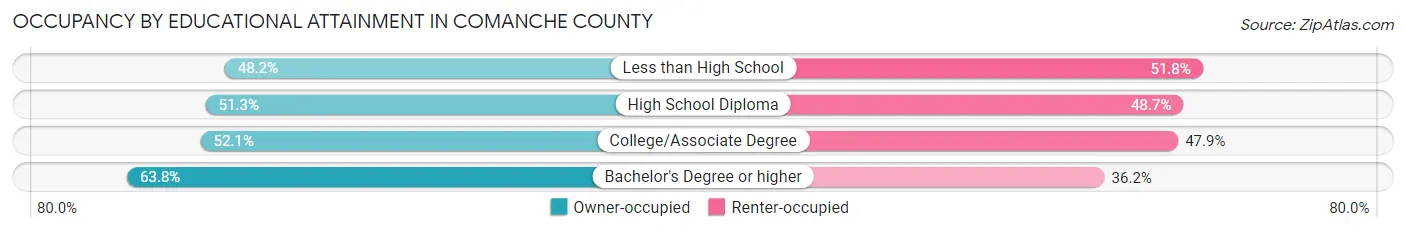
| Household Size | Owner-occupied | Renter-occupied |
| Less than High School | 1,648 (48.2%) | 1,768 (51.8%) |
| High School Diploma | 6,454 (51.3%) | 6,127 (48.7%) |
| College/Associate Degree | 8,469 (52.1%) | 7,788 (47.9%) |
| Bachelor's Degree or higher | 7,763 (63.8%) | 4,412 (36.2%) |
Occupancy by Age of Householder in Comanche County
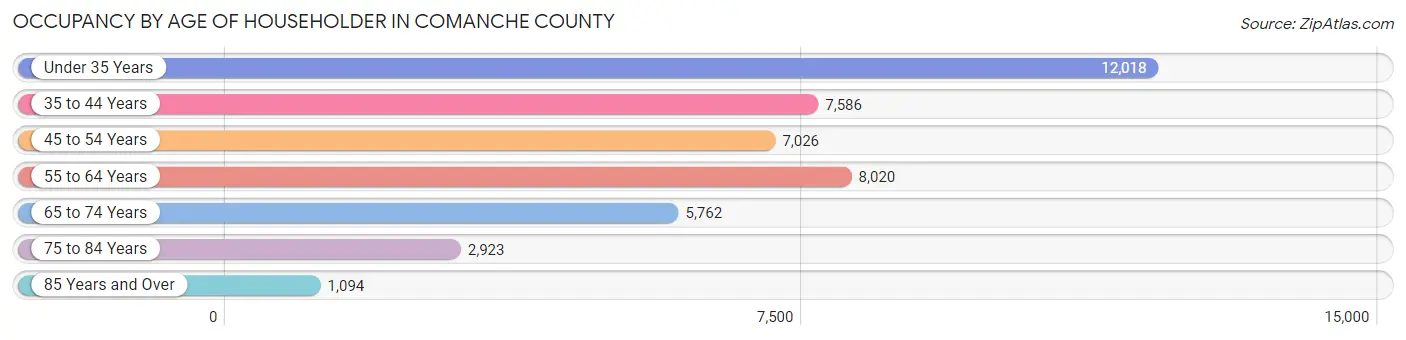
| Age Bracket | # Households | % Households |
| Under 35 Years | 12,018 | 27.1% |
| 35 to 44 Years | 7,586 | 17.1% |
| 45 to 54 Years | 7,026 | 15.8% |
| 55 to 64 Years | 8,020 | 18.0% |
| 65 to 74 Years | 5,762 | 13.0% |
| 75 to 84 Years | 2,923 | 6.6% |
| 85 Years and Over | 1,094 | 2.5% |
| Total | 44,429 | 100.0% |
Housing Finances in Comanche County
Median Income by Occupancy in Comanche County
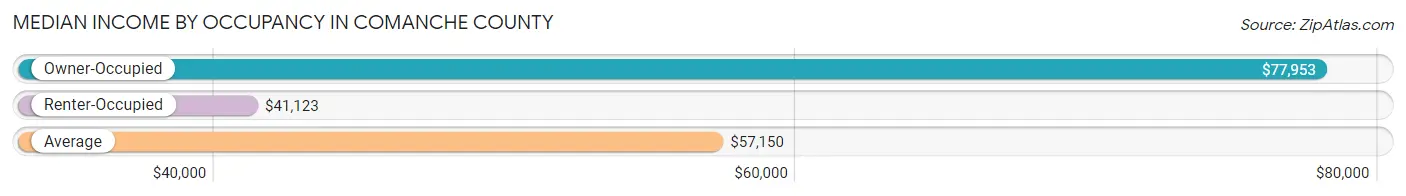
| Occupancy Type | # Households | Median Income |
| Owner-Occupied | 24,334 (54.8%) | $77,953 |
| Renter-Occupied | 20,095 (45.2%) | $41,123 |
| Average | 44,429 (100.0%) | $57,150 |
Occupancy by Householder Income Bracket in Comanche County
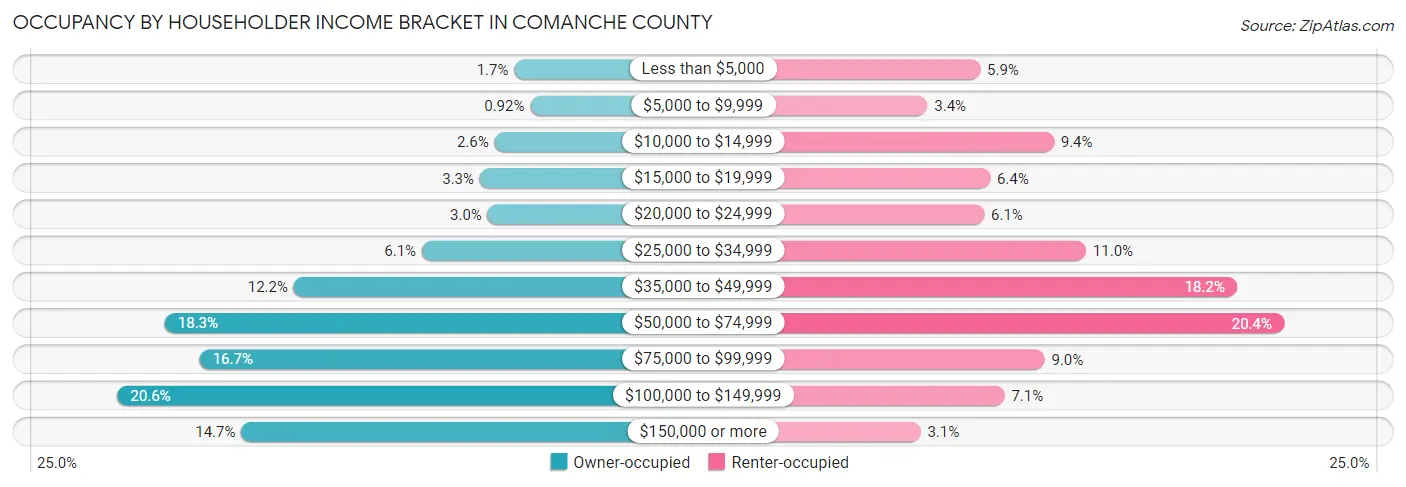
| Income Bracket | Owner-occupied | Renter-occupied |
| Less than $5,000 | 410 (1.7%) | 1,191 (5.9%) |
| $5,000 to $9,999 | 225 (0.9%) | 687 (3.4%) |
| $10,000 to $14,999 | 638 (2.6%) | 1,896 (9.4%) |
| $15,000 to $19,999 | 807 (3.3%) | 1,287 (6.4%) |
| $20,000 to $24,999 | 717 (2.9%) | 1,230 (6.1%) |
| $25,000 to $34,999 | 1,479 (6.1%) | 2,205 (11.0%) |
| $35,000 to $49,999 | 2,965 (12.2%) | 3,648 (18.1%) |
| $50,000 to $74,999 | 4,459 (18.3%) | 4,097 (20.4%) |
| $75,000 to $99,999 | 4,053 (16.7%) | 1,809 (9.0%) |
| $100,000 to $149,999 | 5,009 (20.6%) | 1,424 (7.1%) |
| $150,000 or more | 3,572 (14.7%) | 621 (3.1%) |
| Total | 24,334 (100.0%) | 20,095 (100.0%) |
Monthly Housing Cost Tiers in Comanche County
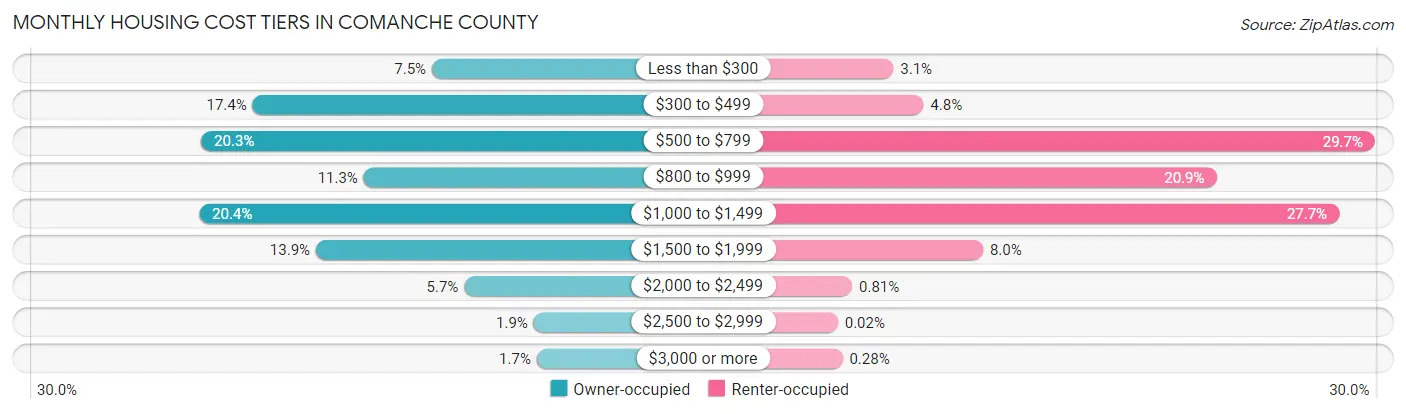
| Monthly Cost | Owner-occupied | Renter-occupied |
| Less than $300 | 1,826 (7.5%) | 620 (3.1%) |
| $300 to $499 | 4,236 (17.4%) | 955 (4.8%) |
| $500 to $799 | 4,927 (20.3%) | 5,965 (29.7%) |
| $800 to $999 | 2,742 (11.3%) | 4,205 (20.9%) |
| $1,000 to $1,499 | 4,954 (20.4%) | 5,566 (27.7%) |
| $1,500 to $1,999 | 3,384 (13.9%) | 1,616 (8.0%) |
| $2,000 to $2,499 | 1,392 (5.7%) | 163 (0.8%) |
| $2,500 to $2,999 | 457 (1.9%) | 5 (0.0%) |
| $3,000 or more | 416 (1.7%) | 56 (0.3%) |
| Total | 24,334 (100.0%) | 20,095 (100.0%) |
Physical Housing Characteristics in Comanche County
Housing Structures in Comanche County
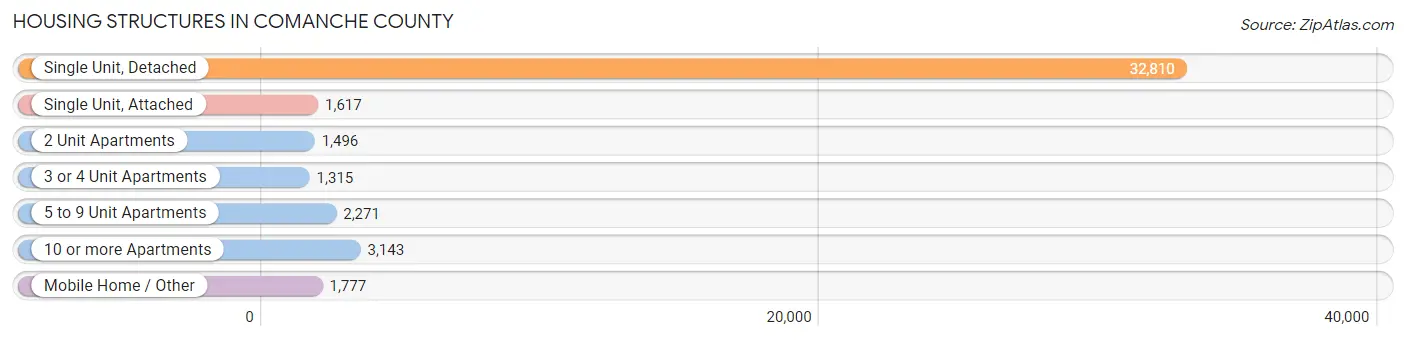
| Structure Type | # Housing Units | % Housing Units |
| Single Unit, Detached | 32,810 | 73.9% |
| Single Unit, Attached | 1,617 | 3.6% |
| 2 Unit Apartments | 1,496 | 3.4% |
| 3 or 4 Unit Apartments | 1,315 | 3.0% |
| 5 to 9 Unit Apartments | 2,271 | 5.1% |
| 10 or more Apartments | 3,143 | 7.1% |
| Mobile Home / Other | 1,777 | 4.0% |
| Total | 44,429 | 100.0% |
Housing Structures by Occupancy in Comanche County
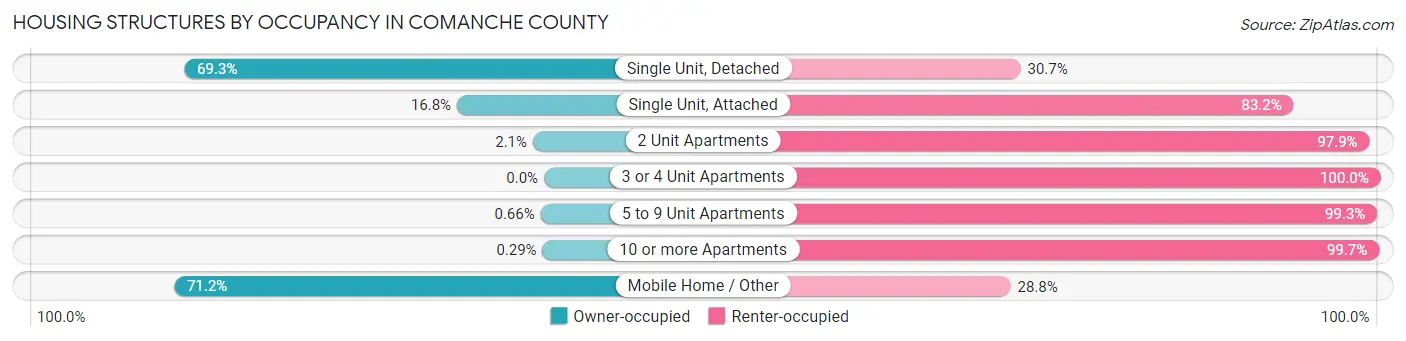
| Structure Type | Owner-occupied | Renter-occupied |
| Single Unit, Detached | 22,741 (69.3%) | 10,069 (30.7%) |
| Single Unit, Attached | 271 (16.8%) | 1,346 (83.2%) |
| 2 Unit Apartments | 32 (2.1%) | 1,464 (97.9%) |
| 3 or 4 Unit Apartments | 0 (0.0%) | 1,315 (100.0%) |
| 5 to 9 Unit Apartments | 15 (0.7%) | 2,256 (99.3%) |
| 10 or more Apartments | 9 (0.3%) | 3,134 (99.7%) |
| Mobile Home / Other | 1,266 (71.2%) | 511 (28.8%) |
| Total | 24,334 (54.8%) | 20,095 (45.2%) |
Housing Structures by Number of Rooms in Comanche County
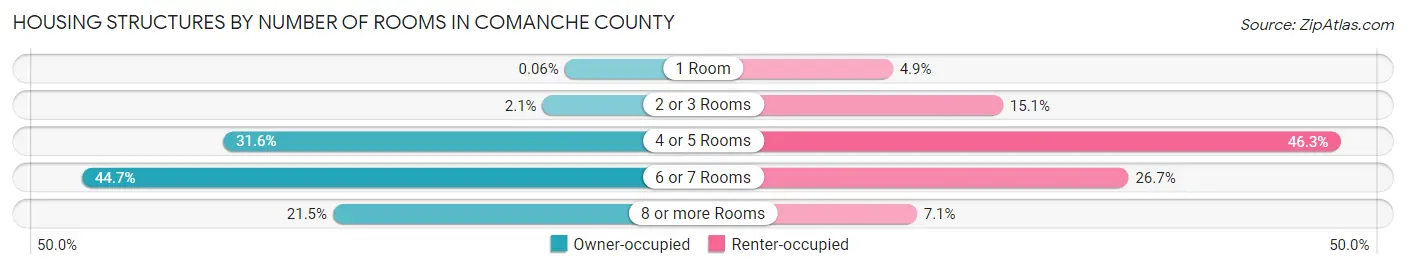
| Number of Rooms | Owner-occupied | Renter-occupied |
| 1 Room | 14 (0.1%) | 980 (4.9%) |
| 2 or 3 Rooms | 514 (2.1%) | 3,028 (15.1%) |
| 4 or 5 Rooms | 7,700 (31.6%) | 9,295 (46.3%) |
| 6 or 7 Rooms | 10,876 (44.7%) | 5,364 (26.7%) |
| 8 or more Rooms | 5,230 (21.5%) | 1,428 (7.1%) |
| Total | 24,334 (100.0%) | 20,095 (100.0%) |
Housing Structure by Heating Type in Comanche County
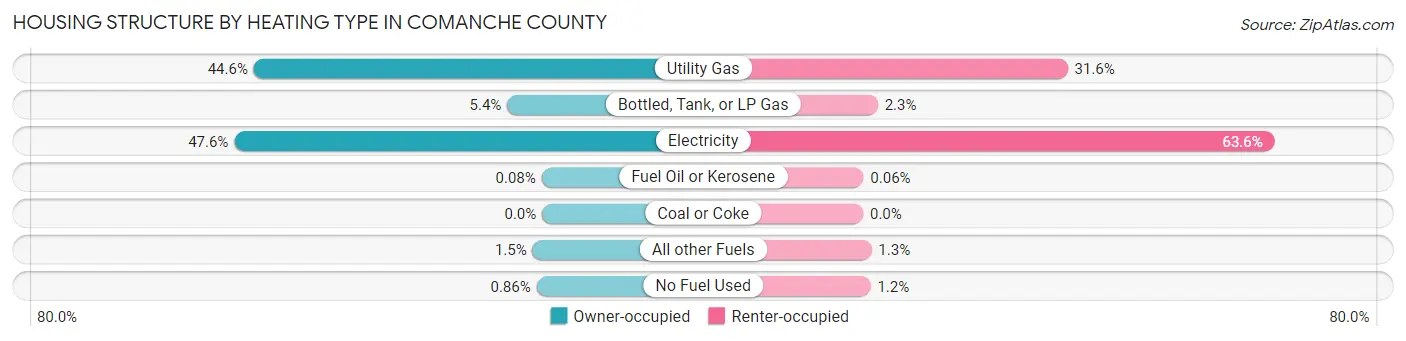
| Heating Type | Owner-occupied | Renter-occupied |
| Utility Gas | 10,849 (44.6%) | 6,352 (31.6%) |
| Bottled, Tank, or LP Gas | 1,315 (5.4%) | 457 (2.3%) |
| Electricity | 11,582 (47.6%) | 12,783 (63.6%) |
| Fuel Oil or Kerosene | 19 (0.1%) | 12 (0.1%) |
| Coal or Coke | 0 (0.0%) | 0 (0.0%) |
| All other Fuels | 360 (1.5%) | 260 (1.3%) |
| No Fuel Used | 209 (0.9%) | 231 (1.1%) |
| Total | 24,334 (100.0%) | 20,095 (100.0%) |
Household Vehicle Usage in Comanche County
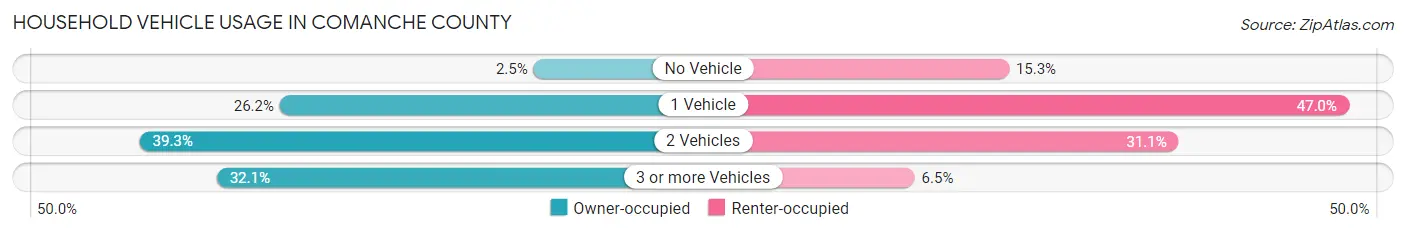
| Vehicles per Household | Owner-occupied | Renter-occupied |
| No Vehicle | 607 (2.5%) | 3,077 (15.3%) |
| 1 Vehicle | 6,371 (26.2%) | 9,453 (47.0%) |
| 2 Vehicles | 9,554 (39.3%) | 6,257 (31.1%) |
| 3 or more Vehicles | 7,802 (32.1%) | 1,308 (6.5%) |
| Total | 24,334 (100.0%) | 20,095 (100.0%) |
Real Estate & Mortgages in Comanche County
Real Estate and Mortgage Overview in Comanche County
| Characteristic | Without Mortgage | With Mortgage |
| Housing Units | 10,028 | 14,306 |
| Median Property Value | $120,500 | $157,200 |
| Median Household Income | $59,279 | $2,365 |
| Monthly Housing Costs | $457 | $368 |
| Real Estate Taxes | $1,060 | $1,785 |
Property Value by Mortgage Status in Comanche County
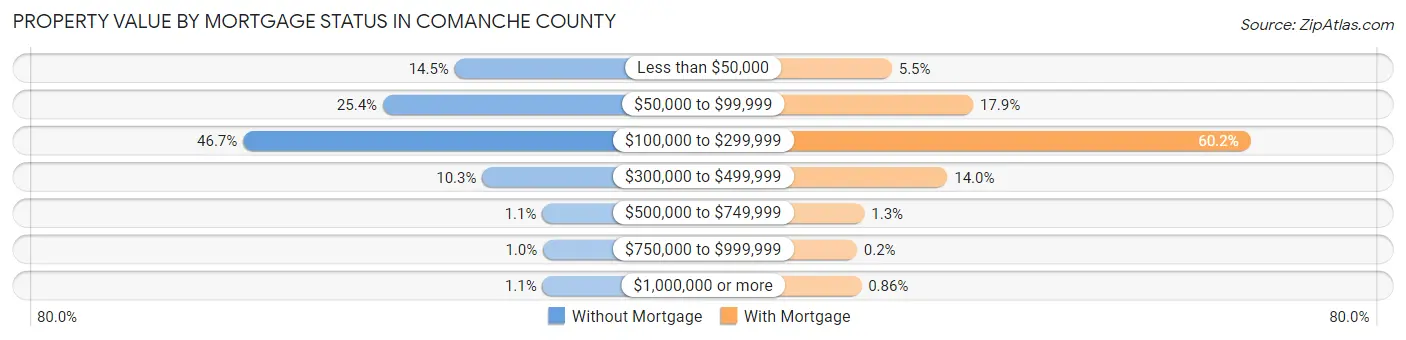
| Property Value | Without Mortgage | With Mortgage |
| Less than $50,000 | 1,450 (14.5%) | 789 (5.5%) |
| $50,000 to $99,999 | 2,547 (25.4%) | 2,562 (17.9%) |
| $100,000 to $299,999 | 4,683 (46.7%) | 8,611 (60.2%) |
| $300,000 to $499,999 | 1,029 (10.3%) | 2,000 (14.0%) |
| $500,000 to $749,999 | 111 (1.1%) | 192 (1.3%) |
| $750,000 to $999,999 | 100 (1.0%) | 29 (0.2%) |
| $1,000,000 or more | 108 (1.1%) | 123 (0.9%) |
| Total | 10,028 (100.0%) | 14,306 (100.0%) |
Household Income by Mortgage Status in Comanche County
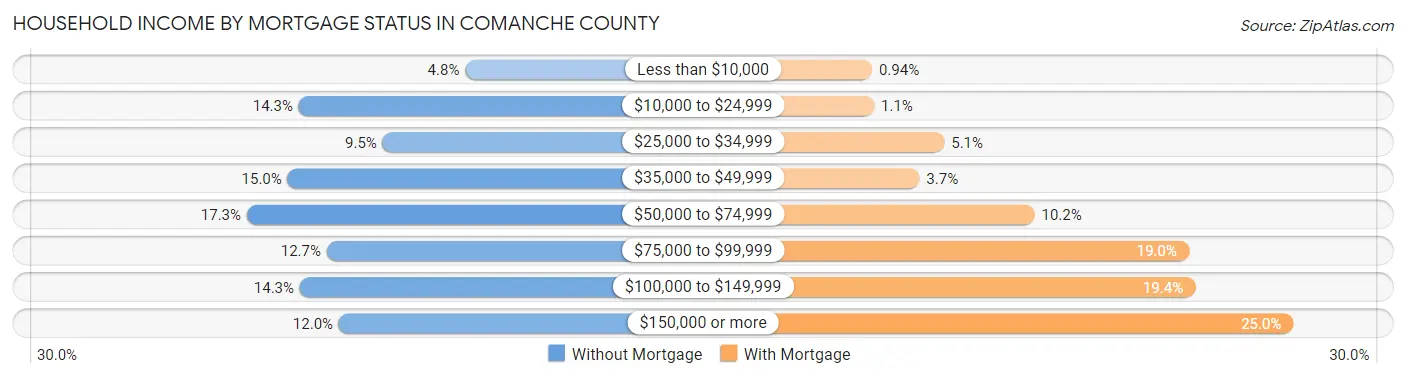
| Household Income | Without Mortgage | With Mortgage |
| Less than $10,000 | 483 (4.8%) | 134 (0.9%) |
| $10,000 to $24,999 | 1,437 (14.3%) | 152 (1.1%) |
| $25,000 to $34,999 | 957 (9.5%) | 725 (5.1%) |
| $35,000 to $49,999 | 1,501 (15.0%) | 522 (3.6%) |
| $50,000 to $74,999 | 1,735 (17.3%) | 1,464 (10.2%) |
| $75,000 to $99,999 | 1,277 (12.7%) | 2,724 (19.0%) |
| $100,000 to $149,999 | 1,431 (14.3%) | 2,776 (19.4%) |
| $150,000 or more | 1,207 (12.0%) | 3,578 (25.0%) |
| Total | 10,028 (100.0%) | 14,306 (100.0%) |
Property Value to Household Income Ratio in Comanche County
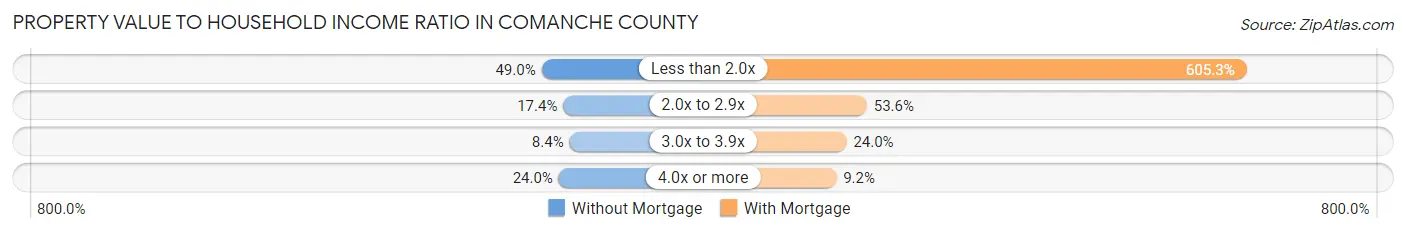
| Value-to-Income Ratio | Without Mortgage | With Mortgage |
| Less than 2.0x | 4,917 (49.0%) | 86,597 (605.3%) |
| 2.0x to 2.9x | 1,746 (17.4%) | 7,666 (53.6%) |
| 3.0x to 3.9x | 839 (8.4%) | 3,434 (24.0%) |
| 4.0x or more | 2,405 (24.0%) | 1,315 (9.2%) |
| Total | 10,028 (100.0%) | 14,306 (100.0%) |
Real Estate Taxes by Mortgage Status in Comanche County
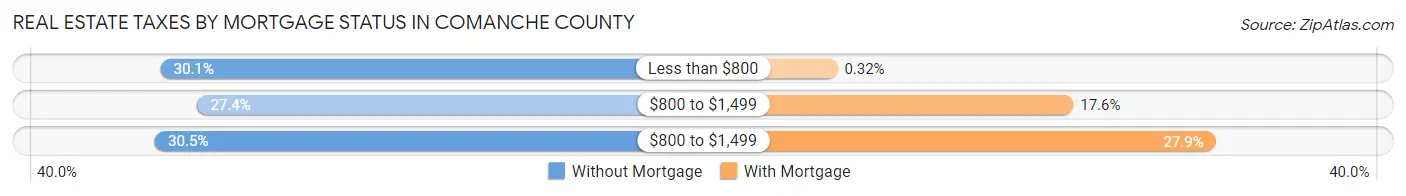
| Property Taxes | Without Mortgage | With Mortgage |
| Less than $800 | 3,014 (30.1%) | 46 (0.3%) |
| $800 to $1,499 | 2,745 (27.4%) | 2,510 (17.5%) |
| $800 to $1,499 | 3,055 (30.5%) | 3,997 (27.9%) |
| Total | 10,028 (100.0%) | 14,306 (100.0%) |
Health & Disability in Comanche County
Health Insurance Coverage by Age in Comanche County
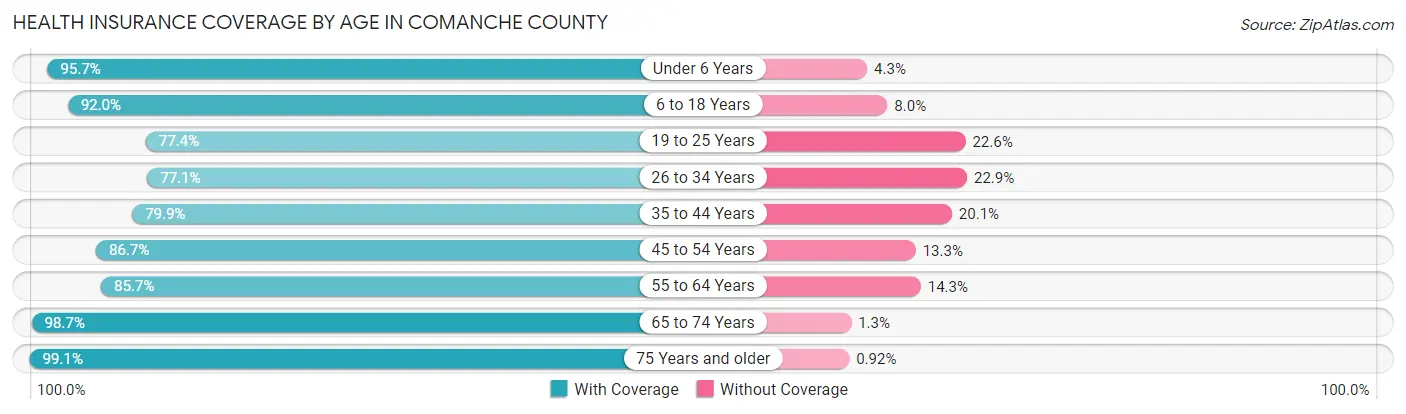
| Age Bracket | With Coverage | Without Coverage |
| Under 6 Years | 9,516 (95.7%) | 423 (4.3%) |
| 6 to 18 Years | 18,396 (92.0%) | 1,608 (8.0%) |
| 19 to 25 Years | 7,463 (77.4%) | 2,179 (22.6%) |
| 26 to 34 Years | 10,730 (77.1%) | 3,185 (22.9%) |
| 35 to 44 Years | 10,933 (79.9%) | 2,746 (20.1%) |
| 45 to 54 Years | 10,423 (86.7%) | 1,601 (13.3%) |
| 55 to 64 Years | 11,658 (85.7%) | 1,940 (14.3%) |
| 65 to 74 Years | 9,005 (98.7%) | 118 (1.3%) |
| 75 Years and older | 5,833 (99.1%) | 54 (0.9%) |
| Total | 93,957 (87.2%) | 13,854 (12.9%) |
Health Insurance Coverage by Citizenship Status in Comanche County
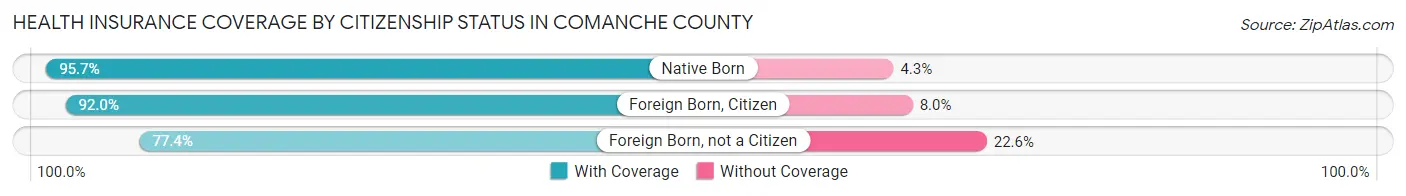
| Citizenship Status | With Coverage | Without Coverage |
| Native Born | 9,516 (95.7%) | 423 (4.3%) |
| Foreign Born, Citizen | 18,396 (92.0%) | 1,608 (8.0%) |
| Foreign Born, not a Citizen | 7,463 (77.4%) | 2,179 (22.6%) |
Health Insurance Coverage by Household Income in Comanche County
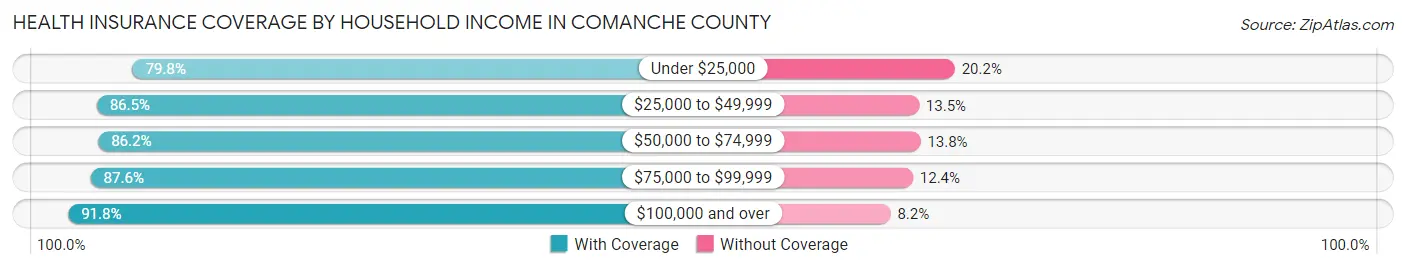
| Household Income | With Coverage | Without Coverage |
| Under $25,000 | 13,336 (79.8%) | 3,379 (20.2%) |
| $25,000 to $49,999 | 18,919 (86.5%) | 2,956 (13.5%) |
| $50,000 to $74,999 | 17,788 (86.2%) | 2,847 (13.8%) |
| $75,000 to $99,999 | 14,330 (87.6%) | 2,024 (12.4%) |
| $100,000 and over | 29,261 (91.8%) | 2,608 (8.2%) |
Public vs Private Health Insurance Coverage by Age in Comanche County
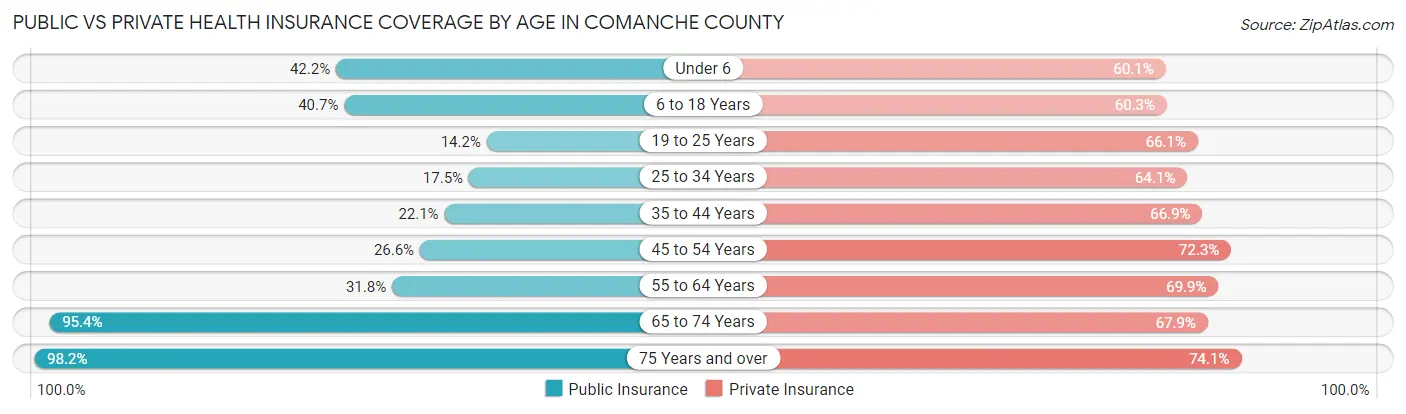
| Age Bracket | Public Insurance | Private Insurance |
| Under 6 | 4,194 (42.2%) | 5,973 (60.1%) |
| 6 to 18 Years | 8,135 (40.7%) | 12,068 (60.3%) |
| 19 to 25 Years | 1,371 (14.2%) | 6,370 (66.1%) |
| 25 to 34 Years | 2,439 (17.5%) | 8,919 (64.1%) |
| 35 to 44 Years | 3,019 (22.1%) | 9,156 (66.9%) |
| 45 to 54 Years | 3,201 (26.6%) | 8,690 (72.3%) |
| 55 to 64 Years | 4,325 (31.8%) | 9,504 (69.9%) |
| 65 to 74 Years | 8,706 (95.4%) | 6,197 (67.9%) |
| 75 Years and over | 5,783 (98.2%) | 4,364 (74.1%) |
| Total | 41,173 (38.2%) | 71,241 (66.1%) |
Disability Status by Sex by Age in Comanche County
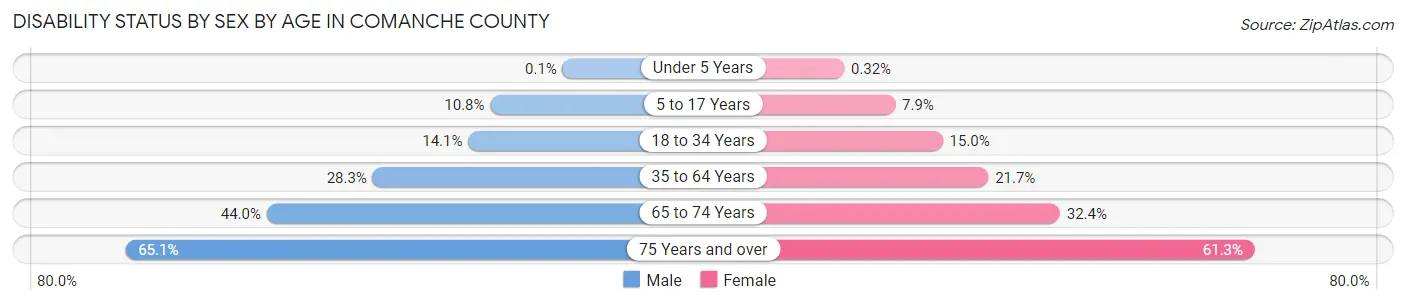
| Age Bracket | Male | Female |
| Under 5 Years | 4 (0.1%) | 13 (0.3%) |
| 5 to 17 Years | 1,120 (10.8%) | 802 (7.9%) |
| 18 to 34 Years | 1,616 (14.1%) | 2,006 (15.0%) |
| 35 to 64 Years | 5,327 (28.3%) | 4,452 (21.7%) |
| 65 to 74 Years | 1,891 (44.0%) | 1,563 (32.4%) |
| 75 Years and over | 1,547 (65.0%) | 2,152 (61.3%) |
Disability Class by Sex by Age in Comanche County
Disability Class: Hearing Difficulty
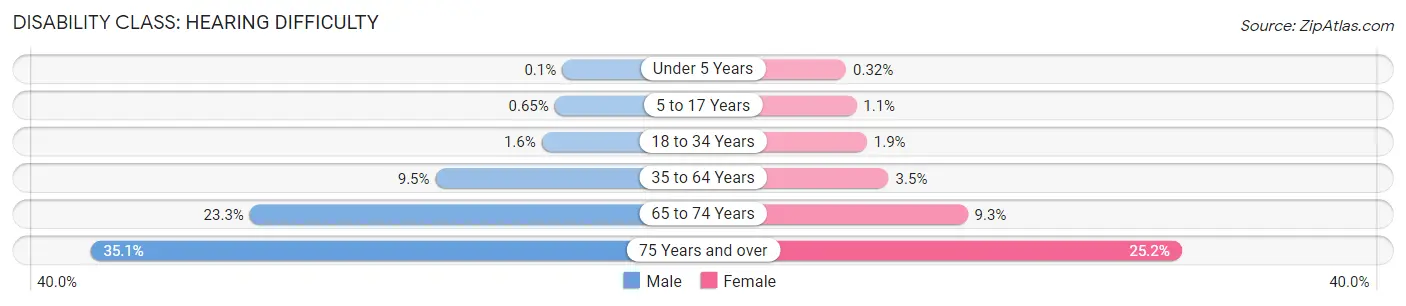
| Age Bracket | Male | Female |
| Under 5 Years | 4 (0.1%) | 13 (0.3%) |
| 5 to 17 Years | 67 (0.6%) | 110 (1.1%) |
| 18 to 34 Years | 185 (1.6%) | 250 (1.9%) |
| 35 to 64 Years | 1,787 (9.5%) | 713 (3.5%) |
| 65 to 74 Years | 1,000 (23.3%) | 451 (9.3%) |
| 75 Years and over | 835 (35.1%) | 885 (25.2%) |
Disability Class: Vision Difficulty
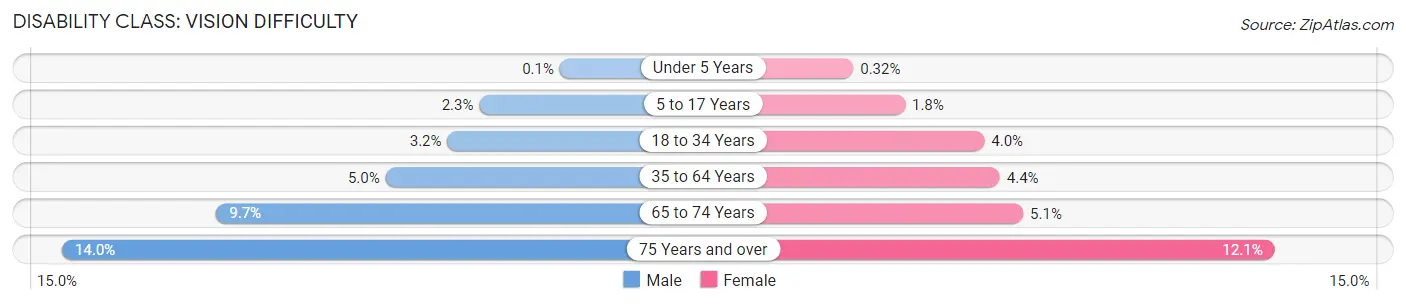
| Age Bracket | Male | Female |
| Under 5 Years | 4 (0.1%) | 13 (0.3%) |
| 5 to 17 Years | 242 (2.3%) | 179 (1.8%) |
| 18 to 34 Years | 370 (3.2%) | 532 (4.0%) |
| 35 to 64 Years | 932 (5.0%) | 901 (4.4%) |
| 65 to 74 Years | 415 (9.7%) | 244 (5.1%) |
| 75 Years and over | 332 (14.0%) | 423 (12.0%) |
Disability Class: Cognitive Difficulty
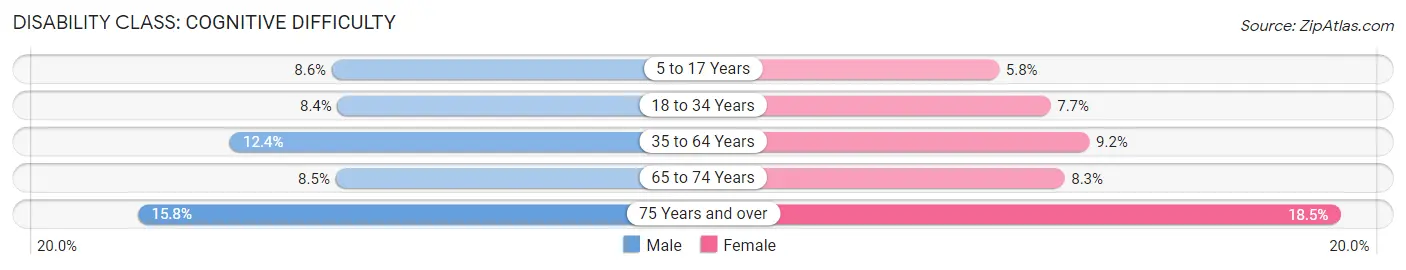
| Age Bracket | Male | Female |
| 5 to 17 Years | 888 (8.6%) | 591 (5.8%) |
| 18 to 34 Years | 959 (8.4%) | 1,038 (7.7%) |
| 35 to 64 Years | 2,328 (12.4%) | 1,880 (9.2%) |
| 65 to 74 Years | 363 (8.5%) | 399 (8.3%) |
| 75 Years and over | 375 (15.8%) | 649 (18.5%) |
Disability Class: Ambulatory Difficulty
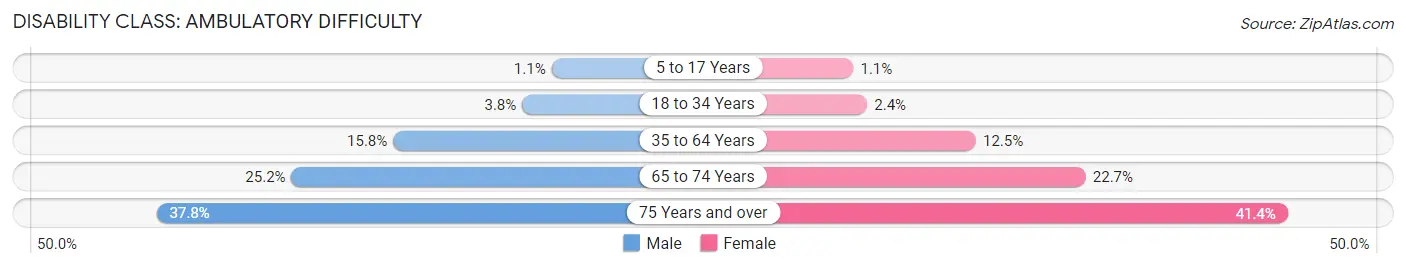
| Age Bracket | Male | Female |
| 5 to 17 Years | 114 (1.1%) | 111 (1.1%) |
| 18 to 34 Years | 438 (3.8%) | 318 (2.4%) |
| 35 to 64 Years | 2,973 (15.8%) | 2,552 (12.5%) |
| 65 to 74 Years | 1,084 (25.2%) | 1,094 (22.7%) |
| 75 Years and over | 898 (37.8%) | 1,452 (41.4%) |
Disability Class: Self-Care Difficulty
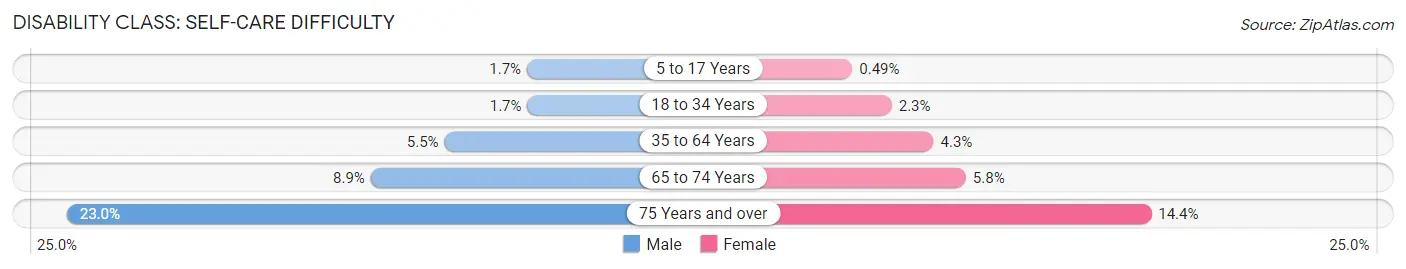
| Age Bracket | Male | Female |
| 5 to 17 Years | 175 (1.7%) | 50 (0.5%) |
| 18 to 34 Years | 191 (1.7%) | 311 (2.3%) |
| 35 to 64 Years | 1,039 (5.5%) | 873 (4.3%) |
| 65 to 74 Years | 384 (8.9%) | 278 (5.8%) |
| 75 Years and over | 548 (23.0%) | 504 (14.4%) |
Technology Access in Comanche County
Computing Device Access in Comanche County
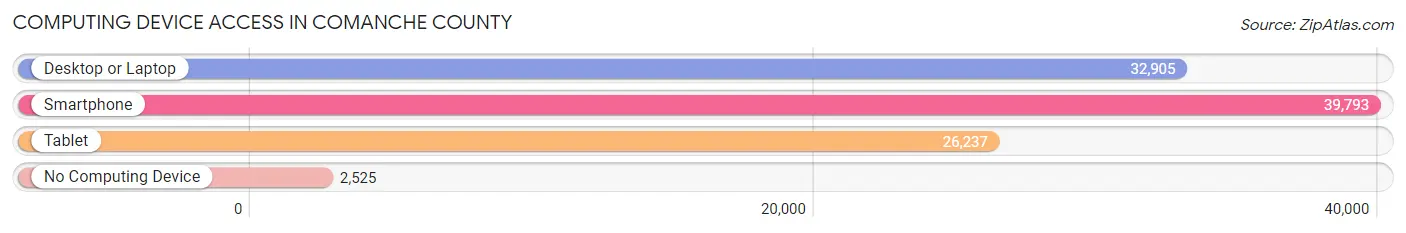
| Device Type | # Households | % Households |
| Desktop or Laptop | 32,905 | 74.1% |
| Smartphone | 39,793 | 89.6% |
| Tablet | 26,237 | 59.1% |
| No Computing Device | 2,525 | 5.7% |
| Total | 44,429 | 100.0% |
Internet Access in Comanche County
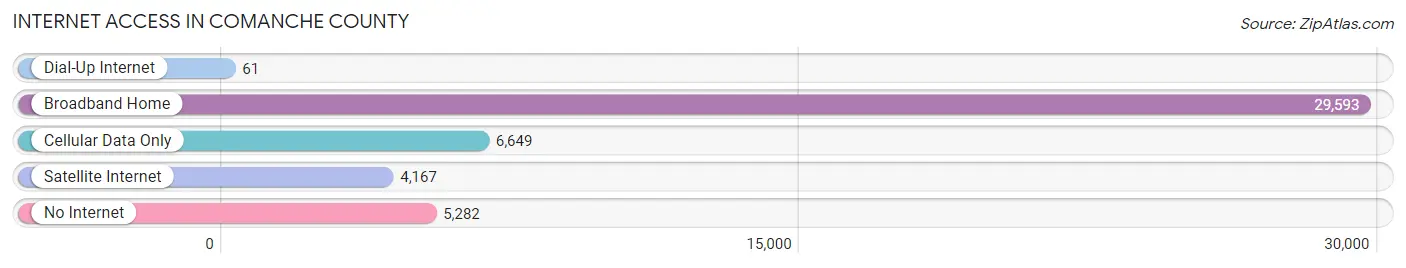
| Internet Type | # Households | % Households |
| Dial-Up Internet | 61 | 0.1% |
| Broadband Home | 29,593 | 66.6% |
| Cellular Data Only | 6,649 | 15.0% |
| Satellite Internet | 4,167 | 9.4% |
| No Internet | 5,282 | 11.9% |
| Total | 44,429 | 100.0% |
Comanche County Summary
Comanche County is located in southwestern Oklahoma and is part of the Lawton Metropolitan Statistical Area. The county was created in 1901 and named after the Comanche Native American tribe. As of the 2010 census, the population was 124,098, making it the fourth most populous county in Oklahoma.
Geography
Comanche County covers an area of 1,091 square miles and is located in the southwestern part of the state. It is bordered by Cotton County to the north, Stephens County to the east, Jefferson County to the south, and Tillman County to the west. The county is mostly flat with rolling hills in the east and south. The Washita River runs through the county and is a major tributary of the Red River. The county also contains several small lakes, including Lake Ellsworth and Lake Lawtonka.
Demographics
As of the 2010 census, the population of Comanche County was 124,098, making it the fourth most populous county in Oklahoma. The population was spread out with 24.3% under the age of 18, 10.2% from 18 to 24, 28.2% from 25 to 44, 22.7% from 45 to 64, and 14.6% who were 65 years of age or older. The median age was 35.3 years. The racial makeup of the county was 68.2% White, 8.3% African American, 11.2% Native American, 1.2% Asian, 0.1% Pacific Islander, 5.2% from other races, and 6.0% from two or more races. Hispanic or Latino of any race were 11.7% of the population.
Economy
Comanche County is home to several major industries, including oil and gas, agriculture, and manufacturing. The county is the second largest producer of oil and gas in the state, with over 1,000 active wells. Agriculture is also a major industry in the county, with wheat, cotton, and hay being the main crops. Manufacturing is also a major industry in the county, with companies such as Goodyear Tire and Rubber Company, Halliburton, and Lockheed Martin having major operations in the area.
The county also has a strong tourism industry, with attractions such as the Comanche National Museum and Cultural Center, the Comanche National Grasslands, and the Wichita Mountains Wildlife Refuge. The county also has several golf courses, parks, and other recreational areas.
Conclusion
Comanche County is a vibrant and diverse county located in southwestern Oklahoma. It is home to a variety of industries, including oil and gas, agriculture, and manufacturing. The county also has a strong tourism industry, with attractions such as the Comanche National Museum and Cultural Center, the Comanche National Grasslands, and the Wichita Mountains Wildlife Refuge. As of the 2010 census, the population of Comanche County was 124,098, making it the fourth most populous county in Oklahoma.
Common Questions
What is the Total Population of Comanche County?
Total Population of Comanche County is 121,777.
What is the Total Male Population of Comanche County?
Total Male Population of Comanche County is 63,246.
What is the Total Female Population of Comanche County?
Total Female Population of Comanche County is 58,531.
What is the Ratio of Males per 100 Females in Comanche County?
There are 108.06 Males per 100 Females in Comanche County.
What is the Ratio of Females per 100 Males in Comanche County?
There are 92.54 Females per 100 Males in Comanche County.
What is the Median Population Age in Comanche County?
Median Population Age in Comanche County is 33.5 Years.
What is the Average Family Size in Comanche County
Average Family Size in Comanche County is 3.2 People.
What is the Average Household Size in Comanche County
Average Household Size in Comanche County is 2.5 People.
What is Per Capita Income in Comanche County?
Per Capita income in Comanche County is $29,980.
What is the Median Family Income in Comanche County?
Median Family Income in Comanche County is $70,878.
What is the Median Household income in Comanche County?
Median Household Income in Comanche County is $57,150.
What is Income or Wage Gap in Comanche County?
Income or Wage Gap in Comanche County is 22.3%.
Women in Comanche County earn 77.7 cents for every dollar earned by a man.
What is Family Income Deficit in Comanche County?
Family Income Deficit in Comanche County is $11,092.
Families that are below poverty line in Comanche County earn $11,092 less on average than the poverty threshold level.
What is Inequality or Gini Index in Comanche County?
Inequality or Gini Index in Comanche County is 0.45.
How Large is the Labor Force in Comanche County?
There are 58,427 People in the Labor Forcein in Comanche County.
What is the Percentage of People in the Labor Force in Comanche County?
60.9% of People are in the Labor Force in Comanche County.
What is the Unemployment Rate in Comanche County?
Unemployment Rate in Comanche County is 6.6%.